Enhancing The Principal–School Counselor Relationship: A ...

Louisiana State UniversityLSU Digital Commons
LSU Historical Dissertations and Theses Graduate School
1998
An Exploration of the Relationship BetweenPrincipal Leadership Style and Student AcademicAchievement in the Philippines.Mary Sylvette tanjuan GunigundoLouisiana State University and Agricultural & Mechanical College
Follow this and additional works at: https://digitalcommons.lsu.edu/gradschool_disstheses
This Dissertation is brought to you for free and open access by the Graduate School at LSU Digital Commons. It has been accepted for inclusion inLSU Historical Dissertations and Theses by an authorized administrator of LSU Digital Commons. For more information, please [email protected].
Recommended CitationGunigundo, Mary Sylvette tanjuan, "An Exploration of the Relationship Between Principal Leadership Style and Student AcademicAchievement in the Philippines." (1998). LSU Historical Dissertations and Theses. 6734.https://digitalcommons.lsu.edu/gradschool_disstheses/6734

INFORMATION TO USERS
This manuscript has been reproduced from the microfihn master. UMI
films the text directly from the original or copy submitted. Thus, some
thesis and dissertation copies are in typewriter face, while others may be
from any type of computer printer.
The quality of this reproduction is dependent upon the quality of the
copy submitted. Broken or indistinct print, colored or poor quality
illustrations and photographs, print bleedthrough, substandard margins,
and improper alignment can adversely affect reproduction.
In the unlikely event that the author did not send UMI a complete
manuscript and there are missing pages, these will be noted. Also, if
unauthorized copyright material had to be removed, a note will indicate
the deletion.
Oversize materials (e.g., maps, drawings, charts) are reproduced by
sectioning the original, beginning at the upper left-hand comer and
continuing from left to right in equal sections with small overlaps. Each
original is also photographed in one exposure and is included in reduced
form at the back o f the book.
Photographs included in the original manuscript have been reproduced
xerographically in this copy. Higher quality 6” x 9” black and white
photographic prints are available for any photographs or illustrations
appearing in this copy for an additional charge. Contact UMI directly to
order.
UMIA Bell & Howell Information Company
300 North Zeeb Road, Arm Arbor MI 48106-1346 USA 313/761-4700 800/521-0600
Reproduced with permission of the copyright owner. Further reproduction prohibited without permission.

Reproduced with permission of the copyright owner. Further reproduction prohibited without permission.

NOTE TO USERS
The original manuscript received by UMI contains indistinct, slanted and or light print. All efforts were made to acquire the highest quality manuscript from the author or school.
Microfilmed as received.
This reproduction is the best copy available
UMI
Reproduced with permission of the copyright owner. Further reproduction prohibited without permission.

Reproduced with permission of the copyright owner. Further reproduction prohibited without permission.

AN EXPLORATION OF THE RELATIONSHIP BETWEEN PRINCIPAL LEADERSHIP STYLE AND
STUDENT ACADEMIC ACHIEVEMENT IN THE PHILIPPINES
A Dissertation
Submitted to the Graduate Faculty of the Louisiana State University and
Agricultural and Mechanical College in partial fulfillment of the
requirements for the degree of Doctor of Philosophy
in
The Department of Educational Leadership, Research, and Counseling
byMary Sylvette Tanjuan Gunigundo
B.S.Ed., University of the Philippines-Diliman, 1989 M.Ed., Northeast Louisiana University, 1991 Ed.S., Northeast Louisiana University, 1992
August 1998
Reproduced with permission of the copyright owner. Further reproduction prohibited without permission.

XJMl N u m b er: 9 9 0 2 6 3 6
UMI Microform 9902636 Copyright 1998, by UMI Company. All rights reserved.
This microform edition is protected against unauthorized copying under Title 17, United States Code.
UMI300 North Zeeb Road Ann Arbor, MI 48103
Reproduced with permission of the copyright owner. Further reproduction prohibited without permission.

DEDICATION
I dedicate this dissertation firstly, to God Almighty. He has been the source of
my strength and my comfort. When I felt like giving up. He was there to lift me up.
The Lord used this dissertation to make me know and trust Him more. He is very kind,
merciful, loving, and faithful. I owe everything to the Lord.
And secondly, to my parents, Sylvia and Magtanggol, and to my siblings, Marie
Sylvie Easter, Magtanggol H, and Mercy Grace. They never lost faith in me. They are
my prayer warriors. Everyday, they petitioned God to let me finish my PhD at LSU. I
am so happy that God heard their prayers and answered in the affirmative. I thank God
for my family. I love them very much.
I wish to share a song to encourage other students who are writing their
dissertations. The song is entitled “I Lift My Eyes Up,” based on Psalm 121. Never
give up for there is hope in the Lord.
lift my eyes up, unto the mountains. Where does my help come from?My help comes from You, maker of heaven, creator of the earth.
Oh how I need you Lord. You are my only hope. You are my only prayer.So I will wait for you, to come and rescue me, come and give me life.”
(Chapel on the Campus, 1998)
II
Reproduced with permission of the copyright owner. Further reproduction prohibited without permission.
ACKNOWLEDGMENTS
I would have not finished this dissertation without the help of so many people
and I thank God for them. First. I wish to acknowledge with deep gratitude my chair.
Dr. Richard Fossey, for his invaluable help and patience in seeing this dissertation
through. His encouraging words increased my morale and self-esteem. His open-door
policy in dealing with me really made a big difference with respect to my motivation in
finishing this dissertation.
Second, I wish to thank Dr. Eugene Kennedy who served as my research
methodologist. He is the reason why I got back on track in writing this dissertation. If
Dr. Fossey sustained my motivation. Dr. Kennedy was the one who brought back my
motivation. Every time I try to hide from him, God made sure I see him in unexpected
places, like Wal-Mart! Surely, God has a sense of humor.
Third, many thanks to my other two committee members. Dr. William Davis
and Dr. Janice Stuhlmann. Their smiles and their support gave me an extra morale
boost. They really believed in me. I feel so humbled because of this.
Fourth, thanks to the faculty and staff of the Department of Educational
Leadership, Research, and Counseling (ELRC) for contributing to my education at
LSU. In particular, thanks to; Dr. Terry Geske for never failing to inquire about my
well-being every time we see each other; Dr. Chad Ellett for believing I could present a
paper at the SERA conference in January 1998 all by myself; and Melonee for making
me laugh all the time. Unbeknownst to them, their friendliness made my stay at LSU
enjoyable.
iii
Reproduced with permission of the copyright owner. Further reproduction prohibited without permission.

Fifth, special thanks to my relatives and friends for showering me with love and
kindness: Auntie Flor - who is my mother’s sister and who is also my godmother. Ever
since 1 arrived in the United States, she calls me at least once a week from New York.
And so every time I hear my phone rings on a Friday or Saturday morning, I know it’s
my Auntie Flor; Auntie Yumi - who is my father’s sister. She lives in Monroe,
Louisiana. She has such an unpredictable attitude that I always get unannounced visits
from her; Karen and Ronnie Richard - who are my American parents. They treated me
like their own daughter. They welcomed me to their homes and hearts. I witnessed the
growth (literally) of their children, Ross and Scott. What a joy to share my life with
them; my friends from the Chapel on the Campus - David and Susan, Alicia, Aileen,
Katie, Punkin, Cindy and Steve, Mary Linda and Jonathan, and all the international
students 1 have met at the Chapel. Each of them helped me grow spiritually. They
prayed for me constantly. They witnessed my progress in writing my dissertation,
starting from Chapter 1 to Chapter 5; Aruna for her unselfish help with my statistical
analyses; Jeong Suk for her companionship; and my prayer group who meets once a
week so we could share the word of God and also encourage one another - James and
Sally, thank you for your prayers.
And last, I also wish to thank the superintendents, the principals, and the
teachers who participated in this study for their expressed and unexpressed cooperation
in the completion of my dissertation.
Thank you Lord for these people.
IV
Reproduced with permission of the copyright owner. Further reproduction prohibited without permission.
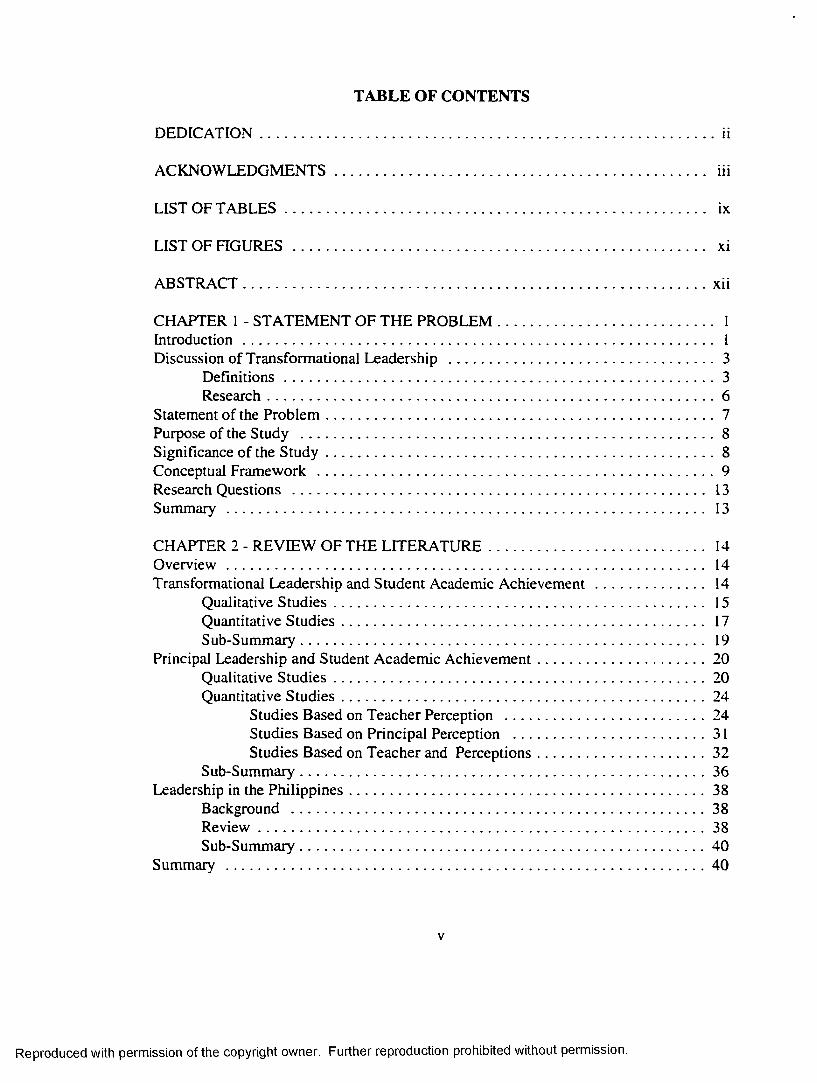
TABLE OF CONTENTS
DEDICATION......................................................................................................................... ii
ACKNOWLEDGMENTS................................................................................................. iii
LIST OF TA BLES............................................................................................................... ix
LIST OF FIGURES ............................................................................................................ xi
ABSTRACT........................................................................................................................... xii
CHAPTER 1 - STATEMENT OF THE PROBLEM........................................................ IIntroduction ............................................................................................................................ IDiscussion of Transformational Leadership ........................................................................3
D efinitions................................................................................................................... 3Research........................................................................................................................6
Statement of the Problem ........................................................................................................ 7Purpose of the Study ...............................................................................................................8Significance of the S tu d y ........................................................................................................ 8Conceptual Framework .......................................................................................................... 9Research Questions ............................................................................................................ 13Summary .............................................................................................................................. 13
CHAPTER 2 - REVIEW OF THE LITERATURE........................................................ 14O verview .............................................................................................................................. 14Transformational Leadership and Student Academic A chievem ent............................ 14
Qualitative S tud ies................................................................................................. 15Quantitative S tud ies............................................................................................... 17Sub-Summary.......................................................................................................... 19
Principal Leadership and Student Academic Achievement..............................................20Qualitative S tu d ies....................................................................................................20Quantitative S tud ies..................................................................................................24
Studies Based on Teacher Perception ...................................................... 24Studies Based on Principal Perception .................................................... 31Studies Based on Teacher and Perceptions..............................................32
Sub-Summary............................................................................................................ 36Leadership in the Philippines............................................................................................... 38
Background ...............................................................................................................38R eview ....................................................................................................................... 38Sub-Summary............................................................................................................ 40
Summary ................................................................................................................................40
Reproduced with permission of the copyright owner. Further reproduction prohibited without permission.

CHAPTER 3 - METHODOLOGY .................................................................................. 42Overview ............................................................................................................................. 42Sampling Procedures........................................................................................................... 42
Setting - The Philippines........................................................................................42Background ............................................................................................... 42Selection P ro cess ........................................................................................45Sub-Summary.............................................................................................. 47
S a m p le ......................................................................................................................47Background ............................................................................................... 47Selection P ro cess ........................................................................................48Final Sample ............................................................................................. 50
Variables ..............................................................................................................................50Instrumentation .................................................................................................................. 51
Revised Multi factor Leadership Questionnaire - 5 R .......................................... 51Background ............................................................................................... 51Reliability and Validity ............................................................................52Pilot S tu d y ...................................................................................................53
The National Elementary Assessment T e s t ..........................................................54Demographic Information Sheet ..........................................................................55
Data Collection Procedures.................................................................................................55Background ............................................................................................................ 55Principal Leadership Style and Demographic Information .............................. 55Student Academic Achievement and Student Dem ographics............................56
Data Analyses .....................................................................................................................57Background ............................................................................................................57Descriptive Statistics ............................................................................................. 57MANOVA and Paired Samples T-Tests .............................................................58Multiple Linear Regression .................................................................................. 59Supplemental Statistical A nalyses....................................................................... 59
Pearson-Product Moment Correlation....................................................59Cronbach Coefficient Alpha ................................................................... 60
Summary ............................................................................................................................. 60
CHAPTER 4 - RESULTS ................................................................................................. 62Overview ............................................................................................................................. 62Response Rate .................................................................................................................... 62Profile of Respondents........................................................................................................63Profile of Schools................................................................................................................ 65Preliminary Analysis ..........................................................................................................68
Cronbach’s Coefficient A lp h a ..............................................................................68Background ............................................................................................... 68R esu lts ........................................................................................................68
VI
Reproduced with permission of the copyright owner. Further reproduction prohibited without permission.

Major Statistical A nalyses....................................................................................................69Descriptive S ta tis tics ............................................................................................... 69
Background ................................................................................................. 69Results .......................................................................................................... 70
M A N O V A .................................................................................................................71Paired-Samples T -T est............................................................................................. 71
Background ..................................................................................................71Result 1 72Result 2 ........................................................................................................ 73Result 3 73
Multiple Linear Regression .....................................................................................74Background ..................................................................................................74Results: Model 1 .........................................................................................75Results: Model 2 .........................................................................................77Results: Model 3 .........................................................................................80
Tests of the Research Questions .........................................................................................82Research Question 1 ................................................................................................82Research Question 2 ............................................................................................... 82Research Question 3 ................................................................................................83Research Question 4 ............................................................................................... 84
Summary ................................................................................................................................ 84
CHAPTER 5 - SUMMARY AND DISCUSSION ...........................................................85Overview ................................................................................................................................ 85Interpretation of Research Question Results ......................................................................86
Research Question 1 ............................................................................................... 86Research Question 2 ............................................................................................... 87Research Questions 3 and 4 .....................................................................................88
Cultural Differences.....................................................................................89Other Sets of Variables .............................................................................. 92Small Sample Size .................................................................................... 93Use of Quantitative Design ........................................................................93
Limitations of the S tudy........................................................................................................ 94Summary and Recommendations.........................................................................................95
REFERENCES ..................................................................................................................... 97
APPENDIX A - THE PHILIPPINES (MAP 1 ) ............................................................. 105
APPENDDC B - THE PHILIPPINES (MAP 2 ) ............................................................. 107
APPENDIX C - REGIONS AND SCHOOL DIVISIONS ......................................... 109
VII
Reproduced with permission of the copyright owner. Further reproduction prohibited without permission.

APPENDIX D - LETTER TO THE SUPERINTENDENT......................................... 112
APPENDIX E - LETTER OF ENDORSEM ENT........................................................ 114
APPENDIX F - REVISED MLQ - 5R ITEMS ............................................................. 116
APPENDIX G - THE REVISED MLQ - 5R (RATER FORM) ............................... 118
APPENDIX H - SCHOOL MEAN SCORES ON THE LEADERSHIP SCALES . . 123
VITA ................................................................................................................................... 129
vm
Reproduced with permission of the copyright owner. Further reproduction prohibited without permission.

LIST OF TABLES
2.1 Overview of Studies on the Relationship between Transformational Leadership and Student Academic Achievement .......................................................................... 15
2.2 Overview of Studies on the Relationship between Principal Leadership and Student Academic Achievement ................................................................................ 21
3.1 Teacher and Principal Sam ples.................................................................................... 49
3.2 Research Questions and Statistical Analyses ............................................................ 58
3.3 Multiple Regression M odels.........................................................................................60
4.1 Sample Response Rate ..................................................................................................63
4.2 Profile of Respondents ..................................................................................................64
4.3 Means and Standard Deviations for the Respondent Demographic Variables . . . 65
4.4 Profile of S ch o o ls .......................................................................................................... 66
4.5 Means and Standard Deviations for School Demographic Variables(n = 36 schools).............................................................................................................. 67
4.6 Overall Mean Scores for the Principal Leadership Styles..........................................70
4.7 Overall Mean Scores for the Transformational Leadership Scales........................... 71
4.8 Means, Standard Deviations, and Intercorrelations for Regression Model 1(n = 36 schools)...............................................................................................................76
4.9 Beta Weights and Uniqueness Indices Obtained in Predicting Student Academic Achievement: Model 1 (n = 36 schools)..................................................................... 77
4.10 Means, Standard Deviations, and Intercorrelations for Regression Model 2(n = 36 schools) ............................................................................................................ 78
4.11 Beta Weights and Uniqueness Indices Obtained in Predicting Student Academic Achievement: Model 2 (n = 36 schools) ...................................................................79
IX
Reproduced with permission of the copyright owner. Further reproduction prohibited without permission.

4.12 Means, Standard Deviations, and Intercorrelations for Regression Model 3(n = 36 sch o o ls)............................................................................................................ 81
4.13 Beta Weights and Uniqueness Indices Obtained in Predicting Student Academic Achievement: Model 3 (n = 36 schools) ...................................................................82
Reproduced with permission of the copyright owner. Further reproduction prohibited without permission.

LIST OF FIGURES
1.1 Pendulum Effects M odel............................................................................................. 11
4.1 Mean Scores for Transformational Leadership as Perceived by Teachers and Principals..........................................................................................................................72
4.2 Mean Scores for Transactional Leadership as Perceived by Teachers and Principals..........................................................................................................................73
4.3 Mean Scores for Laissez-Faire Scale as Perceived by Teachers andPrincipals..........................................................................................................................74
XI
Reproduced with permission of the copyright owner. Further reproduction prohibited without permission.

ABSTRACT
Principal leadership has been identified to be a crucial factor in the success of a
school. One measure of school success is student academic achievement. Effective
school literature suggests that there exist a relationship between principal leadership
and student academic achievement. Thus, this study explored the relationship between
principal leadership style (transformational, transactional, or laissez-faire) and student
academic achievement in the Philippines. Three control variables were considered in
examining this relationship and these were teacher educational background, student
population, and student socio-economic status (SES).
This study was conducted in thirty-six elementary public schools in the
Philippines. The revised Multifactor Leadership Questionnaire - 5R (MLQ - 5R)
measured the principal leadership style while the National Elementary Assessment Test
(NEAT) of grade six students measured student academic achievement. The revised
MLQ - 5R measures four transformational leadership (charisma, inspiration, intellectual
stimulation, and individualized consideration), two components of transactional
leadership (contingent reward and management-by-exception), and laissez-faire.
There were four research questions posited in this study: ( 1 ) What leadership
style best describe the school principals in the Philippines? (2) Is there a significant
difference between teachers and principals with respect to their perceptions of the
leadership style of school principals in the Philippines? (3) Is there a significant
relationship between principal leadership style and student academic achievement in the
Xll
Reproduced with permission of the copyright owner. Further reproduction prohibited without permission.

Philippines? (4) What principal leadership style can be considered to be a relatively
important predictor of student academic achievement in the Philippines?
To answer these questions, the statistical analyses used to analyze the data were
Pearson-product moment correlation, Cronbach's coefficient alpha, descriptive
statistics, MANOVA, paired-samples t-test, and multiple linear regression. Results
showed that the elementary school principals in the Philippines were described as
transformational leaders by their teachers. With respect to teacher and principal
perceptions, teachers and principals were found to be different; Principal ratings were
higher than teacher ratings. Results also showed that principal leadership style, teacher
educational background, grade six student population, and grade six student SES were
not significantly related and not significant predictors of student academic achievement
in the Philippines.
X lll
Reproduced with permission of the copyright owner. Further reproduction prohibited without permission.

CHAPTER 1 - STATEMENT OF THE PROBLEM
Introduction
Research on effective schools has found that a school will not function
effectively for long without a competent school principal because the school principal is
the most significant individual in creating effective schools (Hughes & Ubben, 1989).
This statement has been shared by many researchers, including the late Ron Edmonds
( 1979). who frequently remarked, “There may be some bad schools here and there with
good principals but I have never seen a good school that had a bad principal”
(Edmonds, 1979). What then, makes a good principal?
Weber (1971), Edmonds ( 1979), and Brookover and Lezotte (1979) conducted
studies examining the factors that make effective principals. Their findings suggest that
the most important characteristic o f a good principal is strong leadership. This
observation has been reflected either explicitly or implicitly in the effective schools
literature which shows that principal leadership is a crucial factor in the success of a
school (Hughes & Ubben, 1989; Lomotey, 1989; Cheng, 1996).
One measure of school success is student academic achievement (Cheng, 1996)
and there have been studies associating principal leadership with student academic
achievement. Principal leadership style fostering friendly, trusting, respectful, and
warm relationships between principals and teachers leads to more positive teacher-
student interaction, resulting in improved student academic performance (Keeler &
Andrews, 1963; McMahon-Dumas, 1981; Lomotey, 1989). What principal leadership
style, therefore, can promote a harmonious principal-teacher relationship which affects
Reproduced with permission of the copyright owner. Further reproduction prohibited without permission.

teacher performance and in turn develops favorable teacher-student interaction that will
result in improved student academic achievement? In short, what principal leadership
style can be significantly associated with student academic achievement?
In the United States, the leadership role of school principals has evolved over
the decades due to: ( 1 ) reactive responses to political and historical events, (2) trends
originating from universities and research centers, (3) organizational theories, and (4)
public opinion (Beck & Murphy, 1993). In the 1920s, school principals were values
brokers. In the 1930s, they were scientific managers. The school principals became
democratic leaders in the 1940s and theory-guided administrators in the 1950s. In the
1960s, 1970s, and 1980s, the school principals were bureaucratic executives,
humanistic facilitators, and instructional leaders, respectively (Beck & Murphy, 1993).
In the 1990s, the leadership role of school principals has evolved again. The
educational emphases of this decade are teacher leadership, teacher professionalism,
initiation of educational changes, and school reconstructuring (Cuban, 1988; Barth,
1990; Elmore, 1990; Hallinger, 1992). To address these issues, the school principals
were proposed to become transformational leaders (Hallinger, 1992; Leithwood, 1992).
Furthermore, transformational leadership has been recommended as the type of
principal leadership that can take schools into the twenty-first century (Sergiovanni,
1990; Leithwood, 1992; Silins, 1993). If principals practice transformational
leadership, can this leadership style be significantly related to student academic
achievement?
Reproduced with permission of the copyright owner. Further reproduction prohibited without permission.

Discussion of Transformational Leadership
Définitions
It was James MacGregor Bums ( 1978) who first described the concept of
transformational leadership. Based on his analysis of world renowned political leaders.
Bums ( 1978) identified transactional and transformational as the two dimensions of
leadership. Transactional leadership is based on a social exchange between leaders and
their followers in which leaders reward their followers in exchange for their followers’
compliance. The rewards can either be economic, psychological or emotional in nature,
depending on the specific needs of the followers. In transformational leadership,
leaders not only focus on the needs of their followers, but also attempt to raise these
needs to higher levels of motivation and morality, enabling followers to perform
beyond what is expected of them (Bums, 1978).
Bernard Bass ( 1985) further developed the concepts of transformational
leadership and transactional leadership based on his initial studies of military officers.
After conducting more studies on transformational leadership, Bass and Avolio (1994)
developed a leadership model called the “Full Range of Leadership” model whose
elements can be measured by the Multifactor Leadership Questionnaire (Bass & Avolio,
1990, 1994; Bass, 1998). This model identifies three leadership styles, namely,
transformational leadership, transactional leadership, and laissez-faire. Of these three
leadership styles, transformational leadership is shown to be the most effective and
most active while laissez-faire is described as the most ineffective and most passive
(Bass and Avolio, 1994; Bass, 1998). The model also identifies four components of
Reproduced with permission of the copyright owner. Further reproduction prohibited without permission.

4
transformational leadership and two components of transactional leadership.
Description of the three leadership styles and their respective components follows.
Transformational leadership is seen when leaders motivate their followers to do
more than what their followers originally intended to do and most of the time, even
more than what their followers thought possible. Employing one or more of the four
components of transformational leadership, leaders can transform the motivation of
their followers enabling the followers to set more challenging expectations for
themselves and achieve higher level of performances (Bass & Avolio, 1990, 1994;
Bass, 1998).
The first component of transformational leadership is charisma in which the
leaders exhibit behaviors that make them role models for their followers. They have the
admiration, respect, and trust of their followers. The second component is inspiration
in which the leaders motivate and inspire their followers by providing meaningful and
challenging work for their followers. The third component is intellectual stimulation in
which the leaders encourage their followers to be innovative and creative by
questioning assumptions, reframing problems, and approaching old situations in new
ways. The last component of transformational leadership is individualized
consideration in which the leaders act as coaches or mentors to each follower allowing
the leaders to focus on a follower's needs for achievement and growth (Bass & Avolio,
1990, 1994; Bass, 1998).
Transformational leadership is an extension of transactional leadership.
Transactional leadership occurs when a transaction or exchange takes place between
Reproduced with permission of the copyright owner. Further reproduction prohibited without permission.

5
leaders and followers. The leaders discuss with their followers the consequences that
will occur when the followers fulfill what is required of them to do. To state in another
way, transactional leadership is portrayed as contingent reinforcement where
reinforcement takes the form of a leader's promises and rewards or threats and
disciplinary actions, depending on the follower's performance. Contingent
reinforcement can either be contingent reward or management-by-exception, which are
positive reinforcement and negative reinforcement, respectively (Bass & Avolio, 1990,
1994; Bass, 1998).
Contingent reward is a constructive transaction that is found to be reasonably
effective in motivating followers to achieve higher levels of development and
performance, however, it is not as effective as the transformational leadership
components. Contingent reward occurs when leaders provide appropriate rewards to
their followers if the followers meet agreed-upon objectives. Management-bv-
exception is a corrective transaction which tends to be more ineffective than the
transformational leadership and contingent reward components. It can either be active
or passive, that is, the leaders actively monitor or passively wait for mistakes and errors
to be made by their followers and when this happen, the leaders then take corrective
actions, such as, criticism or negative feedback (Bass & Avolio, 1990, 1994; Bass,
1998).
The third leadership style identified in the “Full Range of Leadership” model is
laissez-faire. Laissez-faire is the avoidance or absence of leadership. It is the most
inactive and the most ineffective leadership style when compared to transformational
Reproduced with permission of the copyright owner. Further reproduction prohibited without permission.
6
and transactional leadership. There are no transactions made between the leaders and
the followers. The leaders do not make the necessary decisions and do not take
immediate actions. Their leadership responsibilities are ignored and their authority
remains unused (Bass & Avolio, 1990, 1994; Bass, 1998).
Research
Transformational leadership was first studied among political and military
leaders. It was only in the 1990s that educational researchers studied transformational
leadership in school settings and so studies on transformational leadership in education
are limited. Nevertheless, despite this small number of research studies, the results
from these studies were consistently positive. For instance, Leithwood and Jantzi
( 1991) found that in their analysis of twelve schools, principals who practiced
transformational leadership demonstrated a big influence on teacher collaboration. In
the study of Sagor ( 1992), results showed that schools with a culture conducive to
success have principals who were perceived to be transformational leaders. Gasper
(1993) completed a meta - analysis review of the literature and the results suggested
that transformational leadership can be associated with higher levels of perceived leader
effectiveness, follower satisfaction with the leader, and a greater willingness on the part
of the followers to put forth extra effort in their work. Since results from
transformational leadership studies in schools have fairly shown positive results, more
studies on this area are needed. Furthermore, it has been suggested that studies
associating transformational leadership with student academic achievement are
Reproduced with permission of the copyright owner. Further reproduction prohibited without permission.

7
warranted because transformational leadership seem to ‘remarkably improve’ student
academic achievement (Sergiovanni, 1990; Hoover, Petrosko, & Schultz, 1991).
Statement of the Problem
Most studies investigating the relationship between principal leadership style
and student academic achievement focused on western settings. Only a handful o f this
kind of studies focused on non-western settings (Kanungo & Mendonca, 1996). This is
unfortunate since many countries in the Asia-Pacific region use student academic
achievement as their major measure of school success (Cheng, 1996). This is
particularly true in the Philippines where schools are sometimes ranked according to the
performances of their respective students in the national achievement examinations.
Furthermore, studies (conducted either in western or non-western settings)
examining the relationship between transformational leadership among school
principals and student academic achievement are limited since it is only in the 1990s
that educational researchers considered investigating transformational leadership in
schools. However, studying transformational leadership means studying transactional
leadership also since the former is an expansion of the latter (Bass, 1985, 1998). The
leadership styles presented in the “Full Range of Leadership” model, developed by Bass
and Avolio ( 1994), were the three leadership styles investigated in this study.
As implied above, there is an obvious gap between theory and research
concerning transformational leadership in non-western settings. To contribute to the
study of principal leadership, particularly transformational leadership, and student
academic achievement in non-western settings, this present study addressed the
Reproduced with permission of the copyright owner. Further reproduction prohibited without permission.

8
following problem: Is there a relationship between principal leadership style
(transformational, transactional, or laissez-faire) and student academic achievement in
the Philippines?
Purpose of the Study
This study was exploratory in nature. The main objectives of this study were to
examine: ( 1) the leadership style (transformational, transactional, or laissez-faire) that
describes the school principals in the Philippines and (2) the relationship between
principal leadership style (transformational, transactional, or laissez-faire) and student
academic achievement in the Philippines. As reiterated earlier, the knowledge base on
principal leadership shouldn’t be limited to western settings only and thus, this study
provides a glimpse of principal leadership in the Philippines and its relationship with
student academic achievement.
Significance of the Study
This study is significant to theory, practice and future research because of the
following reasons: First, studies on transformational leadership in the field of
education are very few because, as mentioned earlier, it is only during the 1990s that
educational researchers started to investigate the transformational leadership model.
The majority of the research studies on transformational leadership focused on
non-educational settings, such as, military and business settings. Since the
transformational leadership model seems to provide another view on exceptional
performance among school principals (Stone, 1992), this study will contribute to the
Reproduced with permission of the copyright owner. Further reproduction prohibited without permission.

development of the transformational leadership model in the field of educational
administration.
Second, most of the research studies on transformational leadership were
conducted in North America, specifically in the United States and Canada. There were
only a few transformational leadership studies conducted outside of North America,
such as, Singapore, Taiwan, and Australia (Koh, Steers, & Terborg, 1995; Chu, 1994;
Silins, 1994). This study is then significant to the theory of transformational leadership
because the model is tested in the Philippines where the culture is different from the
North American countries.
Third, according to Bass (1985), transformational leadership can be taught, thus,
if this study verifies that there is a significant relationship between transformational
leadership among school principals and student academic achievement, policy makers
and school administrators can decide on developing policies and in-service programs
that focus on the development of transformational leadership among educational
administrators and would-be educational administrators in the Philippines.
And last, research on principal leadership is ah on-going activity. This study is
a contribution to the never ending search for the ideal or effective principal leadership
style. Future researchers can either replicate or can be guided by the study, especially
when they attempt to conduct their research in other cultural settings.
Conceptual Framework
According to Immegart (1988), leadership style pertains to the “action
disposition, or set or pattern of behaviors, displayed by a leader in a leadership
Reproduced with permission of the copyright owner. Further reproduction prohibited without permission.

10
situation” (p. 262). Thus, in this study, principal leadership style is defined as the
action disposition or pattern of behaviors displayed by a principal leader in a leadership
situation. Student academic achievement in this study is defined as student scores on a
given achievement test.
There are causal models that can explain the influence of principal leadership
style on student academic achievement. Pitner (1988) identified five causal models
describing the relationship between administrator behavior and organizational outcome
variables: ( 1 ) direct effects model - this model states that the administrator behavior
directly influences outcome variables; (2) antecedents effects model - in this model,
there are antecedent variables that influence administrator behavior, which in turn
influences organizational outcomes; (3) reciprocal causation model - this model
indicates that administrator behavior affects certain outcomes that in turn can influence
ensuing administrator behavior; (4) mediating effects model - in this model, the
administrator effect on the organizational outcome can either be indirect (the
administrator behavior is mediated by a third variable) or direct (the administrator
behavior is independent of a third variable); and (5) moderated effects model - this
model indicates that the administrator effects are moderated by a third variable, that is,
the administrator effects take place under one set of conditions but not under a less
favorable conditions (Pitner, 1988).
All these models make sense and thus a new model integrating all five is
proposed for this study. It is called the “pendulum effects model.” This model was
primarily conceptualized based on earlier observation that a principal leadership style
Reproduced with permission of the copyright owner. Further reproduction prohibited without permission.

11
that fosters friendly, trusting, respectful, and warm relationships between principals and
teachers may transform teacher performance, thus leading to a more positive teacher-
student interaction that eventually results in improved student academic performance
(Keeler & Andrews, 1963; McMahon-Dumas, 1981; Lomotey, 1989). This statement
implies that there exist some direct effects relationship among the variables. That is,
principal leadership style directly affects principal-teacher relationships which affects
teacher performance and which in turn affects teacher-student interaction, which finally
affects student academic achievement. The pendulum seems to be the appropriate
metaphor to illustrate the causal effects among these variables. Figure 1.1 illustrates a
rough pictorial presentation of the model.
C l Cc
Yn Yn Yn Yn Yo
1 1
PL ( PTR ( TP ( TSI ( SA
Figure 1.1: Pendulum Effects ModelNote. PL = Principal Leadership, PTR = Principal-Teacher Relationship, TP = Teacher Performance,TSI = Teacher-Student Interaction, SA = StudentAchievement
Reproduced with permission of the copyright owner. Further reproduction prohibited without permission.

12
Principal leadership style and student academic achievement occupies the
opposite ends of the pendulum suggesting an indirect relationship between the two
variables. Principal-teacher relationship, teacher performance, and teacher-student
interaction serve as mediating variables. As the pendulum swings back and forth, the
model indicates reciprocal relationships among the variables, meaning student
academic achievement can also indirectly affect principal leadership.
Another feature of the pendulum effects model is the strings that hold the
pendulum balls. The strings represent direct relationships between the five variables
identified in the model and antecedent variables (Yn>. The antecedent variables can be
any school and community factors. The pole that holds the strings together represents a
set of characteristics (Cn), such as, school, student, or staff demographics. These
characteristics serve as control or moderator variables.
In this study, the relationship between principal leadership style
(transformational, transactional, or laissez-faire) and student academic achievement in
the Philippines was explored by considering three control variables, namely, teacher
educational background, student population, and student socio-economic status (SES).
These three control variables were chosen based on the following assumptions: ( 1 ) The
higher the educational attainment of teachers, the higher the student academic
achievement, (2) The smaller the student population size, the higher the student
academic achievement, and (3) The higher the student SES, the higher the student
academic achievement.
Reproduced with permission of the copyright owner. Further reproduction prohibited without permission.

13
Research Questions
Four research questions were posited in this study: ( 1 ) What leadership style
(transformational, transactional, or laissez-faire) best describe the school principals in
the Philippines? (2) Is there a significant difference between teachers and principals
with respect to their perceptions of the leadership style (transformational, transactional,
or laissez-faire) of school principals in the Philippines? (3) Is there a significant
relationship between principal leadership style (transformational, transactional, or
laissez-faire) and student academic achievement in the Philippines? (4) What principal
leadership style (transformational, transactional, or laissez-faire) can be considered to
be a relatively important predictor of student academic achievement in the Philippines?
Summary
The main objective of this study was to explore the relationship between
principal leadership style (transformational, transactional, or laissez-faire) and student
academic achievement in the Philippines by considering three control variables,
namely, teacher educational background, student population, and student SES. This
study is significant because it looked at principal leadership in a non-western setting
and thus, contributed to the expansion of the knowledge base of principal leadership.
Transformational leadership was a major focus of this study because this leadership
style is the current trend in educational administration and is being recommended as the
kind of principal leadership that can take schools into the twenty-first century. The
discussion on the literature review is presented in the next chapter.
Reproduced with permission of the copyright owner. Further reproduction prohibited without permission.

CHAPTER 2 - REVIEW OF THE LITERATURE
Overview
The purpose of this study was to explore the relationship between principal
leadership style (transformational, transactional, or laissez-faire) and student academic
achievement in the Philippines. Unfortunately, studies conducted in the Philippines
were not found. Thus, the majority of the studies reported here occurred in western
settings. The following combinations of keywords used here to search through the
literature were: ( 1 ) transformational leadership, principals, and student achievement;
(2) leadership, principals, and student achievement; and (3) leadership and Philippines.
The databases used for the review were: Educational Resources Information Center
(ERIC), 1966 to 1996; Dissertation Abstracts International (DAI), 1861 to November
1996; and Louisiana Online Library Access (LOLA), which is the library database at
Louisiana State University (LSU).
Forty-five studies were retrieved and reviewed. These studies were divided into
three parts: ( 1 ) research studies on transformational leadership of principals and
student academic achievement, (2) research studies on principal leadership and student
academic achievement, and (3) research studies on leadership in the Philippines. The
discussion of each of these sections follows.
Transformational Leadership and Student Academic Achievement
Nine studies relating transformational leadership among school principals with
student achievement were reviewed in this section. Four were qualitative studies and
14
Reproduced with permission of the copyright owner. Further reproduction prohibited without permission.

15
five were quantitative studies. An overview of the reviewed studies in this section is
presented in Table 2 .1.
Table 2.1
Overview of Studies on the Relationship between Transformational Leadership and Student Academic Achievement
Authors & Year Sample Size Instruments AchievementMeasure
Amory (1993) 10 interviews reading
Edington & Di Benedetto (1988)
24 questionnaires CTBS*
Kendrick (1988) ■ interviews -
Koh, Steers, & Terborg (1995) 89 questionnaires graduation rate
Liontos (1993) 1 interviews -
Rodgers (1994) 49 questionnaires Blue Ribbon Schools
S ag o r(1992) 3 interviews,observations
-
Silins (1994) 58 questionnaires -
Weitman ( 1996) 4 questionnaires Blue Ribbon Schools
Note. *CTBS = California Test of Basic Skills.
Qualitative Studies
Liontos (1993) did a study of a high school principal. Bob Anderson, in Oregon.
Through extensive interviews with staff, the superintendent, and the principal himself,
Liontos (1993) traced the evolution of the principal as a leader. According to the
researcher, Anderson seemed to embody most of the elements of transformational
leadership. He was described as non-directive, flexible, nurturing, and intuitive. He
had high expectations of students and was credited for making the school into an
Reproduced with permission of the copyright owner. Further reproduction prohibited without permission.

16
outstanding and innovative school where student performance increased and dropout
rates markedly decreased.
Kendrick (1988), conducted a reflective study that traced the leadership
behavior of a middle school principal from transactional to transformational. The
outcome of this transition was the change in the principal's school. From a seriously
troubled school, the school became an effective school where student achievement and
school climate improved dramatically.
Sagor ( 1992) studied three principals (two elementary school principals and one
middle school principal) through interviews and observations. One principal was
opinionated and assertive, the other was nurturing and supportive, and the other was
highly energetic and charismatic. Sagor (1992) described the three principals as
transformative leaders who shared one thing in common and that was exemplary
schools. In these schools, there were high student and faculty morale, and high and
improving student performance.
Amory ( 1993), examined the principals of ten urban public schools where the
ethnic majority of students were African-American who had average or above average
reading achievement scores. The researcher conducted in-depth interviews of
principals, teachers, and parents to investigate the role of the principal in the successful
reading achievement of the students. Amory ( 1993) concluded that the principals of
these schools exhibited strong instructional, charismatic, and transformational
leadership characteristics.
Reproduced with permission of the copyright owner. Further reproduction prohibited without permission.

17
Quantitative Studies
Rodgers ( 1994) measured the level of transformational leadership of principals
in forty-nine effective elementary schools that were operationally defined as schools
that received the United States Department of Education’s Blue Ribbon Schools
Excellence in Education Award. Rodgers (1994) found that the Blue Ribbon School
principals were strong transformational leaders, as perceived by both teachers and
principals. Rodgers concluded that strong transformational leadership in principals is
one of the characteristics of effective schools.
Weitman ( 1996) also measured the degree of transformational leadership of
principals of four Blue Ribbon elementary schools located in an Ohio county. The
principals and their teachers completed a questionnaire that measures five
transformational leadership practices: (1) challenging the process, (2) inspiring a
shared vision, (3) enabling others to act, (4) modeling the way, and (5) encouraging the
heart. Based on principal and teacher perceptions, results showed high ratings for all
the principals in the five transformational leadership practices.
Edington and Di Benedetto (1988) examined principal leadership style and
student achievement in twenty-four rural elementary schools in New Mexico. The
researchers measured four effective leadership dimensions: ( 1 ) participation, (2) role
clarification, (3) supervision, and (4) charismatic or transformational. The researchers
used the student overall average scores on the Comprehensive Test of Basic Skills
(CTBS) to measure student academic achievement. Edington and Di Benedetto (1988)
concluded that based on teacher perception, the principal's role clarification was
Reproduced with permission of the copyright owner. Further reproduction prohibited without permission.

18
negatively related to the CTBS scores, while the principal's charismatic or
transformational leadership was positively related to the CTBS scores. Based on
principal perception, no relationship was found between their leadership style and the
CTBS scores.
Silins (1994) investigated principals of fifty-eight South Australian schools.
Silins (1994) identified six transformational leadership components: (1) visionary, (2)
goal achievement, (3) intellectual stimulation, (4) individual consideration and support,
(5) collaborative problem solving, and (6) ethos. Based on teacher perception, results
showed that goal achievement and ethos strongly influenced student performance in the
fifty-eight South Australian schools.
Koh, Steers, and Terborg ( 1995) investigated the relationship between
transformational leadership of eighty-nine secondary school principals and student
academic performance in Singapore. A random sample of teachers completed the
Multifactor Leadership Questionnaire (MLQ) - Form 5S to measure the degree of
transactional leadership (contingent reward, active management-by-exception, passive
management-by-exception, and laissez-faire management) and transformational
leadership (charisma, individualized consideration, intellectual stimulation) of the
principals. The researchers defined student academic performance as the percentage of
graduating students who obtained a minimum of five credit passes (out of seven). The
findings suggested that transformational leadership had little direct impact on student
academic performance in Singapore.
Reproduced with permission of the copyright owner. Further reproduction prohibited without permission.

19
Sub-Summary
Nine studies examining the relationship between transformational leadership
among school principals and student academic achievement were reviewed in this
section. These studies implied that a significant relationship exists between
transformational leadership among principals and student academic achievement. A
summary of the findings follows.
First, principals of effective and exemplary schools were described to be
transformational leaders (Liontos, 1993; Kendrick, 1988; Sagor, 1992; Amory, 1993;
Rodgers, 1994; Weitman, 1996). Principal leadership was related to attributes of
effective schools, namely, increased student achievement (Liontos, 1993; Kendrick,
1988; Sagor, 1992; Amory, 1993); declining drop out rates (Liontos, 1993); high
student and faculty morale (Sagor, 1992); and improved school climate (Kendrick,
1988).
Second, when teachers evaluated the transformational leadership of their
principals, results suggested significant relationships between principal leadership and
student academic achievement (Edington and Di Benedetto, 1988; Silins, 1994;
Weitman, 1996). However, in the study of Koh et al. (1995), no significant relationship
was found. One possible explanation for this is that Koh et al. ( 1995) defined student
academic achievement as the percentage of graduating students. The other studies used
scores on standardized tests as measures of student academic achievement. If Koh et al.
(1995) used standardized scores, their results might have showed significant
Reproduced with permission of the copyright owner. Further reproduction prohibited without permission.

20
relationship between transformational leadership among principals and student
academic achievement in Singapore.
Third, principals and teachers can differ with respect to their perceptions of
principal leadership. Edington and Di Benedetto ( 1988) asked both teachers and
principals to complete a leadership questionnaire measuring the leadership style of
principals. Results based on teacher perception showed a positive relationship between
the transformational leadership of principals and student achievement, whereas results
based on principal perception showed no relationship between transformational
leadership of principals and student achievement. A possible explanation for this
discrepancy is that principals may have overrated or underrated their leadership
behaviors or teachers may have overrated or underrated their principals.
Principal Leadership and Student Academic Achievement
A total of thirty-one studies investigating the relationship between principal
leadership and student academic achievement was reviewed in this section. Six were
classified as qualitative studies and twenty-five were classified as quantitative studies.
The twenty-five quantitative studies were further divided based on who completed the
leadership questionnaires used in these studies. Table 2.2 presents an overview of the
studies reviewed in this section.
Qualitative Studies
Stanfield and Walter (1987) examined the leadership behaviors of John Meyer,
an elementary school principal in Missouri. When Meyer first arrived at his school, the
norm at the school was low student achievement, non-existent student discipline, and
Reproduced with permission of the copyright owner. Further reproduction prohibited without permission.
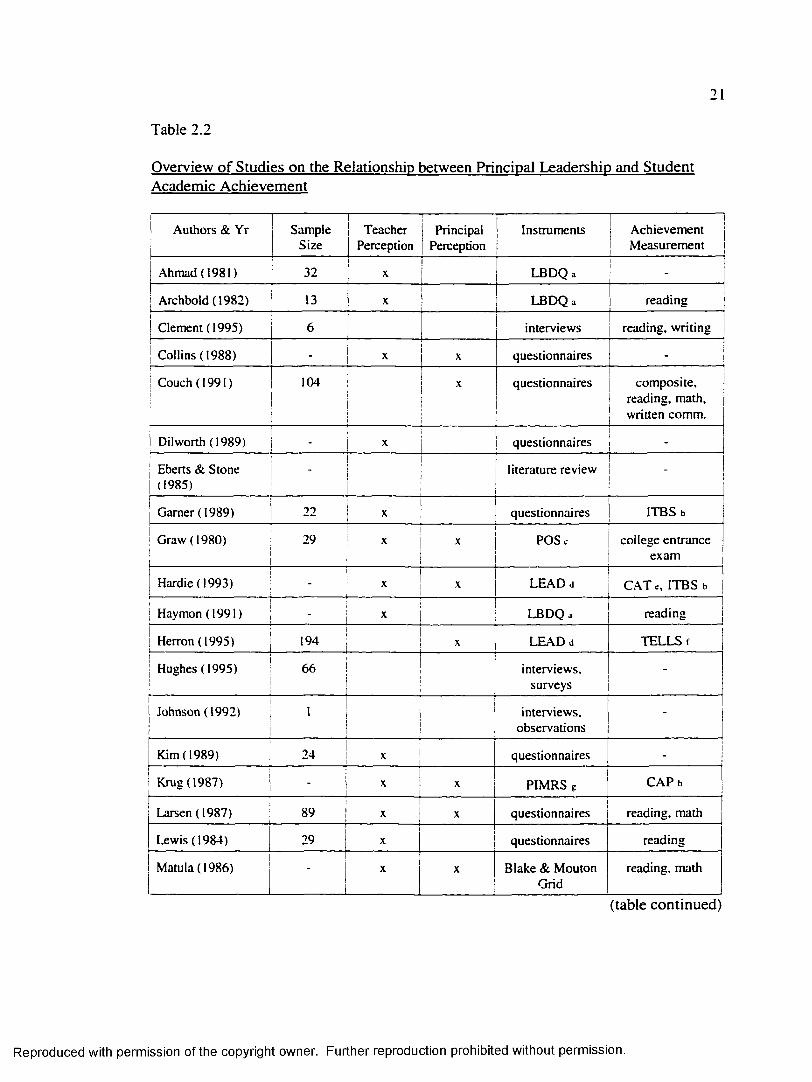
21
Table 2.2
Overview of Studies on the Relationship between Principal Leadership and Student Academic Achievement
1j Authors & Yr Sample
Size
1Teacher
PerceptionPrincipal
PerceptionInstruments Achievement
M easurement
Ahmad (1981) 32 LBD Q a -
j Archbold (1982) 13 X LBD Q a reading
Clement (1995) 6 interviews reading, writing
Collins (1988) - X X questionnaires •
C ouch(1991) 104 X questionnaires composite, reading, math, written comm.
Diiworth (1989) i questionnaires
Eberts & Stone (1985)
-I
!
literature review '
Gamer ( 1989) 221
^ i questionnaires ITBS b
i Graw (1980)!1
29 X POSc college entrance exam
Hardie (1993) - X X LEADd C A Te, ITBS b
Haymon (1991) ' X LBDQa reading
Herron (1995) 194 X LEADd TELLS f
Hughes(1995) 66 interviews.surveys
-
Johnson(1992) 1 interviews,observations
-
K im (1989) 24 questionnaires -
Krug (1987) X X PIMRS g C A P h
Larsen (1987) 89 X X questionnaires reading, math
Lewis (1984) 29 X questionnaires reading
M atula(1986) - X X Blake & Mouton Grid
reading, math
(table continued)
Reproduced with permission of the copyright owner. Further reproduction prohibited without permission.
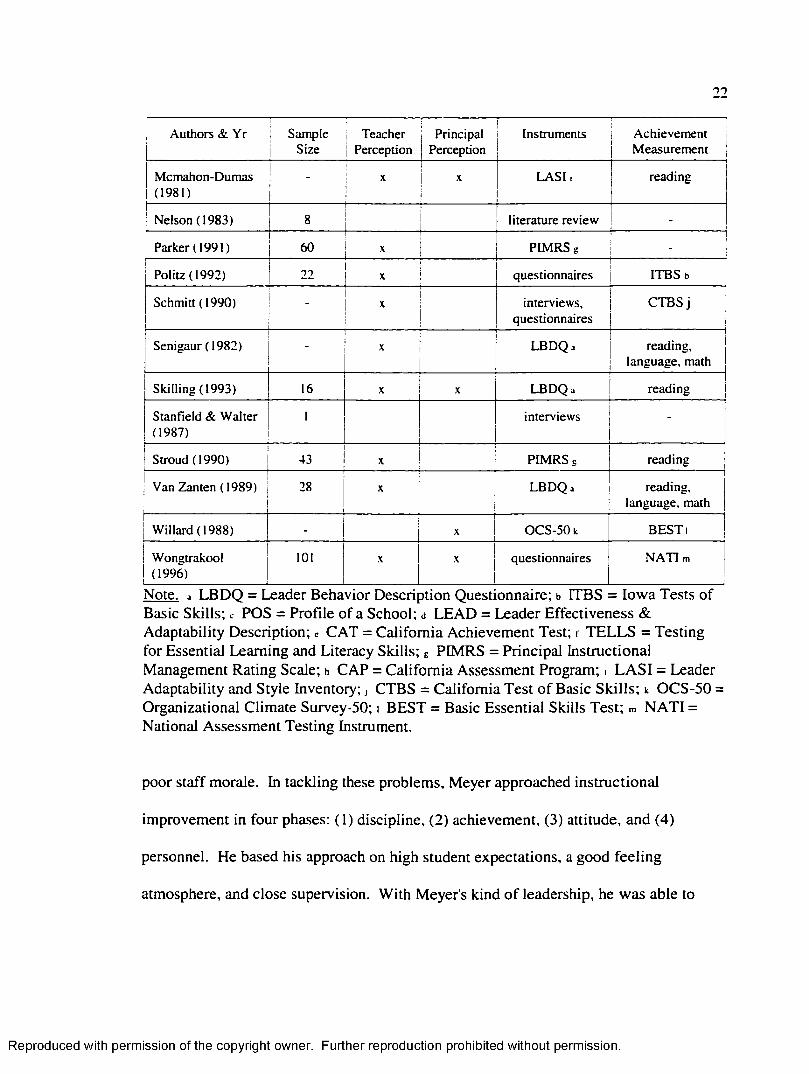
1 1
1 Authors & Yr 1 Sample Size
TeacherPerception
j Principal 1 Perception
Instruments AchievementM easurement
Mcmahon-Dumas(1981)
- X1
X LA SI, reading
Nelson (1983) 8 literature review -
Parker (1991) 60 PIMRS g -
Folltz(1992) 22 questionnaires ITBSb
Schmitt (1990) - interviews,questionnaires
C T B S j
Senigaur (1982) - X LBDQa reading, language, math
Skilling (1993) 16 X X LBDQa reading
Stanfield & W alter (1987)
1 interviews -
Stroud (1990) 43 X PIMRS g reading
Van Zanten (1989) 28 X LBDQa1
reading, language, math
Willard (1988) - X OCS-50 k BESTi
W ongtrakool(1996)
101 X X questionnaires N A T I m
Note, a LBDQ = Leader Behavior Description Questionnaire; b UBS = Iowa Tests of Basic Skills; l- POS = Profile of a School; d LEAD = Leader Effectiveness & Adaptability Description; « CAT = California Achievement Test; r TELLS = Testing for Essential Learning and Literacy Skills; g PIMRS = Principal Instructional Management Rating Scale; h CAP = California Assessment Program;, LAS I = Leader Adaptability and Style Inventory; , CTBS = California Test of Basic Skills; k OCS-50 = Organizational Climate Survey-50; i BEST = Basic Essential Skills Test; m NATI = National Assessment Testing Instrument.
poor staff morale. In tackling these problems, Meyer approached instructional
improvement in four phases: ( 1) discipline, (2) achievement, (3) attitude, and (4)
personnel. He based his approach on high student expectations, a good feeling
atmosphere, and close supervision. With Meyer's kind of leadership, he was able to
Reproduced with permission of the copyright owner. Further reproduction prohibited without permission.

23
“tum-around” his school in terms of achievement test scores, student discipline, and
staff morale, and thus, Stanfield and Walter (1987) described Meyer as a “tum-around”
principal.
Johnson (1992) described how a school in Texas, Hollibrook Elementary
School, ascended from the bottom tier of its district to a national exemplar of successful
educational reform. Through observations and interviews, Johnson (1992) identified
the leadership at Hollibrook as shared leadership which was described as a kind of
leadership that acknowledges the leadership roles of teachers. The implementation of
shared leadership at Hollibrook resulted in the school’s improved student achievement
scores, reduced discipline problems, and increased parental involvement. Shared
leadership materialized because the Hollibrook school principal acknowledged the
strength of the faculty and supported the faculty in “taking risks necessary to challenge
the status quo.” The principal moved away “from being ‘the leader’ to being ‘the leader
of leaders’” (Johnson, 1992).
Hughes (1995) investigated the principals of thirty-three high-achieving and
thirty-three low-achieving elementary schools in West Virginia. Hughes (1995)
interviewed parents, teachers, and principals. Results suggested that in the
high-achieving schools, principals supported their teachers and various academic
programs. The principals had an open communication style in dealing with parents,
teachers, and students. In the low-achieving schools, the principals did not assume
supportive and instructional leadership.
Reproduced with permission of the copyright owner. Further reproduction prohibited without permission.

24
Clement (1995) interviewed teachers and principals from three high-performing
and three low-performing elementary schools located in low socio-economic areas. The
researcher found that the principals of the three high performing schools were identified
as strong supportive instructional leaders. In the low performing schools, the principals
were not identified as supportive instructional leaders.
Nelson (1983) reviewed eight case studies which explored the impact of school
principals on student reading achievement. The principals in the case studies promoted
school climate; provided strong leadership; and established goals, purposes, and student
expectations. Nelson (1983) concluded that principal leadership behavior is positively
associated with reading achievement of students.
Eberts and Stone ( 1985) reviewed case studies that focused on principal
effectiveness in schools. Principals in the case studies had strong leadership. They
reduced conflicts among the participants in the educational process. Furthermore,
because of their strong leadership behaviors, the principals were able to directly affect
student achievement.
Quantitative Studies
Studies Based on Teacher Perception
The thirteen studies reviewed in this section used teacher perception as the basis
for data analysis. Teachers were asked to evaluate the leadership style of their
respective principals. Discussion of each of these studies follows.
Schmitt ( 1990) explored the impact of a school principal on reading and
mathematics achievement. Schmitt (1990) measured principal leadership using three
Reproduced with permission of the copyright owner. Further reproduction prohibited without permission.

25
dimensions: ( 1 ) responders, (2) managers, and (3) initiators. The sample consisted of
six schools (five elementary and one junior high) in a large urban school system. The
results suggested that there was a statistically significant relationship between principal
leadership style and student achievement. Schools with principals identified as
managers had higher reading and mathematics achievement scores than schools with
principals identified as initiators. Schmitt (1990) concluded that the leadership style of
a school principal does impact student academic achievement.
Haymon (1991), Van Zanten (1989), Archbold (1982), Senigaur (1982), and
Ahmad (1981) used the Leader Behavior Description Questionnaire (LBDQ) to
measure the leadership behaviors of the principals in their respective studies. Three of
these studies showed relationships between principal leadership and student
achievement while two of the studies did not. The discussion of these studies follows.
Haymon (1991) examined the relationships among elementary school principal
leadership style, school climate, and student achievement in differing racial-ethnic and
socio-economic status (SES) contexts. Haymon (1991) measured student achievement
using the third and sixth grade reading test scores from the California Test of Basic
Skills (CTBS). Results suggested that; (I) the leadership style of principals was related
to school climate and to the third grade reading achievement, (2) the percentage of
white students was related to sixth grade achievement and principal leadership style, (3)
there was a strong positive relationship between SES and percentage of white students,
and (4) school climate was not related to third or sixth grade reading achievement.
Reproduced with permission of the copyright owner. Further reproduction prohibited without permission.

26
Van Zanten (1989) examined the relationship between principal leadership style
and school effectiveness in twenty-eight urban elementary schools. Van Zanten (1989)
used reading, language, and mathematics student achievement scores on the California
Achievement Test (CAT) to measure school effectiveness. Findings showed that
principals with directive leadership style had a positive influence on student
achievement, particularly in language and mathematics. The democratic administrative
leadership style resulted in less productive student achievement. Van Zanten (1989)
concluded that the leadership style o f principals is an important factor in determining
school effectiveness and that an autocratic leadership style will be more effective in an
urban setting.
Archbold ( 1982) conducted a comparative study between high-achieving and
low-achieving elementary schools in relation to two dimensions of principal leadership,
namely, initiating structure and consideration. The researcher used the composite
reading achievement scores of students (grade two to grade six) on the Iowa Tests o f
Basic Skills (ITBS) in classifying schools as high-achieving (ranked high on the
ITBS-reading) and low-achieving (ranked low on the ITBS-reading). The sample
included 130 teachers from thirteen elementary schools in Chicago. Results suggested
that: ( 1 ) the high-achieving schools had principals exhibiting high consideration and
high initiating structure leadership behaviors, (2) the low-achieving schools had
principals exhibiting high consideration and low initiating structure, (3) the leadership
behaviors of low consideration and low initiating structure were not related to student
reading achievement, and (4) the relationship between the leadership behaviors of low
Reproduced with permission of the copyright owner. Further reproduction prohibited without permission.

27
consideration and high initiating structure was inconclusive which may be due to the
small sample size of the study.
Senigaur (1982) studied the impact of principal leadership behavior and faculty
morale on student achievement. Student achievement was defined as achievement
scores in language, reading, and mathematics tests. The researcher found no significant
positive relationships between: ( 1 ) principal leadership behavior and student
achievement and (2) faculty morale and student achievement.
Ahmad (1981) examined the relationships among principal leadership style,
school climate, and student academic achievement in Kuala Lumpur, Malaysia.
Leadership style was measured for thirty-two elementary school principals. Results
indicated that: ( 1 ) the leadership style of elementary school principals in Kuala Lumpur
was not significantly related to student achievement, (2) the leadership dimension of
consideration was significantly related to school climate, and (3) the school climate was
significantly related to student achievement.
Politz ( 1992), Gamer ( 1989), and Lewis (1984) used the Leader Effectiveness
and Adaptability Description (LEAD) to measure principal leadership in their
respective studies. All three studies reported a significant relationship between
principal leadership and student achievement. The discussion of each of these studies
follows.
Politz (1992) correlated principal leadership with the academic achievement
(ITBS scores) of seventh grade students from twenty-two Catholic schools in Indiana.
Results showed that of the twenty-two principals, two principals exhibited Style 1
Reproduced with permission of the copyright owner. Further reproduction prohibited without permission.

28
leadership (Telling), thirteen principals exhibited Style 2 leadership (Selling), six
principals exhibited Style 3 leadership (Participating), and one principal exhibited Style
4 leadership (Delegating). Results also showed that seventh grade students with
principals exhibiting Style 4 leadership had significantly higher achievement mean
scores than the seventh grade students with principals exhibiting either Styles 1, 2, and
3 leadership. Politz ( 1992) concluded that a correlation between principal leadership
style and student academic achievement does exist.
Gamer ( 1989) conducted a comparative study between twenty-two Chapter One
and non-Chapter One elementary schools. The researcher examined the leadership
styles of the principals in these schools in relation to the achievement of the schools'
third grade students. Gamer ( 1989) used ITBS scores to define student achievement.
The researcher concluded that principal leadership style and school type are
significantly correlated with student achievement. Results showed that: ( 1 ) Principals
with Style 1 leadership (high task/low relationship) had schools with the highest student
achievement scores, (2) Non-Chapter One schools scored better on the ITBS tests than
Chapter One schools, and (3) Chapter One students scored higher under Style 1
principals while non-Chapter One students scored equally well under Style 1 or Style 2
principals.
Lewis (1984) related principal leadership with achievement test scores of
students from low-income families. The sample consisted of twenty-nine elementary
school principals and 478 third grade students. Lewis (1984) measured five leadership
dimensions: (1) total leadership effectiveness, (2) frequency of high task behavior, (3)
Reproduced with permission of the copyright owner. Further reproduction prohibited without permission.

29
frequency of high relationship behavior, (4) effectiveness in high task, and (5)
effectiveness in high relationship. Lewis ( 1984) used the California Achievement Test
(CAT) and the percentage of the student sample scoring below the twenty-fifth
percentile on the CAT test to measure student achievement. The results indicated that
the academic achievement of students from low-income families were significantly
related to three principal leadership dimensions, namely, total leadership effectiveness,
frequency of high relationship behavior, and effectiveness of high task behavior.
Parker (1991), Stroud (1990), Diiworth (1989), and Kim (1989) investigated the
instructional leadership of school principals. Parker (1991) and Stroud (1990) used the
Principal Instructional Management Rating Scale (PIMRS) to measure principal
instructional leadership while Diiworth (1989) and Kim (1989) used other leadership
questionnaires for their respective studies. Discussion of these studies follows.
Parker (1991) examined the relationship between the instructional leadership of
principals and student achievement in sixty non-urban elementary schools in Missouri.
Parker (1991) used the reading and mathematics scores of students on the Missouri
Mastery Achievement Tests (MMAT) as measures of student academic achievement.
The PIMRS used to evaluate the principals measures three leadership dimensions; (1)
defining the mission, (2) managing the curriculum and instruction, and (3) promoting a
positive school. Parker (1991) concluded that there is a positive significant relationship
between the three PIMRS leadership dimensions and the MMAT scores, specially
mathematics scores.
Reproduced with permission of the copyright owner. Further reproduction prohibited without permission.
30
Stroud ( 1990) conducted a study in forty-three elementary schools. These
schools were divided into two groups: ( 1) effective schools - whose 1988-1989 third
grade Georgia Criterion Referenced Test (GCRT) reading scores fell within the top rank
of twenty-five schools and (2) less-effective schools - whose 1988-1989 third grade
GCRT reading scores fell within the bottom rank of twenty-five schools. Stroud (1990)
examined whether the principals of these two school groups differ with respect to their
instructional leadership style, as measured by the PIMRS. The findings did not support
the assumption, the higher average leadership scores on the PIMRS, the higher the
student achievement gains.
Diiworth (1989) examined the instructional leadership of elementary school
principals in relation to student achievement and teacher attendance. Diiworth ( 1989)
concluded that: ( 1 ) the combined factors of instructional leadership behaviors of
principals and teacher attendance are not predictive of student achievement, (2) teacher
attendance is not predictive of student achievement, and (3) instructional leadership
behaviors of principals are not predictive of student achievement.
Kim (1989) related principal instructional leadership with student achievement
and student SES in Seoul, Korea. The study was conducted in twenty-four private high
schools. Findings indicated that there were significant differences with respect to
student academic achievement among three groups of principal instructional leadership
(strong, average, and weak instructional leadership). Results also showed that there
were significant differences with respect to student academic achievement among the
three SES groups (high, middle, and low). In all the three SES groups, results indicated
Reproduced with permission of the copyright owner. Further reproduction prohibited without permission.

31
that strong principal instructional leadership was related to higher student achievement.
Kim (1989) concluded that in high, middle, and low SES schools, student academic
achievement is strongly influenced by principal leadership.
Studies Based on Principal Perception
Three studies were reviewed in this section. The principals were asked to
evaluate their own leadership style and their perception was used as the basis for data
analysis. A discussion of the results follows.
Herron ( 1995) examined the leadership styles of 194 elementary school
principals. The principals completed the Leader Effectiveness and Adaptability
Description (LEAD) that measures three leadership variables: (1) primary leadership
style, (2) range of leadership style, and (3) leadership style adaptability. Herron ( 1995)
related each of these leadership variables with student achievement, principal's years of
service, and he percentage of low income students. The researcher defined student
achievement as scores on the Testing for Essential Learning and Literacy Skills
(TELLS). Findings showed that the three leadership variables had no significant
correlation with student achievement, with principal's years of service, and with the
percentage of low income students in the schools. However, significant correlation was
found between the percentage of low income students and student achievement.
Couch (1991) examined the relationship between principal instructional
leadership and student achievement in 104 schools in Mississippi. Couch (1991) used
the Basic Skills Assessment Program (BSAP) scores of eight grade students to measure
student achievement. Results indicated that the degree to which the principal
Reproduced with permission of the copyright owner. Further reproduction prohibited without permission.

32
demonstrated instructional leadership had no effect on the measured student
achievement scores.
Willard ( 1988) studied whether leadership style, as measured by the
Organizational Climate Survey, and student achievement, as measured by scores on the
Basic Essential Skills Test, were significantly related to one another. The findings
showed that no significant relationship existed between principal leadership style and
student academic achievement.
Studies Based on Teacher and Perceptions
Nine studies were reviewed in this section. In these studies, principal leadership
style was measured by using teacher and principal responses. Description of these
studies follows.
Graw (1980) examined the relationship between the leadership style of
secondary school principals and student academic achievement in Seoul, Korea. Graw
( 1980) translated the “Profile of a School” instrument to Korean and this version served
as measurement of principal leadership style. Student academic achievement was
defined as the student scores on Korea’s national college entrance examination. Graw
( 1980) found that the principals perceived their leadership style as “consistently
consultative” while the teachers perceived the leadership style of their principals as
“consistently benevolent authoritarian.” With respect to the test of correlation between
variables, results in the study suggested that there was no significant correlation
between student achievement scores and principal leadership style.
Reproduced with permission of the copyright owner. Further reproduction prohibited without permission.

33
McMahon-Dumas (1981) related principal leadership style with reading gain
scores of students in the Washington, DC area. The study focused on two dimensions of
principal leadership style: Task Behavior and Relationship Behavior. The researcher
used the Leader Adaptability and Style Inventory to measure principal leadership.
Findings indicated no significant relationship between principal leadership style and
reading gain scores.
Matula (1986) examined the relationship between the grade eleven student
performance in reading comprehension and mathematics and the leadership style of
high school principals. Results indicated that: ( 1 ) age, years in education, years as
principal, and years in current position of high school principals had no significant
relationship with student outcomes; (2) based on teacher and principal perceptions,
most principals were evaluated to have leadership style characterized as “high task and
high people orientation;” and (3) the leadership style of the high school principals was
not significantly related to student performance.
Skilling (1993) studied the relationship between the leadership behavior of
principals of sixteen middle schools in a Michigan county and seventh grade student
reading achievement. Principals and teachers completed the Leader Behavior
Description Questionnaire (LBDQ) to evaluate principal leadership. Skilling (1993)
found that when principal perception was used to analyze the data, results showed no
statistically significant relationship between student reading achievement and total
leadership behavior of principals, but when teacher perception was used to analyze the
Reproduced with permission of the copyright owner. Further reproduction prohibited without permission.

34
data, results indicated a statistically significant relationship between the student reading
achievement and total leadership behavior of principals.
Larsen (1987) determined the impact of instructional leadership of elementary
school principals on student achievement in high-achieving schools (HAS) and
low-achieving schools (LAS). The researcher used the California Assessment Program
(CAP) to determine the achievement scores of 510 schools in southern California.
HAS were identified as schools scoring above the comparison score band in reading
and math while LAS were identified as those schools scoring below. The sample
consisted of eighty-nine principals and 421 teachers. Based on teacher responses,
results showed the principals in HAS demonstrated more instructional leadership
behaviors than those principals in LAS. Larsen (1987) also found that the degree of
discrepancy between principal and teacher responses was greater in LAS than in HAS.
It was concluded that instructional leadership behavior is an important predictor of
student achievement.
Krug (1987) related the instructional leadership behavior of suburban
elementary school principals with academic achievement of grades three and six
students. The principal and teacher subjects answered the Principal Instructional
Management Rating Scale (PIMRS) to assess instructional leadership of principals.
The California Assessment Program (CAP) provided data for student achievement. The
results indicated that there was a positive relationship between student achievement and
teacher ratings of principals on the PIMRS at the grade three level. Results also
indicated that there was a general agreement between teacher and principal perceptions
Reproduced with permission of the copyright owner. Further reproduction prohibited without permission.

35
on the principal instructional leadership behavior. Schools where teacher perception
was higher than principal perception had higher student academic achievement at the
grade three level, but had lower student academic achievement at the grade six level.
Collins (1988) examined principal leadership using a questionnaire that
measures seven instructional leadership functions: (1) evaluate the teaching process; (2)
monitor and evaluate student progress; (3) emphasize student achievement as the
primary outcome of schooling; (4) coordinate and control instruction; (5) coordinate
content, sequence, and materials of instruction; (6) provide structured learning
environment; and (7) initiate, promote, and maintain a continuous in-service program.
Based on teacher and principal perceptions, results showed that principal leadership had
a positive effect on student achievement. Results based on principal perception
indicated more positive effect than results based on teacher perception. In addition,
there was significant differences between teacher perception and principal perception
with respect to two instructional leadership functions, namely, evaluate the teaching
process and coordinate and control instruction.
Hardie (1993) used the Leader Effectiveness and Adaptability Description
(LEAD) to measure principal leadership. Hardie ( 1993) also utilized the Cognitive
Abilities Test (CAT) and the FTBS to measure student achievement. Results based on
teacher perception suggested a significant relationship between principal instructional
leadership and student academic achievement, particularly in the mathematics area.
Wongtrakool (1996) examined the relationship between instructional leadership
behaviors of principals student achievement in 101 private lower secondary schools in
Reproduced with permission of the copyright owner. Further reproduction prohibited without permission.

36
Thailand. The leadership questionnaire utilized in the study has five categories: ( 1 )
curriculum, (2) instruction, (3) administration, (4) school climate, and (5) parent/
community. Results suggested that principals perceived themselves as high on
administration, school climate, curriculum, and instruction and average on the
parent/community category. Teachers perceived their principals as high on
administration and school climate and average on curriculum, instruction, and
parent/community. The researcher suggested that based on both teacher and principal
perceptions, there was insufficient evidence to imply that there was a relationship
between principal instructional leadership and student academic achievement in
Thailand.
Sub-Summarv
There were thirty-one studies reviewed in this section. These studies examined
the relationship between principal leadership style and student academic achievement in
various educational settings. Some studies based their analysis on teacher perception,
some just used principal perception, and some used both principal and teacher
perceptions as basis for analysis.
The following observations were made from this particular review: First, the
majority of the studies reviewed supported the assumption that there is a significant
relationship between principal leadership style and student academic achievement.
This finding was consistent with all the transformational leadership studies reviewed.
Furthermore, significant relationship between principal leadership and student
achievement exists in all the qualitative studies included in this review.
Reproduced with permission of the copyright owner. Further reproduction prohibited without permission.

37
Second, results from the studies that measured instructional leadership of
principals (Stroud, 1990; Parker, 1991; Dilworth, 1989; Kim, 1989; Couch, 1991;
Larsen, 1987; Hardie, 1993; Collins, 1988; Krug, 1987; Wongtrakool, 1996) were not
consistent. There were studies that reported a significant relationship between
instructional leadership of principals and student achievement; other studies reported
the opposite. These inconsistent findings may support the statement that instructional
leadership in school principalship has outlived its usefulness (Poplin, 1992). According
to Liontos (1993), instructional leadership is narrow because it overlooks the
professional growth of teachers. Sergiovanni (as cited in Brandt, 1992) states that
teachers should be the legitimate instructional leaders and principals should be the
leaders who will develop the instructional leadership among their teachers.
Third, there were studies that reported discrepancies between teacher and
principal perceptions (Hardie, 1993; Skilling, 1993) with respect to the evaluation of
principal leadership. Results based on teacher perception usually showed a significant
relationship between principal leadership style and student achievement, while results
based on principal perception showed no significant relationship between these two
variables. A possible explanation for this discrepancy is that principals may be
overrating themselves when they evaluate their leadership style. Hofstede's (1984)
statement, ''people are more accurate in describing others than in describing
themselves” (p. 76), may hold true here.
Reproduced with permission of the copyright owner. Further reproduction prohibited without permission.

38
Leadership in the Philippines
Background
Studies on principal leadership in the Philippines were not found from the
databases of ERIC, DAI, and LOLA. As a last resort, studies from the book,
“Foundations of Administration and Supervision for Philippine Schools,” written by
Ruiz (1972), were reviewed instead. These studies were done in the context of the
barrio (rural) leadership patterns. In addition, these studies date back to the 1950s and
1960s suggesting that they are relevant in describing what leadership was like in the
Philippines back then. However, since the researcher of this present study is a Filipino,
she has observed that these “old” findings still holds true today. Nevertheless, this
particular review can not be considered conclusive until recent literature verifies the
results of the studies included here. Discussion of the five studies reviewed in this
section follows.
Review
Sibley (as cited in Ruiz, 1972) studied the characteristics of political leaders in
Ma-ao, a rural town in the Philippines. The researcher concluded that leaders in the
barrios (rural towns) are chosen into their leadership positions based on the following
qualifications: personality traits, charisma, high socio-economic status, real and ritual
kinships, age, and respect for conformity to values and traditions. If certain people
satisfy these qualifications, their town-mates impose the leadership positions on them.
However, when political leadership is at the national level, there is no need for any kind
of impositions because the would be leaders actively pursue the leadership roles for
Reproduced with permission of the copyright owner. Further reproduction prohibited without permission.

39
themselves. However, at the end, the leaders are followed by their constituents if the
leaders nurture smooth personal relationships with their followers (Sibley, as cited in
Ruiz, 1972).
In the study conducted by Villanueva (as cited in Ruiz, 1972), it was concluded
that leaders are selected by the people because they: ( 1 ) belong to known and
influential families, (2) have harmonious relationship with their town-mates, and (3)
possess the socially prescribed personality traits of paladamay (being sympathetic to
other people's plights) and pakikisama (maintaining smooth interpersonal relationships
with others).
The importance of personality traits of leaders was also implied in the study of
formal organizations by Hollnsteiner (as cited in Ruiz, 1972). The researcher found
that people align themselves with their leaders based on the personality of their leaders
and not based on the principles of the organizations.
With respect to leader motivation, Ruiz (1972) found that there seems to be a
tendency for some leaders to practice the concept of ningas kogon. The concept of
ningas kogon was derived from the way a cogon grass fire bums. “It bums very
brightly and rapidly when it is started, but it dies out just as quickly” (Ruiz, 1972, p.
154). Thus, when leaders practice ningas kogon, this means that leaders show a high
degree of enthusiasm at the start of any project, but this enthusiasm dies away quickly
after a few days, weeks, or months. The degree of enthusiasm is not maintained
throughout the completion of the project (Ruiz, 1972).
Reproduced with permission of the copyright owner. Further reproduction prohibited without permission.

40
Hidalgo (as cited in Ruiz, 1972) also found ningas kogon being practiced by two
types of leaders, namely, the status leaders and ± e functional or volunteer leaders. The
author found that both leaders started community plans and projects with high level of
enthusiasm and motivation. Unfortunately, both leaders also failed to carry these
community plans to the end because their enthusiasm died down in the process.
Sub-Summarv
The five studies reviewed in this section imply that leadership in the Philippines
is personal in nature. Leaders must maintain smooth personal relationships with their
followers in order to get followers' compliance. Personality of the leaders also plays an
important factor in getting the approval of followers which eventually affects leader-
follower relationship. It is possible that followers obey their leaders because their
leaders are kind to them or have a sense of humor and not because of organizational
goal achievement. However, organizational goal achievement seems to be a difficult
task for leaders because, as suggested in the reviewed studies, leaders cannot sustain
their motivation or enthusiasm on a given project.
Summary
There was a total of forty-five studies reviewed in this section. Nine studies
dealt with the relationship between principal transformational leadership and student
academic achievement. Thirty-one studies dealt with the relationship between other
principal leadership styles, such as, instructional leadership, and student academic
achievement. Five studies were about leadership in the Philippines.
Reproduced with permission of the copyright owner. Further reproduction prohibited without permission.

41
The majority of the studies reviewed in this section showed that principal
leadership can impact student academic achievement. Studies on transformational
leadership, described as the leadership for the 21st century, overwhelmingly reported a
significant relationship with student academic achievement, except for one study that
was conducted in Singapore which defined student achievement as the percentage of
graduating students (refer to Koh, et al., 1995). Studies on instructional leadership, on
the other hand, did not report consistent findings. Some studies showed significant
relationships and some did not.
Perceptions of teachers and principals can affect the outcome of a study.
Studies that only used principal perception reported no relationship between principal
leadership and student achievement. Furthermore, principal perception seemed to be
higher than teacher perception. Thus, perception difference between teachers and
principals should be considered when studying the relationship between principal
leadership and student achievement.
Philippine leadership seems to be personal in nature. Leaders nurture their
relationship with their followers by maintaining smooth personal relationship with
them. Transformational leaders also nurture leader-follower relationship. This implies
that leadership in the Philippines might be explained by the transformational leadership.
The next chapter describes the methodology used in this study. This includes
sampling procedures, data collection procedures and data analysis. A background on
the Philippines is also discussed in the next chapter.
Reproduced with permission of the copyright owner. Further reproduction prohibited without permission.

CHAPTER 3 - METHODOLOGY
Overview
This study investigated the relationship between principal leadership style
(transformational, transactional, or laissez-faire) and student academic achievement in
the Philippines. A revised Multifactor Leadership Questionnaire - 5R (MLQ - 5R)
served as the measure of principal leadership style. The National Elementary
Assessment Test (NEAT) served as the measure of student academic achievement.
Detailed discussion of the sampling procedures, variables, instrumentation, data
collection procedures, and data analyses of the study follows.
Sampling Procedures
Setting - The Philippines
Background
The study was conducted in the Philippines. A number of people has little
knowledge about the Philippines. Thus, in the first part of this section, some
background information (geography, population, people, race, language, government,
and education) about the Philippines is briefly discussed.
First, the Philippines is part of southeast Asia (see map 1, Appendix A). It is
composed of 7,107 islands and islets, of which only 2,000 are inhabited. These islands
and islets are grouped into three main islands: Luzon, Visayas, and Mindanao. Luzon
forms the northern region of the Philippines, while Visayas and Mindanao form the
central region and southern region, respectively (see map 2, Appendix B) (Peters, 1994;
Kurian, 1992; Peplow, 1991). The Philippines has a total land area of 115,830 square
42
Reproduced with permission of the copyright owner. Further reproduction prohibited without permission.

43
miles. Luzon is the biggest island at 54,592 square miles. It represents forty-seven
percent of the Philippine territory. Mindanao is the second largest island at 39,382
square miles, representing thirty-four percent of the Philippines. The Visayan Islands at
21,621 square miles represent nineteen percent (Kurian, 1992; Peplow, 1991).
Second, based on a 1996 census, the population of the Philippines was
estimated at 74,480,848 million (CIA, 1997). Luzon has the highest population density
where about half of the Filipino population resides. Manila (the capital of the
Philippines and located in Luzon) alone has a population of about ten million which
represents about thirteen percent of the national population and yet Manila only
occupies less than one percent of the Philippine territory. This means that Manila’s
population density is about 89,536 persons per square mile as against the national
average of 471 (CIA, 1997; Peters, 1994; Kurian, 1992; Peplow, 1991). Some of the
reasons for this high population density in Manila are: ( 1 ) internal migration from rural
areas and (2) high birth rate. The Visayan Islands are experiencing the worst population
decline due to this internal migration. However, despite this phenomena, about sixty
percent of all Filipinos still live in rural areas (CIA, 1997; Peters, 1994; Kurian, 1992;
Peplow, 1991).
Third, the Philippines is the only Christian country in Asia. About ninety-two
percent of the Filipino people are Christian of which eighty-three percent are Roman
Catholics, and about five percent are Muslims. The Filipino Christians predominate in
Luzon and the Visayas and now make up the dominant population in Mindanao. Most
Filipino Muslims make their homes in Mindanao (CIA, 1997; Peplow, 1991).
Reproduced with permission of the copyright owner. Further reproduction prohibited without permission.

44
Fourth, the Filipinos are racially homogeneous since majority of the Filipino
people are of the Malay race. This is rooted in the descent of the Filipinos from a small
group of migrants from Southeast Asia. These migrants were of Proto-Malay
(Indonesian) and Deutero-Malay (Southern Mongoloid) races who pushed out the early
settlers of the Philippines. Colonizations in the Philippines and inter-marriages with
non-Malays added some variety to the blood lines (e.g. Spanish, American, Chinese,
Arab) of the Filipinos, but this did not alter the Malay racial stock composition of the
Filipinos and thus retaining the racial homogeneity in the Philippines (Kurian, 1992).
Fifth, the Philippines has more than 100 ethno-linguistic groups. However,
eight major dialects are spoken by about ninety percent of the population. These eight
are: Cebuano, Tagalog, Ilocano, Hiligaynon or Ilonggo, Bicol, Waray-Waray,
Pampango, and Pangasinan. Tagalog is prevalent in Manila and Central Luzon.
Cebuano is common in most of Mindanao. Ilocano is widespread in Northern Luzon.
Bicol is the dialect in Southern Luzon. Cebuano, Hiligaynon, and Waray-Waray are
sometimes grouped as Visayan languages (Peters, 1994; Peplow, 1991).
The official languages of the Philippines are Pilipino {Tagalog-bascd) and
English. Pilipino is the national language and English serves as the universal language
of government, mass communication, commerce, and higher education. Close to forty-
five percent of the Philippine population is literate in English. In several provinces (or
states), the number of English speakers exceeds that of Pilipino speakers. Nevertheless,
more than fifty-five percent of the population can speak Pilipino (Kurian, 1992).
Reproduced with permission of the copyright owner. Further reproduction prohibited without permission.

45
Sixth, the Philippines is a democratic and republican state headed by a
president. It has a highly centralized form of government. Administratively, the
Philippines is divided into 12 regions (Region I to Region XU) and three autonomous
regions (Cordilleras, Muslim Mindanao, and Manila identified as the National Capital
Region). Manila holds the seat of power. For administrative purposes, the Philippines
is subdivided into seventy-three provinces which consist of sixty chartered cities and
1,532 municipalities and which in turn consist of barangays or villages (the most basic
unit of government). Provinces are headed by governors, cities and municipalities are
headed by mayors, and barangays are headed by barangay captains (Peplow, 1991).
Last, the educational system in the Philippines is highly centralized. School
directives come from the Department of Education, Culture, and Sports (DECS).
DECS supervises the basic education in both private and public schools. For
administrative purposes, the thirteen regions and the three autonomous regions in the
Philippines are subdivided into school divisions and each school division is headed by a
school superintendent. (Refer to Appendix C for a complete list of regions and school
divisions.)
Selection Process
This study was conducted in the public schools of two neighboring school
divisions. Both school divisions are located in Luzon, but each belong to different
regions. Following is an explanation of how the settings for this study were selected.
Island. Luzon was selected as the general research area o f this study because of
the following reasons: ( 1 ) of the three main island groupings in the Philippines, Luzon
Reproduced with permission of the copyright owner. Further reproduction prohibited without permission.

46
is the most accessible to the researcher because she is based in Luzon. The researcher
would have needed to travel from Luzon to Visayas or Mindanao by air or by sea; (2)
the researcher can only speak Tagalog and thus, can not speak any other Philippine
dialects. Although Tagalog is the national language in the Philippines, not all Filipinos
are fluent in it. Most regions with Tagalog as the main language are located in Luzon
and thus these regions composed the initial setting pool of the study; (3) Luzon is the
most populated island in the Philippines and thus, more public schools are located in
this area as compared to Visayas and Mindanao; and (4) Manila, the capital of the
Philippines, is in Luzon.
Regions and School Divisions. Of the Faga/og-based regions located in Luzon.
the National Capital Region (NCR) was selected because it represents Manila. The
NCR is composed of ten school divisions. One NCR school division is a division
composed of three cities, namely, Valenzuela. Malabon. and Navotas. This school
division is called Valmana which is an acronym for the three cities just mentioned.
Thus, the Valmana school division was chosen as the first setting of this present study
because, according to Mr. Diwa Guinigundo, director of economic research in the
Philippines, Valmana is characterized as the “most backward and the slowest growing
area in Manila and therefore has the highest need for increased student achievement.”
Bulacan served as the second setting of this study. It is identified as a province
north of the NCR. Bulacan belongs to Region HI. It was selected mainly because it is
adjacent to the northern part of Valmana.
Reproduced with permission of the copyright owner. Further reproduction prohibited without permission.

47
Generally speaking, Valmana is considered more urbanized than Bulacan
because the former has more big business establishments and more people living in
close proximity than the latter. With respect to public schools, Valmana and Bulacan
are similar to one another because both have the same curriculum, the same school
systems, and the same student SES. Most of the students come from the same socio
economic background. The majority of the public school students either come from the
middle or low-income families.
Sub-Summarv
This study was conducted in the public schools of Valmana and Bulacan.
Valmana is part of the NCR and Bulacan is part of Region HI. Both regions and thus,
both school divisions, are located in Luzon. Hereafter, for the purpose of simplicity,
Valmana Is referred to as district 1 and Bulacan as district 2.
Sample
Background
In September 1995, in order for the researcher to conduct this study, she
personally sought the permissions of the superintendents of districts I and 2. The
superintendents were informed of the nature of this research and were guaranteed
anonymity of the principals and teachers included in this study. District 1
superintendent immediately granted permission for this study to be conducted in his
district, but he still wanted a written letter stating the researcher's agenda. A copy of the
letter which was submitted to the superintendent of district 1 is in Appendix D. A few
days after submitting the requested letter, district 1 superintendent gave the researcher a
Reproduced with permission of the copyright owner. Further reproduction prohibited without permission.

48
letter endorsing this study (see Appendix E). District 2 superintendent also gave her
permission upon the researcher's initial verbal request. She didn't need a written letter
from the researcher. Since both superintendents agreed to this study, lists of names of
all public school principals (elementary and secondary) were obtained from their
respective district offices. The lists served as the starting point for the selection process
of this study's sample.
The next step taken by the researcher was to determine the percentage of school
principals to be randomly selected for this study. The percentage was actually
determined for the researcher by the district 2 superintendent who “strongly suggested”
twenty-percent. This implied that no more than twenty-percent of district 2 principals
could be randomly selected by the researcher. The researcher had no option to increase
this number and so she agreed to the twenty-percent. Thus, twenty percent of principals
from district 1 and twenty percent of principals from district 2 were randomly selected
for this study. The selection process is discussed in detail below.
Selection Process
Principals. The steps followed in randomly selecting the principal sample were:
( 1 ) alphabetize the names of the principals; (2) calculate values: N = total number of
principals, n = 20 % of N, and x = N 4- n; and (3) select every x'*’ name from the list of
the alphabetically arranged names of principals until the n value is reached.
During the School Year (SY) 1995-1996, district 1 had seventy-eight
elementary and thirteen secondary public school principals; district 2 had 127
elementary and twenty-eight secondary public school principals. To illustrate the steps
Reproduced with permission of the copyright owner. Further reproduction prohibited without permission.

49
followed in the random selection of principals, take for example the seventy-eight
elementary principals in district 1. First, the names of the seventy-eight principals were
alphabetically arranged. Second, the following values were determined: N = 78, n =
16, and x = 5. Last, every 5“* person on the list of the alphabetically arranged
principals' names were selected until the 16* name was picked. These steps were also
followed in selecting the rest of the principal sample. Table 3.1 shows a summary of
the principal sample.
Table 3.1
Teacher and Principal Samples
Elementary School Secondary School1-----------------------------1
District Teacher Principal Teacher Principal
District 1 505 16 178!
3 !
j District 2 814 25 135 6 i
! District 1 & 2 1.319 41 313 ^ ]
Teachers. The teacher sample was not randomly selected. This sample was
composed of all the teachers under the supervision of the randomly selected principals.
The teacher sample is the total teacher population of the schools headed by the principal
sample during the SY 1995-1996. Table 3.1 also shows a summary of the teacher
sample.
Schools. There was no selection process for the school sample. The schools
included in the study were the schools headed by the randomly selected principals. The
schools represented by the selected principals varied in student population size. Some
Reproduced with permission of the copyright owner. Further reproduction prohibited without permission.

50
schools have less than 100 students and some have more than 1,000 students. With
respect to student demographics, the students of these schools come from low-income
families or middle-class families.
Final Sample
Despite having gathered data for nine secondary schools, it was decided that the
entire secondary school sample be excluded in this study due to its small sample size.
There was no plan to combine the nine secondary schools with the forty-one elementary
schools because there might be a difference in school culture between the two.
Furthermore, the Philippines have fewer secondary public schools than elementary
public schools. In district 1, there is only thirteen secondary schools compared to 78
elementary schools. In district 2, there is only twenty-eight secondary schools
compared to 127 elementary schools. The reason for this is that not all elementary
public school students continue their secondary education in public schools. Some go
to private schools, but most completely drop out of school due to financial constraints
in their respective families. Thus, principal leadership is more crucial in elementary
schools than in secondary schools. As a result only elementary schools were included
in this study. In addition, the elementary school sample was not divided by school
district due to the small sample size if analyzed by district and so this study was
conducted in forty-one elementary public schools in the Philippines.
Variables
The principal leadership style is the predictor variable in this study while
student academic achievement is the criterion variable. There were three control
Reproduced with permission of the copyright owner. Further reproduction prohibited without permission.

51
variables considered in this study and they also served as predictor variables along with
principal leadership style. The control variables considered were teacher educational
background, student population, and student socio-economic status (SES).
Instrumentation
Revised Multi factor Leadership Questionnaire - 5R
Background
A revised Multifactor Leadership Questionnaire - 5R (MLQ-5R) served as the
measure of the leadership style of forty-one elementary public school principals in the
Philippines. The original MLQ - 5R was developed by Bass and Avolio in 1990. It
assesses the frequency of leadership behaviors using a five-point Likert scale ranging
from 5 = “Frequently, if not always” to 1 = “not at all.” It has been used in the military,
business, industrial, and medical fields, as well as, in the educational field. The original
MLQ - 5R was selected to measure transformational leadership because of its usage in
Asian countries. It has been used to measure principal leadership style in Singapore
(Koh, Steers, & Terborg, 1995) and Taiwan (Chu, 1994).
The original MLQ - 5R consists of 73 items. Seventy items measure the degree
of transformational leadership, transactional leadership, and laissez-faire exhibited by
the leader being evaluated. Three items measure the organizational outcomes of extra
effort, effectiveness, and satisfaction. For the purpose of this study, these three items
were eliminated in the revised MLQ - 5R.
Transformational leadership, as mentioned before, has four components
(charisma, inspiration, intellectual stimulation, and individualized consideration) while
Reproduced with permission of the copyright owner. Further reproduction prohibited without permission.

52
transactional leadership has two components (contingent reward and management-by-
exception). Each of these components, along with laissez-faire, is measured with ten
items in the original MLQ - 5R (Bass & Avolio, 1990).
Reliability and Validity
Bass and Avolio (1990) performed a test-retest reliability analysis over a six-
month period on the original MLQ - 5R. Their analysis was based on ratings by 193
followers and thirty-three leaders. Reliability estimates for ratings by followers ranged
from .52 (contingent reward) to .85 (satisfaction); For ratings by leaders, the reliability
estimates ranged from .44 (contingent reward) to .74 (management-by-exception). Bass
and Avolio ( 1990) also tested for the internal consistency of the original MLQ - 5R
items using as samples 1,006 followers and 251 business and industrial leaders.
Coefficient alpha reliability estimates ranged from .77 (laissez-faire) to .90 (charisma)
for followers' ratings and from .60 (inspiration and laissez-faire) to .83 (charisma) for
leaders' self-ratings.
Another study was conducted using data obtained from 1,053 followers who
rated the leaders in their respective firms. Coefficient alphas for the transformational
leadership components were .89 for charisma, .76 for inspiration, .86 for intellectual
stimulation, and .89 for individualized consideration. Coefficient alphas for the
transactional components were .89 for contingent reward and .73 for both active and
passive management-by-exception. Coefficient alpha for laissez-faire was .79 (Bass,
1998).
Reproduced with permission of the copyright owner. Further reproduction prohibited without permission.
53
The components of transformational and transactional leadership and laissez-
faire have been construct validated by using “factor analyses, observations, interviews,
and descriptions of the ideal leader that people carry around in their heads” (Bass, 1998,
p. 11). Based on Bum’s (1978) concept of transformational and transactional
leadership, 141 behavioral statements were developed. Seventy-three of these
statements were judged to be transformational or transactional by eleven experts. More
factor analyses and more recent least squares were performed and the results supported
the leadership components identified in the original MLQ - 5R (Bycio, Hackett, &
Allen, 1995; Howell & Avolio, 1993; Bass, 1998).
Pilot Studv
Based on an extensive literature review search, the original MLQ - 5R has not
been used to measure principal leadership in the Philippines. To determine whether the
original MLQ - 5R can easily be understood in English by Filipinos, a pilot study was
conducted in September 1995. The sample included thirty-one elementary and
secondary school teachers of a private school in Manila. The teachers were asked to
evaluate the clarity of the original MLQ - 5R (70 items) as they assess the leadership
behavior of their school principal. It used a five-point Likert scale ranging from 1 =
“Always” to 5 = “Not at all.” Distribution and discussion of the instrument happened
on the same day. The teachers answered and evaluated the instmment in one hour at
most.
In an open discussion between the teachers and the researcher, the teachers
reported that in general, the original MLQ-5R is easily understood in English and so the
Reproduced with permission of the copyright owner. Further reproduction prohibited without permission.

54
language of the instrument can be retained. However, they suggested some changes in
fifteen items that sounded awkward to them. One particular example, the teachers
suggested a change in one item containing the word “spur.” The original item states
“has a vision that spurs me on.” The teachers were not familiar with the definition of
“spur.” Thus, this item was changed to “... has a vision that motivates me.” Appendix
F presents the revised items and Appendix G shows the revised MLQ - 5R (Rater
Form) used in this study. Furthermore, the original MLQ - 5R was evaluated by a
superintendent in the Philippines. The superintendent reported that the items in the
instrument seem to measure what they tended to measure.
The National Elementary Assessment Test
The National Elementary Assessment Test (NEAT) served as the measure for
student academic achievement in the Philippines. The NEAT is a 160-item, multiple-
choice test designed to assess what grade six students have learned in four subject areas,
namely, mathematics, science, English, and social studies. According to former
Philippine Education Secretary Armand Fabella, the NEAT was conceived in 1994 to
primarily measure the improvement in elementary education and to determine the
competence of students and of their respective schools. Taking the NEAT is a
requirement for grade six students to be admitted to high school, however, passing it is
not (passing grade is 75). The NEAT grade makes up one-sixth of a student's final
rating grade. In 1995, using 14,719 grade six students, reliability estimates for the
NEAT scales were .84 for social studies, .85 for mathematics and English, and .87 for
science (National Educational Testing and Research Center, 1997).
Reproduced with permission of the copyright owner. Further reproduction prohibited without permission.

55
Demographic Information Sheet
The demographic data sheet asks from the teacher and principal subjects for
information about their age, gender, educational background, and years of experience as
teachers or as principals. This data sheet was appended to the revised MLQ - 5R. The
demographic data sheet is shown in Appendix G.
Data Collection Procedures
Background
Data collection began in October 1995, which was in the middle of the SY
1995-1996 in the Philippines. Data were collected for; (1) principal leadership style as
measured by the revised MLQ-5R; (2) age, gender, educational background, and years
of experience as teachers/principals as measured by a demographic information sheet;
(3) grade six student academic achievement as measured by the NEAT; and (4) student
and teacher population, SES of the grade six students as provided by the schools or by
the district offices. Description of the data collection procedures follows.
Principal Leadership Stvle and Demographic Information
Individual packets were prepared for distribution to each of the forty-one
elementary public schools. The packets were identified by school name. Numbers of
teachers in each school were also determined to know how many questionnaires would
be included in each packet. Each packet consisted of the revised MLQ - 5R (Rater
Form) that would be distributed to teachers and the revised MLQ - 5R (Self-Rating
Form) that would be distributed to principals. The demographic information sheets
were attached to the revised MLQ - 5R forms.
Reproduced with permission of the copyright owner. Further reproduction prohibited without permission.

56
The packets for district I schools were all hand-delivered to each of the school.
The letter of endorsement of the district 1 superintendent was presented to each of the
school principal. The purpose of the study and instructions regarding the revised MLQ
- 5R were explained to the principals. All the principals assumed the responsibility of
distributing the revised MLQ - 5R (Rater Form) to tbeir teachers. All the principals and
teachers returned the completed questionnaires within two weeks.
The packets for district 2 schools were hand-delivered to the office of the
superintendent. The superintendent wanted her office to distribute the packets to each
of the schools and so the instructions regarding who would complete the questionnaires
were relayed to the superintendent and her assistants. The completed questionnaires
were picked up from the superintendent's office after three weeks.
Student Academic Achievement and Student Demographics
In February 1998, the superintendents of district 1 and district 2 were contacted
by telephone. The researcher asked another permission to collect additional data from
their schools. Permission was granted and so sometime in February 1998,
representatives of the researcher went to each of the district 1 schools to gather the
additional information needed for the study. Data on district 2 schools were submitted
by the superintendent's office. The data collected were: ( 1 ) overall average score on
the NEAT that was administered to grade six students during SY 1995-1996; (2) SES
of the grade six students during SY 1995-1996; and (3) grade six student population
during SY 1995-1996. Student SES was classified as upper, middle, and lower. In this
study, the three SES groups were defined based on annual family income: lower SES -
Reproduced with permission of the copyright owner. Further reproduction prohibited without permission.

57
family annual income of under 60.000 pesos (approximately, $1,500); middle SES -
60.000 to 250,000 pesos (approximately, $1,500 to $6,250); and upper SES - over
250.000 pesos (approximately, $6,250). As of June I, 1998, the peso-dollar exchange
rate is approximately, 40 pesos per one dollar.
Data for these variables were collected within three weeks. Unfortunately, some
schools did not have records on the NEAT scores and the SES of their grade six
students due to lost records caused by flooding and due to not keeping old student
records in file.
Data Analyses
Background
The S AS system was utilized in analyzing the data gathered in this study. Data
sets were entered in the SAS database where SAS can perform different statistical
analyses. The major analyses used in this study were descriptive statistics, MANOVA,
paired samples t tests, Pearson-moment correlation, Cronbach's alpha, and multiple
linear regression. These analyses were selected based on the four research questions
posited in this study. Table 3.2 shows the research questions and the corresponding
statistical analyses used.
Descriptive $tatistics
According to Hatcher and Stepanski (1994), descriptive statistical analysis
measures the characteristics of the population being studied. Means and standard
deviations on the three principal leadership styles (transformational, transactional, and
Reproduced with permission of the copyright owner. Further reproduction prohibited without permission.

58
laissez-faire) were determined to answer research question 1. Furthermore, profile
of the respondents would be reported through descriptive statistics.
Table 3.2
Research Questions and Statistical Analyses
Research Questions M ajor Statistical Analyses
I. What leadership style (transformational, transactional, or laissez-faire) best describe the school principals in the Philippines?
Descriptive Statistics
2. Is there a significant difference between teachers and principals with respect to their perceptions o f the leadership style (transformational, transactional, or laissez-faire) of school principals in the Philippines?
M ANOVA, Paired-Samples T-Test
3. Is there a significant relationship between principal leadership style (transformational, transactional, or laissez-faire) and student academic achievement in the Philippines?
Multiple Linear Regression
4. W hat principal leadership style (transformational, transactional, or laissez-faire) can be considered to be a relatively important predictor of student academic achievement in the Philippines?
Multiple Linear Regression
MANOVA and Paired Samples T-Tests
The multivariate analysis of variance (MANOVA) tests for the significance of
the difference between two or more groups of subjects. MANOVA is appropriate to
use when the analysis involves a single predictor variable and multiple criterion
variables (Hatcher & Stepanski, 1994). In this study, MANOVA helped answer
research question 2. The predictor variable was the perception variable (teacher and
principal) and the criterion variables were the three principal leadership styles, namely,
transformational, transactional, and laissez-faire. Furthermore, the paired-samples t-test
Reproduced with permission of the copyright owner. Further reproduction prohibited without permission.

59
was used to determine whose perception (teacher or principal) was higher than the other
across the three principal leadership styles. Paired-samples t-test was used instead of
independent-samples t-test because the teachers were not randomly selected in this
study. The teacher sample consisted of teachers under the direct supervision of the
randomly selected principals. Thus, teacher sample was not an independent sample.
Multiple Linear Regression
Multiple regression can determine: ( 1) the statistical significance of the
relationship between the criterion variable and predictor variables (taken as a group).
(2) how much variance in the criterion variable is accounted for by the predictor
variables, and (3) which predictor variables are relatively important predictors of the
criterion variable (Hatcher & Stepanski, 1994). This analysis is useful in answering
research questions 3 and 4. In this study, the criterion variable was the grade six
student academic achievement while the predictor variables were principal leadership
style (transformational, transactional, or laissez-faire), teacher educational background,
grade six student population, and grade six student SES. Three multiple regression
models were used to analyze the data because three principal leadership styles were
measured in this study,. These models are shown in Table 3.3.
Supplemental Statistical Analvses
Pearson-Product Moment Correlation
Pearson product-moment correlation was utilized in this study to assess
bivariate correlation between the criterion variable and each of the predictor variables.
As mentioned before, student academic achievement was the criterion variable.
Reproduced with permission of the copyright owner. Further reproduction prohibited without permission.

60
Principal leadership style, teacher educational background, student population, and
student SES were the predictor variables.
Table 3.3
Multiole Regression Models
Model Equation
Model 1 Student Academic Achievement = Transformational Leadership + Teacher Educational Background + Gr. 6 Student SES + Or. 6 Student Population
Model 2 Student Academic Achievement = Transactional Leadership + Teacher Educational Background + Gr. 6 Student SES + Gr. 6 Student Population
Model 3 Student Academic Achievement = Laissez-faire + Teacher Educational Background + Gr. 6 Student SES + Gr. 6 Student Population
Cronbach Coefficient Alpha
The Cronbach coefficient alpha provided the internal consistency index of
reliability for the leadership components (charisma, inspiration, intellectual stimulation,
individualized consideration, contingent reward, management-by-exception, and
laissez-faire) identified in the original MLQ - 5R. Reliability estimates for the original
MLQ - 5R were determined by Bass and his associates in their studies (Bass, 1998).
However, reliability estimates reported in this study were for the revised MLQ - 5R.
Through Cronbach coefficient alpha, the revised MLQ - 5R becomes more reliable as a
leadership instrument in the Philippines.
Summary
This study examined the relationship between principal leadership style
(transformational, transactional, or laissez-faire) and student academic achievement in
the Philippines. Three control variables were considered as predictor variables in the
Reproduced with permission of the copyright owner. Further reproduction prohibited without permission.

61
study. Data were collected in 1995 and 1998. Vaiious statistical analyses were used to
answer the four research questions posited in this study. The results based on the
statistical analyses utilized in this study are reported in the next chapter.
Reproduced with permission of the copyright owner. Further reproduction prohibited without permission.

CHAPTER 4 - RESULTS
Overview
This study examined the relationship between principal leadership style
(transformational, transactional, or laissez-faire) and student academic achievement in
thirty-six elementary public schools in the Philippines. The leadership style of the
principals was measured by using the revised MLQ - 5R; the academic achievement of
the grade six students was measured by determining their overall NEAT scores. Data
were collected during the SY 1995 - 1996 and SY 1997 - 1998. Cronbach's alpha,
Pearson-moment correlation, descriptive statistics, MANOVA, paired-samples t test,
and multiple linear regression were utilized to analyze the data. Results based on these
analyses are described in this chapter.
Response Rate
As discussed in the previous section, original samples included in this study
were forty-one principals and 1,319 teachers from forty-one schools. However, when
data were finally collected from the samples, thirty-eight principals returned the revised
MLQ - 5R (Self-Rating Form) and 1,203 teachers completed the revised MLQ - 5R
(Rater Form). Of the questionnaires returned by the teachers, only 1,185 were
determined to be useable. In regards to data on student academic achievement, only
thirty-six schools gave information on the overall NEAT scores of their grade six
students. The other five schools failed to provide NEAT scores because some schools
lost their files due to flooding and some schools do not keep old student records on file.
62
Reproduced with permission of the copyright owner. Further reproduction prohibited without permission.

63
Student academic achievement is an important focus in this study and thus, to
remain consistent with respect to the number of schools to be analyzed, it was decided
to eliminate from the statistical analyses the five schools that didn’t have information
on student academic achievement. Table 4.1 summarizes the response rate for each
sample.
Table 4.1
Sample Response Rate
Sample InitialSample
Size
No. o f Respondent
(%) UseableData
(%) FinalSample
Size
(%)
Principal 4, 38 92.68 38 92.68 36 87.80
Teacher 1,319 1,203 91.21 1,185 89.84 1,057 80.14
SchoolL
41 36 87.80 36 87.80 36 87.80
Profile of Respondents
The majority of the principals in this study were female, between the ages of 51
and 60, and had either a Master’s or Doctoral degree. They had an average of 10 years
of administrative experience. The majority of the teachers were also female. They
were 50 years old or younger, had at least a bachelor's degree, and had a combined
average of fourteen years teaching experience. Table 4.2 shows the percentages on the
respondent demographic variables while Table 4.3 shows the means and standard
deviations for age range, educational background, and years of experience.
Reproduced with permission of the copyright owner. Further reproduction prohibited without permission.

64
Table 4.2
Profile of Respondents
Variable Principals Teachers
G ender
Female 71.9% 91.1 %
Male 28.1 % 8.9%
Age R ange
2 0 -3 0 0 % 26.6 %
31 -4 0 6.1 % 23.2 %
4 1 -5 0 27.3 % 30.1 %
51 -6 0 60.6% 17.6%
6 1 -7 0 6.1 % 2.5%
E ducational B ackground
Bachelor’s Degree 9 .4% 59.7 %
Bachelor’s w/ master units 18.8 % 28.3 %
Master’s Degree 28.1 % 11.3%
M aster’s w /doctoral units 15.6% 0.2%
Doctoral Degree 28.1 % 0.5%
Y ears o f Experience
0 - 5 37.6 % 26.6 %
6 - 10 34.4 % 18.3%
11-15 9.3 % 13.1 %
1 6 -2 0 6 .2% 14.5 %
21 -25 0 % 10.9 %
2 6 -3 0 6.2% 10.5 %
3 1 -3 5 3.1 % 4.2%
3 6 -4 0 3.1 % 1.9%
over 40 0 % 0.2%
Reproduced with permission of the copyright owner. Further reproduction prohibited without permission.

65
Table 4.3
Means and Standards Deviations for the Respondent Demographic Variables
Variable Principal Teacher
Age Range*
M 3.67 2.46
SD .69 1.13
Educational Background*
M 3.34 1.54
SD 1.33 .74
Years o f Experience**
M 10.44 14.21
SD 9.28 9.99Note. *Refer to Table 4.2 for the scales used for age range and educational background. **Mean scores on this variable are based on raw scores.
Profile of Schools
The schools in this study were mixed in terms of the total student population
size. As seen in Table 4.4, six schools have 751 to 1,000 students and another six
schools have over 2,250 students. The majority of the schools had eleven to forty
teachers and had fifty-one to 200 grade six students. Table 4.5 shows that about
seventy-four percent of the schools had grade six students belonging in the middle SES
group. In regards to the student academic achievement, the average overall NEAT
scores for all the schools was about seventy-nine, which is above the passing grade of
seventy-five. Table 4.4 shows in detail the frequency count and percentages for the
school demographic variables while Table 4.5 shows the means and standard deviations
for these variables.
Reproduced with permission of the copyright owner. Further reproduction prohibited without permission.
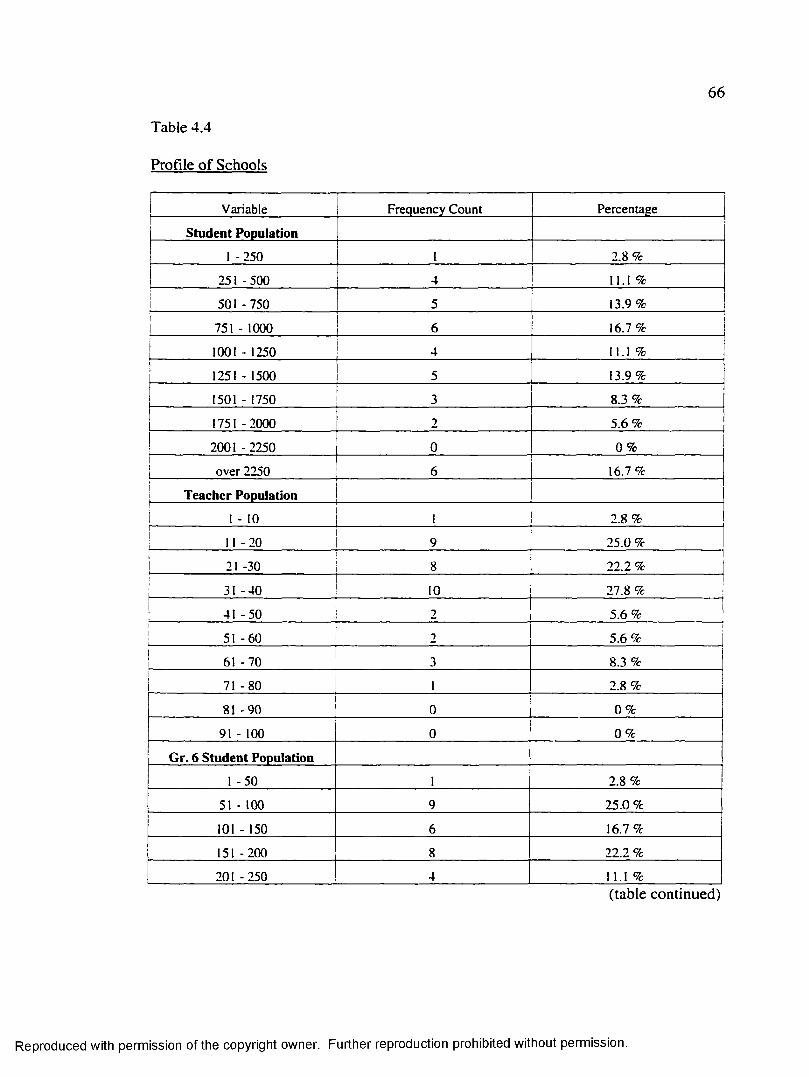
66
Table 4.4
Profile o f Schools
Variable Frequency Count Percentage
Student Population
I -250 2. 8 %
251 -500
13.9%501 -750
751 - 1000
1001 - 1250
13.91251 - 1500
8.3 %1501 - 1750
1751 -2000 5 .6%
2001 -2250 0 %
over 2250 16.7%
Teacher Population
2.8 %
25.0 %
22.2 %21 -30
27.8 %31 -4 0
41 -5 0 5.6%
51 -6 0 5.6%
61 -7 0
71 -8 0 2.8 %
81 -9 0 0 %
0 %91 - 100
Gr. 6 Student Population
1 -5 0 2 .8 %
25.0 %51 - 100
16.7%101 - 150
22.2 %151-200
201 -250(table continued)
Reproduced with permission of the copyright owner. Further reproduction prohibited without permission.

67
Variable Frequency Count Percentage
251 -300 5.6 %
301-350 5.6 %
3 5 1 -4 0 0 5 .6 %
4 0 1 -4 5 0 2.8 %
4 5 1 -5 0 0 2.8 %
Overall NEAT Scores
below 75 1 1 . 1 %
7 5 -8 0 23 63.9 %
81 -8 5 22.2%
8 6 -9 0 2.8 %
over 90 0 0 %
Table 4.5
Means and Standard Deviations for School Demographic Variables (n = 36 schools)
Variable M
Student Population* 5.42 2.71
Teacher Population* 3.72 1.72
Gr. 6 Student Population* 4.17 2.22
G r. 6 S tuden t SES**
Upper 0.94 3.72'
Middle 74.25 34.32
Lower 24.81 33.95
Overall NEAT Scores** 78.75 4.11
Note. *Refer to Table 4.5 for the scales used for the populations. **Mean scores for these variables are based on raw scores.
Reproduced with permission of the copyright owner. Further reproduction prohibited without permission.

68
Preliminary Analysis
Cronbach’s Coefficient Alpha
Background
The leadership style of principals in the Philippines was measured by using the
revised MLQ - 5R (Rater Form and Self-Rating Form) on a five-point Liken scale; 1 =
“always," 2 = “fairly often,” 3 = “sometimes,” 4 = “once in a while,” and 5 = “not at
all.” This instrument specifically measures seven leadership components or scales,
namely, charisma, inspiration, intellectual stimulation, individualized consideration,
contingent reward, management-by-exception, and laissez-faire. Each scale consists of
10 items. To make the revised MLQ - 5R more reliable, internal consistency reliability
for each of the seven leadership scales were determined by calculating the index of
coefficient alpha (Cronbach, 1951). The analysis was based on the revised MLQ - 5R
(Rater Form) that was completed by the teacher sample.
Results
Initial reliability estimates for the seven leadership scales were: .88 for
charisma, .87 for inspiration, .89 for Intellectual stimulation, .90 for individualized
consideration, .84 for contingent reward, .65 for management-by-exception, and .78 for
laissez-faire. The rule of thumb of .70, suggested by Nunnally (1978), was followed in
considering the acceptability of these reliability coefficients. Based on the reliability
estimates for the seven leadership scales, only the reliability coefficient for
management-by-exception was below .70. Item-total correlation was then performed
on this scale to improve its reliability. Five items were deleted from the management-
Reproduced with permission of the copyright owner. Further reproduction prohibited without permission.
69
by-exception scale resulting to a reliability estimate of .72, a value above .70. Thus,
this five-item management-by-exception scale was used in the major data analyses for
this study.
After determining the reliability estimates for the seven leadership scales,
reliability estimates were then calculated for the three main leadership styles measured
in this study, namely, transformational leadership, transactional leadership, and laissez-
faire. Transformational, as mentioned previously, consists of charisma, inspiration,
intellectual stimulation, and individualized consideration, whereas transactional
leadership is composed of contingent reward and management-by-exception (5 items).
Reliability estimates were determined to be .97 for transformational leadership, .87 for
transactional leadership, and .78 for laissez-faire.
Major Statistical Analyses
Descriptive Statistics
Background
Measures of central tendency (means and standard deviations) were calculated
to determine which leadership style best describe the thirty-six elementary school
principals in this study. The teachers completed the revised MLQ - 5R (Rater Form)
and their responses were the basis for the mean scores reported here. As mentioned
earlier, the revised MLQ - 5R used a five-point rating scale of: 1 = “always,” 2 =
“fairly often,” 3 = “sometimes,” 4 = “once in a while,” and 5 = “not at all.” Keeping
this scale in mind, the mean scores in this study were interpreted as: the lower the mean
Reproduced with permission of the copyright owner. Further reproduction prohibited without permission.

70
score on a particular leadership style, the higher the school principals scored on that
leadership style.
Results
Table 4.6 reports the overall mean scores for the three principal leadership styles
(transformational leadership, transactional leadership, and laissez-faire).
Transformational leadership has the lowest mean score at 1.98. This mean score falls
between the scale of 1 (“always”) and 2 (“fairly often”). Laissez-faire has the highest
mean score, falling between the scale of 3 (“sometimes”) and 4 (“once in a while”).
Refer to Appendix H for the leadership mean scores for each of the thirty-six schools.
Table 4.6
Overall Mean Scores for the Principal Leadership Styles
1Transformational Transactional Laissez-Faire
1 Leadership Leadership
M 1.98 2.10 3.36
I SD .68 .66 .74
Note, n = 881 teachers. The mean scores correspond to the scale: 1 = always, 2 = fairly often, 3 = sometimes, 4 = once in a while, and 5 = not at all. The mean scores are based on the revised MLQ - 5R (Rater Form).
Since transformational leadership best described the school principals in this
study, mean scores for the four transformational leadership components (charisma,
inspiration, intellectual stimulation, and individualized consideration) were also
determined. The rank order o f these four components was: individualized
consideration, charisma, inspiration, and intellectual stimulation. Table 4.7 presents the
corresponding mean scores for the four components.
Reproduced with permission of the copyright owner. Further reproduction prohibited without permission.

71
Table 4.7
Overall Mean Scores for the Transformational Leadership Scales
Charism a Inspiration IntellectualStimulation
'IndividualizedConsideration
M 1.92 2.00 2.12 1.87
SD .69 .69 .74 .75
'4ote. n = 934 teachers. The mean scores correspond to the scale: 1 = always, 2 = fairly often, 3 = sometimes, 4 = once in a while, and 5 = not at all. The mean scores are based on the revised MLQ - 5R (Rater Form).
MANOVA
MANOVA was utilized to determine if there was any significant difference
between teachers and principals with respect to their perceptions on the three leadership
styles of principals in the Philippines. Teacher and principal perceptions served as the
predictor variables in this analysis, while the three principal leadership styles
(transformational, transactional, and laissez-faire) served as the criterion variables. The
statistical test used was Wilks’ lambda, derived through a one-way MANOVA,
between-groups design. This analysis revealed a significant multivariate effect for type
of perceptions (teacher and principal), Wilks’ lambda = .59, F(3, 60) = 13.95; p <
.0001.
Faired-Samples T-Test
Background
As discussed in the preceding analysis, MANOVA results suggested that there
is a significant multivariate effect for type of perceptions on the principal leadership
style. The paired-samples t-test was used to determine how teachers and principals
Reproduced with permission of the copyright owner. Further reproduction prohibited without permission.

72
differ with their perceptions on the three principal leadership styles. Just like in the
MANOVA analysis, perceptions served as the predictor variables while the leadership
styles served as the criterion variables. Three tests were performed separately for each
of the three leadership styles (transformational, transactional, and laissez-faire).
Descriptions of the results follows.
Result 1
The paired-samples t-test analysis revealed a significant difference between
teachers and principalis with respect to their perceptions of the transformational
leadership behaviors of the principals, t(27) = 4.57; g < .0001. The sample means are
displayed in Figure 4.1 which shows that mean transformational leadership scores were
significantly higher with teacher perception (M = 1.94, SD = .41) than with principal
perception (M = 1.63, SD = .37).
0.5
T each er Perception P rinc ipa l Perception
Figure 4.1: Mean Scores for Transformational Leadership as Perceived by Teachers and Principals
Reproduced with permission of the copyright owner. Further reproduction prohibited without permission.

73
Result 2
The paired-samples t-test analysis also revealed a significant difference between
teachers and principals with respect to their perceptions of the transactional leadership
behaviors of principals, t(31 ) = 3.70; g < .001. The sample means are displayed in
Figure 4.2 which shows that mean transactional leadership scores were significantly
higher with teacher perception (M = 2.08, SD = .33) than with principal perception (M
= 1.73,SD = .49).
2.5
m T eacher P ercep tion j Principal Perception
Figure 4.2: Mean Scores for Transactional Leadership as Perceived bv Teachers and Principals
Result 3
The paired-samples t-test analysis again revealed a significant difference
between teachers and principals with respect to their perceptions of the laissez-faire
behaviors of principals, t(32) = - 4.55; g < .0001. The sample means are displayed in
Figure 4.3 which shows that mean laissez-faire scores were significantly higher with
Reproduced with permission of the copyright owner. Further reproduction prohibited without permission.
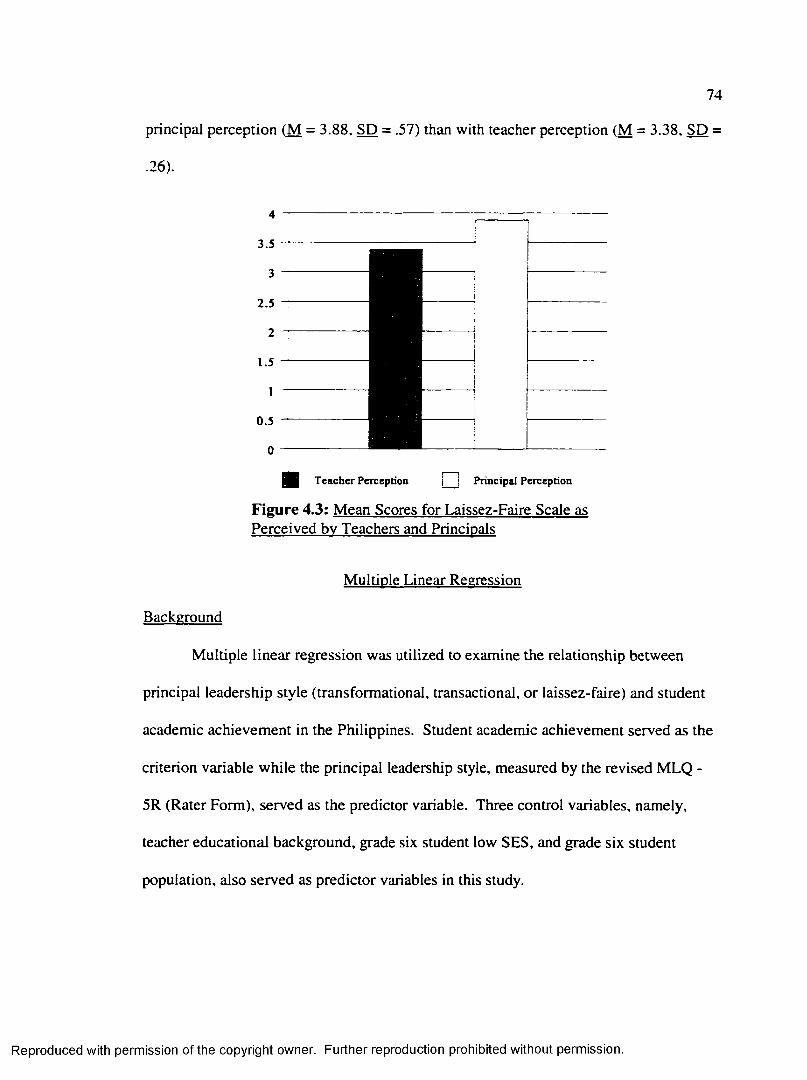
74
principal perception (M = 3.88, SD = .57) than with teacher perception (M = 3.38, SD =
.26).
T each er Perception [ 2 ] P rincipal Perception
Figure 4.3: Mean Scores for Laissez-Faire Scale as Perceived bv Teachers and Principals
Multiple Linear Regression
Background
Multiple linear regression was utilized to examine the relationship between
principal leadership style (transformational, transactional, or laissez-faire) and student
academic achievement in the Philippines. Student academic achievement served as the
criterion variable while the principal leadership style, measured by the revised MLQ -
5R (Rater Form), served as the predictor variable. Three control variables, namely,
teacher educational background, grade six student low SES, and grade six student
population, also served as predictor variables in this study.
Reproduced with permission of the copyright owner. Further reproduction prohibited without permission.

75
Predictor variables were limited to four because the number of schools in this
study was only thirty-six which was considered as small. To satisfy the four-predictor
variables condition, the three principal leadership styles (transformational,
transactional, and laissez-faire) were analyzed separately, resulting in three regression
models. Refer to Table 3.3 for the three multiple regression models used in this study.
Formal descriptions of the results for each of these models follow.
Results: Model 1
Results were analyzed using both bivariate correlation and multiple regression.
Means, standard deviations, and Pearson correlations appear in Table 4.8. The
bivariate correlations failed to show that the four predictor variables were significantly
related to student academic achievement. All of the correlations were not significant at
P < .05 level, nevertheless, the rank order of these predictor variables from most to least
correlated is: grade six student population (p = .09), grade six student low SES (p =
.17), teacher educational background (p = .53), and transformational leadership (p =
.88 ).
Using multiple linear regression, student academic achievement scores were
then regressed on the linear combination of transformational leadership, teacher
educational background, grade six student low SES, and grade six student population.
The equation containing these four predictor variables accounted for fifteen percent of
the variance in student academic achievement which failed to achieve statistical
significance, F(4, 31) = 1.36, p = .27, adjusted R-square = .04.
Reproduced with permission of the copyright owner. Further reproduction prohibited without permission.
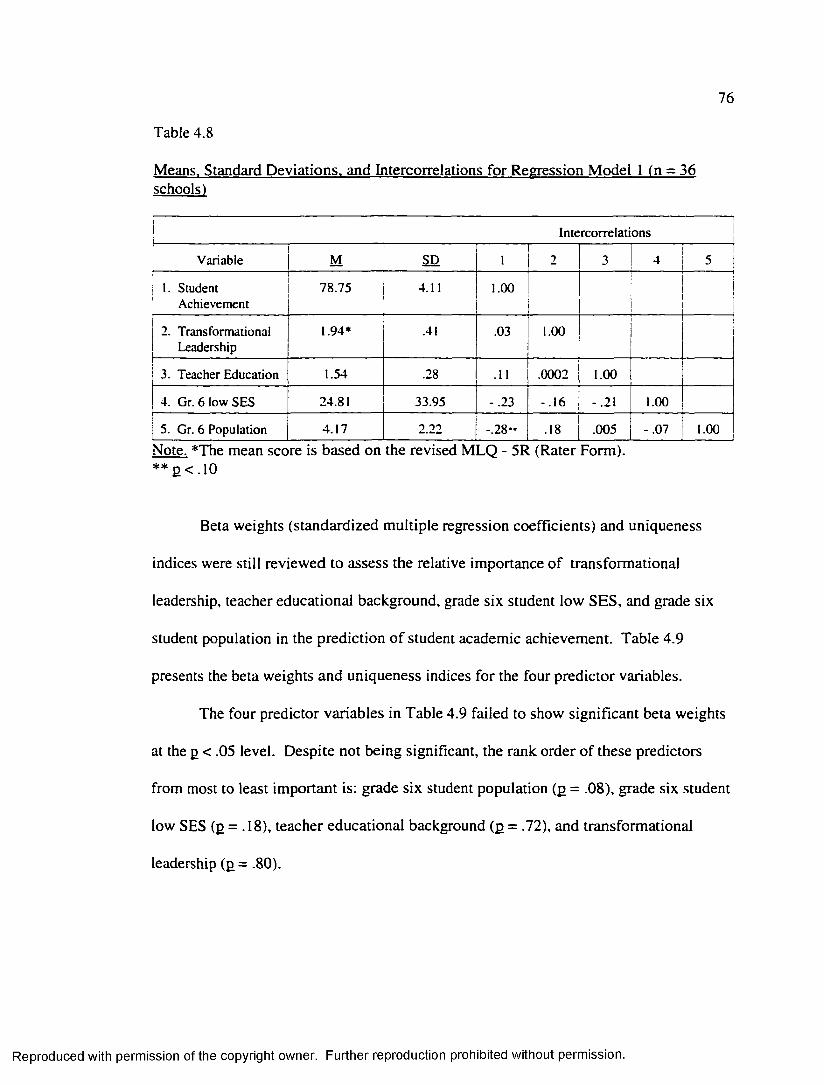
76
Table 4.8
Means. Standard Deviations, and Intercorrelations for Regression Model 1 (n = 36 schools)
Intercorrelations
Variable M SD 1 2 3 4 1 5
I. Student Achievement
78.75 4.11 1.00 !
1
2. Transformational Leadership
1.94* .41 .03 1.00
3. Teacher Education 1.54 .28 .11 .0002 1.00
4. Gr. 6 low SES 24.81 33.95 -.2 3 -.1 6 -.21 1.00
5. Gr. 6 Population 4.17 2.22 -.2 8 " .18 .005 -.0 7 1.00
*4ote. *The mean score is based on the revised MLQ - 5R (Rater Form). * * £ < .10
Beta weights (standardized multiple regression coefficients) and uniqueness
indices were still reviewed to assess the relative importance of transformational
leadership, teacher educational background, grade six student low SES, and grade six
student population in the prediction of student academic achievement. Table 4.9
presents the beta weights and uniqueness indices for the four predictor variables.
The four predictor variables in Table 4.9 failed to show significant beta weights
at the £ < .05 level. Despite not being significant, the rank order of these predictors
from most to least important is: grade six student population (£ = .08), grade six student
low SES (£ = .18), teacher educational background (£ = .72), and transformational
leadership (£= .80).
Reproduced with permission of the copyright owner. Further reproduction prohibited without permission.

77
Table 4.9
Beta Weights and Uniqueness Indices Obtained in Predicting Student Academic Achievement: Model 1 (n = 36 schools)
Beta Weights Uniqueness Indices
Predictor Beta la Uniqueness Index Fb
TransformationalLeadership*
.04 .26 .002 .063
TeacherEducation
.06 .36 .004 .125
Gr. 6 Student low SES
-.23 - 1.37 .051 1.65
Gr. 6 Student Population
-.31 - 1.83 .092 3.07
Note, a For t tests that tested the significance of the beta weights df = 31. b For F test that tested the significance of the uniqueness indices ^ = 1,31 * Based on the revised MLQ - 5R (Rater Form)
The findings regarding uniqueness indices matched those for beta weights, in
that none of the predictor variables displayed significant indices at p < .05 level. At
nine percent, grade six student population accounted for the highest variance in student
academic achievement, beyond the variance accounted for by the other three predictors,
F (l,31) = 3.07.
Results: Model 2
Results were analyzed using both bivariate correlation and multiple regression.
Means, standard deviations, and Pearson correlations appear in Table 4.10. The
bivariate correlations failed to show that the four predictor variables in this regression
model were significantly related to student academic achievement. All of the
correlations were not significant at p < .05, but still, the rank order of the predictor
Reproduced with permission of the copyright owner. Further reproduction prohibited without permission.
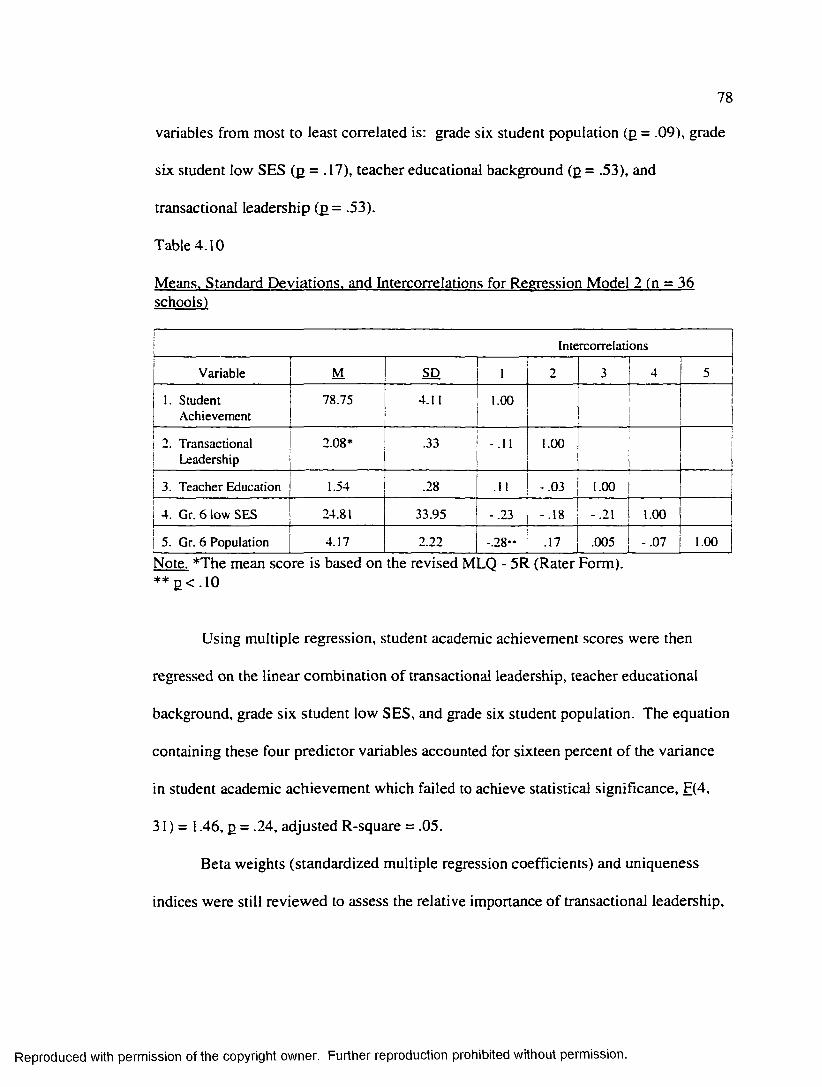
78
variables from most to least correlated is: grade six student population (p = .09), grade
six student low SES (p = .17), teacher educational background (p = .53), and
transactional leadership (p= .53).
Table 4.10
Means. Standard Deviations, and Intercorrelations for Regression Model 2 In = 36 schools)
Intercorrelations
Variable M SD 1 2 3 4 5
1. Student Achievement
78.75 4.11 1.00
2. Transactional Leadership
2.08* .33 - .11 1.00 Ii
3. Teacher Education 1.54 .28 .11 -.03 1.00
4. Gr. 6 low SES 24.81 33.95 -.23 -.1 8 -.21 1.00
5. Gr. 6 Population 4.17 2.22 -.2 8 - .17 .005 -.0 7 1.00
Note. *The mean score is based on the revised MLQ - 5R (Rater Form). * * P < .10
Using multiple regression, student academic achievement scores were then
regressed on the linear combination of transactional leadership, teacher educational
background, grade six student low SES, and grade six student population. The equation
containing these four predictor variables accounted for sixteen percent of the variance
in student academic achievement which failed to achieve statistical significance, F(4,
31) = 1.46, p = .24, adjusted R-square = .05.
Beta weights (standardized multiple regression coefficients) and uniqueness
indices were still reviewed to assess the relative importance of transactional leadership.
Reproduced with permission of the copyright owner. Further reproduction prohibited without permission.

79
teacher educational background, grade six student low SES, and grade six student
population in the prediction of student academic achievement. Table 4.11 presents the
beta weights and uniqueness indices for the four predictor variables.
Table 4.11
Beta Weights and Uniqueness Indices Obtained in Predicting Student Academic Achievement: Model 2 fn = 36 schools)
Beta W eights Uniqueness Indices
Predictor Beta ta Uniqueness Index Fb
TransactionalLeadership*
-.11 - .6 2 .01 .323
TeacherEducation
.05 .32 .002 .063
Gr. 6 Student low SES
-.2 6 - 1.52 .062 2.07
Gr. 6 Student Population
-.29 - 1.70 .079 2.63
Note, a For t tests that tested the significance of the beta weights ^ = 3 1 .b For F test that tested the significance of the uniqueness indices ^ = 1,31. * Based on the revised MLQ - 5R (Rater Form)
The four predictor variables in Table 4.12 failed to show significant beta
weights at the £ < .05 level. Although the beta weights were not significant, the rank
order of these predictors from most to least important is: grade six student population
(£ = . 10), grade six student low SES (£ = . 14), transactional leadership of principals
(£ = .54), and teacher educational background (£ = .75).
The findings regarding uniqueness indices matched those for beta weights, in
that none of the predictor variables displayed significant indices at £ < .05 level. At
eight percent, grade six student population accounted for the highest variance in student
Reproduced with permission of the copyright owner. Further reproduction prohibited without permission.

80
academic achievement, beyond the variance accounted for by the other three predictors,
F(I, 31) = 2.63.
Results: Model 3
Results were analyzed using both bivariate correlation and multiple regression.
Means, standard deviations, and Pearson correlations appear in Table 4.12. The
bivariate correlations failed to show that the four predictor variables were significantly
related to student academic achievement. All of the correlations were not significant at
P < .05, but still, the rank order of these variables from the most correlated to the least
is: grade six student population (p = .09), grade six student low SES (p = .17), laissez-
faire (p = .41 ), and teacher educational background (p = .53).
Using multiple regression, student academic achievement scores were regressed
on the linear combination of laissez-faire, teacher educational background, grade six
student low SES, and grade six student population. The equation containing these four
predictor variables accounted for sixteen percent of the variance in student academic
achievement which failed to achieve statistical significance, F(4, 31) = 1.44, p = .24,
adjusted R-square = .05.
Beta weights (standardized multiple regression coefficients) and uniqueness
indices were then reviewed to assess the relative importance of laissez-faire, teacher
educational background, grade six student low SES, and grade six student population in
predicting student academic achievement. Table 4.13 presents the beta weights and
uniqueness indices for the four predictor variables.
Reproduced with permission of the copyright owner. Further reproduction prohibited without permission.

81
Table 4.12
Means. Standard Deviations, and Intercorrelations for Regression Model 3 (n = 36 schools)
I Intercorrelations
Variable M SD 1 2 3 4 i T iI. Student
Achievement78.75 4.11 1.00
1i
!
2. Laissez-Faire 3.38* .26 -.14 1.001
13. Teacher Education 1.54 .28 .11 -.2 4 1.00
! i1 iI 1
4. Gr. 6 low SES 24.81 33.95 -.23 .20 -.21 1.001!
5. Gr. 6 Population 4.17 2.22 -.28" - .0 4 .005 -.0 7 1.00
Note. *The mean score is based on the revised MLQ - 5R (Rater Form).** E < .10
The four predictor variables in Table 4.13 failed to show significant beta
weights at the p < .05 level. Despite not being significant, the rank order of these
predictors from most to least important is; grade six student population (p = .08), grade
six student low SES (p = .20), laissez-faire (p = .57), and teacher educational
background (p = .82).
The findings regarding uniqueness indices matched those for beta weights, in
that none of the predictor variables displayed significant indices at p < .05 level. At
nine percent, grade six student population accounted for the highest variance in student
academic achievement, beyond the variance accounted for by the other three predictors,
F(l,31) = 3.17.
Reproduced with permission of the copyright owner. Further reproduction prohibited without permission.

82
Table 4.13
Beta Weights and Uniqueness Indices Obtained in Predicting Student Academic Achievement: Model 3 (n = 36 schools)
Beta W eights Uniqueness Indices
Predictor Beta ta Uniqueness Index Fb
Laissez-Faire* - .1 0 -.5 8 .009 .281_
TeacherEducation
.04 .23 .002 .063
Gr. 6 Student low SES
-.2 3 - 1.32 .047 1.52
Gr. 6 Student Population
- .3 0 - 1.84 .092 3.17
Note, a For t tests that tested the significance of the oeta weights ^ = 3 1 .b For F test that tested the significance of the uniqueness indices ^ = 1,31. * Based on the revised MLQ - 5R (Rater Form)
Tests of the Research Questions
Research Question 1
Question 1 asks, “What leadership style (transformational, transactional, or
laissez-faire) best describe the school principal in the Philippines?” Based on results
using descriptive statistics, transformational leadership best described the elementary
school principals in the Philippines. The rank order of the four transformational
leadership components from highest to lowest is: individualized consideration,
charisma, inspiration, and intellectual stimulation.
Research Question 2
Question 2 asks, “Is there a significant difference between teachers and
principals with respect to their perceptions of the leadership style (transformational.
Reproduced with permission of the copyright owner. Further reproduction prohibited without permission.

83
transactional, or laissez-faire) of school principals in the Philippines?” A one-way
MANOVA, between-groups design was used to determine the perception difference
when the three leadership styles (transformational, transactional, and laissez-faire) were
grouped together. Results from this analysis revealed a significant multivariate effect
for type of perception (teacher and principal) on the leadership style of principals.
Faired-samples t-test was also used to determine how the teachers and principals
differ in their perceptions. The results from this analysis suggest that with respect to
transformational and transactional leadership styles, the principals evaluated themselves
scoring higher on these styles as compared to what their teachers perceived them to be.
In regards to laissez-faire, the principals perceived themselves scoring lower in this
style as compared to what their teachers perceived them to be.
Research Question 3
Question 3 asks, “Is there a significant relationship between principal leadership
style (transformational, transactional, or laissez-faire) and student academic
achievement in the Philippines?” In the examination of this relationship, three control
variables were considered and these were teacher educational background, grade six
student low SES, and grade six student population. These control variables and
principal leadership style served as the predictor variables while student academic
achievement served as the criterion variable. Based on results using bivariate
correlations, none of the predictor variables showed significant relationship with
student academic achievement. Results based from multiple linear regression also
Reproduced with permission of the copyright owner. Further reproduction prohibited without permission.

84
failed to show principal leadership style and the three control variables as significant
predictors of student academic achievement.
Research Question 4
Question 4 asks, “What principal leadership style (transformational,
transactional, or laissez-faire) can be considered relatively important predictor of
student academic achievement in the Philippines?” This question is an extension of
research question 3. Although results based on bivariate correlations and multiple
regression failed to show significant relationships between the four predictor variables
(principal leadership style, teacher educational background, grade six student low SES.
and grade six student population) and criterion variable (student academic
achievement), the predictor variables were still ranked according to their importance.
In all the three regression models, grade six student population ranked as the most
important predictor. Grade six student low SES always ranked second. Teacher
educational background ranked third when combined with transformational leadership.
However, it ranked last when combined with transactional leadership or laissez-faire.
Summary
There were four research questions posited in this study. Various statistical
analyses, namely, Cronbach’s coefficient alpha, Pearson correlation, descriptive
statistics, MANOVA, paired-samples t-test, and multiple linear regression, were used to
answer these questions. Results based on these analyses were discussed in detail in this
section. Discussion and conclusion based on these results are discussed in the next
section.
Reproduced with permission of the copyright owner. Further reproduction prohibited without permission.
CHAPTER 5 - SUMMARY AND DISCUSSION
Overview
Student academic achievement is one measure of school success. It is
particularly used in many countries in the Asia-Pacific region (Cheng, 1996), such as,
the Philippines. Some researchers have claimed that principal leadership is a crucial
factor in the success of schools and thus, it is significantly associated with improved
student academic achievement (Hughes & Ubben, 1989; Lomotey, 1989; Cheng, 1996).
This study explored the relationship between principal leadership style
(transformational, transactional, or laissez-faire) and student academic achievement in
thirty-six elementary public schools in the Philippines. Control variables were also
considered in this study: ( 1 ) teacher educational background, (2) grade six student
population, and (3) grade six student socio-economic status (SES). The leadership style
of the principals was measured with the revised MLQ - 5R, while the academic
achievement of students was measured by determining the overall NEAT scores of the
grade six students during the SY 1995 - 1996.
Four research questions were posited in this study: ( 1 ) What principal
leadership style (transformational, transactional, or laissez-faire) best describe the
school principals in the Philippines? (2) Is there a significant difference between
teachers and principals with respect to their perceptions of the leadership style
(transformational, transactional, or laissez-faire) of school principals in the Philippines?
(3) Is there a significant relationship between principal leadership style
(transformational, transactional, or laissez-faire) and student academic achievement in
85
Reproduced with permission of the copyright owner. Further reproduction prohibited without permission.

86
the Philippines? (4) What principal leadership style (transformational, transactional, or
laissez-faire) can be considered to be a relatively important predictor of student
academic achievement in the Philippines? To answer these questions, various
statistical analyses were used, namely, descriptive statistics, MANOVA, paired-samples
t-test, Pearson-moment correlation, Cronbach coefficient alpha, and multiple linear
regression. Interpretation of the results, limitations of the study, and recommendations
for future research are discussed in this section.
Interpretation of Research Question Results
Research Question 1
Using descriptive statistics, the elementary school teachers in this study
described their principals more as transformational leaders than transactional or laissez-
faire. A possible explanation for this is that seventy-two percent of the principals
evaluated were female. In the study conducted by Bass and Avolio ( 1994), results
showed that women managers were rated higher on the transformational leadership
scale than on the transactional leadership scale. According to Eagly and Johnson
( 1990), women leaders seem to display qualities similar to that of transformational
leadership. When compared with their male counterparts, women leaders were
described to be more interested in other people, more socially sensitive (Eagly &
Johnson, 1990), more nurturing (Eagly, 1991), and more perceptive of followers' needs
(Myers & McCaulley, 1985). These are characteristics of transformational leaders
implying that that there might be gender differences in transformational leadership.
Reproduced with permission of the copyright owner. Further reproduction prohibited without permission.

87
Research Question 2
Results based on MANOVA and paired-samples t-test showed that there was a
significant difference between teachers and principals with respect to their perceptions
of the leadership style (transformational, transactional, or laissez-faire) being practiced
by the thirty-six elementary public school principals in the Philippines. The school
principals in this study perceived themselves to be scoring high on the transformational
and transactional leadership scales and low on the laissez-faire scale. Their teachers, on
the other hand, perceived them to be scoring lower on the transformational and
transactional leadership scales and higher on the laissez-faire scale.
The significant difference between teacher perception and principal perception
in this study is probably due to the teachers under-rating/over-rating their principals or
the principals under-rating/over-rating themselves on the leadership scales. Bass and
Avolio ( 1980) conducted numerous studies on leaders and they have consistently found
that the leaders being evaluated tended to inflate their ratings on the leadership scales as
compared to the ratings received from their followers. As if to affirm this finding,
Hofstede (1984) also found that “people are more accurate in describing others than in
describing themselves” (p. 76). Thus, it seems appropriate to use for analysis data
based on teacher perception. However, it is not being concluded in this study, that there
is no need to determine the perception of school principals mainly because principal
perception is not accurate. If we are to assume that school principals tend to over-rate
themselves, then one way to deal with this dilemma is to either use only teacher
perceived data to be analyzed or use both teacher and principal perceived data and then
Reproduced with permission of the copyright owner. Further reproduction prohibited without permission.

88
compare the findings based on these two perceptions. If the results of this study
indicated that there was no statistical difference between teacher and principal
perceptions, then there is no point in debating whose perception is more accurate.
Research Questions 3 and 4
Based on bivariate correlations, results indicated that there was no significant
relationship between principal leadership style (transformational, transactional, or
laissez-faire) and student academic achievement in the Philippines. Results also
showed that the three control variables (teacher educational background, student
population, and student SES) considered in this study were not significantly related to
student academic achievement. Based on multiple linear regression, results suggested
that principal leadership style (transformational, transactional, or laissez-faire), teacher
educational background, student population, and student SES were not significant
predictors of student academic achievement. Furthermore, when these predictors were
ranked according to importance, the three principal leadership styles were ranked the
least important predictors of student academic achievement in the Philippines while
student population and student SES ranked the most important predictors of student
academic achievement.
Why did the findings of this study show no significant relationship between
principal leadership style (transformational, transactional, or laissez-faire) and student
academic achievement in the Philippines when many studies suggested otherwise?
Four interpretations of the results are suggested.
Reproduced with permission of the copyright owner. Further reproduction prohibited without permission.

89
Cultural Differences
The findings in this study are consistent with the findings in studies conducted
in Singapore, Thailand, Malaysia, and South Korea. Koh, Steers, and Terborg (1995)
studied the relationship between the transformational leadership among secondary
school principals and student academic achievement in Singapore and the results
suggested that there was no significant relationship between these two variables.
Wongtrakool (1996) studied the relationship between instructional leadership among
secondary school principals and student academic achievement in Thailand and the
results also indicated that there was no significant relationship between these two
variables. Ahmad (1982) studied the relationship between leadership style of
elementary school principals and student academic achievement in Malaysia and results
showed again no significant relationship. Graw (1980) examined the relationship
between leadership style of secondary school principals and student academic
achievement in South Korea; results indicated no relationship.
The Philippines, Singapore, Thailand, Malaysia, and South Korea are all Asian
countries. Thus, should one assume that in Asian countries there is no relationship
between principal leadership and student academic achievement? No one should make
this assumption presently because more studies are needed to make these findings
conclusive since studies in Asian countries are very limited. Nevertheless, one possible
explanation is given for this “trend” in Asian studies and that is, cultural differences.
The researchers of the studies conducted in these Asian countries used western-
based leadership theories to explain principal leadership in their respective countries.
Reproduced with permission of the copyright owner. Further reproduction prohibited without permission.

90
According to Douglas (1988), “for more than half a century, the United States has been
the world’s largest producer and exporter of administrative theories” (p. 375), such as,
leadership theories. The theories developed in the United States reflect the norms of
the American society and so these theories are not culture-free. Thus, other countries
cannot just adapt or apply American administrative theories without considering the
cultural differences between them and the United States (Douglas, 1988).
Hofstede (1984) suggested four main criteria to determine cultural differences
between two countries; (1) individualism/collectivism, (2) power distance, (3)
uncertainty avoidance, and (4) masculinity/femininity. Individualism suggests a loosely
knit social framework in which people look after themselves and their immediate
families only. Collectivism, the opposite of individualism, implies a tight social
framework in which individuals expect their relatives, clan, and organization to look
after them in exchange for their absolute loyalty. Power distance indicates the extent to
which a society acknowledges that there is unequal distribution of power in institutions
and organizations. Uncertaintv avoidance indicates the extent to which a society feels
threatened by uncertain, risky, and ambiguous situations. To avoid such situations, a
society attempts to: provide greater career stability and more formal rules, be intolerant
of deviant ideas and behaviors, believe in absolute truths, and attain expertise.
Masculinity indicates the extent to which a society's dominant values are described to
be masculine, such as, assertiveness, acquisition of money and material things, and an
uncaring attitude towards people and the quality of life (Hofstede, 1984).
Reproduced with permission of the copyright owner. Further reproduction prohibited without permission.

91
Based on these four criteria, Hofstede (1984) described the culture in the United
States as high individualism, small power distance, weak uncertainty avoidance and
masculine societal values. In the Philippines, Hofstede (1984) described the culture as,
low individualism, large power distance, weak uncertainty avoidance, and masculine
societal values. The United States and the Philippines were different on the
individualism and power distance criteria while they were similar on the uncertainty
avoidance and masculinity criteria. Hofstede ( 1984) explained that this similarity may
be due to the fact that the Philippines was once a colony of the United States and thus,
some American cultural values were imbedded into the Filipino culture (Hofstede,
1984). Despite this similarity, the United States and the Philippines are still culturally
different and because of this difference, the use of the American leadership theories
(transformational leadership, transactional leadership, and laissez-faire) to explain the
principal leadership style in the Philippines might have not been appropriate. As a
result, the relationship between principal leadership style and student academic
achievement might have been affected, that is, there might have been a relationship
between these two variables, but because of the use of American leadership theories,
findings suggested no significant relationship.
Furthermore, besides the reason for cultural differences between the United
States and the Philippines, the use of transformational leadership in this study may have
been inappropriate because the concerns of the United States might be different from
the concerns of the Philippines. Transformational leadership was recommended by
researchers as the leadership style that American school principals should practice
Reproduced with permission of the copyright owner. Further reproduction prohibited without permission.

92
because transformational leadership can address the issues of the 1990s, namely,
teacher leadership and professionalism, educational changes initiation, and school
reconstructuring (Cuban, 1988; Barth, 1990; Elmore, 1990; Hallinger, 1992). The
Philippines, however, may not have these same concerns. Thus, implying that the
transformational leadership model may not be the appropriate leadership style to be
examined in the Philippines.
Other Sets of Variables
The pendulum effects model (refer to Figure 1.1) was proposed to be the
conceptual framework of this study. The model suggests that a principal leadership
style that provides harmonious principal-teacher relationships, results in better teacher
performance, leading to a dynamic teacher-student interaction that can improve student
academic achievement. Principal leadership style has an indirect relationship with
student academic achievement because there exist mediating variables (teacher
performance, principal-teacher relationships, and teacher-student interaction) between
them. There are also some moderator or control variables that can affect the
relationship between principal leadership style and student academic achievement.
These control variables are represented by school demographics, such as, student
population, student SES, teacher population, student-teacher ratio. These are variables
that can be measured objectively.
In this study, the relationship between principal leadership style and student
academic achievement was explored by considering three control variables, namely,
teacher educational background, student population, and student SES. Multiple
Reproduced with permission of the copyright owner. Further reproduction prohibited without permission.

93
regression was used to analyze the data collected. Findings suggested that when
principal leadership style was regressed along with these three control variables, there
existed no significant relationship between principal leadership style and student
academic achievement. This implies that school demographics are not important
predictors of student academic achievement in the Philippines. However, if principal
leadership style was regressed with the mediating variables (teacher performance,
principal-teacher relationships, and teacher-student interaction), then the outcome of
this study might have been different.
Small Sample Size
Another reason why the results in this study showed no significant relationship
between principal leadership style and student academic achievement in the Philippines
is because of the small sample size. There were only thirty-six elementary public
school principals examined in this study. If more principals were included in the study,
then the results might have been different. Thus, more studies in this area are needed.
Use of Quantitative Design
Based on the review of the literature, it was observed that when studies
implemented qualitative designs, there existed a significant relationship between
principal leadership style and student academic achievement. Studies with quantitative
designs did not give consistent results. Thus, the quantitative design of this study may
have affected the outcome of the results.
Reproduced with permission of the copyright owner. Further reproduction prohibited without permission.

94
Limitations of the Study
This study had its limitations. First, data for principal leadership style
(transformational, transactional, or laissez-faire) were collected during the SY 1995 -
1996, while data for student academic achievement were collected during the SY 1997 -
1998. Because of this time gap, data on student academic achievement were not
complete. There were originally forty-one schools included in this study, but it was
reduced to thirty-six because the other five schools lost their student files. Some
schools did not keep records of old student scores and some schools lost their files due
to flooding in their areas. Thus, in the final analysis, data from only thirty-six schools
were used.
Second, the thirty-six schools included both urban and rural schools. These
schools were combined because if analyzed separately, small sample sizes will emerge.
As a result, differences between rural schools and urban schools were not determined.
Third, there was no random sampling of schools in this study. Schools were
selected based on their school principals who were the ones randomly selected. If high-
achieving schools and low-achieving schools were randomly selected instead, the
results might be more significant. The effect of transformational leadership on student
academic achievement in the Philippines might be more apparent.
Last, a qualitative design was not used for this study due to financial and time
constraints. Results showed here were mainly based on the survey instrument used to
measure principal leadership. It would have been interesting if some qualitative
observations were included, but this could be implemented in future research.
Reproduced with permission of the copyright owner. Further reproduction prohibited without permission.

95
Summary and Recommendations
This study was exploratory in nature. It examined the relationship between
principal leadership style (transformational, transactional, or laissez-faire) and student
academic achievement in the Philippines. Three control variables considered in the
analysis of this relationship were teacher educational background, student population,
and student SES. Cronbach's alpha, Pearson-moment correlation, MANOVA, paired-
samples t-test, and multiple linear regression were utilized to analyze the data collected.
The revised Multifactor Leadership Questionnaire - 5R was used to measure principal
leadership style while the overall NEAT scores of grade six students were used as the
measure for student academic achievement.
Results showed that the elementary school principals in the Philippines were
described as transformational leaders. With respect to teacher and principal
perceptions, they were found to be different. The principal ratings were higher than
teacher ratings when principal leadership was measured. Results also showed that
principal leadership style and the three control variables were not significantly related
to student academic achievement in the Philippines. They were also not significant
predictors of student achievement. Interpretations of the results and the limitations of
the study were discussed in this section.
Although the findings were not significant, more studies in this area are
recommended because little is known about principal leadership in the Philippines
where student academic achievement is an important measure of school success. There
are other mediating variables (such as, teacher satisfaction, principal-teacher
Reproduced with permission of the copyright owner. Further reproduction prohibited without permission.

9 6
relationship, teacher performance, student-teacher interaction) that can affect principal
leadership influence on student academic achievement. Thus, these variables should be
further investigated in future research. Furthermore, when researchers chooses to use
western administrative theories in non-western studies, they might need to consider the
adaptability of those theories by examining for cultural differences between the country
where the theories originated and the country where the study will be conducted.
Reproduced with permission of the copyright owner. Further reproduction prohibited without permission.

REFERENCES
Ahmad, R. H. (1981). The relationship between and among leadership style, school climate, and student achievement in the elementary school principalship in the federal territory of Kuala Lumpur. Malaysia [CD-ROM]. Abstract from: ProQuest File: Dissertation Abstracts Item: Not ayailable from UMI
Amory, M. B. (1993). The influence of the school principal on the reading achieyement of urban African-American students in urban elementary and middle schools [CD-ROM]. Abstract from: ProQuest File: Dissertation Abstracts Item: 9318195
Archbold, G. J. K. (1982). The relationship between teacher perception of principal leadership behayior and student reading achieyement in selected elementary schools [CD-ROM]. Abstract from: ProQuest File: Dissertation Abstracts Item: 8227048
Barth, R. (1990). Improying schools from within. San Francisco: Jossey-Bass.
Bass, B. M. (1985). Leadership and performance beyond expectations. New York: The Free Press.
Bass, B. M. (1998). Transformational leadership: Industry, military, and educational impact. Mahwah, NJ: Lawrence Erlbaum Associates.
Bass, B. M., & Ayolio, B. J. (1990). Transformational leadership deyelopment: Manual for the Multifactor Leadership Ouestionnaire. Palo Alto, CA: Consulting Psychologists Press.
Bass, B. M., & Ayolio, B. J. (Eds.). ( 1994). Improying organizational effectiyeness through transformational leadership. Thousand Oaks, CA: Sage Publications.
Beck, L. G., & Murphy, J. (1993). Understanding the principalship: Metaphorical themes. 1920s-1990s. New York: Teachers College Press.
Brandt, R. (1992). On rethinking leadership: A conyersation with Tom Sergioyanni. Educational Leadership. 49(5), 46-49.
Brookoyer, W., & Lezotte, L. W. (1979). School social systems and student achieyement. New York: Praeger.
Bums, J. M. (1978). Leadership. New York: Harper and Row.
97
Reproduced with permission of the copyright owner. Further reproduction prohibited without permission.
98
Bycio, P., Hackett, R. D., & Allen, J. S. (1995). Further assessments of Bass’s (1985) conceptualization of transactional and transformational leadership. Journal of Applied Psychology. 80. 468-478.
Chapel on the Campus (1998). Mav 31. 1998: Sunday bulletin. Baton Rouge, LA: Author.
Cheng, Y. C. (1996). School effectiveness and school-based management: A mechanism for development. London: The Palmer Press.
Chu, I. Y-H. ( 1994). The relationship o f teachers' lob satisfaction and their perceptions of principals' leadership styles in private vocational high schools in a selected metropolitan area of Taiwan [CD-ROM]. Abstract from: ProQuest File: Dissertation Abstracts Item: 9420287
CIA (1997). The world factbook. 1997. Available from: http://www.odci.gov/cia/ publications/factbook/country-frame.html
Clement, M. E. (1995). Factors that influence student achievement in language arts in selected low socioeconomic schools: A case studv [CD-ROM]. Abstract from: ProQuest File: Dissertation Abstracts Item: 9522591
Collins, C. R. (1988). Teacher and principal perception of the effect of principal’s engagement in selected instructional leadership functions on student achievement [CD- ROM]. Abstract from: ProQuest File: Dissertation Abstracts Item: 8801139
Couch, J. C. ( 1991 ). A studv of student achievement and how it relates to the principal in the role of instructional leader (ERIC Document Reproduction Service No. ED 340 136)
Cronbach, L. J. (1951 ). Coefficient alpha and the internal structure of tests. Psvchometrika. 16. 297-334.
Cuban, L. (1988). The managerial imperative and the practice of leadership in schools. New York: State University of New York Press.
Dilworth, R. E. (1989). The relationship between student achievement and the variables of teacher-perceived instructional leadership behaviors of principals and teacher attendance [CD-ROM]. Abstract from: ProQuest File: Dissertation Abstracts Item: 8806623
Douglas, A. (1988). Administration in less developed countries: Consideration for excellence. Journal of Educational Administration. 26(2). 367-381.
Reproduced with permission of the copyright owner. Further reproduction prohibited without permission.
99
Eagly, A. H. (1991). Gender and leadership. Paper presented at the annual meeting of the American Psychological Association, San Francisco, CA.
Eagly, A. H., & Johnson, B. T. (1990). Gender and leadership styles: A metaanalysis. Psychological Bulletin. 108, 233-256.
Eberts, R. W., & Stone, J. A. ( 1985). Principal effectiveness: Using nonexperimental data to assess the findings of case studies. Eugene, OR: University of Oregon, Center for Educational Policy and Management. (ERIC Document Reproduction Service No. ED 256 036)
Edington, E. D., & Di Benedetto, R. R. (1988, April). Principal leadership style and student achievement in small and rural schools of New Mexico. Paper presented at the annual meeting of the American Educational Research Association, New Orleans, LA. (ERIC Document Reproduction Service No. ED 295 770)
Edmonds, R. R. (1979). Effective schools for the urban poor. Educational Leadership. 37. 15-24.
Elmore, R. (1990). Introduction: On changing the structure of public schools. In R. Elmore (Ed.), Restructuring schools: The next generation of educational reform (pp. 1- 28). San Francisco: Jossey-Bass.
Gamer, D. W. ( 1989). A comparative studv of the leadership styles of elementary principals from Chapter one schools with principals from non-Chapter one schools to determine if leadership style is related to the achievement of third-grade students [CD- ROM]. Abstract from: ProQuest File: Dissertation Abstracts Item: 8917875
Gasper, J. M. (1993). Transformational leadership: An integrative review of the literature [CD-ROM]. Abstract from: ProQuest File: Dissertation Abstracts Item: 9234203
Graw, L. H. (1980). The correlations between management/leadership style perceptions of Korean academic high school principals and student scores on standardized achievement tests [CD-ROM]. Abstract from: ProQuest File: Dissertation Abstracts Item: Not available from UMI
Hallinger, P. (1992). The evolving role of American principals: From managerial to instructional to transformational leaders. Journal of Educational Administration. 30(3). 35-48.
Reproduced with permission of the copyright owner. Further reproduction prohibited without permission.

100
Hardie, J. W. (1993). The relationship between principal and teacher perceptions oF principal leadership style and student achievement [CD-ROM]. Abstract from:ProQuest File: Dissertation Abstracts Item: 9225887
Hatcher, L., & Stepanski, E. J. ( 1994). A step-bv-step approach to using the SAS system for univariate and multivariate statistics. Cary, NC: SAS Institute Inc.
Haymon, D. L. R. (1991). Relationships among elementary school principals's leadership style, school climate, and student achievement in differing racial-ethnic and socioeconomic status contexts: Racial ethnic status [CD-ROM]. Abstract from: ProQuest File: Dissertation Abstracts Item: Not available from UMI
Herron, F. R. Jr. (1995). Leadership styles of elementary school principals and their impact on student achievement [CD-ROM]. Abstract from: ProQuest File: Dissertation Abstracts Item: 1331566
Hofstede, G. (1984). Culture's consequences: International differences in work- related values. Beverly Hills, CA: Sage Publications.
Hoover, N. R., Petrosko, J. M., & Schultz, R. R. (1991, April). Transformational and transactional leadership: An empirical test of a theory. Paper presented at the annual meeting of the American Educational Research Association, Chicago, IL. (ERIC Document Reproduction Service No. ED 331 177)
Howell, J. M., & Avolio, B. J. (1993). Transformational leadership, transactional leadership, locus of control, and support for innovation: Key predictors of consolidated business-unit performance. Journal of Applied Psychology. 78. 891-902.
Hughes, M. F. (1995). Achieving despite adversity: Why are some schools successful in spite of the obstacles they face? A studv of the characteristics of effective and less effective elementary schools in West Virginia using qualitative and quantitative methods (ERIC Document Reproduction Service No. ED 398 004)
Hughes, L. W., & Ubben, G. C. ( 1989). The elementary principal’s handbook: A guide to effective action. Boston, MA: Allyn and Bacon.
Immegart, G. L. ( 1988). Leadership and leader behavior. In N. J. Boyan (Ed.), Handbook of research on educational administration: A proiect of the American Educational Research Association (pp. 259-277). New York: Longman.
Johnson, M. (1992). Redefining leadership: A case studv of Hollibrook elementary school (ERIC Document Reproduction Service No. ED 360 687)
Reproduced with permission of the copyright owner. Further reproduction prohibited without permission.

101
Kanungo, R. N., & Mendonca, M. ( 1996). Ethical dimensions of leadership. Thousand Oaks, CA: Sage Publications.
Keeler, B. T., & Andrews, J. H. M. (1963). The behavior of principals: Staff morale and productivity. Alberta Journal of Educational Research. 9. 179-191.
Kendrick, J. A. (1988). The emergence of transformational leadership practice in a school improvement effort: A reflective studv [CD-ROM], Abstract from: ProQuest File: Dissertation Abstracts Item: 8815368
Kim, Y. M. (1989). The relationship of principals’ instructional leadership to student achievement in academic private high schools in Seoul. Korea [CD-ROM]. Abstract from: ProQuest File: Dissertation Abstracts Item: Not Available from UMI
Koh, W. L., Steers, R. M., & Terborg, J. R. (1995). The effects of transformational leadership on teacher attitudes and student performance in Singapore. Journal of Organizational Behavior. 16(4). 319-333.
Krug, F. S. ( 1987). The relationship between the instructional management behavior of elementarv school principals and student achievement [CD-ROM]. Abstract from: ProQuest File: Dissertation Abstracts Item: 8628337
Kurian, G. T. ( 1992). Encvclopedia of the third world. New York: Facts on File.
Larsen, T. J. ( 1987, April). Identification of instructional leadership behaviors and the impact of their implementation on academic achievement.
Leithwood, K. A. (1992). The move toward transformational leadership. Educational Leadership. 49(5). 8-12.
Leithwood, K. A., & Jantzi, D. (1991). Transformational leadership: How principals can help reform school cultures. School Effectiveness and School Improvement. 1(3). 249-281.
Lewis, L.W. Jr. (1984). Relationship between principals’ leadership style and achievement scores of third-grade students from low-income families [CD-ROM]. Abstract from: ProQuest File: Dissertation Abstracts Item: 8321571
Liontos, L. B. (1993). Transformational leadership: Profile of a high school principal. Oregon School Studv Council Bulletin. 36(9). (ERIC Document Reproduction Service No. ED 359 652)
Reproduced with permission of the copyright owner. Further reproduction prohibited without permission.

102
Lomotey, K. (1989). African-American principals: School leadership and success. New York: Greenwood Press.
Matula, M. J. (1986). The relationship between the leadership styles of high school principals and student performance [CD-ROM]. Abstract from: ProQuest File: Dissertation Abstracts Item: 8604026
McMahon-Dumas, C. E. (1981). An investigation of the leadership styles and effectiveness dimensions of principals and their relationship with reading gain scores of students in the Washington. D C. public schools [CD-ROM]. Abstract from: ProQuest File: Dissertation Abstracts Item: 8121448
Myers, I. B., & McCaulley, M. H. (1985). Manual: A guide to the development and use of the Mvers-Briggs tvpe indicator. Palo Alto, CA: Consulting Psychologists Press.
National Educational Testing and Research Center (1997, June). National Elementarv Assessment Test: Reliabilitv coefficient and standard error of measurement. Manila, Philippines: Author, Test Development Division.
Nelson, D. ( 1983, May). School leadership and reading achievement: Eight case studies. Paper presented at the annual meeting of the International Reading Association, Anaheim, CA. (ERIC Document Reproduction Service No. ED 237 961 )
Nunally, J. (1978). Psvchometric theorv. New York: McGraw-Hill.
Parker, B. J. (1991). The principal as an instructional leader in non-urban schools [CD-ROM]. Abstract from: ProQuest File: Dissertation Abstracts Item: 9108370
Peplow, E. ( 1991). The Philippines: Tropical paradise. Lincolnwood, IL: Passport Books.
Peters, J. (1994). Philippines: A travel survival kit. Hawthorn, Australia: Lonely Planet Publications.
Pitner, N. J. ( 1988). The study of administrator effects and effectiveness. In N. J. Boyan (Ed.), Handbook of research on educational administration: A proiect of the American Educational Research Association (pp. 99-122). New York: Longman.
Politz, A. J. (1992). Leadership stvles of principals and student achievement in selected catholic schools of Indiana [CD-ROM]. Abstract from: ProQuest File: Dissertation Abstracts Item: 9133263
Reproduced with permission of the copyright owner. Further reproduction prohibited without permission.

103
Poplin, M. S. (1992). The leader’s new role: Looking to the growth of teachers. Educational Leadership. 49(5). 10-11.
Rodgers, D. H. (1994). Perceived transformational leadership of elementarv principals in effective schools [CD-ROM]. Abstract from: ProQuest File: Dissertation Abstracts Item: 9400087
Ruiz, M. B. (1972). Foundations of administration and supervision for Philippine schools. Manila, Philippines: Abiva Publishing House.
Sagor, R. D. ( 1992). Three principals who make a difference. Educational Leadership. 49(5). 13-18.
Schmitt, D. R. (1990, September). The effect a principal has on the effective school program. Paper presented at the annual meeting of the Association of Louisiana Evaluators, New Orleans, LA. (ERIC Document Reproduction Service No. ED 330 089)
Schools division superintendents. (1995, June 25). Philippine Panorama, pp. 13-14.
Senigaur, E. (1982). The teacher’s perception of the principal’s leadership behavior and facultv morale: Their impact on student achievement [CD-ROM]. Abstract from: ProQuest File: Dissertation Abstracts Item: 8210436
Sergiovanni, T. J. ( 1990). Adding value to leadership gets extraordinary results. Educational Leadership. 47(8). 23-27.
Silins, H. C. (1993, April). The relationship between school leadership and school improvement outcomes. Paper presented at the annual meeting of the American Educational Research Association, Atlanta, GA. (ERIC Document Reproduction Service No. ED 360 721)
Silins, H. C. (1994). The relationship between transformational and transactional leadership and school improvement outcomes. School Effectiveness and School Improvement. 5131. 272-298.
Skilling, W. C. (1993). A studv of the relationship between middle school principal leadership behavior and seventh-grade student reading achievement [CD-ROM]. Abstract from: ProQuest File: Dissertation Abstracts Item: 9314753
Stanfield, P. C., & Walter, J. E. ( 1987). The principal as white knight. Paper presented at the annual meeting of the American Educational Research Association, Washington, DC. (ERIC Document Reproduction Service No. ED 284 350)
Reproduced with permission of the copyright owner. Further reproduction prohibited without permission.

104
Stone, P. ( 1992). Transformational leadership in principals: An analysis of the Multifactor Leadership Questionnaire results (ERIC Document Reproduction Service No. ED 355 613)
Stroud, D. J. ( 1990). Factors influencing the instructional leadership behaviors of elementarv school principals and the relationship to student achievement [CD-ROM]. Abstract from: ProQuest File: Dissertation Abstracts Item: 9017489
United States, Central Intelligence Agency (1993). Philippines. Washington, DC: Author.
Van Zanten, R. C. ( 1989). Leadership stvle of principals in effective urban elementarv schools [CD-ROM]. Abstract from: ProQuest File: Dissertation Abstracts Item: 8902751
Weber, G. (1971). Inner citv children can be taught to read: Four successful schools. Washington, DC: Council for Basic Education.
Weltman, R. ( 1996). The behaviors of principals of the 1990-1995 National Blue Ribbon Elementarv School in Cuvahoea Countv who embrace transformational leadership stvle [CD-ROM]. Abstract from: ProQuest File: Dissertation Abstracts Item: 9611397
Willard, M. (1988). An analvsis of principal leadership stvles and student achievement [CD-ROM]. Abstract from: ProQuest File: Dissertation Abstracts Item: 1331566
Wongtrakool, P. (1996). Instructional leadership of principals and student achievement in private lower secondary schools of Thailand [CD-ROM]. Abstract from: ProQuest File: Dissertation Abstracts Item: 9604384
Reproduced with permission of the copyright owner. Further reproduction prohibited without permission.

APPENDIX A - THE PHILIPPINES (MAP I)
105
Reproduced with permission of the copyright owner. Further reproduction prohibited without permission.

106
SA t.AJ WAN
(Source: Peters. 1994)
Reproduced with permission of the copyright owner. Further reproduction prohibited without permission.

APPENDIX B - THE PHILIPPINES (MAP 2)
107
Reproduced with permission of the copyright owner. Further reproduction prohibited without permission.

1 0 8
Philippines----------- n l c '- w io i i TX" ir
♦ Njx-ij tj: i: j
-----------P tn PI 11- H V
-♦ t '•%: - p** «ffim -.
s a .-a ;
aACV'<A>V
T
BontD; Ta&ul \/ *»Uw
îMjlateVl ^Clnn pe \'\,d^ rnnC%*/ -;CA wk
Li-«9*V«i» 0a9Bpa
>ï£2îL. !
CaaiijursnTtcCcNUibiÀ. ^
TïoavtïV* ^3^ il-t/
Satanga»
M#*a.
jZahwn *B##c
San- U « « > .atr Kcmg 5Sa'*oJiw
..T™ - V t-«anna„•:'-irac Tornatoa-n
.&5KB f / ACfanasa' / / S J V ' / I r V ^ K X ta n
:iuiiJc3e«' f«;o«c", ^,3ilw CjtIt»
*f*iiano
“ • iB h -
,, “ CcAu’ '-' .PlAf' 5USV Sufcjs* ,(!»»•■■ ,-■’ T j^ la -a r t
CLPwgjewT
*üalBb»r
'% r ^ ' “>“ « ^ » < O i:< r .l«
P*9sd . TobLd ;
B andtr S«ri B egaw aa .... ^
AtW) .NtHierci*'®*!’" ' ^
'Go„r>v ddrcpteai'. &;it*t tc
-noo«H«4taoian* ,
AC«J
INDONCSU
(Source: United States, Central Intelligence Agency. 1993)
Reproduced with permission of the copyright owner. Further reproduction prohibited without permission.

APPENDIX C - REGIONS AND SCHOOL DIVISIONS
109
Reproduced with permission of the copyright owner. Further reproduction prohibited without permission.

110
Region I - Ilocos1. Pangasinan2. Ilocos Norte3. Ilocos Sur4. La Union5. Dagupan City6. San Carlos City7. Laoag City
Region II - Cagayan Valley1. Cagayan2. Isabela3. Batanes4. Nueva Vizcaya5. Quirino
Region III - Central Luzon1. Bulacan2. Pampanga3. Zambales4. Tarlac5. Nueva Ecija6. Bataan7. Angeles City8. Cabanatuan City9. Olongapo City
Region IV - Southern Tagalog1. Rizal2. Batangas3. Quezon4. Cavite5. Laguna6. Marinduque7. Oriental Mindoro8. Occidental Mindoro9. Palawan10. Romblon11. Batangas City12. Lipa City13. Lucena City14. San Pablo City15. Cavite City16. Aurora
Region V - Bicol1. Camarines Sur2. Albay3. Masbate4. Sorsogon5. Camarines Norte6. Catanduanes7. Naga City8. Legaspi City9. Iriga City
Region VI - Western Visayas1. Negros Occidental2. Iloilo3. Antique4. Capiz5. Aklan6. Guimaras7. Bacolod City8. Iloilo City9. San Carlos City10. Cadiz City11. La Carlota City12. Roxas City13. Si lay City14. Bago City
Region VII - Central Visayas1. Cebu2. Bohol3. Negros Oriental4. Siquijor5. Cebu City6. Dumaguete City7. Lapu-Lapu City8. Toledo City9. Mandaue
Region VIII - Eastern Visayas1. Northern Samar2. Samar (Western)3. Eastern Samar4. Leyte5. Southern Leyte6. Biliran7. Calbayog City8. Tacloban City9. Ormoc City
Region IX - Western Mindanao1. Basilan2. Zamboanga Sur3. Zamboanga Norte4. Zamboanga City5. Pagadian City6. Dipolog City7. Dapitan City
Region X - Northern Mindanao1. Agusan del Norte2. Agusan del Sur3. Bukidnon4. Camiguin5. Misamis Occidental6. Misamis Oriental7. Surigao Norte8. Siargao9. Cagayan de Oro City10. Ozamis City11. Surigao City12. Butuan City13. Gingoog City
Region XI - Southern Mindanao1. Davao2. Davao del Sur3. Davao Oriental4. South Cotabato5. Surigao del Sur6. Davao City7. Gen. Santos City8. Sarangani
Region XII - Central Mindanao1. Lanao del Norte2. Sultan Kudarat3. Cotabato4. Iligan City5. Marawi City6. Cotabato City
Reproduced with permission of the copyright owner. Further reproduction prohibited without permission.

I l l
National Capital Region1. Manila District I2. Quezon City District II3. Caloocan City District III4. Pasay City5. Marikina/Pasig/San Juan6. Muntinlupa/Taguig/Pateros7. Makati8. Malabon/Navotas/
Valenzuela9. Paranaque/Las Pinas10. M andaiuyong City
Cordillera Administrative Region1. Abra2. Benguet3. M t. Province4. Baguio City5. Kalinga-Apayao6. Ifugao
Autonomous Region for Muslim Mindanao1. Sulu2. Tawi-Tawi3. Lanao del Sur II4. Lanao del Sur (M aranao)5. Maguindanao
(Source: Schools Division Superintendents. 1995)
Reproduced with permission of the copyright owner. Further reproduction prohibited without permission.

APPENDIX D - LETTER TO THE SUPERINTENDENT
112
Reproduced with permission of the copyright owner. Further reproduction prohibited without permission.

113
September 15, 1995
Dr. Luis R. Santos Jr.Superintendent, Division of Valenzuela, Malabon, & Navotas DECS, Valenzuela Metro Manila
Dear Dr. Santos,
Greetings!
I am a doctoral candidate in educational administration at Louisiana State University - Baton Rouge. I plan to do my dissertation research this semester and my interest lies on the leadership practices of Filipino public school principals.
I request permission to conduct a leadership study among the public school principals in VALMANA. A leadership survey would be used for measuring the leadership practices of the principals. In addition, interviews of the principals and their subordinates might be conducted.
I am still in the process of choosing what schools I am going to conduct my study. 1 will immediately inform you my choices as soon as possible.
I pray for your approval, kindness, and understanding.
Thank you very much.
Sincerely,
Mary Sylvette T. Gunigundo Km. 15 Marcelo Rd.Dalandanan, Valenzuela Metro Manila
Reproduced with permission of the copyright owner. Further reproduction prohibited without permission.

APPENDIX E - LETTER OF ENDORSEMENT
114
Reproduced with permission of the copyright owner. Further reproduction prohibited without permission.

115
DIVISION OF VALENZUELA, MALABON & NAVOTAS Marulas Elementary School Compound
Pio Valenzuela St., Marulas Valenzuela, Metro Manila
r ' Indorsement September 25, 1995
Respectfully returned to Ms. MARY SYLVETTE T. GUNIGUNDO, Km. 15 Marcelo Road, Dalandanan, Valenzuela, Metro Manila, interposing no objection to the herein letter request dated September 15, 1995 to conduct leadership study and to interview principals in this Division in connection w / dissertation research at Louisiana State University-Baton Rouge. It is requested that proper arrangements be made with the school principals in this Division for this purpose.
LUIS R. SANTOS, JR Schools Division Superintendent
Incls.: Ai- stated.
Vdl/e
Reproduced with permission of the copyright owner. Further reproduction prohibited without permission.

APPENDIX F - REVISED MLQ - 5R ITEMS
116
Reproduced with permission of the copyright owner. Further reproduction prohibited without permission.
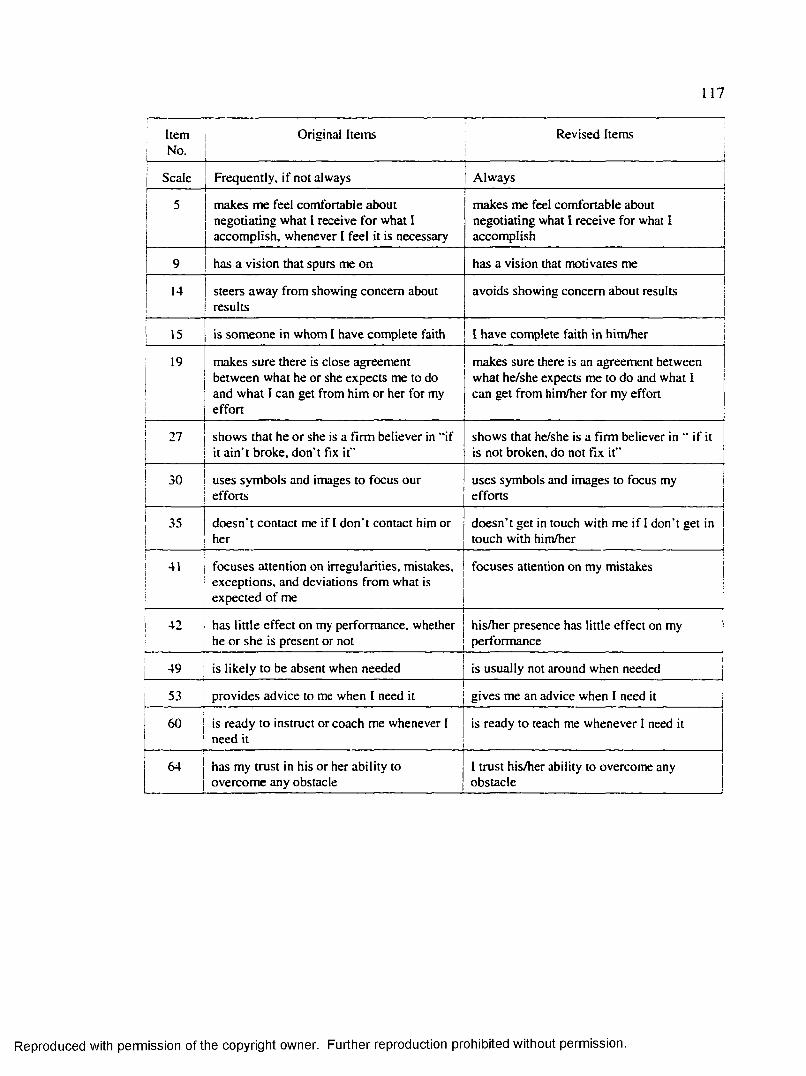
117
Item i No.
Original Items Revised Items
Scale Frequently, if not always Always
5 makes me feel comfortable about negotiating what I receive for what I accomplish, whenever I feel it is necessary
makes me feel comfortable about negotiating what I receive for what I accomplish
9 has a vision that spurs me on has a vision that motivates me
14 steers away from showing concern about results
avoids showing concern about results
15 is som eone in whom I have complete faith I have complete faith in him/her
i makes sure there is close agreement between what he or she expects me to do and w hat I can get from him or her for my effort
makes sure there is an agreement between what he/she expects me to do and what I can get from him/her for my effort
shows that he or she is a firm believer in “if it a in 't broke, don’t fix it”
shows that he/she is a firm believer in " if it is not broken, do not fix it”
30 uses symbols and images to focus our efforts
uses symbols and images to focus my efforts
doesn 't contact me if I don 't contact him or her
doesn’t get in touch with me if 1 don 't get in touch with him/her
41 focuses attention on irregularities, mistakes, exceptions, and deviations from what is expected o f me
focuses attention on my mistakes
42 has little effect on my performance, whether he or she is present or not
his/her presence has little effect on my performance
49 is likely to be absent when needed is usually not around when needed
53 provides advice to me when I need it gives me an advice when 1 need it
60 is ready to instruct or coach me whenever 1 need it
is ready to teach me whenever 1 need it
64 has my trust in his or her ability to overcom e any obstacle
1 trust his/her ability to overcome any obstacle
Reproduced with permission of the copyright owner. Further reproduction prohibited without permission.

APPENDIX G - THE REVISED MLQ - 5R (RATER FORM)
118
Reproduced with permission of the copyright owner. Further reproduction prohibited without permission.

119
A. D IR E C T IO N S: L isted below a re s ta tem en ts th a t m ay describe school p rincipals. Please evaluate how freq u en tly y o u r p rin c ip a l d isplay th e b eh av io rs listed below. C hoose only one le tte r from th e scale given in re sp o n d in g to each s ta te m e n t Please answ er honestly an d objectively. All responses a re co n fiden tia l.
SC A L E : A = A lw aysB = F a irly O ften C = Som etim es D = O nce in a W hile E = N ot a t all
1. He/She makes me feel good when I'm around him/her.
2. He/She sets high standards.
3. He/She has ideas that have forced me to rethink som e o f my ideas that 1 had never questionedbefore.
4. He/She gives personal attention to those who seem neglected.
5. He/She makes me feel com fortable about negotiating what 1 receive for what I accomplish.
6. He/She is content to let me do my jo b the same way I've always done it, unless changes seemnecessary.
7. He/She avoids telling me how to perform my job.
8. He/She makes me proud to be associated with him/her.
9. He/She has a vision that motivates me.
10. He/She enables me to think about old problems in new ways.
11. He/She gets me to look at problems as learning opportunities.
12. He/She shows me that he/she recognizes my accomplishments.
13. He/She avoids trying to change what 1 do as long as things are going along smoothly.
14. He/She avoids showing concern about results.
1 5 .1 have com plete faith in him/her.
16. He/She expresses our important purposes in simple ways.
17. He/She provides me with new ways o f looking at problem s which initially seemed puzzling tome.
18. He/She lets me know how I am doing.
19. He/She makes sure there is an agreement between what he/she expects me to do and what Ican get from him/her for my effort.
Reproduced with permission of the copyright owner. Further reproduction prohibited without permission.
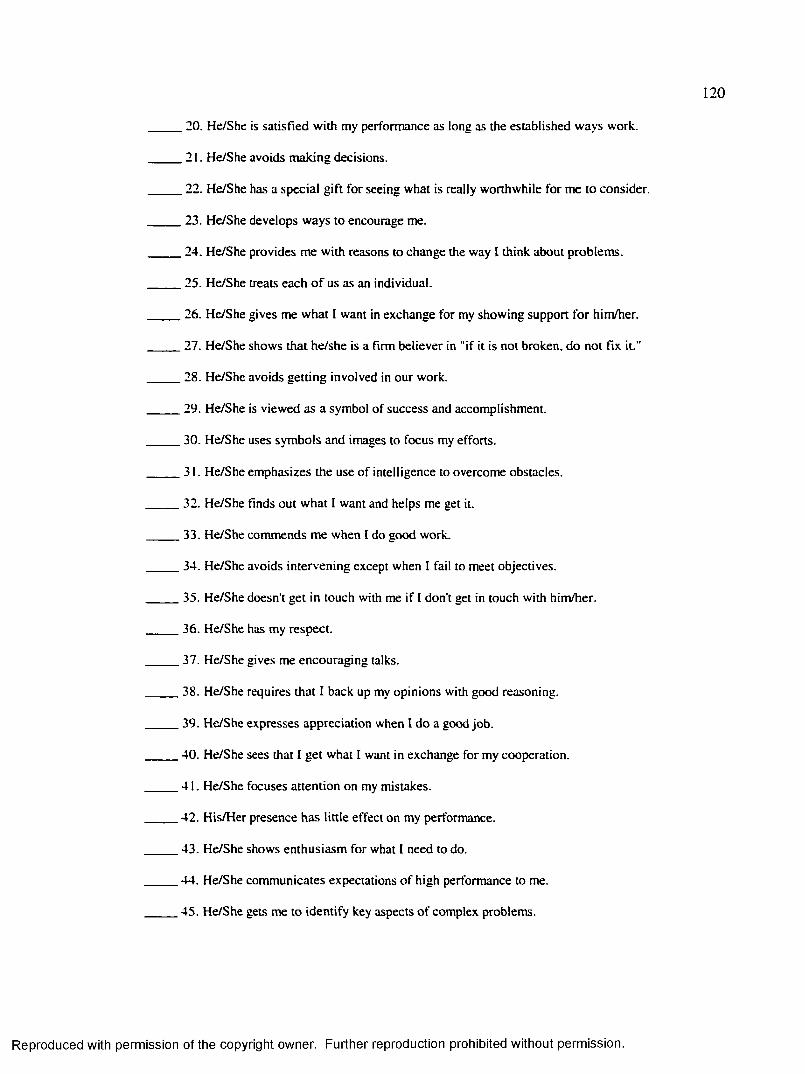
120
. 20. He/She is satisfied with my performance as long as the established ways work.
.2 1 . He/She avoids making decisions.
. 22. He/She has a special gift for seeing what is really worthwhile for me to consider.
. 23. He/She develops ways to encourage me.
. 24. He/She provides me with reasons to change the way I think about problems.
25. He/She treats each o f us as an individual.
. 26. He/She gives me what I want in exchange for my showing support for him/her.
_ 27. He/She shows that he/she is a firm believer in "if it is not broken, do not fix it."
_ 28. He/She avoids getting involved in our work.
. 29. He/She is viewed as a symbol of success and accomplishment.
. 30. He/She uses symbols and images to focus my efforts.
.3 1 . He/She emphasizes the use o f intelligence to overcome obstacles.
. 32. He/She finds out what I want and helps me get it.
.3 3 . He/She commends me when I do good work.
. 34. He/She avoids intervening except when I fail to meet objectives.
. 35. He/She doesn't get in touch with me if I don't get in touch with him/her.
. 36. He/She has my respect.
. 37. He/She gives me encouraging talks.
. 38. He/She requires that I back up my opinions with good reasoning.
. 39. He/She expresses appreciation when I do a good Job.
. 40. He/She sees that I get what I want in exchange for my cooperation.
.4 1 . He/She focuses attention on my mistakes.
. 42. His/Her presence has little effect on my performance.
. 43. He/She shows enthusiasm for what I need to do.
. 44. He/She communicates expectations o f high performance to me.
. 45. He/She gets me to identify key aspects o f complex problems.
Reproduced with permission of the copyright owner. Further reproduction prohibited without permission.

121
_ 46. He/She coaches me if I need it.
_ 47. He/She lets me know that I can get what I want if I work as agreed.
_ 48. He/She does not try to make improvements, as long as things are going smoothly.
_ 49. He/She is usually not around when needed.
. 50. He/She has a sense o f mission which he/she communicates to me.
.5 1 . He/She gets me to do more than I expected I could do.
. 52. He/She places strong emphasis on careful problem solving before taking action.
. 53. He/She gives me an advice when I need it.
. 54. He/She gives me clear understanding o f what we will do for each other.
. 55. A mistake has to occur before he/she takes action.
. 56. He/She is hard to find when a problem arises.
. 57. He/She increases my optimism for the future.
. 58. He/She motivates me to do more than I thought I could do.
. 59. He/She makes sure I think through what is involved before taking action.
. 60. He/She is ready to teach me whenever I need it.
.61. He/She points out what I will receive if I do what needs to be done.
. 62. He/She concentrates his/her attention on my failure to meet expectations.
. 63. He/She makes me feel that whatever I do is okay with him/her.
. 6 4 .1 trust his/her ability to overcome any obstacle.
. 65. He/She heightens my motivation to succeed.
. 66. He/She gets me to use reasoning and evidence to solve problems.
. 67. He/She gives newcomers a lot o f help.
. 68. He/She praises me when I do a good job.
. 69. He/She arranges to know when things go wrong.
70. He/She doesn't tell me where he/she stands on issues.
Reproduced with permission of the copyright owner. Further reproduction prohibited without permission.

122
B. Tell us something about yourself. Kindly check the appropriate repsonses.
I. Age Range: 20-30 31-40 41-50 51-60 61-70
2. Gender:MaleFemale
3. Highest Educational Attainment:
Bachelor’swith Masteral unitsM aster’swith Doctoral units Doctorate O thers (specify)
4. How many years have you been teaching? .
Thank you very much for your time.
Reproduced with permission of the copyright owner. Further reproduction prohibited without permission.

APPENDIX H - SCHOOL MEAN SCORES ON THE LEADERSHIP SCALES
123
Reproduced with permission of the copyright owner. Further reproduction prohibited without permission.

124
School TransformationalLeadership
j Transactional Laissez-Faire Leadership
School 1 i
M 2.45 2.55 3.70
! SD .69!
.74 1 .61
n 38' ■ ■ !
46 45r
School 2 !
M 2.48 2.50 3.71
SD .66 .75 i .54
n 14 13 13
School 3 j
M 2.05 2.22 3.32
SD i .54 .48i
.74
n 37 40 44
School 41I M 1.88 2.04 3.06
SD .82 1.02 1.01
n 16 18 17
School 51
1 M ! 1.85 2.06 3.53
: SD i .40! 1
.51 I .78
! 6 5 6
School 6 !I1
M 2.30 2.41 3.30
SD .78 ..72 .56
n 28 30 321
School 7 1 !
M 1.95 2.22 3.92
SD .39 ..37 .55
n 19 17 20
School 8
M 2.42 2.45 3.37
SD .61 .59 .62
n 25 26 27(table continued)
Reproduced with permission of the copyright owner. Further reproduction prohibited without permission.

125
I School1
TransformationalLeadership
TransactionalLeadership
Laissez-Faire
School 9
M 2.00 2.24 3.75
SD .31 .43 .78
n 34 34 35!
School 10
M■
2.11 1.98 3.16
SD .71 .64 .46
n 13 13 13
School 11
M 2.06 2.07 3.02
SD .44 .52 .71
n 20 21 20
School 12 1M 2.75 2.75 3.28
SD .65 .551
.60
n 41 42 43
School 13 !
M 2.10 1.98 3.15
SD .58 .50 .81
n 42 45 42
School 141 i
1 !
M 1.20 1.75 3.73
SD .17 .49 .66
n 10 13 13
School 15
M 2.11 2.28 3.55
SD .58 .61 .74
n 16 16 16(table continued)
Reproduced with permission of the copyright owner. Further reproduction prohibited without permission.

126
School i Transformational 1 Leadership
TransactionalLeadership
Laissez-Faire
School 16
M 1.62 1.57 3.16
SD .41 .48 .8 4
n 14 14 15
School 17
M 1.54 1.84 3.80
SD .44 .42 .49
n 27 28 28
School 18
M 1.49 1.69 3.39
SD .43 .47 .73
n 23 24 22
School 19
M 1.24 1.34 3.48
SD .28 .34 .67
n 23 24 24
School 20
M 1.82 2.03 3.35
SD .61 I .61 .60
n1
58 ! 59 1 62
School 2 1 !
M i 1.85 1.96 3.04
SD .65 .60 .71
n 16 20 18
School 22
M 1.71 1.94 3.34
SD .44 .54 .93
n 15 15 16
School 23
M 1.33 1.74 3.94
SD .37 .43 .47
n 13 13 14(table continued)
Reproduced with permission of the copyright owner. Further reproduction prohibited without permission.

127
School ! Transformational 1 Leadership
ITransactional
LeadershipLaissez-Faire
School 24 i
M 2.05 1.95 3.38
SD .43 .50 .49
n 10 1. 12
School 25
j M 1.40 1.80 3.33Ii SD .30 .35 1.00
n 15 15 15
School 26
M 2.16 2.22 3.23
SD .48 .57 .77
n 47 51 47
School 27 1i
M 1.96 2.071
3.51 i
SD .56 .49 .67
n 32 34 32 j
School 28 1 !
M 3.08 3.01 3.04
SD .54 .621
.46 i
n 31 31 33
School 29
M 1.82 2.06 3.33
SD .79 .67 .73
n 28 34 34
School 30
M 1.54 1.74 3.54
SD .39 .47 .89
n 67 70 70
School 31
M 2.42 2.50 3.15
SD .87 .80 .78
n 23 27 24(table continued)
Reproduced with permission of the copyright owner. Further reproduction prohibited without permission.

128
School TransformationalLeadership
TransactionalLeadership
Laissez-Faire
School 32
M 1.77 2.13 3.26
SD .59 .48 .65
n 29 30 31
School 3311
M 1.92 1.90 3.20
SD .47 .54 .86
n 21 24 23
School 34
M 1.81 1.86 2.84
SD .37 .40 .75
n 21 22 21
School 35 Î . 1
M 1.86 2.11■
3.40
SD ,62 .55 .72
n 8 11 . "
School 36 i
M 1.86 1.96'
3.40
SD .62 .71 72
n 54 55 55[Vote. The mean score corresponds to the scale: 1 = always. 2 = fairly often. 3 = sometimes. 4 = once ina while, and 5 = not at all. The mean scores are based on the teachers’ response in the revised MLQ-5R (Rater Form).
Reproduced with permission of the copyright owner. Further reproduction prohibited without permission.
VITA
Mary Sylvette Tanjuan Gunigundo was bom on October 8, 1968 in Quezon
City, Philippines. She is the third child of Magtanggol Contreras Gunigundo and Sylvia
dela Cruz Tanjuan-Gunigundo. Her father serves as the Chairman of the Presidential
Commission on Good Government until June 30, 1998. Afterwards, her father returns
to his law practice. Her mother is an educator. In 1972, Sylvette's mother built a
school and named it MARIS YL SCHOOL, in honor of Sylvette's deceased sister.
Currently, the family-owned school has about 1,000 students (nursery to high school).
Mary Sylvette or Marivette to her friends, has five siblings: Magtanggol I (Magivio) - a
lawyer and congressman; Maria Sylvia (Marisyl) - deceased who died at age four;
Marie Sylvie Easter (Mariel) - a doctor; Magtanggol U (Jomag) - a second year high
school student; and Mercy Grace - a pre-nursery student.
In 1989, Mary Sylvette received a Bachelor of Secondary Education degree,
with major in Mathematics and minor in Chemistry, from the University of the
Philippines - Diliman, Quezon City. In 1991, she received her Master of Education
degree, with major in Administration and Supervision, from Northeast Louisiana
University - Monroe. She also received her Education Specialist degree from Northeast
Louisiana University in 1992, with the same major as her Master’s degree. She is
currently a candidate for a Doctor of Philosophy degree, with major in Educational
Leadership and Research, at Louisiana State University - Baton Rouge. After her
doctoral studies, Sylvette plans to return to the Philippines where she hopes to make an
impact on the education of the Filipino people.
129
Reproduced with permission of the copyright owner. Further reproduction prohibited without permission.
DOCTORAL EXAMINATION AND DISSERTATION REPORT
Candidate: Mary S y l v e t t e Tanjuan Gunigundo
Major Field: Educational Leadership and Research
Title of Dissertation: An Explorat ion o f the R e la t io n s h ip Between PrincipalLeadership S t y l e and Student Academic Achievement in the P h i l ip p in e s
Approved:A
Date of Examination:
June 12, 1998
EXAMINING COMMITTEE;
A / J L
Reproduced with permission of the copyright owner. Further reproduction prohibited without permission.

IMAGE EVALUATION TEST TARGET (Q A -3 )
1 . 0 m- I . L i K â mil 2.2
Ï: K :
I . l L . .
III 2 .0
- - -
m
1 . 2 5 1 .4 II II 1.6
150mm
V
«P.7
O7
7
/A P P L IE D A IM7JGE . Inc1653 East Main Street
- Roctiester. NY 14609 USA Phone: 716/482-0300
------- Fax: 716/288-5989
C 1993. Applied Image. Inc.. Ail Rights Reserved
Reproduced with permission of the copyright owner. Further reproduction prohibited without permission.