
An Experimental Study into Objective Quality Assessment of Watermarked Images
21
Anurag Mishra, Aruna Jain, Manish Narwaria & Charu Agarwal International Journal of Image Processing (IJIP), Volume (5) : Issue (2) : 2011 199 An Experimental Study into Objective Quality Assessment of Watermarked Images Anurag Mishra [email protected] Department of Electronics, Deendayal Upadhyay College, University of Delhi, New Delhi 110015, India Aruna Jain [email protected] Department of Computer Science, Bharti College, University of Delhi, New Delhi 110058, India Manish Narwaria [email protected] School of Computer Engineering, Nanyang Technological University, Singapore 639798, Singapore Charu Agarwal [email protected] Department of Computer Science, University of Delhi, New Delhi 110007, India Abstract In this paper, we study the quality assessment of watermarked and attacked images using extensive experiments and related analysis. The process of watermarking usually leads to loss of visual quality and therefore it is crucial to estimate the extent of quality degradation and its perceived impact. To this end, we have analyzed the performance of 4 image quality assessment (IQA) metrics – Structural Similarity Index (SSIM), Singular Value Decomposition Metric (M-SVD), Image Quality Score (IQS) and PSNR on watermarked and attacked images. The watermarked images are obtained by using three different schemes viz., (1) DCT based random number sequence watermarking, (2) DWT based random number sequence watermarking and (3) RBF Neural Network based watermarking. The signed images are attacked by using five different image processing operations. The similarity parameter SIM (X, X*) is also computed for signed and attacked images after extracting watermarks and its computed values are correlated with other results. We observe that the metrics behave identically in case of all the three watermarking schemes. An important conclusion of our study is that PSNR is not a suitable metric for IQA as it does not correlate well with the human visual system’s (HVS) perception. It is also found that the M-SVD scatters significantly after embedding the watermark and after attacks as compared to SSIM and IQS. Therefore, it is a less effective quality assessment metric for watermarked and attacked images. In contrast to PSNR and M-SVD, SSIM and IQS exhibit more stable and consistent performance. Their comparison further reveals that except for the case of counterclockwise rotation, IQS relatively scatters less for all other four attacks used in this work. It is concluded that IQS is comparatively more suitable for quality assessment of signed and attacked images. Keywords: Digital Image Watermarking, Image Quality Assessment, PSNR, M-SVD, SSIM, IQS. 1. INTRODUCTION Digital watermarking of images can be primarily classified into two categories: Perceptible and Imperceptible. These can be further classified as fragile or robust, depending upon the application. A watermarking technique can be perceptible and fragile on one hand and
-
Upload
cscjournals -
Category
Education
-
view
104 -
download
0
Transcript of An Experimental Study into Objective Quality Assessment of Watermarked Images

Anurag Mishra, Aruna Jain, Manish Narwaria & Charu Agarwal
International Journal of Image Processing (IJIP), Volume (5) : Issue (2) : 2011 199
An Experimental Study into Objective Quality Assessment of Watermarked Images
Anurag Mishra [email protected] Department of Electronics, Deendayal Upadhyay College, University of Delhi, New Delhi 110015, India
Aruna Jain [email protected] Department of Computer Science, Bharti College, University of Delhi, New Delhi 110058, India
Manish Narwaria [email protected] School of Computer Engineering, Nanyang Technological University, Singapore 639798, Singapore
Charu Agarwal [email protected] Department of Computer Science, University of Delhi, New Delhi 110007, India
Abstract
In this paper, we study the quality assessment of watermarked and attacked images using extensive experiments and related analysis. The process of watermarking usually leads to loss of visual quality and therefore it is crucial to estimate the extent of quality degradation and its perceived impact. To this end, we have analyzed the performance of 4 image quality assessment (IQA) metrics – Structural Similarity Index (SSIM), Singular Value Decomposition Metric (M-SVD), Image Quality Score (IQS) and PSNR on watermarked and attacked images. The watermarked images are obtained by using three different schemes viz., (1) DCT based random number sequence watermarking, (2) DWT based random number sequence watermarking and (3) RBF Neural Network based watermarking. The signed images are attacked by using five different image processing operations. The similarity parameter SIM (X, X*) is also computed for signed and attacked images after extracting watermarks and its computed values are correlated with other results. We observe that the metrics behave identically in case of all the three watermarking schemes. An important conclusion of our study is that PSNR is not a suitable metric for IQA as it does not correlate well with the human visual system’s (HVS) perception. It is also found that the M-SVD scatters significantly after embedding the watermark and after attacks as compared to SSIM and IQS. Therefore, it is a less effective quality assessment metric for watermarked and attacked images. In contrast to PSNR and M-SVD, SSIM and IQS exhibit more stable and consistent performance. Their comparison further reveals that except for the case of counterclockwise rotation, IQS relatively scatters less for all other four attacks used in this work. It is concluded that IQS is comparatively more suitable for quality assessment of signed and attacked images. Keywords: Digital Image Watermarking, Image Quality Assessment, PSNR, M-SVD, SSIM, IQS.
1. INTRODUCTION
Digital watermarking of images can be primarily classified into two categories: Perceptible and Imperceptible. These can be further classified as fragile or robust, depending upon the application. A watermarking technique can be perceptible and fragile on one hand and

Anurag Mishra, Aruna Jain, Manish Narwaria & Charu Agarwal
International Journal of Image Processing (IJIP), Volume (5) : Issue (2) : 2011 200
imperceptible and robust on the other. The criteria of imperceptibility and robustness are sometimes mutually exclusive. The watermark should be such that it is robustly embedded within the cover image and at the same time it should not degrade the perceptible quality of the signed image. Both these requirements have to be fulfilled in a well optimized watermarking algorithm. Precisely due to this reason, the digital watermarking of images is presently perceived as an optimization problem that can be solved using soft computing tools [1], [6]-[8]. Another very important requirement of a good watermarking technique is that it should not affect the perceived visual quality of the processed image significantly. That is, the modifications caused in the image due to the watermarking operation should be such that they are imperceptible to the Human Visual System (HVS). To this end, various researchers have published different schemes in which they attempt to model the HVS in order to watermark the cover images [2], [9]-[10]. Such watermarking schemes primarily take into account three different characteristics of the HVS namely luminance, contrast sensitivity and edge sensitivity. It has been established now that if the watermarking algorithm is implemented using HVS model, the objective quality score of the signed images is found to be higher. At the same time, if the watermark embedding procedure is well optimized, the robustness criterion is also fulfilled. In such a situation, the watermark embedding algorithm is the best optimized one. Quality assessment of watermarked images is important since watermarking in general is a popular field for multimedia security related applications. Most studies in the existing literature have not focused on quality assessment of watermarked images. Conventionally, two image quality assessment (IQA) metrics – the Mean Squared Error (MSE) and its relative Peak Signal to Noise Ratio (PSNR) have been widely used and reported in literature [2], [6]. The PSNR is calculated using the MSE. Both these metrics are simple in terms of mathematical computation – both complexity and time. However, the physical meaning of MSE is simply the quantified assessment of the error in terms of difference between the original and distorted images. Therefore, the MSE and PSNR are not found to correlate well with the perception of the HVS. It is due to this reason that more advanced quality assessment models should be developed to quantify the quality of images in general and watermarked and attacked images in particular. Aziz and Chouinard [11] have probably for the first time reported an experimental approach to delve into the issue of IQA for watermarked images. They have used three different metrics – PSNR, weighted PSNR (wPSNR) and Watson Perceptual Metric (WPM) based on Just Noticeable Difference (JND) parameter for watermarked images obtained by using DWT decomposition of the original images. They have also argued that PSNR does not model HVS well. The second metric wPSNR is a modified variant of PSNR and is able to identify the textured areas of the original and watermarked images. Only the third metric – WPM, based on Watson model [11] is found to correlate with HVS up to some extent. The Watson model relies on context masking and pooling to create a response similar to the human perception. However, it can be noted that WPM does not take structural properties of the original or distorted / watermarked images into account. Shnayderman et. al [12] have computed the M-SVD values for watermarked images obtained by implementing seven standard watermarking schemes. They have reported that their numerical measure computes the global error (M-SVD) with values that range from 0.385 to 16.152 depending on what is embedded within the cover image. Thus, it can be noted that M-SVD values tend to scatter from minimum to maximum by introducing a small perturbation within the original images. Both groups [11]-[12] have not extended their work beyond watermark embedding and quality assessment of signed images. Recently, a new quality assessment metric CPA2 has been proposed specifically for watermarked images [13]. However, in this case also, the authors do not go beyond developing a new metric and ranking of only watermark embedding algorithms on the basis of computed perceptibility of signed images. Thus, overall, quality assessment of watermarked images remains a relatively uninvestigated area and calls for further investigations.
2. QUALITY ASSESSMENT METRICS USED IN IMAGE PROCESSING As mentioned earlier, MSE/PSNR is the standard and widely used metric for quality assessment. Physically, it represents the error due to difference between the original and distorted images.

Anurag Mishra, Aruna Jain, Manish Narwaria & Charu Agarwal
International Journal of Image Processing (IJIP), Volume (5) : Issue (2) : 2011 201
Mathematically it is given, for a grayscale image wherein the intensity range of pixels is 0-255, by Eqn. 1.
1 121
0 0
|| ( , ) ( , ) ||m n
m n
i j
M SE I i j K i j− −
= =
= −∑ ∑ (1)
where I(i, j) and K(i, j) are intensity values at pixel locations (i, j) in the original and distorted images of size m x n respectively. Lower the numerical value of MSE, better is the image quality. As the image is considered as a signal represented in spatial domain, any amount of noise or distortion may be found to affect its quality significantly. After adding noise to the image, the assessment of the ratio of signal component to noise component is done using PSNR. This parameter makes use of MSE and gives an assessment up to what extent the peak noise is present within the signal (image). Mathematically, it is given by Eqn. 2.
2
10 1010 . log ( ) 20. log ( )I IM A X M A X
M SE M SEPSN R = =
(2) where MAXI is the maximum intensity of the pixels of the image and MSE is the mean square error for the pixels. To overcome the aforementioned limitations of MSE/PSNR, substantial research effort has been put in recent years to devise their alternative [3]-[4], [14]. Some IQA metrics purely use the structural properties of the images [3], while others do not depend on them [4]. They rather make use of the singular values of the image matrix and quality of the image is evaluated on the basis of the difference in singular values of the original and perturbed images [4]. There are other models which make use of both - the structural properties of the images as well as their singular values [14]. Wang and Bovik [3] proposed a well cited image quality assessment metric known as Universal Image Quality (UIQ) and also its improved variant known as Structural Similarity Index Metric (SSIM). They have contended that in case of the SSIM model, image distortion is perceived as a combination of three different factors - loss of correlation, loss of mean distortion and loss of variance distortion. The SSIM is based on the concept that the HVS extracts structural information from the viewing field and therefore, a measurement of structural distortion can yield a good approximation of perceived image distortion. Mathematically, SSIM is given by Eqn. 3.
1 2
2 2 2 2
1 2
(2 )(2 )
( )( )
x y xy
x y x y
C CSSIM
C C
µ µ σ
µ µ σ σ
+ +=
+ + + + (3)
where
1
1
n
x n ii
xµ=
= ∑ and
1
1
n
y n iiyµ
=
= ∑ are mean intensity or luminance component of
image signals x and y respectively. C1=(K1L)2 and C2=(K2L)
2 are constants with L being the
dynamic range of the grayscale image (0-255) and K1<<1 and K2<<1 being small constants. Besides this,
( )
212
11
,n
x i xni
x µσ −=
= −∑ ( )2
2 11
1
n
y i yni
y µσ −=
= −∑ and
( )( )12
11
n
xy i x yini
yx µ µσ −=
= − −∑ (4)
In Eqn. 4, σx and σy are signal contrast given by standard deviation for x and y respectively and is used to estimate contrast comparison for SSIM. The structure of the two images is associated with the correlation (inner product) σxy between two unit vectors (xi - µx)/ σx and (yi - µy)/ σy lying in the image hyper plane. Shnayderman et. al. [4] have applied the Singular Value Decomposition (SVD) to images to evaluate the image quality and named their metric as M-SVD. In this method, the image quality is
B
DDB
j
midj∑=
−1
||

Anurag Mishra, Aruna Jain, Manish Narwaria & Charu Agarwal
International Journal of Image Processing (IJIP), Volume (5) : Issue (2) : 2011 202
evaluated by quantifying the difference of singular values between the original and distorted images. However, in this case, the singular vectors are completely ignored. In other words, by using singular values for quality evaluation, only the luminance factor is taken into account and the structural information contained in the singular vectors is not used. The numerical measure M-SVD is derived from the graphical measure given by Eqn. 5. It computes the global error expressed as a single numerical value depending on the distortion type as given by Eqn. 6. M-SVD = (5) where for each j
th block we calculate
Dj = (6) where b defines the block size (in an image with size of r x c), B = r/b x c/b, and Dmid represents the midpoint of the sorted Dj’s. For the experimental results reported in this paper, we have used the commonly used block size of 8x8 i.e. b=8. Narwaria and Lin [14] have argued that the mathematics of SVD provides a more general and characteristic view on changes of an image and structural information is crucial in image quality prediction. They have quantified the structural distortions in images using singular vectors. In their paper, they have further argued that the singular vectors denote clearer physical meaning for representing structural information, in comparison with the existing measures [3]-[4]. According to them, the changes in the singular vectors are related to those in the singular values which primarily reflect the image luminance only. Therefore, their proposed metric is capable of predicting visual quality in more general situations (i.e., with different types of distortions) as it takes into account singular vectors after decomposing the image matrix using SVD. The image quality score (IQS) is computed using the Minkowski Metric (MM) summation of the errors in singular vectors. IQA is also found to be scalable due to the ordering of singular vectors in the order of their perceptual significance. Moreover, the IQS has been shown to be an effective IQA metric demonstrating good prediction performance on a large number of distorted images. As said earlier, the numerical measure for change in U and V is expressed using Minkowski metric as
1
1
{ }t
mm
sj
j
q γ=
= ∑ (7)
where m (>1) is a control parameter. A larger value of m puts more emphasis on large γj values. Narwaria and Lin [10] used m=2 for their practical computations. The final image quality score or IQS is determined using logarithmic scale. This is done to tackle the high dynamic range of qs. Thus, we have
ln(1 )
sIQS q= +
(8) where the inclusion of constant 1 avoids the infinite value when qs approaches 0. Since the first few singular vectors convey the major structural information, so Eqn. 7 is modified to obtain Eqn. 9 which will be finally used to compute IQS using Eqn. 8.
∑=
−b
i
p
ii
1
2)( }{ σσ

Anurag Mishra, Aruna Jain, Manish Narwaria & Charu Agarwal
International Journal of Image Processing (IJIP), Volume (5) : Issue (2) : 2011 203
1
1
{ }K
mm
sj
j
q γ=
= ∑ (9)
where K < t and K can be chosen depending on the computational cost metric performance. This shows the scalability of the IQS metric since we can use lesser number of singular vectors for quality prediction with reasonable and graceful degradation in prediction performance. In the following sections, we report the experimental comparison of the performance of PSNR, SSIM, M-SVD and IQS for quality assessment of watermarked and attacked images. It can be noted that the four aforementioned metrics are full reference metrics i.e. they use the reference and the processed image for quality score computation. The watermarking of grayscale image Lena of size 256 x 256 pixels is done in low frequency DCT and DWT coefficients by three different methods. It has been established that the most robust watermarking can be achieved in case the watermark is embedded in the low frequency AC / DCT / DWT coefficients in transform domain of original image [5]. Moreover, any study on digital image watermarking is incomplete without executing image processing attacks over signed images and extraction of watermarks from signed as well as attacked images. Therefore, in the present work, five different image processing operations are executed to assess the visual quality of attacked images. Watermark extraction is performed both for the signed as well as attacked images of all three schemes. The similarity correlation parameter SIM (X, X*) is computed after extraction and correlated with other results for these images using Eqn 12.
3. EXPERIMENTAL WORK This experimental work is classified in the following categories: (1) Watermarking of standard grayscale Lena image of size 256 x 256 pixels by using three
different algorithms – (1) DCT based random number sequence watermarking, (2) DWT random number sequence watermarking and (3) Radial Basis Function Neural Network watermarking. In this work, three different schemes are chosen with an objective to observe and compare the performance of all three metrics on different watermark embedding algorithms. As a result of the watermarking operation, a set of three signed Lena images is obtained.
(2) Applying five image processing attacks on these signed images as prescribed by StirMark
standard. These attacks are (a) Counter clockwise rotation with 900, (b) Gaussian Blur of
radius = 1 unit, (c) Adding 10% Gaussian Noise to watermarked images, (d) Median Filtering (Filtering Aperture = 3) and (d) JPEG compression with quality factor Q=0.9 or compression ratio = 10%.
(3) The watermarked and attacked images are subject to quality assessment by PSNR and three
other metrics – SSIM, M-SVD and Image Quality Score (IQS). The results of the three metrics obtained for signed and attacked images are compared for their relative scattering before and after execution of attacks. To the best of our knowledge, any such experiment, the analysis of the data obtained thereafter and its comparison on watermarked and attacked images on the basis of these IQA metrics is never reported in literature.
(4) Finally, watermark extraction from signed and attacked images of all three embedding
schemes is performed. Similarity correlation parameter SIM(X, X*) is further computed for the extracted random number sequences from these images using Eqn. 12. The values of IQA metrics are compared and analyzed in the context of computed SIM(X, X*) values for these images.

Anurag Mishra, Aruna Jain, Manish Narwaria & Charu Agarwal
International Journal of Image Processing (IJIP), Volume (5) : Issue (2) : 2011 204
3.1 DCT based Random Number Sequence Watermarking The grayscale image Lena is first decomposed into 8 x 8 blocks in spatial domain. All the blocks are then transformed into frequency domain by applying DCT algorithm. All AC coefficients of these blocks are sorted in decreasing order of their contribution to the image. Thus, the AC coefficients are now arranged in the descending order – from highest to lowest, the highest contribute the most while the lowest contribute the least. We have selected first 1024 coefficients from the top of this sequence. These coefficients are ones which constitute the low frequency coefficients of the image. According to Cox et. al [4], robust watermarking can be implemented if the watermarks are embedded in the low frequency coefficients of the image. However, in such a case, the effect of watermark embedding may be significant in terms of perceptible quality of signed image. In the present case, the watermark is a sequence of 1024 random numbers normalized with N(0, 1). These random numbers are combined with the selected 1024 AC coefficients by using Eqn. 10 [5].
'
(1.0 )i i iv v xα= + (10)
where v i are the low frequency DCT coefficients, α = 0.1 is the scaling parameter also known as watermarking strength and xi is the normalized random number of the watermark sequence. As a result of the computation outlined in Eqn. 10, the modified DCT coefficients v’i are obtained. These modified coefficients v’i are then reinserted at their respective pixel locations within the image in the transform domain. This image is applied with Inverse DCT (IDCT) to re-transform it into spatial domain. The resulting image is the signed image. This process of embedding the normalized random number sequence as watermark within the grayscale cover image Lena is depicted in Fig. 1.
FIGURE 1: Block diagram of embedding random number sequence watermark within Lena using DCT
3.2 DWT based Random Number Sequence Watermarking The second watermark embedding algorithm used in this work is based on computing three levels of DWT coefficients of grayscale Lena image. As the size of the cover image is 256 x 256 pixels, after three levels of wavelet decomposition using DWT using ‘Haar filter’, a block of size 32 x 32 coefficients is obtained as LL3 region. These are 1024 low frequency coefficients obtained by applying DWT transform over the image. The same normalized random number sequence obtained previously is used as watermark to be embedded within these low frequency coefficients by using Eqn. 10. These modified coefficients will now be reinserted at their respective pixel locations within the image in transform domain. The resulting image is then applied with Inverse DWT (IDWT) to obtain the signed image in the spatial domain. This process of embedding the random watermark sequence is depicted in Fig. 2.
Transformed Image
+
Signed Image
Random Number Sequence Watermark
IDCT
DCT
Original Image

Anurag Mishra, Aruna Jain, Manish Narwaria & Charu Agarwal
International Journal of Image Processing (IJIP), Volume (5) : Issue (2) : 2011 205
FIGURE 2: Block diagram of embedding random number sequence watermark within Lena using DWT 3.3 Radial Basis Function Neural Network (RBF – NN) based Watermarking The third watermark embedding algorithm implemented in this work is close to one reported by Cheng-Ri Piao et. al [15]. They have proposed a new blind watermarking scheme in which a watermark is embedded within the image transformed by 4 - level DWT decomposition using ‘9/7 orthogonal filter’. Their method uses the HVS model and the Radial Basis Function Neural Network (RBF-NN). RBF is implemented while embedding and extracting the watermark by them. However, we have implemented only the watermark embedding component of their work. For this purpose, we have done a 3 – level DWT decomposition of the original image using ‘Haar filter’. The human visual system (HVS) model is used to determine the watermark insertion strength. The inserted watermark is the same normalized random number sequence used in previous two cases. The secret key used in the algorithm determines the beginning position of the image where the watermark is embedded. Listing 1 gives the embedding procedure used here which is similar to one proposed by Cheng-Ri Piao et. al [15]. Listing 1: RBF-NN Watermark Embedding Procedure Step1: Transform an original image using the 3-level DWT transform. C(i) is the LL3, LH3, HL3, and HH3 sub-band coefficients. Step2: Select the beginning position of watermark embedding coefficient C(i) using the secret key. Step3: Quantize the DWT coefficient C(i+key) by Q, as the input value of RBF then get the output RBF(round(C(i+key)/Q)) Step4: Embed the watermark according to the Eqn. 11 which uses the output value of the RBF neural network (RBF(round(C(i+key)/Q))) and Q.
7≤+
=′ +
+ iiQ
c keyi
keyi xxRoundRBFc
(11) where xi is the random sequence watermark, Q is a quantization value, and C’i is the coefficient value when watermark is embedded. Then perform IDWT to get the watermarked image. Fig. 3 depicts the block diagram of this watermark embedding procedure.
Original Image
Transformed Image
+
Signed Image
Random Number Sequence Watermark
IDWT
DWT

Anurag Mishra, Aruna Jain, Manish Narwaria & Charu Agarwal
International Journal of Image Processing (IJIP), Volume (5) : Issue (2) : 2011 206
FIGURE 3: Watermark embedding procedure using RBF Neural Network
3.4 Executing Attacks Over Signed Images As mentioned in Section III(2), the signed images obtained after embedding the watermarks in grayscale Lena image are subject to a five StirMark image processing attacks. These attacks are implemented by using MATLAB codes and Adobe Photoshop. These are aimed to verify the robustness and quality of signed images after attacks. Having implemented these attacks, we acquired a set of 3 signed images and 15 (5 attacks x 3 embedding procedures) attacked images. 3.5 Quality Assessment of Signed & Attacked Images All these images are now checked for quality by using PSNR, SSIM, M-SVD and IQS. These results are compiled and tabulated in the Section IV. 3.6 Extraction of Watermarks and Computing SIM(X, X*) Correlation Parameter The watermark is also extracted from all signed and attacked images of all three schemes. Similarity correlation parameter SIM(X, X*) is computed for the extracted watermarks using Eqn. 12. These computed values are analyzed and compared with other results of this work in Section IV and V.
* * * *
1 1
( , ) ( ) / ( )n n
i i
SIM X X X X X X= =
= ⋅∑ ∑ (12)
In Eqn. 12, X and X* are respectively original and recovered watermark sequences.
4. RESULTS AND DISCUSSION
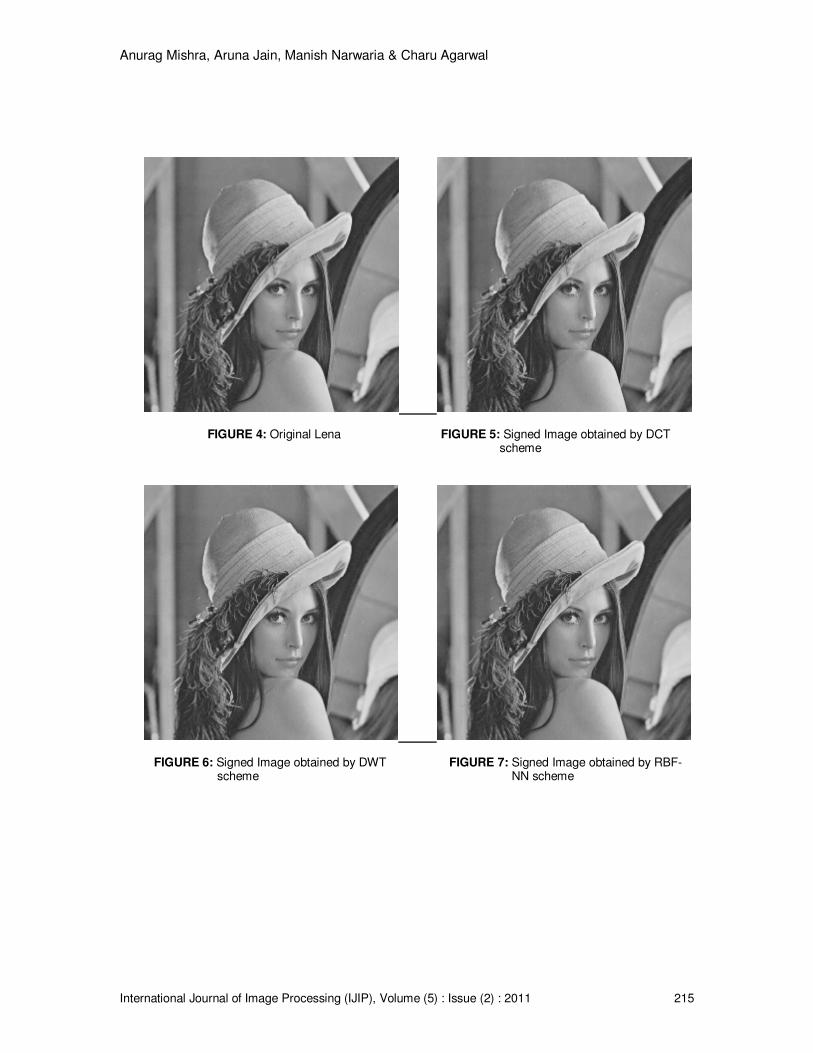
4.1 Quality Assessment of Watermarked Images The original grayscale Lena image of size 256 x 256 is depicted in Fig. 4. Signed images obtained after embedding the random number sequence watermark using DCT based scheme, DWT based scheme and RBF-NN based scheme over this image are shown in Fig. 5-7 respectively.
Original Image
+
Signed Image
Random Number Sequence Watermark IDWT
DWT KEY
iQ
c keyi
keyi xRoundRBFc +
=′ +
+

Anurag Mishra, Aruna Jain, Manish Narwaria & Charu Agarwal
International Journal of Image Processing (IJIP), Volume (5) : Issue (2) : 2011 207
TABLE 1: PSNR, SSIM, M-SVD and Image Quality Score (IQS) for three embedding algorithms It is clear that the perceptible quality of the signed images is very good. The quality is also objectively assessed and is tabulated in Table 1. A careful observation of Table 1 indicates following points: 1. The quality of the signed image is the best after embedding the watermark in case of DWT
based random number sequence algorithm while it is worst in case of DCT based random number sequence method, RBF-NN watermarking algorithm follows the DWT based method. This is indicated by all IQA metrics used in this work. Note that a higher M-SVD implies lower quality while higher values of IQS, SSIM and PSNR indicate higher quality. Thus, on the expected lines, we see that the M-SVD values decrease whereas PSNR, SSIM and IQS values increase as quality of the signed image goes from worst to the best.
2. Among the four quality assessment metrics used in this work, PSNR and M-SVD parameters tend to scatter significantly after introducing a small perturbation (watermark) within the cover image. As mentioned before, Shnayderman et. al [12] have reported that their numerical measure computes the global error with values that range from 0.385 to 16.152 depending on what is embedded within the cover image. We have, however, embedded the same random number sequence as watermark in all three watermarking schemes. In our case, the M-SVD values range from 1.7861 to 5.5072. This shows a significant scattering in M-SVD values for signed images which agrees with the results reported by Shnayderman et al [12]. On the other hand, the metrics that utilize structural information in images tend to be significantly stable. This can be explained since PSNR is nothing more than a simple average of pixel errors. Since the pixel error is computed by squaring (i.e. raising to power 2) the difference between the pixels, this may magnify/amplify small errors which are otherwise imperceptible to the human eye. A similar reasoning also explains the relatively poor performance of the M-SVD metric which also involves squared difference between the singular values of the original and watermarked image blocks. In contrast to this, metrics such as SSIM and IQS tend to judge the quality based on the overall structural changes and therefore tend to exhibit more stable and consistent performance. In view of the above, we believe that the SSIM and the IQS are more suitable candidates for the quality assessment of watermarked images.
We now further extend our experiment from simple watermark embedding within the cover image to implementing image processing attacks on the signed images obtained thereafter. The results of attacks are presented and analyzed in the next section. 4.2 Assessment of Watermarked Image Quality after Executing Image Processing Attacks As mentioned in III(2), the attacks applied on the watermarked images are: (a) Counter clockwise rotation with 90
0, (b) Gaussian Blur of radius = 1 unit, (c) Adding 10% Gaussian Noise to
watermarked images, (d) Median Filtering (Filtering Aperture = 3) and (e) JPEG compression with
Watermarking
Scheme
PSNR
SSIM
M-SVD
Image Quality Score (IQS)
DCT Random Sequence
Watermarking 43.1818 0.9983 5.5072 3.3449
DWT Random Sequence
Watermarking 57.7806 0.9997 1.7861 3.4751
RBF-NN Watermarking
51.2441 0.9989 3.0530 3.4200
Anurag Mishra, Aruna Jain, Manish Narwaria & Charu Agarwal
International Journal of Image Processing (IJIP), Volume (5) : Issue (2) : 2011 208
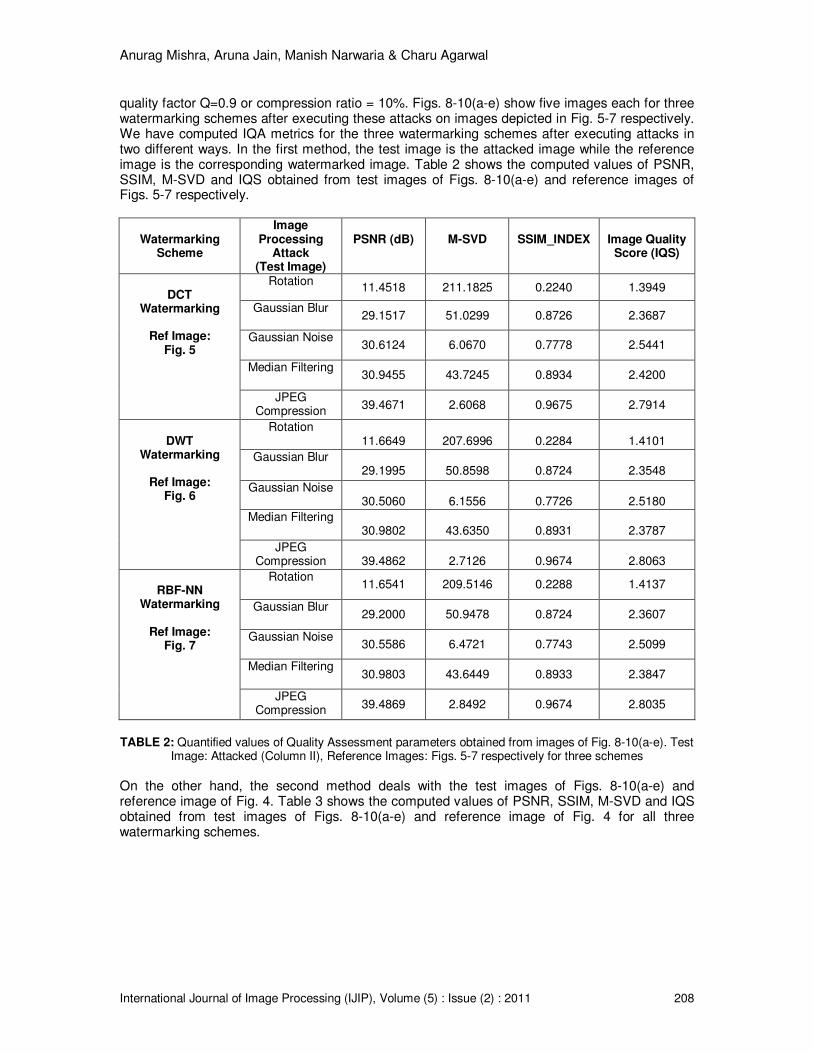
quality factor Q=0.9 or compression ratio = 10%. Figs. 8-10(a-e) show five images each for three watermarking schemes after executing these attacks on images depicted in Fig. 5-7 respectively. We have computed IQA metrics for the three watermarking schemes after executing attacks in two different ways. In the first method, the test image is the attacked image while the reference image is the corresponding watermarked image. Table 2 shows the computed values of PSNR, SSIM, M-SVD and IQS obtained from test images of Figs. 8-10(a-e) and reference images of Figs. 5-7 respectively.
Watermarking
Scheme
Image Processing
Attack (Test Image)
PSNR (dB)
M-SVD
SSIM_INDEX
Image Quality Score (IQS)
DCT
Watermarking
Ref Image: Fig. 5
Rotation 11.4518 211.1825 0.2240 1.3949
Gaussian Blur 29.1517 51.0299 0.8726 2.3687
Gaussian Noise 30.6124 6.0670 0.7778 2.5441
Median Filtering 30.9455 43.7245 0.8934 2.4200
JPEG Compression
39.4671 2.6068 0.9675 2.7914
DWT
Watermarking
Ref Image: Fig. 6
Rotation 11.6649
207.6996
0.2284
1.4101
Gaussian Blur 29.1995
50.8598
0.8724
2.3548
Gaussian Noise 30.5060
6.1556
0.7726
2.5180
Median Filtering 30.9802
43.6350
0.8931
2.3787
JPEG Compression
39.4862
2.7126
0.9674
2.8063
RBF-NN
Watermarking
Ref Image: Fig. 7
Rotation 11.6541 209.5146 0.2288 1.4137
Gaussian Blur 29.2000 50.9478 0.8724 2.3607
Gaussian Noise 30.5586 6.4721 0.7743 2.5099
Median Filtering 30.9803 43.6449 0.8933 2.3847
JPEG Compression 39.4869 2.8492 0.9674 2.8035
TABLE 2: Quantified values of Quality Assessment parameters obtained from images of Fig. 8-10(a-e). Test
Image: Attacked (Column II), Reference Images: Figs. 5-7 respectively for three schemes On the other hand, the second method deals with the test images of Figs. 8-10(a-e) and reference image of Fig. 4. Table 3 shows the computed values of PSNR, SSIM, M-SVD and IQS obtained from test images of Figs. 8-10(a-e) and reference image of Fig. 4 for all three watermarking schemes.

Anurag Mishra, Aruna Jain, Manish Narwaria & Charu Agarwal
International Journal of Image Processing (IJIP), Volume (5) : Issue (2) : 2011 209
Watermarking
Scheme
Image Processing
Attack (Test Image)
PSNR (dB)
M-SVD
SSIM_INDEX
Image Quality Score (IQS)
DCT
Watermarking
Ref Image: Fig. 4
Rotation 11.5536
3242.0
0.2264
1.4957
Gaussian Blur 29.13
432.795
0.8727
2.3410
Gaussian Noise
30.3837
198.7199
0.7757
2.5228
Median Filtering
30.6867
285.6602
0.8931
2.3840
Jpeg Compression
37.9451
71.3018
0.9661
2.7737
DWT
Watermarking
Ref Image: Fig. 4
Rotation 11.6546
3204.5
0.2289
1.5004
Gaussian Blur 29.195
442.834
0.8723
2.3666
Gaussian Noise
30.5492
193.5546
0.7741
2.5172
Median Filtering
30.9722
294.7823
0.8931
2.3956
Jpeg Compression
39.4215
59.0194
0.9671
2.7894
RBF-NN
Watermarking
Ref Image: Fig. 4
Rotation 11.6584
3206.4
0.2286
1.5043
Gaussian Blur 29.1818
442.5634
0.8720
2.3606
Gaussian Noise
30.4724
196.8129
0.7718
2.5222
Median Filtering
30.9534
294.3198
0.8926
2.4037
Jpeg Compression
39.2051
65.9834
0.9663
2.7833
TABLE 3: Quantified values of Quality Assessment parameters obtained from images of Fig. 8-10(a-e). Test
Image: Attacked (Column II), Reference Image: Fig. 4 for all three schemes
4.3 Behavior of SIM(X, X*) Parameter for Signed and Attacked Images After extraction, the recovered watermarks are compared with the original watermarks using similarity correlation parameter SIM(X, X*) given by Eqn. 12. Fig. 11(a-c) depict the SIM(X, X*) plots for the random number watermarks extracted from images of Fig. 5-7 respectively. The SIM(X, X*) values in these three cases are 18.9206, 19.2357 and 19.0732 respectively and are tabulated in Table 4. These values give rise to two prominent observations – (1) that the extraction process from the signed images is quite successful and (2) that the numerical values indicate that the extraction out of DWT watermarking scheme is the best, followed by RBF-NN and DCT watermarking schemes. This is expected as we have already concluded in section 4.1 that DWT watermarking scheme is the best whereas the RBF-NN and DCT watermarking schemes come second and third respectively. The extraction of watermarks is also done from attacked images of Figs. 8-10(a-e) and their SIM(X, X*) values are also computed. Table 4 compiles the SIM(X, X*) values for the five attacks for all three watermarking schemes. The rotation attack is found to be the worst for all three schemes as there is hardly any watermark recovery from the attacked image (very small SIM(X, X*) value). However, the Jpeg compression gives the best results among the five chosen attacks for all three schemes. These SIM(X, X*) values are also found to be well correlated with the respective values of M-SVD, SSIM and IQS as given in Table 2 and 3. For the DCT watermarking scheme, in case of rotation attack as per Table 3, the M-SVD, SSIM and IQS values are 3242.0, 0.2264 and 1.4957 respectively while they

Anurag Mishra, Aruna Jain, Manish Narwaria & Charu Agarwal
International Journal of Image Processing (IJIP), Volume (5) : Issue (2) : 2011 210
are 71.3018, 0.9661 and 2.7737 respectively for Jpeg compression attack. We know that M-SVD values increase whereas SSIM and IQS values decrease with the degradation of image quality after executing attacks. Therefore, rotation brings in the most degraded effects (worst quality) within the signed images whereas Jpeg does not degrade the signed images up to that extent. This trend can be explicitly correlated with respective SIM(X, X*) values tabulated in Table 4. For ex., the SIM(X, X*) values are 1.4093 and 18.894 respectively for rotation and Jpeg compression
Watermarking
Scheme
Image / Attack
SIM(X, X*) Correlation
Parameter
DCT
Watermarking
DCT Watermarked Image 18.9206
Rotation 1.4093
Gaussian Blur 9.1398
Gaussian Noise 9.8807
Median Filter 13.6321
Jpeg Compression 18.8940
DWT
Watermarking
DWT Watermarked Image 19.2357
Rotation 0.6088
Gaussian Blur 18.3738
Gaussian Noise 17.3372
Median Filter 18.5614
Jpeg 19.2083
RBF-NN
Watermarking
RBF-NN Watermarked Image
19.0732
Rotation 1.1165
Gaussian Blur 13.0912
Gaussian Noise 13.0564
Median Filter 15.3813
Jpeg 19.0285
TABLE 6: Computed SIM(X, X*) values for signed and attacked images of all three schemes
attacks for the DCT watermarking scheme. A smaller SIM(X, X*) indicates that there is hardly any watermark within the cover image. Even if the presence of watermark inside the cover image is known (informed watermarking), it further indicates that the attack executed on the signed image has degraded the watermark up to the extent that it is impossible to recover it. Besides this, different attacks bring in different transformations within the signed image data, thereby resulting in variance of signed image quality after executing attacks. Therefore, after rotation, the quality of the signed image is found to be degraded more as compared to Jpeg operation. This correlated behavior of computed values of the IQA metrics on one hand and SIM(X, X*) parameter on the other is established in this work in case of all three watermarking schemes.

Anurag Mishra, Aruna Jain, Manish Narwaria & Charu Agarwal
International Journal of Image Processing (IJIP), Volume (5) : Issue (2) : 2011 211
4.4 Behavior of IQA Metrics after Executing Attacks on Signed Images Results compiled in Table 2 clearly indicate that the PSNR and M-SVD values scatter significantly due to reasons outlined in Section IV (A). In fact, M-SVD is found to scatter even more significantly in comparison to PSNR after executing the image processing operations. This may be due to the fact that the attacks directly affect the singular values (luminance component) of the signed images. More the intensity of attack, greater is the scattering in M-SVD values. For ex., the counterclockwise rotation of 90
0 results in lowering of PSNR from 43.1818 dB to 11.4518
dB in DCT based watermarking scheme. In other words, rotation causes significant loss of quality (highest intensity of attack) in the signed image. This is also reflected by computing M-SVD (5.5072 to 211.1825) after rotation for the same scheme. A similar result is obtained in other two watermarking schemes also. However, in case of DCT based scheme, the scattering is even more prominent. On the other hand, as indicated by the results, SSIM and IQS tend to be more stable and consistent. In case of DCT based scheme, after executing counter clockwise rotation of 900, the SSIM is found to vary from 0.9983 to 0.2240 whereas the IQS varies from 3.3449 to 1.3949. We observe an identical behavior of SSIM and IQS in case of other two watermarking schemes also. In addition to that, SSIM and IQS behave identically in case of all five executed attacks spanning all three watermarking schemes used in this work. Narwaria and Lin [14] have compared their Image Quality Score (IQS) with M-SVD and SSIM and maintained that it performs better both in terms of monotonicity and scatters less compared to others. They have established this by developing scatter plots for all three metrics. We have compared the performance of the three metrics on the basis of their relative scattering before and after executing image processing attacks. For ex., in case of DCT based watermarking scheme, for rotation attack, the relative scattering shown by M-SVD is 211.1825/5.5072 = 38.346 and by SSIM is 0.2240/0.9983 = 0.2243 whereas the same for IQS is 1.3949/3.3449 = 0.4170. We have observed similar behavior of all three metrics in case of other two watermarking schemes also. Table 5 gives a comparison of the relative scattering shown by M-SVD, SSIM and IQS for reference images of Figs 5-7. It is clear from Table 5 that in case of attacked images, the relative scattering of M-SVD values is the highest. We have also computed the three IQA metrics and their relative scattering using Fig. 4 as reference image. The values of M-SVD, SSIM and IQS obtained in this case are tabulated in Table 6. It is very interesting to note that the relative scattering of SSIM and IQS is similar to one which is compiled in Table 5 while that of M-SVD is very prominent – several multiples of the values given in Table 5. Thus, besides PSNR, the M-SVD may also not be suitable for assessing the quality of the attacked images. The poor performance of M-SVD is not really surprising since it uses singular values which are relatively less crucial for IQA. We are now left with two other metrics namely IQS and SSIM both of which extract the structural information from original and attacked/distorted images. A comparison between these two can be done on the basis of their relative scattering given in Table 5 and 6. We have observed that only in case of counterclockwise rotation, the relative scattering of IQS is more than that of SSIM. A possible reason for this could be that IQS is sensitive to the relative orientation of the image structure. In other words, the rotation causes a large change in the singular vectors of the processed (i.e. attacked) image. This possibly results in large error on using the dot product between the singular vectors of the original and distorted images. However, it is also found that SSIM is also quite sensitive to such rotational changes and it remains an interesting avenue for possible future work to design IQA metrics which are capable to handle such distortion. Nonetheless, for other four attacks, the IQS shows comparatively less relative scattering than SSIM. This behavior is consistently observed in case of all three watermarking schemes used in this work. As far as

Anurag Mishra, Aruna Jain, Manish Narwaria & Charu Agarwal
International Journal of Image Processing (IJIP), Volume (5) : Issue (2) : 2011 212
TABLE 5: Relative scattering of M-SVD, SSIM and IQS values for three watermarking schemes. Test
Images: Figs. 8-10(a-e) given in column II, Reference Images: Figs. 5-7 respectively for three schemes
SSIM and IQS are concerned, although, no IQA metric used in this work is found to be perfectly suitable to cater all attacks, yet, we find that IQS formulated by Narwaria and Lin [14], is comparatively a more stable and consistent metric for quality assessment of signed and attacked images.
TABLE 6: Relative scattering of M-SVD, SSIM and IQS values for three watermarking schemes. Test
Images: Figs. 8-10(a-e) given in column II, Reference Images: Fig. 4 for all three watermarking schemes
Watermarking
Scheme
Attack
(Test Image)
Relative Scattering shown by
M-SVD SSIM Image Quality Score (IQS)
DCT
Watermarking Ref Image:
Fig. 5
Rotation 38.346 0.2243 0.4170 Gaussian Blur 9.266 0.874 0.7081
Gaussian Noise 1.1016 0.7791 0.7605 Median Filtering 7.9395 0.8949 0.7234
Jpeg Compression 0.4733 0.9691 0.8345
DWT Watermarking
Ref Image: Fig. 6
Rotation 117.3 0.2288 0.4068 Gaussian Blur 28.524 0.8726 0.6793
Gaussian Noise 3.6235 0.7745 0.7222 Median Filtering 24.435 0.8935 0.6862
Jpeg Compression 1.5952 0.9676 0.8067
RBF-NN Watermarking
Ref Image: Fig. 7
Rotation 68.03 0.2286 0.4123 Gaussian Blur 16.658 0.8733 0.6885
Gaussian Noise 2.016 0.7734 0.7362 Median Filtering 14.292 0.894 0.6955
Jpeg Compression 0.888 0.9684 0.8205
Watermarking
Scheme
Attack
(Test Image)
Relative Scattering shown by
M-SVD SSIM Image Quality Score (IQS)
DCT
Watermarking Ref Image:
Fig. 4
Rotation 588.68 0.2268 0.4471 Gaussian Blur 78.590 0.8741 0.6998
Gaussian Noise 36.083 0.7770 0.7542
Median Filtering 51.8703 0.8946 0.7127 Jpeg Compression 12.947 0.9677 0.8292
DWT
Watermarking Ref Image:
Fig. 4
Rotation 1794.13 0.2289 0.4317 Gaussian Blur 247.933 0.8726 0.6810
Gaussian Noise 108.367 0.7743 0.7243 Median Filtering 165.042 0.8933 0.6893
Jpeg Compression 33.043 0.9674 0.8026
RBF-NN Watermarking
Ref Image: Fig. 4
Rotation 1050.24 0.2288 0.4398 Gaussian Blur 144.9601 0.8729 0.6902
Gaussian Noise 64.4654 0.7726 0.7374 Median Filtering 96.4034 0.8935 0.7028
Jpeg Compression 21.6126 0.9673 0.8138

Anurag Mishra, Aruna Jain, Manish Narwaria & Charu Agarwal
International Journal of Image Processing (IJIP), Volume (5) : Issue (2) : 2011 213
5. CONCLUSIONS In this paper, we have used three different watermarking schemes, viz., DCT based watermarking, DWT based watermarking and RBF-Neural Network based blind watermarking for assessment of quality of images obtained after embedding the watermark which is a random number sequence of size 1024 using Cox’s formula [5]. In addition to this, the signed images are subject to five different StirMark prescribed image processing attacks – Counterclockwise rotation of 90
0, Gaussian Blur of radius = 1 unit, (c) Adding 10% Gaussian Noise to watermarked images,
(d) Median Filtering (Filtering Aperture = 3) and (d) JPEG compression with quality factor Q=0.9 or compression ratio = 10%. The quality of the signed and attacked images is assessed by three widely reported IQA metrics besides PSNR. These are Singular Value Decomposition Metric (M-SVD), Structural Similarity Index (SSIM) and Image Quality Score (IQS). As, the PSNR does not correlate well with Human Visual System (HVS model) of perception, it is not found suitable for quality assessment of signed and attacked images. This is due to the fact that PSNR represents the squared difference of corresponding pixel values between the original and distorted images and is calculated using Mean Square Error (MSE) between them. The extraction of the watermarks from signed and attacked images is also done in this work. The similarity correlation parameter SIM(X, X*) is used to compare the embedded and recovered watermarks from these images. The computed results of the IQA metrics are found to be well correlated with those of SIM(X, X*) parameter in case of all three watermarking schemes and attacks. Further, a comparison between three other metrics besides PSNR is done by estimating the relative scattering of their values after executing attacks. Among them, M-SVD values scatter much more significantly after watermark embedding and after executing image processing attacks for all three watermarking schemes. This is due to the reason that M-SVD is based on the squared difference between the block wise singular values or luminance of the original and distorted images. In this case, the structural information contained in the singular vectors obtained by the SVD decomposition of image matrix is completely ignored. Due to this reason, M-SVD is not found to be a stable, consistent and reliable candidate for quality assessment of signed and attacked images. The relative scattering observed in case of other two metrics – SSIM and IQS is comparatively much less. Both these metrics extract structural information from the original / reference and distorted / attacked images. Between SSIM and IQS, it is found that except counterclockwise rotation of 90
0, for all other four attacks used in this work, the Image Quality
Score (IQS) is more stable and consistent than its other counterpart. It is, therefore, concluded that among the three IQA metrics used in this work besides PSNR, the Image Quality Score (IQS) given by Narwaria and Lin [14] is comparatively more suitable for quality assessment of the watermarked and attacked images.
6. REFERENCES [1] Hsiang-Cheh Huang, Yueh-Hong Chen and Ajith Abraham, “Optimized Watermarking Using
Swarm-Based Bacterial Foraging”, Journal of Information Hiding and Multimedia Signal processing, 1(1):51-58, 2010
[2] Der-Chyuan Lou, Ming-Chiang Hu, and Jiang-Lung Liu, “Healthcare Image Watermarking
Scheme Based on Human Visual Model and Back-Propagation Network”, Journal of C.C.I.T, 37(1): 151-162, 2008
[3] Zhou Wang, Alan C. Bovik and Hamid R. Sheikh, “Image Quality Assessment: From Error
Measurement to Structural Similarity”, IEEE Transactions on Image Processing, 13(1), January 2004
[4] A Shnayderman, A Gusev and A M. Eskicioglu, “An SVD-Based Gray-Scale Image Quality
Measure for Local and Global Assessment”, IEEE Transactions on Image Processing, 15(2), February 2006

Anurag Mishra, Aruna Jain, Manish Narwaria & Charu Agarwal
International Journal of Image Processing (IJIP), Volume (5) : Issue (2) : 2011 214
[5] Ingemar J. Cox, Joe Kilian, F. Thomson Leighton, and Talal Shamoon, “Secure Spread Spectrum Watermarking for Multimedia”, IEEE Transactions on Image Processing, 6(12):1673-1687,1997
[6] Shieh, C., H. Huang, F. Wang and J. Pan, “Genetic Watermarking based on Transform
Domain Techniques”, Pattern Recognition Letters, vol. 37, pp. 555-565, 2004 [7] Charu Agarwal and Anurag Mishra, “A Novel Image Watermarking Technique using Fuzzy-
BP Network”, In the Proc. Sixth International Conference on Intelligent Information Hiding and Multimedia Signal Processing, Darmstadt, Germany, pp.102-105, Oct. 15-17, 2010
[8] Rajesh Mehta, Anurag Mishra,
Rampal Singh and Navin Rajpal, “Digital Image Watermarking
in DCT Domain Using Finite Newton Support Vector Regression”, In the Proceedings of Sixth International Conference on Intelligent Information Hiding and Multimedia Signal Processing, Darmstadt, Germany, pp. 123 – 126, Oct. 15-17, 2010
[9] Saraju P Mohanty, K R Ramakrishnan and Mohan Kankanhalli, “A Dual Watermarking
Technique for Images”, ACM Multimedia, Part2, pp. 49-51, 1999 [10] Mukesh C. Motwani and Fredrick C Harris, Jr, “Fuzzy Perceptual Watermarking for
Ownership Verification”, in the Proc. 2009 International Conference on Image Processing, Computer Vision, and Pattern Recognition (IPCV'09), Las Vegas, Nevada, 2009
[11] Bassem Abdel-Aziz and Jean Yves Chouinard, “On Perceptual Quality of Watermarked
Images – An Experimental Approach”, In Proc. 2nd
International Workshop on Digital Watermarking (IWDW 2003), Seoul, Korea, pp. 277-288, Oct. 2003
[12] A Shnayderman and A M. Eskicioglu, “Evaluating the Visual Quality of Watermarked
Images”, IS&T/SPIE’s 18th Annual Symposium on Electronic Imaging, Security, Steganography, and Watermarking of Multimedia Contents VIII Conference, San Jose, CA, Jan. 15–19, 2006
[13] V V. Pankajakshan and F. Autrusseau, “A Multi-Purpose Objective Quality Metric for Image
Watermarking”, in Proc. IEEE International Conference on Image Processing (ICIP 2010), pp. 2589-2592, Hong Kong, Sept. 26-29, 2010
[14] Manish Narwaria, Weisi Lin, “Scalable Image Quality Assessment Based on Structural
Vectors”, In Proc. IEEE International Conference on Multimedia Signal Processing MMSP ’09, Rio de Janeiro, Brazil, Oct. 5-7, 2009
[15] Cheng-Ri Piao, Seunghwa Beack, Dong-Min Woo, and Seung-Soo Han, “A Blind
Watermarking Algorithm Based on HVS and RBF Neural Network for Digital Image”, In Proc. International Conference on Neural Computing (ICNC ‘06), Part I, LNCS 4221, pp. 493-496, 2006
Results: Original and Watermarked Images
Anurag Mishra, Aruna Jain, Manish Narwaria & Charu Agarwal
International Journal of Image Processing (IJIP), Volume (5) : Issue (2) : 2011 215
FIGURE 4: Original Lena FIGURE 5: Signed Image obtained by DCT scheme
FIGURE 6: Signed Image obtained by DWT FIGURE 7: Signed Image obtained by RBF- scheme NN scheme

Anurag Mishra, Aruna Jain, Manish Narwaria & Charu Agarwal
International Journal of Image Processing (IJIP), Volume (5) : Issue (2) : 2011 216
(a) (b)
(c) (d)
(e)
Figure 8(a-e): Images obtained after executing image processing attacks over signed image of Fig. 5 – (a) Counter clockwise rotation with 90
0, (b) Gaussian
Blur of radius = 1 unit, (c) Addition of Gaussian Noise of 10%, (d) Median Filtering (Filtering Aperture = 3) and (e) JPEG compression with quality factor Q=0.9

Anurag Mishra, Aruna Jain, Manish Narwaria & Charu Agarwal
International Journal of Image Processing (IJIP), Volume (5) : Issue (2) : 2011 217
(a) (b)
(c) (d)
(e)
Fig. 9(a-e): Images obtained after executing image processing attacks over signed image of Fig. 6 – (a) Counter clockwise rotation with 90
0, (b) Gaussian
Blur of radius = 1 unit, (c) Addition of Gaussian Noise of 10%, (d) Median Filtering (Filtering Aperture = 3) and (e) JPEG compression with quality factor Q=0.9

Anurag Mishra, Aruna Jain, Manish Narwaria & Charu Agarwal
International Journal of Image Processing (IJIP), Volume (5) : Issue (2) : 2011 218
(a) (b)
(c) (d)
(e)
Fig. 10(a-e): Images obtained after executing image processing attacks over signed image of Fig. 7 – (a) Counter clockwise rotation with 90
0, (b) Gaussian
Blur of radius = 1 unit, (c) Addition of Gaussian Noise of 10%, (d) Median Filtering (Filtering Aperture = 3) and (e) JPEG compression with quality factor Q=0.9

Anurag Mishra, Aruna Jain, Manish Narwaria & Charu Agarwal
International Journal of Image Processing (IJIP), Volume (5) : Issue (2) : 2011 219
(a)
(b)
(c)
Fig. 11(a-c): SIM(X, X*) plots for random number watermark sequences extracted from images of Figs. 5-7 respectively. (a) DCT Watermarking scheme (SIM = 18.9206), (b) DWT Watermarking scheme (SIM = 19.2357) and (c) RBF-NN Watermarking scheme (SIM = 19.0732)