An experimental investigation of negative wakes behind spheres ...
21
Mark T. Arigo Gareth H. McKinley An experimental investigation of negative wakes behind spheres settling in a shear-thinning viscoelastic fluid Received: 10 November 1997 Accepted: 1 May 1998 M.T. Arigo Division of Engineering and Applied Sciences Harvard University Cambridge, Massachusetts 02138, USA G. H. McKinley ( ✉ ) Department of Mechanical Engineering Massachusetts Institute of Technology Cambridge, Massachusetts 02139, USA Abstract We present detailed ex- perimental results examining “neg- ative wakes” behind spheres settling along the centerline of a tube con- taining a viscoelastic aqueous poly- acrylamide solution. Negative wakes are found for all Deborah numbers (2.43 ≤ De (c ˙) ≤ 8.75) and sphere-to- tube aspect ratios (0.060 ≤ a/R ≤ 0.396) examined. The wake structures are investigated using laser-Doppler velocimetry (LDV) to examine the centerline fluid velocity around the sphere and digital particle image velocimetry (DPIV) for full-field velocity profiles. For a fixed aspect ratio, the magnitude of the most negative velocity, U min , in the wake is seen to increase with increasing De. Additionally, as the Deborah number becomes larger, the location of this minimum velocity shifts farther downstream. When normal- ized with the sphere radius and the steady state velocity of the sphere, the axial velocity profiles become self-similar to the point of the mini- mum velocity. Beyond this point, the wake structure varies weakly with aspect ratio and De, and it extends more than 20 radii down- stream. Inertial effects at high Reynolds numbers are observed to shift the entire negative wake farther downstream. Using DPIV to investi- gate the transient kinematic re- sponse of the fluid to the initial acceleration of the sphere from rest, it is seen that the wake develops from the nonlinear fluid response at large strains. Measurements of the transient uniaxial extensional viscos- ity of this weakly strain-hardening fluid using a filament stretching rheometer show that the existence of a negative wake is consistent with theoretical arguments based on the opposing roles of extensional stresses and shearing stresses in the wake of the sphere. Key words Sphere – negative wake – viscoelastic – shear-thinning – strain-hardening Introduction As a benchmark problem for computational rheology and the evaluation of numerical codes, the sedimenta- tion of a sphere in an elastic fluid has become one of the most studied problems in non-Newtonian fluid mechanics (see, e.g., Chhabra, 1992; Hassager, 1988; Walters and Tanner, 1992). In recent years, good agree- ment has been achieved in comparisons between experi- mental results and numerical computations using non- linear, multimode constitutive equations for constant viscosity, elastic Boger fluids (see, e.g., Arigo et al., 1995; Rajagopalan et al., 1996). However, most con- centrated polymeric solutions and melts have shear- thinning viscoelastic material properties. Arigo and McKinley (1997) have previously examined the tran- sient response of a sphere accelerating from rest in a Rheol Acta 37:307–327 (1998) © Steinkopff Verlag 1998 ORIGINAL CONTRIBUTION RA 897
Transcript of An experimental investigation of negative wakes behind spheres ...

Mark T. ArigoGareth H. McKinley
An experimental investigationof negative wakes behind spheres settlingin a shear-thinning viscoelastic fluid
Received: 10 November 1997Accepted: 1 May 1998
M.T. ArigoDivision of Engineering and Applied SciencesHarvard UniversityCambridge, Massachusetts 02138, USA
G.H. McKinley (✉)Department of Mechanical EngineeringMassachusetts Institute of TechnologyCambridge, Massachusetts 02139, USA
Abstract We present detailed ex-perimental results examining “neg-ative wakes” behind spheres settlingalong the centerline of a tube con-taining a viscoelastic aqueous poly-acrylamide solution. Negative wakesare found for all Deborah numbers(2.43≤De(c)≤8.75) and sphere-to-tubeaspect ratios(0.060≤a/R≤0.396)examined. The wake structures areinvestigated using laser-Dopplervelocimetry (LDV) to examine thecenterline fluid velocity around thesphere and digital particle imagevelocimetry (DPIV) for full-fieldvelocity profiles. For a fixed aspectratio, the magnitude of the mostnegative velocity,Umin, in the wakeis seen to increase with increasingDe. Additionally, as the Deborahnumber becomes larger, the locationof this minimum velocity shiftsfarther downstream. When normal-ized with the sphere radius and thesteady state velocity of the sphere,the axial velocity profiles becomeself-similar to the point of the mini-
mum velocity. Beyond this point,the wake structure varies weaklywith aspect ratio andDe, and itextends more than 20 radii down-stream. Inertial effects at highReynolds numbers are observed toshift the entire negative wake fartherdownstream. Using DPIV to investi-gate the transient kinematic re-sponse of the fluid to the initialacceleration of the sphere from rest,it is seen that the wake developsfrom the nonlinear fluid response atlarge strains. Measurements of thetransient uniaxial extensional viscos-ity of this weakly strain-hardeningfluid using a filament stretchingrheometer show that the existenceof a negative wake is consistentwith theoretical arguments based onthe opposing roles of extensionalstresses and shearing stresses in thewake of the sphere.
Key words Sphere – negative wake– viscoelastic – shear-thinning –strain-hardening
Introduction
As a benchmark problem for computational rheologyand the evaluation of numerical codes, the sedimenta-tion of a sphere in an elastic fluid has become one ofthe most studied problems in non-Newtonian fluidmechanics (see, e.g., Chhabra, 1992; Hassager, 1988;Walters and Tanner, 1992). In recent years, good agree-
ment has been achieved in comparisons between experi-mental results and numerical computations using non-linear, multimode constitutive equations for constantviscosity, elastic Boger fluids (see, e.g., Arigo et al.,1995; Rajagopalan et al., 1996). However, most con-centrated polymeric solutions and melts have shear-thinning viscoelastic material properties. Arigo andMcKinley (1997) have previously examined the tran-sient response of a sphere accelerating from rest in a
Rheol Acta 37:307–327 (1998)© Steinkopff Verlag 1998 ORIGINAL CONTRIBUTION
RA
897
shear-thinning fluid, and we continue that experimentalinvestigation by examining the steady-state kinematicsof the flow that is established in the wake of a spheresedimenting in the same fluid. In particular, we focuson the structure and development of a “negative wake,”i.e., an additional recirculating region downstream ofthe sphere in which the fluid velocity is in the directionopposite to the motion of the sphere and the vorticity isreversed compared to the motion near the sphere.
When a sphere of radiusa and densityqs settles in aNewtonian fluid of constant viscosityg0 and densityqf ,the development of the velocity field around the sphereand the steady state velocity of the sphere,Us, are wellunderstood. In the discussion that follows, we refer to alaboratory reference frame in which the sphere falls at asteady state velocityUs and the fluid is quiescent atinfinity. At low Reynolds numbers (Re=qf aUs/g0�1),the fluid velocity is fore-aft symmetric and decaysmonotonically to zero with increasing distance from thesphere. Numerous researchers have documented experi-mentally and numerically the effects of perturbations tothis flow, resulting in more complex wake structuresdownstream of the sphere. The most common exampleof such a perturbation is the high Reynolds numberflow past a sphere confined in a cylindrical tube. Formoderate Reynolds numbers, inertia acts to shift thefluid streamlines farther downstream. When the Rey-nolds number exceeds a critical value,Recrit*15, asteady, axisymmetric recirculating vortex develops inthe wake behind the sphere in which the velocity alongthe centerline of the tube is greater than that of thesphere (e.g., photographs in van Dyke, 1982). Thisrecirculating wake elongates with increasingRe, andeventually the stability of this structure breaks down be-yond a second critical Reynolds number forRecrit >65(Zheng et al., 1991; Tavener, 1994).
The wake structure downstream of a sphere settling ina constant viscosity, elastic “Boger” fluid at vanishingReynolds numbers has often been qualitatively describedas similar to the inertial shift seen in moderate Reynoldsnumber flows of Newtonian fluids. However, in this casethe effect is due to fluid elasticity and is characterized bythe Deborah numberDe=kUs/a, wherek is a character-istic relaxation time of the polymer molecules. As aresult of the high extensional viscosities of Boger fluidsand the strong extensional flow in the wake of thesphere, the fluid velocity decays much slower than inthe Newtonian case resulting in a wake structure thatextends far downstream. However, this slow decay ofthe fluid velocity has been found to be monotonic andstable in all experimental studies (Bush, 1993; Arigoand McKinley, 1994; Arigo et al., 1995).
While the majority of experimental studies have con-centrated on constant viscosity fluids, there have beenfew detailed investigations of the wake structure forshear-thinning viscoelastic fluids. Acharya et al. (1976)
examined the flow behind spheres settling at high Rey-nolds numbers in an unbounded domain of shear-thin-ning, aqueous polymer solutions containing varying con-centrations of polyacrylamide (PAA), polyethylene-oxide(PEO), or hydroxyethylcellulose (HEC). They describeflows in which elastic forces dominate and additional ex-periments in which inertia is the dominant factor. In thetransition region between the two cases, they discovereda “dual wake” formation, i.e., an elastically-dominatedregion close to the sphere enveloped by an inertia-domi-nated region further away from the sphere.
In extensive investigations by Sigli and Coutanceau(1977), photographic flow visualization techniques wereused to study the spatial kinematics of the viscoelasticwake structure. Their experiments were performed atlow Reynolds numbers and low Deborah numbers inshear-thinning viscoelastic solutions containing moder-ate concentrations of PEO (1%≤c≤2.5%). The photo-graphs show the existence of a secondary recirculationregion in the wake of the sphere. Immediately down-stream of the sphere, the fluid in the wake moves in thesame direction as the sphere, but, at greater distances,the flow reverses and moves away from the sphere. Theauthors also found that increasing the sphere-to-tubeaspect ratio increases the elastic effect, whereas inertialeffects act to dampen the elastic effects. Sigli andCoutanceau were also able to model this flow behaviorassuming a constant viscosity Maxwell constitutiveequation with simplified boundary conditions in whichthe velocity disturbance is confined within a sphericalregion of radius equal to the cylinder radius.
Hassager (1979) later termed this flow phenomenona “negative wake” when he found the same type of re-circulating region in the wakes behind bubbles rising ina shear-thinning, viscoelastic solution of 1% PAA inglycerol. Maalouf and Sigli (1984) have demonstratedthat such negative wakes also exist in flows of variousaqueous, shear-thinning, viscoelastic fluids around ellip-soids, ovoids, and cylinders. In this latter study, theflow around each object was examined for four types offluids: a Newtonian fluid; an inelastic, shear-thinningfluid (3.5% carboxymethylcellulose, CMC, in water); ahighly elastic, constant viscosity fluid (PAA in glu-cose); and several viscoelastic, shear-thinning solutions(1.5% and 2.5% PEO in water). In all of the non-New-tonian fluids, the fore-aft symmetry of the flow aroundthe objects is broken with the most concentrated solu-tions displaying the most asymmetry. However, nega-tive wakes were observed only for objects settling influids exhibiting both elastic and shear-thinning visco-metric material properties. Additionally, the formationof the negative wake was dependent on exceeding acritical value of the elasticity number, defined asE=De/Re. This critical value was found to be lowestfor blunt obstacles causing the greatest distortion of thefluid streamlines, i.e., cylinders and spheres.
308 Rheologica Acta, Vol. 37, No. 4 (1998)© Steinkopff Verlag 1998

Quantitative measurements of the negative wakewere made by Bisgaard (1983), who used laser-Dopplervelocimetry (LDV) to examine the kinematics aroundspheres and bubbles in a viscoelastic, shear-thinningsolution of 1% PAA in glycerol. Negative wakes werepresent in all of the experiments, which covered a widerange of sphere-to-tube ratios 0.04≤a/R≤0.18, Deborahnumbers 11.4≤ De0 ≤ 66.5, and Reynolds numbers(based on the solvent viscosity) 0.0167≤ Res ≤ 0.29.Additionally, Bisgaard observed temporal oscillations inthe wake between the sphere and the point of flow re-versal forDe0>30.6 that were manifested as rapid fluc-tuations in the axial velocity component only. At thelargest Deborah numbers, these oscillations were dam-pened by the increased inertial effects resulting fromshear-thinning in the fluid viscosity.
The previous studies have all arrived at the samequalitative description of the negative wake phenomen-on; however, they have all used different fluids and dif-ferent sphere-to-tube ratios making intercomparisonsdifficult. To address this deficiency, Bush (1994) per-formed a comprehensive series of experiments using thesame fluid, a shear-thinning viscoelastic solution of0.25% PAA in a corn syrup/water mixture, and thesame apparatus. In these experiments, which differ fromthe previously discussed experiments in that the sphereis held fixed while the cylinder is translated at constantspeed, Bush was able to proceed from a monotonicallydecreasing wake to the formation of a negative wakefor the same sphere and cylinder by changing only theconcentration of corn syrup in water from 80% to 30%.Bush attributed this behavior to the interplay betweenthe elasticity of the fluid (quantified by the recoverableshear in viscometric flow) and the magnitude of theelongational stresses in the downstream region. Numeri-cal calculations indicated that when there is little in-crease in the elongational viscosity and the elastic be-havior appears to dominate, there is an upstream shiftin the streamlines relative to the Newtonian case, whichcan lead to a negative wake. However, when the elon-gational stresses dominate, there is a monotonic down-stream shift in the streamlines.
While the existence of a negative wake has been re-peatedly documented experimentally, only recently havenumerical models been able to predict such behavior.Numerical calculations by Jin et al. (1991), Zheng et al.(1991), and Bush (1994) appear to validate the experi-mental observation that both shear-thinning and elastic-ity, particularly an extensional-thickening viscosity, arenecessary for the formation of a negative wake. In thesecalculations, four models – Newtonian, Carreau (shear-thinning, generalized Newtonian fluid), upper-convectedMaxwell (constant-viscosity, elastic fluid), and Phan-Thien–Tanner (shear-thinning, viscoelastic fluid) – wereused to calculate the velocity field around the sphere.Only when both shear-thinning and elastic effects were
present, i.e., in simulations using the PTT model, was anegative wake predicted.
However, calculations by Satrape and Crochet(1994) using the FENE-CR dumbbell model haveshown that a negative wake can be predicted using aconstant viscosity, elastic fluid model. The computa-tions show that the formation of a negative wake is inti-mately connected to the extensional properties of theconstitutive model, particularly the FENE dumbbell ex-tensibility parameterL. For small values of this parame-ter, L2*10, a negative wake could be simulated forDe0>1. In more recent work by Harlen (1997), the dif-ferences between the kinematics of an Oldroyd-B fluidand a FENE-CR fluid with a smallL value are ex-amined more closely. Harlen argues that the velocityperturbation in the wake of the sphere depends on therelative magnitude of the elongational tensile stressesand the shearing stresses in the wake. For high Deborahnumber flows in which the polymer molecules are nearfull extension, the extensional stresses dominate, andwhen L is large the negative wake is not seen. How-ever, when L*O(1), the magnitudes of the tensilestresses are dramatically reduced and become of com-parable magnitude to the shear stresses. Considerationof the gradients of each contribution to the stress thensuggests that the rapid radial variations in the shearstress dominate the slow axial decay of the small tensilestresses and result in a negative wake.
Harlen et al. (1995) have also shown numericallythat a negative wake develops at early times in the tran-sient evolution of a wake in an Oldroyd-B fluid. As thesphere approaches steady state, this temporary negativewake disappears as the molecules in the wake becomemore highly oriented and elongated, and the large ex-tensional stresses dominate the flow in the wake. Littleis known experimentally about how the growth of thisnegative wake in the region behind a sphere accelerat-ing from rest affects the initial transient motion of afreely sedimenting sphere or the final settling velocityof the sphere.
Regardless of the specific choice of model, orwhether a shear-thinning viscosity is important, bothBush (1994) and Harlen (1997) point out that knowl-edge of the extensional rheology of the fluid is essentialin understanding the evolution of the wake structure.As in other complex flow geometries, such as flowthrough an abrupt contraction (White and Baird, 1996),the numerical magnitude of a Deborah (or Weissenberg)number based on viscometric properties of the fluid isinsufficient to discriminate between the response of dif-ferent polymeric fluids or constitutive models. With therecent advent of filament stretching rheometers (Tir-taatmadja and Shidhar, 1993; Spiegelberg et al., 1996),it has become possible to accurately measure the transi-ent extensional stress growth in mobile fluids such aspolymer solutions. Measurements with an ideal PIB/PB
309M.T. Arigo and G.H. McKinleyAn experimental investigation of negative wakes

Boger fluid (with L*100) indicate that these dilutepolymer solutions show pronounced strain-hardening atmoderate Hencky strains typical of those that can be ex-perienced by fluid elements passing close by a sphereand into the downstream wake region. Direct LDVmeasurements and finite element calculations in theidentical 0.31% PIB/PB fluid by Arigo et al. (1995)show that no negative wake forms and an elongateddownstream wake structure develops.
The initial development of filament stretching de-vices was predicated on the assumption that the ex-treme strain-hardening and resulting large tensilestresses of ideal elastic Boger fluids would dominatethe kinematics in the elongating filament. However,recent finite element calculations coupled with directcomparisons to experiments have shown that it is alsopossible to extract quantitative information about thetransient extensional stress growth of concentrated poly-mer solutions (Kolte et al., 1997; Yao et al., 1998).Such materials show less strain-hardening, and they arecharacterized by shear-thinning viscometric propertiesthat are best described by nonlinear constitutive equa-tions, such as the K-BKZ or Giesekus models, incorpor-ating multiple modes with a spectrum of relaxationtimes. Quantitative measurements of the transient exten-sional stress growth in polymer solutions thus appearpossible, and filament stretching tests can be used to in-vestigate whether the constitutive mechanisms for theformation of a negative wake discussed above are con-sistent with experimental observations.
In this paper, we experimentally investigate thestructure of the negative wake in a shear-thinning,viscoelastic solution of 2% PAA in a 50/50 mixture ofwater/glycerin. In addition to characterization of the lin-ear viscoelastic spectrum and the shear-thinning visco-metric properties of the fluid, we use a filament stretch-ing rheometer to measure the transient uniaxial exten-sional viscosity of the viscoelastic liquid. Using laser-Doppler velocimetry (LDV) and digital particle imagevelocimetry (DPIV), we examine the competing effectsof elasticity, walls, and inertia on the negative wake.Additionally, full-field, two-dimensional DPIV resultsfollow the transient formation of the negative wake asthe sphere accelerates from rest.
Experimental setup
Falling sphere apparatus
The experimental test apparatus shown in Fig. 1 hasbeen used in many studies on the motion of spheres bythe authors (Becker et al., 1994; Arigo and McKinley,1994; Arigo et al., 1995; Rajagopalan et al., 1996; Ari-
go and McKinley, 1997). The system consists of longplexiglass cylindrical tubes (1 m) of various internal ra-dii, R, placed in a rectangular viewing box filled with arefractive index-matched fluid. Spheres of different ra-dii, a, and density,qs, are released via a mechanismthat accurately aligns the sphere along the centerline ofthe tube. It has been well documented that spheres sedi-menting off-axis will migrate towards the cylinder wallsand rotate anomalously due to strong radial “lift” forces(Walters and Tanner, 1992; Becker et al., 1996). Thedigital video system used previously by the authors forinvestigating the transient motion of the sphere allowsus to accurately monitor the deviations of the spherefrom the centerline axis. The steady state settling velo-city of the sphere,Us, is measured via a timing meth-od, i.e., the time of flight of the sphere is measured asit falls through a section of the tube far downstream ofits release point using LED photo-diode detectors.The terminal velocity of spheres settling in polyacryl-amide solutions depends greatly on the time intervalbetween the release of successive spheres as a result ofboth the long relaxation timescale and the gel-like equi-librium structure of the fluid (Bisgaard, 1983; Waltersand Tanner, 1992; Agarwal et al., 1994). Although thisphenomenon is not investigated here, our measurementsshow excellent reproducibility when spheres aredropped at separation intervals greater than 15 min(Arigo and McKinley, 1997).
The flow field in the wake of the sphere is investi-gated using a single-color, fiber optic laser-Dopplervelocimetry (LDV) system (Dantec Electronics, Inc.)coupled with a 300 mW argon-ion laser (Ion LaserTechnology). The fluid is seeded with a small quantityof 0.22 lm titanium dioxide particles (TSI, Inc.), andthe LDV system is carefully aligned with the centerlineof the tube so that only the axial component of thefluid velocity around the sphere is measured. Utilizing afast Fourier transform technique, the spectrum analyzer(Dantec Burst Spectrum Analyzer) computes the localfluid velocity from the Doppler-shifted frequency withan accuracy of ±0.5 mm/s. The use of a Bragg cell toimpose a known frequency shift on one of the LDVlaser beams allows negative velocities to be detectedunambiguously. The mapping of the steady state veloc-ity field from the unsteady Lagrangian laboratory refer-ence frame of the LDV system to the steady Eulerianreference frame centered on the steadily translatingsphere is performed by a simple Gallilean transforma-tion z=–(t–t0)Us, where t0 is the time at which thecenter of the sphere passes through the LDV measuringvolume.
Such a transformation is not possible during theinitial Eulerian-unsteady acceleration of the sphere. Wetherefore also measure the two-dimensional velocityfields utilizing a digital particle imaging (DPIV) techni-que. The same laser is coupled with a fiber optic light
310 Rheologica Acta, Vol. 37, No. 4 (1998)© Steinkopff Verlag 1998

sheet generator (Oz Optics), to illuminate an axialcross-section of the tube – approximately 7 cm inlength (depending on camera magnification) and lessthan 1 mm thick. For this application, the fluid isseeded with a small volume fraction of 50lm silver-coated glass spheres (Potters Industries), which providegood reflection in the laser light sheet. Using a high re-solution gray-scale CCD camera, the motion of the seedparticles as they follow the flow field is captured anddigitized on a computer at rates up to 30 frames persecond. Image pairs are then selected and analyzed bythe DPIV algorithm, a correlating technique that calcu-lates the average 2D particle displacement,Dx, in smallcorresponding sub-regions of the two images separatedby a known timestepDt. The DPIV implementationused here calculates the cross-correlations via fast Four-ier transforms as implemented by Pakdel and McKinley(1997). These authors have analyzed the accuracy ofthis technique in a cavity flow geometry. An importantassumption in all DPIV applications is that the flow re-mains two-dimensional so that particles remain withinthe viewing window.
Fluid rheology
The test fluid used in these experiments is a shear-thin-ning viscoelastic solution composed of 2.0 wt.% PAAin a 50/50 mixture of water and glycerol (fluid density,qf=1.14 g/cm3). Arigo and McKinley (1997) have thor-oughly characterized this solution in steady, transient,and oscillatory rheometric flows. Fig. 2 shows thesteady and dynamic viscometric properties of this fluid.The zero-shear rate viscosity and first normal stresscoefficient for the fluid are g0=464 Pa·s andW10&1.15×10⁵ Pa·s2, respectively. Clearly, it is difficultto accurately determineW10:limx?0 2g''/x from thedata shown in Fig. 2 since the linear viscoelastic dataat lower frequencies is subject to large fluctuations asthe phase angled?p/2. However, the relaxation spec-trum and the valueW10&1.15×10⁵ Pa·s2 obtained fromnonlinear regression to the dynamic linear viscoelasticdata yields a parameter set that is consistent with otherrheological tests including creep and startup of steadyshear flow (Arigo and McKinley, 1997). A characteris-tic relaxation time for this fluid isk*W10/2g0^121 s.
311M.T. Arigo and G.H. McKinleyAn experimental investigation of negative wakes
Fig. 1 Schematic diagram ofthe experimental apparatus in-cluding the laser-Doppler veloci-metry system used to measurethe centerline velocity around thesphere and the digital particleimage velocimetry system usedto obtain full-field velocity pro-files of the flow around thesphere

This long timescale for build up of elastic stresses isimportant when characterizing transient flows of thisfluid (Arigo and McKinley, 1997).
Table 1 lists the four-mode spectrum of relaxationtimes and viscosities determined from nonlinear regres-sion to the dynamic, small amplitude oscillatory sheardata. Arigo and McKinley (1997) have shown that thefour-mode spectrum not only provides an excellent de-scription of the rheological data, but can also be usedto quantitatively describe the transient creep data in un-steady shearing flows as well as the initial accelerationof a sphere from rest. However, at steady state, we ex-pect that because of the large fluid strains that develop,constitutive nonlinearities will dominate the fluid rheol-
ogy. Thus, in addition to the linear viscoelastic spec-trum (gj, kj), we also include in Table 1 a fit of the Gie-sekus constitutive model parameteraj and Phan-Thien–Tanner equation parametersnj and ej. The choices ofthe parameter values are constrained by fitting to boththe steady viscometric properties,g (c) andW1(c), andto measurements of the transient extensional viscosity,�g� �_e; t�, discussed further below.
The transient uniaxial stress growth in the fluid ismeasured using the filament stretching device devel-oped by Spiegelberg et al. (1996). Small cylindricalfluid samples of initial radiusR0=3.5 mm and lengthL0=2.5 mm are confined between rigid disks and elon-gated exponentially. In experiments with extremelystrain-hardening materials and in numerical simulationswith Oldroyd-B or FENE-type constitutive models, theimposed deformation approaches the ideal uniaxialelongation of a cylinder at long times. However, inmore weakly strain-hardening fluids, the elongating fila-ment retains the radially concave profile characteristicof a liquid bridge and the deformation is nonhomoge-neous. Despite this non-ideality, recent simulationsusing a K-BKZ model and direct comparisons betweenfinite element calculations with a multimode Giesekusmodel and filament stretching tests using a concentrated5.0 wt.% polystyrene in dioctylphthalate (PS/DOP)solution have shown that it is still possible to extractquantitative information on the transient extensionalstress growth in such materials (Kolte et al., 1997; Yaoet al., 1998).
In the present tests, with a constant imposed strainrate E, the upper plate is moved in accordance to a
312 Rheologica Acta, Vol. 37, No. 4 (1998)© Steinkopff Verlag 1998
Fig. 2 Rheological properties ofthe shear-thinning, viscoelastictest fluid in steady shear flow(~, &) and small amplitudeoscillatory shear flow (~, &).The solid lines are the predic-tions of the multimode Giesekusconstitutive model forg (c),W1(c), and the dashed line is thepredicted value of the steady uni-axial extensional viscosity�g �_e�using the parameters specified inTable 1
Table 1 Multimode spectrum of viscosities, relaxation times, andnonlinear constitutive parameters for various models: linear viscoelas-ticity (LVE), Giesekus, and Phan-Thien-Tanner (PTT). The LVE spec-trum is determined from nonlinear regression to dynamic, small am-plitude oscillatory shear data {g', g''} over the range of frequencies0.001≤x≤100 rad/s. The nonlinear parameters are fitted to the visco-metric propertiesg (c) and W1(c) and the transient uniaxial exten-sional viscosity�g� (_e, t)
Mode, j Linear viscoelasticity Giesekus Phan-Thien-Tanner
gj [Pa·s] kj [s] aj nj ej
1 311.2 175.4 0.5 0.1 0.152 135.1 10.80 0.5 0.1 0.153 16.55 0.581 0.5 0.1 0.154 1.203 0.019 0.5 0.1 0.15Solvent 0.006 – – – –

single exponentially increasing velocity profileVp(t)= EL0 exp (+Et), and the narrowest radius of theelongating filamentRmin(t) and the total tensile forceFz(t) exerted on the stationary lower plate are mea-sured. Following the notation of Kolte et al., this is a‘Type II’ test and computational studies show that theextensional viscosity growth function in an ideal uniaxialdeformation can be expressed as a transient Trouton ratio
Tr � �g� �e;De�g0
� Fz; corr�t�g0 _eeff pR2min�t�
�1�
where the Deborah number is defined asDe=k1 _eeff .The forceFz, corr is corrected to remove the contribu-tions due to the gravitational body force and surfacetension (both typically very small). The effective defor-mation rate,_eeff , experienced by the material element atthe narrowest point in the filament is
_eeff � ÿ 2
Rmin �t�dRmindt
: �2�
At short times and small aspect ratios, experiments andcalculations by Spiegelberg et al. (1996) show that theeffective strain rate is_eeff � 1:5 E in agreement withlubrication theory. At longer times, this value eitherincreases or decreases slowly depending on the level ofstrain-hardening in the material. The total Hencky strainaccumulated by a fluid element is found by integratingEq. (2) to yield
e �t� �Z t0
_eeff �t0� dt0 � 2 ln�
R0Rmin�t�
�: �3�
The transient extensional stress growth in the shear-thinning 2 wt.% PAA/glycerin/water solution is shownin Fig. 3a. In contrast to experiments with dilute visco-elastic solutions such as Boger fluids, it is clear thatthere is no measurable Newtonian plateau (&3gs/g0) atshort times and that there is no dramatic increase inTrat large strains. Experiments are performed at three dif-
313M.T. Arigo and G.H. McKinleyAn experimental investigation of negative wakes
Fig. 3 Transient extensional vis-cosity�g�=g0 as a function of theHencky strain. (a) Experimentalresults for extension rates ofE=0.8, 3.0, 5.0 s–1. The solidlines are the predictions of theGiesekus model using the param-eters imposed in Table 1. (b) Thedata atE=5.0 s–1 from (a) show-ing the individual modal contri-butions of the Giesekus modelfor this strain rate (dotted lines)and the prediction of the multi-mode, generalized Maxwellmodel (dashed line)

ferent nominal extension ratesE=0.8, 3.0, and 5.0 s–1
characteristic of the deformation rates (Us/a) attained inthe settling sphere tests described below. At largestrains, similar levels of tensile stress growth are ob-served in each test; however, at short times, the valueof Tr decreases with increasing strain rate when plottedas a function of the Hencky strain. This is characteristicof the initial linear-viscoelastic-like response of a mate-rial in which the stress is best represented as a functionof t/k1. Given the large spectrum of relaxation times inthe test fluid (see Table 1) and the limited Henckystrains that can be achieved, this region is expected tolast throughout the whole test.
The solid curves shown in Fig. 3a are the predic-tions of the four-mode Giesekus model in a homoge-neous ideal uniaxial elongational flow computed usinga fourth order Runge-Kutta integration routine. In thesesimulations, the Deborah number for each mode isDej =kj E. The deviation between the model predictionat short times (e<0.5) arises from the initial shear flowin the filament stretching device. At moderate strains(0.5≤ e≤3), the magnitude of the stress growth and thetrend with increasingE is accurately captured by themultimode model. At larger Hencky strains (e>3), thedata systematically deviates from the numerical predic-tions, and the fluid appears to be slightly more strainhardening than predicted by the constitutive model. Theexperiments at large strains are extremely difficult toperform since the tensile force in the filament rapidlydecays towards zero and the effective strain rate,_eeff ,increases with time as the filament necks down in themidregion and fails or ruptures in a finite time at a
critical strain, e*4.5 as shown by Yao et al. (1998).The most important factor to note is that in contrast tomeasurements at identical strains and strain-rates insemi-dilute PIB Boger fluids, the transient Trouton ratiois Tr*O(10), notTr*O(1000) (Tirtaatmadja and Shid-har, 1993; Spiegelberg et al., 1996).
In Fig. 3b we show in greater detail the predictionof the multimode Giesekus model for the stretch rate ofE=5.0 s–1. The solid line corresponds to the total ten-sile stress given by summing each individual mode(shown by dotted lines). The linear viscoelastic re-sponse predicted by the generalized linear Maxwellmodel withn modes is given by
�g� �_eeff ; t�g0
� 3Xnj�1
gj �1ÿ eÿt=kj� �4�
and is shown by the broken line. It is clear that at thesestretch rates the fluid behaves in a weakly nonlinearmanner with only moderate strain-hardening. For sim-plicity in modeling this response, we have chosen touse the multimode Giesekus model with a single valueof the network mobility parametera for all modes. Weacknowledge that a better fitting to the rheology can beachieved by fitting a differentaj for each mode. How-ever, it is clear from Figs. 2 and 3 that a good fit toboth the steady shear and the transient extensional datacan be attained withaj =0.5 for all modes. Decreasingaj increases the level of strain-hardening in Fig. 3a butalso lowers the extent of shear-thinning and over-pre-dicts the data in Fig. 2. An alternate approach is to se-lect a nonlinear model with separate parameters to con-
314 Rheologica Acta, Vol. 37, No. 4 (1998)© Steinkopff Verlag 1998
Fig. 4 The range of shear-rate-dependent and zero-shear-rateDeborah numbers (De(c), De0)and Reynolds numbers (Re(c),Re0) encompassed in this paper.The symbols represent the ex-perimental values computed fromsteady rheological measurementsof W1(c) andg (c), while thesolid lines are from the Giesekusfit to the steady shear rheology.Dashed lines are zero-shear-rateproperties based ong0=464 Pa·sandk=121 s. Reynolds numbersare calculated using a sphereradius ofa=1.27 cm

trol the shear-thinning and strain-hardening, such as thePhan-Thien–Tanner model, which is discussed in theAppendix.
In order to accurately quantify the relative impor-tance of elastic, viscous, and inertial effects in the com-plex flow past a sphere, we report shear-rate–dependentvalues of the Deborah number (often referred to as therecoverable shear)
De � _c� � k � _c� _c ��
W1 � _c�2 �g � _c� ÿ gs�
��5�
and the Reynolds number
Re � _c� � qf a2 Us
g � _c� �6�
where the characteristic deformation rate is based onthe experimentally measured steady state velocityUs ofthe spherec=Us/a. The reported values ofDe(c) andRe(c) are calculated using the multimode Giesekusparameters.
The incorporation of shear-thinning effects is neces-sary because of the extreme shear-thinning observed inthe material functions for this fluid, e.g., for a 1.27 cmdiameter aluminum sphere (qs=2.79 g/cm3) sedimentingat a velocity of Us=1.03 cm/s, the shear rate isc=0.811 s–1, corresponding toDe0=98, De(c)=2.32,Re0=3×10⁻⁴, and Re(c)=5×10⁻³. A consequence ofusing shear-rate dependent Deborah numbers is that therange of De spanned experimentally is greatly con-tracted, given the density of spheres which were usedin these experiments (2.17≤ qs ≤ 8.53 g/cm3). The varia-tions in the functionsDe(c) and Re(c) with shear rateare shown in Fig. 4. In order to regain the linear visco-elastic limit, experiments at shear ratesc≤10–3 are re-quired. For a 1.27 cm radius sphere, this corresponds toa sedimentation velocity of 12.7lm/s or a density con-trast ofa=qs/qf&1.003. Although we report our results
in terms ofDe(c) andRe(c), the zero–shear-rate quanti-ties can be obtained from Fig. 4 if desired.
Experimental results
We now turn to detailed measurements of the fluidkinematics,v(x), surrounding the sphere as it settles inthe cylinder at a steady state velocity,Us. Dimensionalanalysis suggests that this motion will depend on thedensity contrast between the sphere and the fluid,a=qs/qf , the sphere-to-tube aspect ratio,a/R, and theReynolds number,Re(c), characterizing inertial effects.Fig. 5 illustrates the important aspects of the flow field.The sphere translates from left to right in the directionof increasingz at a steady velocityUs. The maximumnegative velocity is denotedUmin and is located atzmin,and the stagnation point in the wake where the flow re-verses is located atzstag. Measurements of the viscoelas-tic corrections to the steady state drag force acting onthe sphere have been reported in our previous publica-tion (Arigo and McKinley, 1997) and are not includedhere. Any elastic modifications to the drag resultingfrom the evolution in the wake structure documentedbelow are dominated by the shear-thinning properties ofthe fluid rheology, and a purely inelastic correlation isfound to be sufficient to describe the drag correctionfactor.
Effect of density contrast
In Figs. 6 and 7, LDV measurements of the fluid veloc-ity around the sphere along the centerline of the cylin-der are presented. In these figures, we plot the axialcomponent of the fluid velocity,vz, versus the axial co-ordinate,z. Here, the cylindrical coordinate systemz iscentered on the sphere and oriented in the direction of
315M.T. Arigo and G.H. McKinleyAn experimental investigation of negative wakes
Fig. 5 A sketch of a typicalnegative wake indicating the keyfeatures of the velocity profile ina laboratory reference frame withthe origin located at the center ofthe sphere at timet0. The maxi-mum negative velocity is de-notedUmin and is located atzmin.The stagnation point where theflow reverses in the wake of thesphere is located atzstag

travel so that positive values ofz represent unperturbedfluid upstream of the sphere, whilez<0 is the wakeregion behind the sphere. Far upstream of the sphere,the fluid is quiescent (vz=0), and the velocity monoto-nically rises to the velocity of the sphere at the front
stagnation point,z=a. The extent of the upstreamvelocity disturbance is confined within a distancez*Ror z/a*R/a for all experiments shown here, in agree-ment with computations for a Newtonian fluid shownby the solid line in Fig. 7b. There is a slight deviation
316 Rheologica Acta, Vol. 37, No. 4 (1998)© Steinkopff Verlag 1998
Fig. 6 Experimentally measuredsteady state velocity profiles forthe flow of a shear-thinning,viscoelastic fluid along thecenterline of a cyclinder in thevicinity of a sphere. The sphere-to-tube ratio isa/R=0.121 andvarying density contrasts,a=3.37, 6.82 and 7.48, are usedto generate the increasing valuesof De
Fig. 7 Experimentally measuredvelocity profiles for the steadymotion of a shear-thinning, vis-coelastic fluid along the center-line of a cylinder for a sphere-to-tube ratio ofa/R=0.243 andvarying density contrastsa=1.90, 2.45 and 3.38. The co-ordinate system is centered onand traveling with the sphere.(a) Dimensional scales and (b)dimensionless scales normalizedwith the steady state velocityUs
and the sphere radiusa
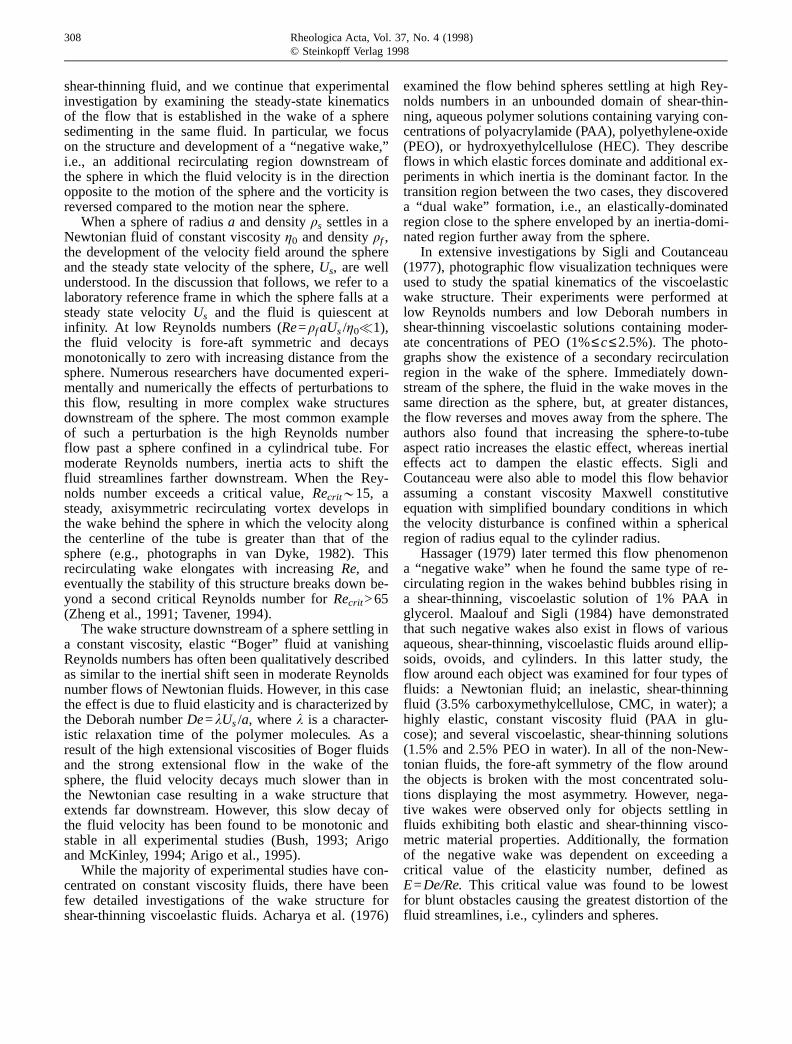
from the Newtonian creeping flow upstream of thesphere and, at any given axial position, velocities in theviscoelastic fluid are below the Newtonian limit. Thisdeviation was also noted by Sigli and Coutanceau(1977) and arises from the gradual decrease in the fluidviscosity as the deformation rate increases progressivelycloser to the sphere.
In the downstream wake of the sphere, the fluidvelocity decays back to zero; however, for all of themeasurements presented in the present work, this decayis not monotonic. In the region immediately behind thesphere,zstag≤z≤–a, the fluid velocity decays very rap-idly to zero. This decay is much faster than that seen inthe wakes of either a Newtonian fluid or a constant vis-cosity Boger fluid. In the former case, the velocity de-cay in the wake is confined byz/a*–R/a for creepingflow (see Fig. 7b). In the latter case of Boger fluids,the wake has been found to extend to distances beyondz/a*–30 downstream before returning to zero velocity(Bush, 1993; Arigo and McKinley, 1994; Arigo et al.,1995).
In both Fig. 6 (a/R=0.121) and Fig. 7a (a/R=0.243),which show thedimensionalvelocity profiles, the posi-tion of the stagnation pointzstag is located at the samedownstream distance for all densities and Deborahnumbers shown. For both aspect ratios, this point iszstag/a*–3.0 as shown in Fig. 7b. The fixed location ofthe stagnation point suggests that the dynamics whichcontrol the formation of this stagnation point in thisfluid are independent of the Deborah number and areprimarily affected by the geometry, i.e., the sphereradiusa and the cylinder radiusR.
This scaling is supported by Fig. 7b in which thevelocity is normalized with the steady state velocity,Us,and axial distances are scaled with the sphere radius,a.In this plot, the fluid velocities in the downstream re-gion zstag≤z≤–a superimpose to form a single curve,indicating that, again, this section of the flow is inde-pendent of the Deborah numbers spanned experimen-tally.
A similar scaling was not observed in the earlierwork of either Sigli and Coutanceau (1977) or Bisgaard(1983). For an aspect ratio,a/R=0.25, Sigli and Cou-tanceau found that the location ofzstag increases slightlywith increasing Deborah numbers in the range0.022≤De0≤0.120. The range of values reported bySigli and Coutanceau, –3.1≤zstag/a≤–2.5, for thisaspect ratio is similar to the value found in the presentwork for aspect ratiosa/R<0.396. For larger aspectratios,a/R=0.5 and 0.75, Sigli and Coutanceau report amuch stronger dependence ofzstag on aspect ratio. Forthese experiments, increasing the sphere-to-tube ratioshiftszstag upstream closer to the sphere,zstag*1.8.
In Bisgaard’s (1983) experiments which span the range0.04≤a/R≤0.18 and 11.4≤De0≤66.5, the stagnationpointwas located much farther downstream,zstag/a<–17. How-
ever, these experiments did show thatzstag was constantfor De0≤30.6, the only flows that Bisgaard reported asstable. Flows beyond this critical Deborah number werereported as unstable due to the onset of transientoscillations in the axial velocity within the regionzstag≤z≤–a, and the location of the stagnation pointapproacheszstag/a*–70.
At downstream locations beyond the flow reversalpoint z<zstag, the fluid velocity becomes negative,vz �z�<0, and continues to decrease monotonically untilreaching a minimum velocity,Umin. The position of theminimum velocity, zmin, is a function of the Deborahnumber and is shifted farther downstream asDe(c) in-creases. Additionally, the magnitudejUminj increaseswith increasingDe(c), and, as shown in Fig. 7b,Uminscales with the steady state velocity of the sphere, atrend also noted by Bisgaard (1983). As in Bisgaard’sexperiments, the negative wake ratio,NW:jUmin/Usj,was found to be constant for all Deborah numbers andaspect ratios; however, in the present work,NW&0.15for all low Reynolds number experiments, while Bis-gaard reports a much smaller value,NW&0.037. Theresults of Sigli and Coutanceau (1977) show thatNWincreases with increasingDe0 and a/R within the range0.06≤NW≤0.25 for their experiments. These variationsin the kinematic characteristics of the negative wakestructures presumably arise from rheological differencesin the three different concentrated polymer solutions; inparticular, the levels of strain-hardening and shear-thin-ning developed in the complex flow near the sediment-ing sphere.
Beyond the pointzmin, the fluid velocity monotoni-cally decays to zero over a long distance. In all cases,the extent of the negative wake extends more than 20radii downstream with the heavier spheres falling at thehighest Deborah numbers having the longest wakes.This axial expansion of the elastic wake structure issimilar to that observed in Boger fluids and is due tothe strong extensional flow in the wake of the sphereresulting in large extensional stresses that slowly relaxon a timescalet*k1.
DPIV results of the fluid motion around the sphereare presented in Fig. 8. In Fig. 8a, a “streak” photo-graph image is shown, which is the superposition of thetwo consecutive images used to calculate the DPIV vec-tor field shown in Fig. 8b. In this figure, a ceramicsphere (qs=3.84 g/cm3, a=0.635 cm) settles in the testfluid such that the steady state settling velocity isUs=0.412 cm/s or equivalentlyDe(c)=2.19 andRe(c)=0.001. In this figure, we focus on three distinctregions of the flow field close to the sphere: the front,the side, and the rear.
In the front of the sphere, the velocity field is essen-tially Newtonian. Fluid is pushed out radially in frontof the sphere and circulates around to the rear of thesphere. Note that the center of the recirculating region
317M.T. Arigo and G.H. McKinleyAn experimental investigation of negative wakes

along the side of the sphere is not centered between thesphere’s equator and the cylinder wall, but is muchcloser to the sphere. This is a result of the heavy shear-thinning of the fluid in this narrow region where thelocal shear rates attain their maximum values. By con-trast, in a Newtonian fluid at zero Reynolds number,the recirculation is locally centered within this region,while calculations of constant viscosity, elastic fluid mod-els show that the recirculation is shifted slightly towardsthe cylinder wall (Jin et al., 1991; Arigo et al., 1995).
Downstream of the sphere, we observe the formationof the negative wake structure, and almost the entirewake is captured in this image. There is a strong flowin the opposite direction to the sphere, confined mainlywithin a region bounded by a radial distancer*a. Thisis due to the large radial gradients in shear stress thatdevelop from the centerline towards the equator of thesphere that counteract the strong extensional flow in thewake behind the sphere (Harlen, 1997). To preservecontinuity, this flow is balanced by a weak inward flowtowards the centerline from regions near the cylinderwall. Note that the center of this secondary recirculatingregion is located atr*R/2. Similar DPIV images andresults were obtained for other aspect ratios and Debor-ah numbers (see Fig. 10).
Effect of geometric aspect ratio
In Figs. 9a and 9b, we show LDV measurements com-paring spheres of the same density ratio and differentradii falling in a cylinder of radiusR=5.23 cm. In Fig.9a, the kinematic effects of the varying aspect ratio areclearly shown in dimensional form. Upstream, thevelocity disturbance is confined within a regionbounded by the radius of the cylinderz*R, whiledownstream, increasing the aspect ratio magnifies thenegative wake and shifts it further downstream.Although the spheres fall at different speeds, the charac-teristic shear rate,Us/a, in each case is approximatelythe same. Hence, the final Deborah numbers for thespheres in this figure were nearly identical, and so, insome sense, we are examining only the effects of theproximity of the cylinder walls.
In Fig. 9b, these measurements are normalized usingthe steady sphere velocity,Us, and the sphere radius,a.Again, upstream of the sphere there is a purely geo-metric effect that scales the upstream extent of the flowwith z/a*R/a. However, downstream, the results super-impose almost completely. There is a slight deviationbeyond zmin where decreasing the aspect ratio,a/R,shifts the location ofUmin as well as the remainder of
318 Rheologica Acta, Vol. 37, No. 4 (1998)© Steinkopff Verlag 1998
Fig. 8 Quantitative velocityfield determined using DPIV fora 0.635 cm radius,ceramic sphere settling atUs=0.412 cm/s:a/R=0.196,a=3.37,De(c)=2.19,Re(c)=0.001. (a) Streak photo-graph of the flow. (b) Vectorfield calculated using DPIV

the decaying wake beyondzmin slightly downstream.Sigli and Coutanceau (1977) also examined the effectof a/R by pulling spheres through the fluid along thecenterline of a cylinder at a fixed velocity. For moder-ate aspect ratios,a/R=0.25, 0.5, and 0.75, at fixed lowDe0=0.04, increasing the aspect ratio was found toshift bothzstag andzmin towards the sphere and magnifythe magnitude of the negative wake,NW.
Fig. 10 shows a sequence of DPIV velocity fieldsaround a 1.27 cm radius aluminum sphere settling in acylinder of radiusR=3.28 cm. Qualitatively, the flowfield in these images is identical to that seen in Fig. 8for a smaller sphere in the same tube. Fluid is pushedout in front of the sphere (Fig. 10a), recirculates aroundthe side (Fig. 10b), and is drawn in behind the sphere(Fig. 10c). Because of the smaller distance between thesphere and the cylinder wall and the higher shear ratesin this region, the center of the recirculation around theside of the sphere is much closer to the sphere than inFig. 8. Within the negative wake region, the strongest
flow is again confined radially within a regionr*awhere the extensional effects are strongest.
Finally, we note that in Fig. 9 a negative wake formsfor even the smallest aspect ratio examined in this pa-per, a/R=0.060. This result complements Bisgaard’s(1983) work with small aspect ratio experiments, and itindicates that the negative wake is a phenomenon thatwould exist even in an unbounded domain, i.e., themechanism responsible for the formation of a negativewake arises from the complex shear and extensionalflow in the immediate wake of the sphere,not from the lateral confining effects of the cylinderwalls.
Effect of inertia
Fig. 11 compares the structure of the negative wake fortwo spheres, one sedimenting at low Reynolds number,Re(c)=0.005, and the other at high Reynolds number,
319M.T. Arigo and G.H. McKinleyAn experimental investigation of negative wakes
Fig. 9 Effects of changingaspect ratioa/R on the centerlinefluid velocity profiles around asphere. (a) Dimensional scalesand (b) dimensionless scalesnormalized with the steady statevelocity Us and the sphereradiusa

Re(c)=9.4, together with the predicted velocity profilefor creeping flow of a Newtonian fluid. Both spheresdevelop negative wakes; however, inertial effects highlydistort the structure of the wake for the faster=movingsphere. The wake is shifted much farther downstream:zstag/a&–13. Additionally, the magnitude of the nega-tive wake,NW, also decreases fromNW&0.15 (charac-teristic for all the low Reynolds number experiments
presented here) toNW&0.10. These results are morecompatible with the LDV experiments of Bisgaard(1983), who reportedzstag/a<–17 and NW&0.037,even though the Reynolds numbers based on the sol-vent viscosity reported by Bisgaard are very small,0.0167≤Res≤0.29.
Transient evolution of the negative wake
Arigo and McKinley (1997) have previously discussedthe transient motion of a sphere accelerating from restin this fluid and geometry. Fig. 12, reproduced fromthat reference, shows the transient velocity of an alumi-nium sphere accelerating from rest along the centerlineof a tube such thata=3.38 anda/R=0.243. Here, wesee the effects of the complex fluid rheology on themotion of the sphere. The sphere undergoes several os-cillations about the final steady state velocity, includinga “rebound” during the first oscillation in which thesphere stops and reverses direction momentarily beforecontinuing to sediment down the axis of the cylinder.Although this initial transient response of the sphere isvery well described by an analysis incorporating thelinear viscoelasticity of the fluid and the inertia of thesphere, such a model does not predict the formation ofa negative wake in the fluid kinematics or the decreasein the steady state drag on the sphere. Additionally,there are currently no numerical simulations thatexamine the progressive development of the negativewake structure as the strain in the fluid increases fromrest. Numerical calculations by Harlen et al. (1995)show that, even in a constant viscosity elastic fluid, thistransient evolution of the velocity field can be ex-tremely complex.
Figs. 13a–h represent a series of DPIV images for asingle experiment that follows the transient evolution ofthe negative wake as the sphere accelerates from rest.These images of the fluid velocity field are cross-refer-enced to Fig. 12, which details the transient velocity ofthe sphere,Us(t)/Us and displacement of the spherefrom rest,z(t)/a, at the appropriate times.
Figs. 13a–c show the acceleration of the sphere upto the initial velocity overshoot. On the scale of thefinite time increment resolvable by the CCD camera(0.033 s), the fluid response appears instantaneous sincethe fluid is initially very viscous. Vorticity informationfrom the accelerating sphere diffuses to the boundariesvery rapidly (tdiff =a2/m&0.003 s), and a “Newtonian-like” velocity field is set up as fluid is displaced infront of the sphere, circulated around the side, anddrawn in at the rear. At each stage in the first three fig-ures, the flow can almost be considered quasi-steady asthe velocity field changes primarily in magnitude only,although closer inspection shows that the center of therecirculating fluid motion slowly moves away from the
320 Rheologica Acta, Vol. 37, No. 4 (1998)© Steinkopff Verlag 1998
Fig. 10 DPIV velocity fields for a 1.27 cm radius, aluminum spheresettling at Us=0.503 cm/s: a/R=0.396, a=2.45, De(c)=1.93,Re(c)=0.001. (a) In front of the sphere, (b) along the side of thesphere, and (c) behind the sphere

sphere. The treatment of the motion of the sphere asquasi-steady has been discussed in detail by Arigo andMcKinley (1997).
In the subsequent two figures, the sphere comes torest momentarily (Fig. 13d) and then “rebounds”(Fig. 13e). As the sphere reverses its direction, so doesthe flow field, forming the same recirculating structurein the opposite direction. To this point, no negativewake is observed in these DPIV images.
The final three figures show the formation of thenegative wake at longer times. Fig. 13 f jumps ahead tot=3.967 s when the sphere is again settling down thecylinder under the action of gravity. At timet=8.00 s,the formation of a weak negative wake begins. At this
point, the sphere has fallen a dimensionless distance (orexperienced a global strain) of
c �Z t0
Us �t�a
dt � z �t�a� 5:0 : �7�
This clearly indicates that the negative wake is a largestrain phenomenon associated with nonlinear viscoelas-ticity. For small characteristic strains, the polymer mole-cules are not sufficiently extended and the tensilestresses in the wake are not sufficiently developed forthe negative wake to form. However, at Hencky strainsof e= ln(1+c)&1.8, the polymer solution exhibits an al-
321M.T. Arigo and G.H. McKinleyAn experimental investigation of negative wakes
Fig. 11 Effects of inertia on thecenterline fluid velocity profilesaround a sphere. Results arenormalized with the steady statevelocity Us and the sphereradiusa
Fig. 12 The dimensionsless ini-tial transient velocity,Us(t) /Us(*), and displacement from rest,z(t)/a (&), of a 1.27 cm radiusceramic sphere accelerating fromrest under the influence of gravityalong the centerline of a cylinder.a/R=0.243,a=2.45,De(c)=2.03,Re(c)=0.006.The solid data points indicate thetemporal location of the DPIVvector fields shown in Fig. 13.Note the break in the abscissafrom t=1.0 to 3.0 s

most constant extensional viscosity in uniaxial elonga-tional flow (as seen in Fig. 3). Subsequently, after thefalling sphere passes by a given fluid element, the mol-ecules will relax very quickly because of the absence ofa high viscosity solvent and the decrease in the effec-tive relaxation time observed at moderate shear rates.Stress relaxation data for this fluid following cessationof steady shear flow has been presented by Arigo andMcKinley (1997). It is this rapid elastic recoil, reminis-cent of that observed in an elastic thread, which appearsto result in the formation of the negative wake. As the
sphere continues to fall, the negative wake grows instrength until the final steady state profile is achieved.
Finally, we point out that in all of the LDV andDPIV experiments, the measured velocities in the wakeappear to be stable and the sphere settles at a constantvelocity. There was no evidence of a time-dependentflow instability in the negative wake of the type re-ported by Bisgaard (1983).
Conclusions
Using LDV, we have examined the effects of the den-sity contrast, aspect ratio, and inertia on the develop-ment of a negative wake in a viscoelastic shear-thinningfluid. For experiments with similar aspect ratios, thenegative wake increases in magnitude with increasingDeborah numbers and is also shifted farther down-
322 Rheologica Acta, Vol. 37, No. 4 (1998)© Steinkopff Verlag 1998
Fig. 13 Full-field DPIV profiles sequencing the transient accelera-tion of a 1.27 cm radius ceramic sphere from rest at the times indi-cated:a/R=0.243,a=2.45,De(c)=2.32,Re(c)=0.005. It is importantto note that the magnitude of the velocity vectors in (b) and (c) havebeen scaled by a factor of 0.25 due to the large velocity overshootthat develops at short times

stream. However, the spatial location of the stagnationpoint where the flow reverses direction remains station-ary for a fixed aspect ratio. Nondimensionalizing theseresults normalizes the upstream velocity as well as thedownstream velocity until the point of minimum veloc-ity at zmin/a. From this point downstream, there areslight variations in the dimensionless velocity as thewake extends more than 20 radii downstream. Finally,experiments at large Reynolds numbers show that theeffect of inertia is to shift the entire wake structuredownstream and to reduce the magnitude of the nega-tive wake. This may explain some of the differences inwake profiles observed in fluids with different rheologi-cal properties (e.g., Bisgaard, 1983).
Our results provide evidence that the formation of anegative wake is a nonlinear elastic response associatedwith specific forms of the material functions. UsingDPIV to analyze the transient acceleration of a spherefrom rest, we see that the negative wake develops fromthe nonlinear fluid response at large strains long afterthe transient oscillations associated with linear visco-elasticity and fluid inertia have decayed. Additionally,full-field data from DPIV shows that the largest veloci-ties in the negative wake are concentrated directly be-hind the sphere in the region of strong extensional flowwhere the extensional viscosity is large. This wakestructure is bounded by a region of high shear at thesphere equator where shear-thinning causes the fluidviscosity to be very low. These competing regions havebeen considered as one possible mechanism for the for-mation of the negative wake.
On the basis of large-scale numerical calculationswith nonlinear viscoelastic constitutive models, Bush(1994) and Harlen (1997) have both presented criteriathat can be used to rationalize the rheological condi-tions that lead to the development of a negative wake.In simulations with a PTT model, Bush showed that asthe dimensionless ratio of the Deborah number (De0)divided by the Trouton ratio (Tr) became larger, therewas an increasing trend for an upstream shift in thestreamlines within the wake of the sphere leading to thedevelopment of a negative wake. It should be notedthat Bush scales the Trouton ratio with the shear-rate–dependent viscosityg (c), and he uses a Deborah num-ber computed using the constant relaxation timek ob-tained in the limit of low shear rates; whereas, we usethe zero–shear-rate viscosity,g0, to scale the Troutonratio and a rate-dependent relaxation time,k (c), in theDeborah number. These numerical modifications do notaffect the generic conclusions obtained by Bush. Con-sideration of the origins of the terms inDe(c) and Trshows that this ratio characterizes the relative importanceof the normal stress differences in simple shear flow,N1=(sxx–syy)=W1(c) c2, to the normal stress differencesin uniaxial extension,Dsext=�szz ÿ srr�=�g �_e� _e. Hence,we consider the normal stress ratio
N1Dsext
� �W1 � _c�=2 g0� _c
�g �_e�=g0/ De � _c�
Tr�8�
where the extensional stress is to be evaluated at a char-acteristic strain rate_e � _c=
���3p
.In calculations with the FENE-CR model, Harlen
(1997) used the observation that the axial component ofthe pseudo-body force driving the secondary flow be-hind the sphere can be expressed as
fz � @ szz@ z� 1r
@
@ r�rsrz� : �9�
In conjunction with plots of local dumbbell orientation,Harlen shows that the radial gradients in shear stressand the axial gradients in normal stress counteract eachother and drive or retard the formation of a secondarywake. Since the positive tensile stress decays in thewake with decreasingz?–?, the first term in Eq. (9)is positive. The shear stress varies from zero on thecenterline and becomes increasingly negative as the ra-dial coordinate increases. Hence the sign offz dependson the relative magnitude of each term withfz< 0 cor-responding to a driving force for a negative wake.
Exact values of the stress gradients in Eq. (9) requirenumerical simulations; however, we may adopt thearguments of Harlen (1997) by estimating the expectedscales of the terms in Eq. (9). In particular, theshear stress will scale with the shear viscosity,srz!syx=g (c) c, while the axial tensile stress will beproportional to the stress difference in uniaxial elonga-tion, szz!Dsext. The DPIV results presented in this arti-cle indicate that the radial variations in the flow willscale with the sphere radiusa, while the LDV datashows that axial variations occur over a longer lengthscale proportional toR. Applying these estimates to Eq.(9), we obtain the following condition for the formationof a negative wake�
Dsext
syx
��a
R
���
�g �_e� _e
g � _c� _c
��a
R
�< C �10�
whereC is a constant whose value depends on the flowkinematics.
While we cannot determine the value ofC inEq. (10), we can compare values of the left-hand sideof Eq. (10) for different fluids under similar experimen-tal conditions. We thus compare the shear-thinning,elastic solution employed in the present paper (forwhich a negative wake is observed) with the constantviscosity, elastic Boger fluid used in previous experi-ments (Becker et al., 1994; Arigo and McKinley, 1994;Arigo et al., 1995; Rajagopalan et al., 1996) in whichan extended wake was found, but no negative wakewas seen. The latter fluid consists of 0.31 wt.% polyiso-butylene (PIB) dissolved in 4.83 wt.% tetradecane(C14) in a solvent of polybutene (PB) and has been
323M.T. Arigo and G.H. McKinleyAn experimental investigation of negative wakes

thoroughly characterized in both shear (Quinzani et al.,1990) and extensional flows (Tirtaatmadja and Shidhar,1993; Spiegelberg et al., 1996). We expect, based onthe calculations of Harlen (1997), that smaller values ofthe stress ratioDsext /syx will indicate the tendency foran upstream shift of the fluid streamlines in the wakeand the resultant formation of a negative wake. Table 2confirms this supposition. Here, the stresses and thestress ratio for the two fluids are listed for two Deborahnumbers,De(c)=1.0 and 5.0, which roughly span therange of the experimental results. For both Deborahnumbers, the extreme extensional-thickening in the PIBfluid leads to large extensional stresses in the wake ofthe sphere that greatly dominate the shear stresses. Thisgives rise to a very large stress ratio, much greater thanthat in the PAA fluid where the steady extensional vis-cosity remains small and approximately constant for allstrain rates (see Fig. 2).
324 Rheologica Acta, Vol. 37, No. 4 (1998)© Steinkopff Verlag 1998
Table 2 A comparison of the stresses and stress ratios for the PAAtest solution and a polyisobutylene (PIB) Boger fluid, used in pre-vious experiments by the authors, at identical Deborah numbers. Thevalues are calculated from the exact solution to the Giesekus modelusing the multimode parameters listed in Table 1 for the PAA solu-tion and those obtained by Quinzani et al. (1990) for the PIB solu-tion. Note, for comparison, the extensional stresses have been evalu-ated at a strain rate of_e � _c=
���3p
De(c)=1.0 De(c)=5.0
PAA PIB PAA PIB
c [s–1] 0.061 3.03 9.26 16.5syx [Pa] 8.96 38.7 51.0 207N1 [Pa] 17.9 28.3 510 734Dsext [Pa] 62.0 3.60×10⁴ 9.9×10³ 3.1×10⁵
Dsext/syx 6.92 928 194 1511N1/Dsext 0.289 7.9×10⁻⁴ 0.051 2.3×10⁻³
Fig. A1 (a) The steady shearand extensional rheologicalproperties and (b) the transientuniaxial extensional response ofthe shear-thinning, viscoelastictest fluid. The curves are thepredictions of the four-modePTT model using the parametersspecified in Table 1

Additionally, Table 2 lists the values of the normalstress ratio,N1/Dsext, as proposed by Bush (1994). Thetrends here also confirm Bush’s observations that in-creasing this ratio leads to a tendency for the formationof a negative wake. Hence, it is not possible to differ-entiate between which mechanism is primarily responsi-ble for the formation of the negative wake, only that itis a very sensitive function of the nonlinear rheology ofthe test fluid. In practice, the difference between thetwo criteria is unimportant since for many polymericfluids it is found experimentally that the first normalstress difference is directly related to the shear stressthrough a relationship of the formN1=Asb
yx with b&2(Barnes et al., 1989). Hence, if the criterion proposedby Bush is valid, then the condition suggested by Har-len will also be valid. In either case, the key factor isthe value of the extensional stress that develops in thewake of the sphere. The experimental fluids used bySigli and Countanceau (1977), by Bisgaard (1983), andby Maalouf and Sigli (1984) were all concentrated
aqueous polymer solutions that may be expected to ex-hibit very similar extensional stress growth characteris-tics to the present fluid.
Finally, we note that in all of the experiments per-formed in conjunction with this paper (not just thosepresented here) the flow appeared to be stable withinthe wake. No instabilities of the type described by Bis-gaard (1983) were seen.
Acknowledgements The authors would like to acknowledge thesupport of the National Science Foundation under grant No.CTS9553216 and helpful discussions with Dr. Oliver Harlen. Addi-tional thanks goes to Dr. Stephen Spiegelberg of Cambridge PolymerGroup, Inc. for providing the extensional viscosity measurements andDr. Peyman Pakdel for his help with DPIV.
Appendix
Figs. A1 and A2 are provided for completeness. Here,the Phan-Thien–Tanner constitutive model has been
325M.T. Arigo and G.H. McKinleyAn experimental investigation of negative wakes
Fig. A2 (a) The steady shear andextensional rheological propertiesand (b) the transient uniaxialextensional response of theshear-thinning, viscoelastic testfluid. The curves are the predic-tions of the single-mode, modi-fied PTT model using the param-etersg0=464 Pa·s,k=121 s,e=0.5, andn=0

used to fit the rheological data for the PAA test fluid.The PTT constitutive model is ideal in that it providestwo adjustable material parameters,n and e, which iso-late the non-linear shear and extensional effects, respec-tively. In Fig. A1, the viscometric properties and thetransient extensional viscosity are fitted using a four-mode formulation of the PTT model with the linearform of the network function, i.e.,f (tr sp)=1+e trsp. Aswith the Giesekus fit in Fig. 2, the same linear visco-elastic spectrum of viscosities,gj, and relaxation times,kj, are used, and the PTT parametersnj and ej are cho-sen to provide the best fit to both the shear and exten-sional flows. For simplicity, single values fornj =0.1and ej =0.15 are chosen for all four modes as listed inTable 1. The shear rheology is shown in Fig. A1a. ThePTT model provides an excellent fit to the viscosity;however, the model slightly overpredicts the normalstress coefficient at low shear rates and underpredicts itat high shear rates. The PTT model also predicts amuch greater extensional-thickening effect in steady ex-tensional flow at high strain rates than does the Giese-kus model. The transient Trouton ratio is shown in Fig.A1b. The multimode PTT model provides a much bet-
ter fit to the measured data for all three strain rates thanthe Giesekus model did, due to the flexibility of freelyadjusting the parameterej .
Most numerical calculations are performed withsingle-mode viscoelastic constitutive equations, and it isillustrative to consider how well such models accuratelycapture the material functions of the test fluid. In Fig.A2, the viscometric properties have been fitted to a sin-gle-mode, modified PTT model withn=0. In this case,the constitutive model parameters are the zero–shear-rate viscosityg0=464 Pa·s, the “average” relaxationtimescale estimated fromW10/2g0^k=121 s, and thePTT parametere=0.5. While this model provides agood fit to the steady shear data shown in Fig. A2b,the comparisons with the transient uniaxial extensionexperiments point out, once again, the intrinsic limita-tions of single-mode constitutive models, particularly atshort timescales that simply cannot be captured by thelong relaxation time associated with this fluid. In an Eu-lerian-steady complex flow such as the motion past asphere settling at a steady velocity, such a response willresult in an unrealistic rate of stress growth as fluid ele-ments are convected past the sphere.
326 Rheologica Acta, Vol. 37, No. 4 (1998)© Steinkopff Verlag 1998
References
Acharya A, Mashelkar RA, Ulbrecht J (1976)Flow of inelastic and viscoelastic fluidspast a sphere. Part II: Anomalous separa-tion in the viscoelastic fluid flow. RheolActa 15:471–478
Agarwal US, Dutta A, Mashelkar RA (1994)Migration of macromolecules under flow:The physical origin and engineering ap-plications. Chem Eng Sci 49:1693–1717
Arigo MT, McKinley GH (1994) The steadyand transient motion of a sphere througha viscoelastic fluid. ASME Fluids Engi-neering Division, 29th Forum on Cavita-tion and Multiphase-Flow 194:139–147
Arigo MT, McKinley GH (1997) The effectsof viscoelasticity on the transient motionof a sphere in a shear-thinning fluid. JRheol 41:103–128
Arigo MT, Rajagopalan D, Shapley N,McKinley GH (1995) The sedimentationof a sphere through an elastic fluid.Part 1: Steady motion. J Non-NewtonianFluid Mech 60:225–257
Barnes HA, Hutton JF, Walters K (1989) Anintroduction to rheology. Elsevier, NewYork
Becker LE, McKinley GH, Rasmussen HK,Hassager O (1994) The unsteady motionof a sphere in a viscoelastic fluid. JRheol 38:377–403
Becker LE, McKinley GH, Stone HA (1996)Sedimentation of a sphere near a planewall: Weak non-Newtonian and inertialeffects. J Non-Newtonian Fluid Mech63:201–233
Bisgaard C (1983) Velocity fields aroundspheres and bubbles investigated by laser-Doppler anemometry. J Non-NewtonianFluid Mech 12:283–302
Bush MB (1993) The stagnation flow behinda sphere. J Non-Newtonian Fluid Mech49:103–122
Bush MB (1994) On the stagnation flow be-hind a sphere in a shear-thinning visco-elastic fluid. J Non-Newtonian FluidMech 55:229–247
Chhabra RP (1992) Bubbles, drops, and par-ticles in non-Newtonian fluids. CRCPress, Boca Raton
Harlen OG (1997) The negative wake behinda sedimenting sphere. (In preparation)
Harlen OG, Rallison JM, Szabo P (1995) Asplit Lagrangian-Eulerian method for sim-ulating transient viscoelastic flows. JNon-Newtonian Fluid Mech 60:81–104
Hassager O (1979) Negative wake behindbubbles in non-Newtonian liquids. Nature29:402–403
Hassager O (1988) Working group on numer-ical techniques. J Non-Newtonian FluidMech 29:2–5
Jin H, Phan-Thien N, Tanner RI (1991) A fi-nite element analysis of the flow past asphere in a cylindrical tube: PTT fluidmodel. Comp Mech 8:409–422
Kolte MI, Rasmussen HK, Hassager O(1997) Transient filament stretching rhe-ometer II: Numerical simulation. RheolActa 36:285–302
Maalouf A, Sigli D (1984) Effects of bodyshape and viscoelasticity on the slowflow around an obstacle. Rheol Acta23:497–507
Pakdel P, McKinley GH (1997) Digital parti-cle imaging velocimetry of viscoelasticfluids. AIChEJ 43:289–302
Quinzani LM, McKinley GH, Brown RA,Armstrong RC (1990) Modeling the rhe-ology of polyisobutylene solutions. JRheol 34:705–748
Rajagopalan D, Arigo MT, McKinley GH(1996) The sedimentation of a spherethrough an elastic fluid. Part 2: Transientmotion. J Non-Newtonian Fluid Mech65:17–46
Satrape JV, Crochet MJ (1994) Numericalsimulation of the motion of a sphere in aBoger fluid. J Non-Newtonian FluidMech 55:91–111
Sigli D, Coutanceau M (1977) Effect of finiteboundaries on the slow laminar isother-mal flow of a viscoelastic fluid around aspherical obstacle. J Non-NewtonianFluid Mech 2:1–21
Spiegelberg SH, Ables DC, McKinley GH(1996) The role of end-effects on mea-surements of extensional viscosity in fila-ment stretching rheometers. J Non-New-tonian Fluid Mech 64:229–267
327M.T. Arigo and G.H. McKinleyAn experimental investigation of negative wakes
Tavener SJ (1994) Stability of the O(2)-sym-metric flow past a sphere in a pipe. JFluid Mech 6:3884–3892
Tirtaatmadja V, Shidhar T (1993) A filamentstretching device for measurement of ex-tensional viscosity. J Rheol 37:1081–1102
Van Dyke M (1982) An album of fluid mo-tion. Parabolic Press, Stanford
Walters K, Tanner RI (1992) The motion of asphere through an elastic fluid. In: Chha-bra RP, DeKee D (eds) Transport pro-cesses in bubbles, drops and particles.Hemisphere, New York, pp 73–86
White SA, Baird DG (1996) The importanceof extensional flow properties on planarentry flow patterns of polymer melts. JNon-Newtonian Fluid Mech 20:93–101
Yao M, Spiegelberg SH, McKinley GH(1998) Fluid dynamics of weakly strain-hardening fluids in a filament stretchingdevice. J Non-Newtonian Fluid Mech, inpress
Zheng R, Phan-Thien N, Tanner RI (1991)The flow past a sphere in a cylindricaltube: effects of inertia, shear-thinning andelasticity. Rheol Acta 30:499–510