An experimental and numerical study of nonlinear...
11
An experimental and numerical study of nonlinear internal waves Dominique P. Renouard LM.G./L.E.G.I. (U.J.F.-C.N.R.S.-I.N.P.G.), B.P. 53 X, 38041 Grenoble Cedex, France Gunnar G. Tomasson and W. Kendall Melvillea) R.M. Parsons Laboratory, Massachusetts Institute of Technology, Cambridge, Massachusetts 02139 (Received 12 December 1991; accepted 4 February 1993) Nonlinear internal waves were measured on the large rotating platform at the Institut de Mtcanique de Grenoble (I.M.G. ) . The experimental data complement the results presented in Renouard et al. [J. Fluid Mech. 177, 381 (1987)] and support the assumption that the solitary Kelvin wave is accompanied by Poincare waves. Based on the assumption of weak nonlinear, dispersive, and rotational effects, governing equations of the Boussinesq type are derived to model the evolution of an initial disturbance in a two-layer rotating fluid. The numerical study is based on these equations which are analogous to the Boussinesq equations of shallow-water theory and are not constrained to almost unidirectional propagation. Comparison of numerical solutions of the equations and experimental results are very good for moderately nonlinear conditions. These results provide supporting evidence for the resonant interaction of nonlinear Kelvin waves and linear Poincart waves, as described by Melville et al. [J. Fluid Mech. 206, 1 (1989)]. 1. INTRODUCTION In the oceans, as well as in large lakes, long internal waves are often both nonlinear and influenced by rotation. Without rotation, the balance of nonlinearity and disper- sion leads to the formation of permanent waves which are either cnoidal or solitary waves satisfying the Korteweg-de Vries (KdV) equation. Such waves have been extensively studied both in homogeneous and stratified fluids. But as rotation is introduced some significant differences appear. Thus Renouard et al. i studying the properties of internal solitary Kelvin waves in a rotating channel (cf. Fig. 1 for notations) observed that, along the right-hand side of the channel, as well as in any plane parallel to the channel walls, the leading wave has a sech’ profile, and that its celerity is independent of the distance to the wall, i.e., the front appears to be moving as a whole, with a phase speed fixed by the amplitude at the right-hand wall. For the ra- tios of Rossby radius to channel width, R/W, used in their experiments, [O.150.431, the amplitude decreased exponen- tially with distance from the wall, the decay scale being k=f/cc= l/R, where f is the Coriolis parameter, and co the internal wave phase speed. Moreover, as in Maxworthy,’ they noticed a strong curvature of the wave front. Although the initial conditions were clearly two di- mensional, the wave, which was first generated with a hor- izontal crest perpendicular to the walls, changed its shape as it propagated along the channel, and, at some distance downstream, reached what appeared to be a stable shape, characterized by a strong curvature backwards. They sug- gested that the cause of the curvature, which appeared to be independent of the ratio between the layer thicknesses, ‘)Present address: Scripps Institution of Oceanography, University of California, San Diego, La Jolla, California 92093-0213. was likely to be either nonlinear or viscous effects. The leading wave was followed by a train of waves of smaller amplitude. The experimental results suggested several theoretical and numerical studies. The first attempt to describe ana- lytically such nonlinear waves in a channel was made by Grimshaw,3 who distinguished a “strong rotation” case (internal Rossby radius, at most, comparable to the wave- length), from a “weak rotation” case (internal Rossby ra- dius much larger than the wavelength), but he could not account for the crest curvature in the absence of dissipa- tion, in a channel of finite width. Independently, Germain and Renouard4 provided a uniform analytical framework for the study of all possible permanent progressive long waves in a rotating fluid. To model the experiments, Katsis and Akylas5 used an informal derivation of the rotation modified Kadomstev- Petviashvih (KP) equation first derived by Grimshaw3 for the “weak rotation” case, and made some numerical com- putations. They were able to qualitatively reproduce most of the features appearing in the experiments, including the crest curvature, and suggested that, besides the viscous damping, the wave curvature was possible because of a slow attenuation of the wave as it propagated along the channel, but they did not relate such a decay to the small- amplitude waves that they observed behind the main curved disturbance. Both Grimshaw3 and Katsis and Akylas’ mentioned that there is a constraint on the KP equation which requires that the “mass” of the solution be proportional to exp ( -y/R ) at all times. Melville et aL6 considered the evolution of weakly non- linear dispersive long waves in a rotating channel. They showed that weakly nonlinear Kelvin waves may be unsta- ble to a direct nonlinear resonance with the linear Poincare modes of the channel. Thus the curvature of the wave front 1401 Phys. Fluids A 5 (6), June 1993 0899-8213/93/061401-11$06.00 @ 1993 American Institute of Physics 1401
Transcript of An experimental and numerical study of nonlinear...

An experimental and numerical study of nonlinear internal waves Dominique P. Renouard LM.G./L.E.G.I. (U.J.F.-C.N.R.S.-I.N.P.G.), B.P. 53 X, 38041 Grenoble Cedex, France
Gunnar G. Tomasson and W. Kendall Melvillea) R.M. Parsons Laboratory, Massachusetts Institute of Technology, Cambridge, Massachusetts 02139
(Received 12 December 1991; accepted 4 February 1993)
Nonlinear internal waves were measured on the large rotating platform at the Institut de Mtcanique de Grenoble (I.M.G. ) . The experimental data complement the results presented in Renouard et al. [J. Fluid Mech. 177, 381 (1987)] and support the assumption that the solitary Kelvin wave is accompanied by Poincare waves. Based on the assumption of weak nonlinear, dispersive, and rotational effects, governing equations of the Boussinesq type are derived to model the evolution of an initial disturbance in a two-layer rotating fluid. The numerical study is based on these equations which are analogous to the Boussinesq equations of shallow-water theory and are not constrained to almost unidirectional propagation. Comparison of numerical solutions of the equations and experimental results are very good for moderately nonlinear conditions. These results provide supporting evidence for the resonant interaction of nonlinear Kelvin waves and linear Poincart waves, as described by Melville et al. [J. Fluid Mech. 206, 1 (1989)].
1. INTRODUCTION
In the oceans, as well as in large lakes, long internal waves are often both nonlinear and influenced by rotation. Without rotation, the balance of nonlinearity and disper- sion leads to the formation of permanent waves which are either cnoidal or solitary waves satisfying the Korteweg-de Vries (KdV) equation. Such waves have been extensively studied both in homogeneous and stratified fluids. But as rotation is introduced some significant differences appear. Thus Renouard et al. i studying the properties of internal solitary Kelvin waves in a rotating channel (cf. Fig. 1 for notations) observed that, along the right-hand side of the channel, as well as in any plane parallel to the channel walls, the leading wave has a sech’ profile, and that its celerity is independent of the distance to the wall, i.e., the front appears to be moving as a whole, with a phase speed fixed by the amplitude at the right-hand wall. For the ra- tios of Rossby radius to channel width, R/W, used in their experiments, [O. 150.431, the amplitude decreased exponen- tially with distance from the wall, the decay scale being k=f/cc= l/R, where f is the Coriolis parameter, and co the internal wave phase speed. Moreover, as in Maxworthy,’ they noticed a strong curvature of the wave front. Although the initial conditions were clearly two di- mensional, the wave, which was first generated with a hor- izontal crest perpendicular to the walls, changed its shape as it propagated along the channel, and, at some distance downstream, reached what appeared to be a stable shape, characterized by a strong curvature backwards. They sug- gested that the cause of the curvature, which appeared to be independent of the ratio between the layer thicknesses,
‘)Present address: Scripps Institution of Oceanography, University of California, San Diego, La Jolla, California 92093-0213.
was likely to be either nonlinear or viscous effects. The leading wave was followed by a train of waves of smaller amplitude.
The experimental results suggested several theoretical and numerical studies. The first attempt to describe ana- lytically such nonlinear waves in a channel was made by Grimshaw,3 who distinguished a “strong rotation” case (internal Rossby radius, at most, comparable to the wave- length), from a “weak rotation” case (internal Rossby ra- dius much larger than the wavelength), but he could not account for the crest curvature in the absence of dissipa- tion, in a channel of finite width. Independently, Germain and Renouard4 provided a uniform analytical framework for the study of all possible permanent progressive long waves in a rotating fluid.
To model the experiments, Katsis and Akylas5 used an informal derivation of the rotation modified Kadomstev- Petviashvih (KP) equation first derived by Grimshaw3 for the “weak rotation” case, and made some numerical com- putations. They were able to qualitatively reproduce most of the features appearing in the experiments, including the crest curvature, and suggested that, besides the viscous damping, the wave curvature was possible because of a slow attenuation of the wave as it propagated along the channel, but they did not relate such a decay to the small- amplitude waves that they observed behind the main curved disturbance. Both Grimshaw3 and Katsis and Akylas’ mentioned that there is a constraint on the KP equation which requires that the “mass” of the solution be proportional to exp ( -y/R ) at all times.
Melville et aL6 considered the evolution of weakly non- linear dispersive long waves in a rotating channel. They showed that weakly nonlinear Kelvin waves may be unsta- ble to a direct nonlinear resonance with the linear Poincare modes of the channel. Thus the curvature of the wave front
1401 Phys. Fluids A 5 (6), June 1993 0899-8213/93/061401-11$06.00 @ 1993 American Institute of Physics 1401

as well as the decay of the leading wave amplitude may be attributable to the Poincare waves generated by the reso- nance. Later Grimshaw and Melville7 reconsidered the derivation of the rotation modified KP equation and its integral constraints, and showed that, in general, it is not permissible to assume that solutions to the rotation modi- fied KP equation derived by Grimshaw3 are locally con- fined, and that there are Poincare waves radiated behind the main part of the solution. More recently, Grimshaw and Tang* also showed that any solitarylike wave must be accompanied by trailing Poincare waves, so that any local- ized initial disturbance will evolve into a solitarylike wave with a curved wave front. They found that, as the effect of rotation increases, the extent of the wave curvature and the amplitude of the trailing Poincare waves both increase.
While the role of the Poincare waves which are gener- ated by nonlinear waves in a rotating system have been investigated in a series of theoretical and numerical papers, only qualitative comparisons with the available experi- mental results have been possible. This has been due in part to the fact that asymptotic theories based on the KP equa- tion and related equations which represent almost uni- directional propagation are unable to adequately model arbitrary initial conditions. This is related to the integral constraints described above. In this paper we present an experimental and numerical study of the evolution of an initial disturbance in a two-layer rotating fluid. The numerical study is based on the more general formula- tion of Tomasson and Melville’ which is analogous to the Boussinesq equations of shallow-water theory and is not constrained to almost unidirectional propagation. Initial conditions which can be reasonably generated in the ex- periments are faithfully represented in the numerical solutions.
II. EXPERIMENTAL SETUP
The experiments were conducted in the Coriolis Lab- oratory of the Institut de Mecanique de Grenoble. We used a channel, 9 m long, 2 m wide and 0.6 m deep, with a lighter upper layer of fresh water, and a denser lower layer of salt water. Figure 1 indicates the notation used. All the experiments were run with a lower layer 0.26 m thick, an upper layer 0.04 m thick, and a fractional density differ- ence Ap/p=0(0.01). For this set of experiments, the pe- riod of the platform rotation varied between 110 and 1000 set, to give internal Rossby radii of deformation in the range 0.55 mgRG5.51 m, with dimensionless Rossby radii: 0.27<R/ W~2.78.
The channel was equipped with a dam at the upstream end, so that it was possible to have a thicker upper layer on one side of the dam. We denote by Ah the difference in thickness of the upper layers across the dam. This was usually set to 2 cm. By lifting the dam the light water behind the dam was released, and generated a wave train which propagated downstream. We chose Ah so that, with- out rotation, there would be only one solitary wave.
The interface height variations with time were re- corded by interface followers at various locations. These
FIG. 1. Sketch of the notations used for the (9 x 2 x 0.6 m) channel built on the 14 m diam rotating platform and equipped with an internal wave generator.
probes are electronically directed to follow the movements of a layer of a given conductivity with great accuracy. The principle of these recorders is to measure the conductivity of a given reference layer, and to compare it with a chosen reference conductivity. With such an interface follower, we are able to follow the reference layer with an accuracy of 0.1 mm in height, and a response time of about 0.5 sec. Six such interface followers were used in these experiments. The probes were always following a layer very close to the inflection point of the interface profile. Thus the effects of the diffused interface can be minimized in the comparisons between the experiments and the computations.
Ill. NUMERICAL MODEL
We consider the motion of a two-layer fluid confined to a channel rotating on an f plane, i.e., with a constant Coriolis parameter. The fluid is assumed incompressible and inviscid, thus neglecting frictional effects at the chan- nel walls, bottom, and at the interface between the two fluids. Furthermore, a rigid lid approximation is made, neglecting the barotropic surface-wave mode and looking only at the evolution of the baroclinic internal wave mode. The x axis is taken to be along the channel, the y axis across the channel and the z axis in the vertical direction, positive upwards. The fluid layers have constant densities p1 and p2 and depths hl and h,, with the interface between the fluid layers at the equilibrium position z=O. Following a derivation similar to that given by Tomasson and Melville9 for the corresponding single-layer case (the de- tails of both derivations are given by Tomassort”), we ob- tain the Boussinesq momentum equations for the upper layer:
U,“‘+aU’l’U’l’+ayV”)U(‘) l 42) L x Y -@‘+plp, -
Pl ?jx
-P$ (u~;;+yu;;$=o(p),
1402 Phys. Fluids A, Vol. 5, No. 6, June 1993 Renouard, Tomasson, and Melville 1402

and those for the lower layer
U:2’+aU’2’U’2’+ayV’2~~~2)-~~(2)+~~~l)+~ 77 x Y P2 P2 x
1 -0; (ti~~+yu;;~)=o($), (3)
together with the continuity equation for the upper layer:
-77t+[(hl--a77)U(‘)lx+Y[(hl-arl)V”)l,=O($) (5)
and that for the lower layer:
q+ [h+aq) U’2’lx+~[(h2+a~) ~“‘l,=O(P2). (6)
Here U(1P2) and YClP2) are the depth-averaged horizontal velocities in each layer, v is the interface displacement, and P -(lV2) are the dynamic pressures at the interface, i.e.,
j+‘J2) (x&t) ==p(‘,2) 1 r=av, (7)
where p is the dynamic pressure in the fluid, i.e., the fluid pressure after substracting the hydrostatic pressure. The scaling used here is
x’ = k-lx, (8)
y’=Py, (9)
z’ = hg, (10)
~rmLaco~m), (11)
V ~u.2),a fiqpa, (12)
1
t’=G ty (13)
q’=ahorl, ( 14)
p’ = ap0&, (15)
h;,2=hob (16)
p;,2= POPL21 (17)
where primes denote the dimensional variables. Here, ho = h;h;/( h ; + hi) is an equivalent single-layer depth for
1403 Phys. Fluids A, Vol. 5, No. 6, June 1993
the corresponding linear and hydrostatic problem, ci= (Ap/p)gho is the linear phase speed of the internal waves, Ap = p; - pi is the density difference, and p. is a reference density. The parameters we have introduced are
a=A/ho, (18)
P= Wo12, (19)
E=(l/kR)(l/k), (20)
y= (l/k)2, (21)
representing nonlinear, dispersive (nonhydrostatic), rota- tional, and transverse effects, respectively. Here A is a mea- sure of the amplitude of the disturbance, .k- ’ and I- ’ are typical length scales in the x and y directions, respectively, and R =co/f is the internal Rossby radius of deformation. The above equations are based on the assumption of weak nonlinear, dispersive, and rotational effects, i.e.,
a=O(fi> =0(e) Q 1, (22)
which is the appropriate scaling for the experimental re- sults presented here.
To obtain one pair of momentum equations we take the difference between the momentum equations in the two layers,i.e.,p2* (3)-pI*(l) andp,. (4)-pI*(2). Weas- sume that:
Apip 4% (23)
which is an appropriate assumption for the experimental results presented here, and require that the mass fluxes in the two layers balance in the x and y directions indepen- dently, which gives
(hl--aq) (U(‘),Y(*)) = - (h2+aq) ( Uc2),Vc2)), (24)
which is the case for the lowest-order, linear, and hydro- static problem. After using the appropriate matching con- ditions at the interface between the two layers, the follow- ing set of Boussinesq equations is obtained:
vt+ ~,+yvy=om, (25)
1 1 U,+w--EV+a h,-h, ( 1 [2UUxf-Y( Vpv-~U,l
-DF (U,,,+yV,,,) =O($),
yV,+yqy+EU+ay ( 1
i--k [ (UV),+2yVV,--rlVtl 2 1
-pyF (U,,,+yV,,> =O(B2), (27)
with the side-wall boundary conditions,
V=O at y=O, W. (28)
Here IJ is the interface displacement and U and V are the horizontal fluxes in the lower layer:
(U,V)=(h2+aq)(U(2),V(2)) - (29)
Renouard, Tomasson, and Melville 1403

or equivalently, from (24), the negative fluxes in the upper layer. Equation (25) represents the continuity equation for either layer, whereas (26) and (27) come from the differ- ence between the momentum equations in the two layers. We have also assumed that
which is generally the case for the experimental results presented here.
In dimensional units these equations are
71t+ u,+ vy=o,
with the side-wall boundary conditions
I 0.2 %
0.4 I-
0.6
0.8 - IT *. * I 1.21-
1.4 1
1.6
f 1.8!
R/W=0275
(32)
*I 50 60 70 80 90 IOD 110 120 130 Ma 150
(4 TmE [S]
I\ \I 1.6
r i 1.8 t VI .25
.I
% .a5
688 cxc ma
.%1 t
\ \
0 1 2 3
Y/R
FIG. 2. Amplitude variations (v/A) vs (Y/R), in a plane perpendicular to the channel sides (0), and along the crest (*), for 6 m<x(8 m. Thk solid line plots exp( --y/R), the dotted lines, the decay scales computed from the data.
V=O at y=O, W, (34)
where, from now on, we have dropped the primes for con- venience. Although slightly different from the correspond- ing single-layer equations derived by Tomasson and
50 60 70 80 90 100 110 120 130 140
(0) TIME [sl
FIG. 3. Contour of interfacial displacement at x=5 m computed from the measured time series at four stations across the channel; R/W=0.275 (a), 0.5 (b), 1.0 (c), and 2.75 (d).
1404 Phys. Fluids A, Vol. 5, No. 6, June 1993 Renouard, Tomasson, and Melville 1404

(4
-I 120
I
(b)
Melville,g the important dynamics are the same. These equations are solved numerically using the scheme de- scribed by Tomasson and Melville.’
IV. EXPERIMENTAL RESULTS
We define k, the characteristic wavelength of the leading wave in the x direction as k=== (l/A) X J$v(x--cCt)d(x-ct), by using only the forward portion of the wave, in a method similar to that used by Koop and Butler.” For the experiments presented here, the ratio 2k/R was in the range [0.11,1.05] so that the conditions ranged from weak to strong rotation.
The downstream part of the leading wave is accurately described by the sech’ profile. Having a large range of variation for R/W enabled us to obtain more accurate values for the decay scales across the channel. At x= 5 m, the trace of the leading wave in a vertical plane perpendic- ular to the sides and passing through the maximum ampli- tude at the right-hand wall, A, is given by A,=A X exp ( - 0.82y/R), and the projection of the same crest on the same plane is described by A,=4 exp( - 1.67y/R) [Fig. 2); the coefficients -0.82 and - 1.67 being obtained by linear regression from the experimental data.
Because of the initial condition, the leading wave al- ways starts with a wave front aligned with they axis, but it immediately evolves toward a three-dimensional form. The increase of the phase shift across the channel with decreas- ing R/W is shown by contour plots generated from the
1.6
k !I 1.8
40 50 60 70 80 90 1W 110 I?0
(c) =IME IS1
FIG. 4. Contour of the interfacial displacement computed from the mea- sured time series at x= 5 m, for three different initial conditions: Ak=0.5 cm (a), 1 cm (b), and 2 cm (c).
time series taken at four stations across the channel at x = 5 m. These contour plots [Figs. 3(a)-3 (d)] provide a space- time view of the disturbance. When the time delay is con- verted to a spatial phase shift based on the speed of prop- agation at the right-hand wall, we see that the spatial phase shift across the channel for small R/W may be as much as a meter. Looking at the evolution of the leading wave am- plitude along the right-hand wall, we notice that it tends either to remain constant or even to increase along the first few meters and then decrease.
If we vary the initial layer thickness difference, from Ah=0.5cmto2cm,butkeepR/W=l,wecanseeatx=5
TABLE I. The parameters of the runs.
Fixed parameters
Upper layer depth h 4 cm Lower layer depth h, 26 cm Density difference AP/P 0.013 Coriolis parameter f 0.0331 xc- Linear wave speed CO 6.65 cldsec Rossby radius R 2.0 m Channel width w * 2.0 m
Variable parameters
run1 run II run III run IV
Initial amplitude a0 (cm) -0.5 -1.0 - 1.5 -2.0
1405 Phys. Fluids A, Vol. 5, No. 6, June 1993 Renouard, Tomasson, and Melville 1405

150
-2 2 100 x
50
200 r; : : ; i ; : : : : : : :\ i
: ! s, : : 1
g ~~~~~~~~~~~,
50 oj/, ~~~~~~~~~~~~ ( [ly
I I I
300 350 400 150 500 550 600
x [cm1
O-9 (‘3
0 300 350 400 450 500 550 500
i [cm1 300 250 400 450 500 550 600
f c-1
FIG. 5. Contour plots of the solution of Eqs. (31)-(33) for 7) at t=65 set, corresponding approximately to the time the leading disturbance propagates past the stations at which time series are taken. (a) Run I, (b) run II, (c) run III, (d) run IV. Compare with Fig. 4.
m that for the smallest Ah, the leading crest is almost straight across the channel, while for Ah>1 cm there is a significant phase shift (Fig. 4). Also, as expected, the ce- lerity of the wave increases with increasing amplitude, i.e., for increasing Ah.
V. NUMERICAL RESULTS
The numerical model is used to compare with experi- mental data from four different runs, referred to here as runs I-IV. With the exception of the amplitudes of the initial disturbances, the parameters are the same for all the runs, and are listed in Table I. The initial disturbance in the numerical solution is chosen to simulate that of the experiments, i.e., a rectangular-shaped depression of the interface at the left (upstream) end of the channel with no associated flow velocity. The disturbance has no transverse variations and the sharp gradients are smoothed out by a tanh function.
In Fig. 5 a contour plot of the solution for r~ is given for all four runs at t=65 set, which is approximately the time at which the leading disturbance propagates past the stations at which the time series are taken (see below). In all four runs, the leading disturbance is a Kelvin wave depression of the interface, followed by a tail of Poincare waves. In run I very little nonlinear influence is visible. In the other three runs the effects of nonlinear evolution are clearly visible, with the crest of the leading wave curving backwards and the steepness and the speed of the waves increasing with increasing strength of the nonlinearities.
1406 Phys. Fluids A, Vol. 5, No. 6, June 1993
Also of interest is the appearance of a second wave behind the first, this second wave curving even further backwards and becoming stronger as the nonlinear effects become stronger.
A. Direct comparison of time series data
To compare directly with the experimental data, nu- merical and experimental time series of r] taken at 5 m down the channel and at four stations across the channel, y=2, y=50, y= 125, and y=198 cm, referred to here as stations l-4, respectively, are compared. In Figs. 6-9 the numerical and experimental time series at the four stations are compared for all four runs. The time delay between the start of the data acquisition and the release of the initial disturbance in the experiments was not measured. Conse- quently, no time reference is available for the time series measurements, and a reference point in time had to be chosen for the numerical solutions. The reference point for the numerical solution is chosen such that the phase of the leading wave at station 1 (right-hand wall) matches that of the experimental wave for each of the runs.
Looking at the time series we see quite good agreement with the experimental data, particularly for runs II and III. The reason for the poorer agreement for run I may be the relatively small amplitudes of the waves, with the accuracy of the experimental measurements becoming an important factor, as can be clearly seen by the relatively small signal- to-noise ratio in Fig. 6. On the other hand, the reason for
Renouard, Tomasson, and Melville 1406

Time [s]
b-9
(b)
,‘. 1.1.. , , . . ., . . ., . . , .
030 0.10 0.00
-0.10
-030
-0.30
-0.40
-050
-0.60 0 25 SO 75
‘Pi;: [s] 125 150 175 7.00
FIG. 6. The numerical and experimental time series for run I. (a) Station 1 (x=5 m,y=2 cm), (b) station 2 (x=5 m,y=50 cm), (c) station 3 (x=5 m, y= 125 cm), and (d) station 4 (x=5 m, y= 198 cm).
the poorer agreement for run IV may be the large ampli- tudes of the waves and consequently stronger nonlinearity, recalling that the Boussinesq equations are based on the assumption of weak nonlinearity. For these reasons, the following discussion will be largely based on runs II and III, i.e., the moderately nonlinear runs.
In general, the agreement for these two runs is very good, given the approximate nature of the equations and
their numerical solutions. The agreement in the phase of the leading wave at all stations is very good, meaning that the backward curvature of the crest, which is clearly visible in the time series, is well predicted by the numerical solu- tions. The good agreement in the tail of the leading wave is also striking, with the phase and frequency of the oscilla- tions generally agreeing very well. Detailed analysis by To- masson and Melville’ of similar trailing oscillations in the
1407 Phys. Fluids A, Vol. 5, No. 0, June 1993 Renouard, Tomasson, and Melville 1407

(a)
Time [s] 0.4
0.2
0.0
g :: (b) U F -0.6
-0.8
-1.0
-1.2
Time [s] 0.4
0.2
0.0
z -0.4 -0.2
- F -0.6
-0.8
-1.0
-1.2
Time [s] 0.4
0.2
0.0
3 -0.2 -0.4 @I
- F -0.6
-0.8
-1.0
-1.2 0 50 75 T&t 125 lS0 17s 200
[s]
FIG. 7. The numerical and experimental time series for run II. (a) Station 1, (b) station 2, (c) station 3, and (d) station 4.
single-layer case have shown that they are partially due to resonantly generated PoincarC waves. The poorer agree- ment in the amplitude of the disturbances, especially in the stronger nonlinear cases, is most likely due to the neglect of frictional effects in the numerical model, with the numer- ical solutions consistently overpredicting the amplitudes.
B. Origin of the second wave
It is of some interest to try to understand the origin of the second wave appearing behind the leading wave. The
1408 Phys. Fluids A, Vol. 5, No. 6, June 1993
wave is quite clear both in the contour plots of the solution for rl and in the time series of v. To investigate this, the numerical model was run with exactly the same parame- tersas in run III above, with the exception that the initial disturbance was moved away from the upstream end wall of the channel, as is shown in Fig. 10. Figure 11 shows a contour plot of the solution for 7 at t=65 set [to be com- pared with Fig. 5(c) for run III], and Fig. 12 shows the time series of q at station 1, corresponding to Fig. 8(a) for run III. It is clear from these figures that the origin of the
Renouard, Tomasson, and Melville 1408

F
(a)
V -lJO~.‘.““““““‘.““..“....‘....““.~
0 25 50 7s TiAI 125 1so 17s
[s] 050 0.25
0.00
-03 -0.50 (b) -0.75
-1.00
-1LZ
-150 0 so 7s
TiAE [s] 12s 150 17s 7m
FIO. 8. The numerical and experimental time series for run III. (a) Station 1, (b) station 2, (c) station 3, and (d) station 4.
second wave is the adjustment and reflection of the initial disturbance from the upstream end wall. With the initial disturbance moved away from the upstream wall, the so- lution shows two well separated, but very similar waves, the second one resulting from the disturbance that travels down the channel to the left until reaching the upstream end wall and reflecting to follow the leading disturbance along the channel to the right. However, the second wave is contaminated by Poincare waves generated by the lead-
ing wave, and thus has a slightly different structure. Also note that the leading wave is of smaller amplitude than before.
VI. DISCUSSION
In the experiments presented here the ratio of the char- acteristic wavelength to the Rossby radius was in the range [O. 11,1.05] so that the rotation ranged from weak to strong.
1409 Phys. Fluids A, Vol. 5, No. 6, June 1993 Renouard, Tomasson, and Melville 1409
0.5 0.5
0.0 0.0
-0.S -0.S
-1.0 -1.0
-1.9 -1.9
-20 -20 0 0 so 50 75 75
T&I [s] T&I [s] 121 121 150 150 17s 17s zoo zoo
0-s
0.0
-0.5
-1.0
-1.5
-2.0 0 50 75
T&E [s] 12.5 1so 17s 200
-2.0 0 25 50 75 T&E 125 150 17s 200
[s] 0.5
0.0
E
-0.5
-1.0 F
-200~I”“‘..““....“...’ *... “..““..I 25 50 7s
T&F [s] 125 1so 17s 200
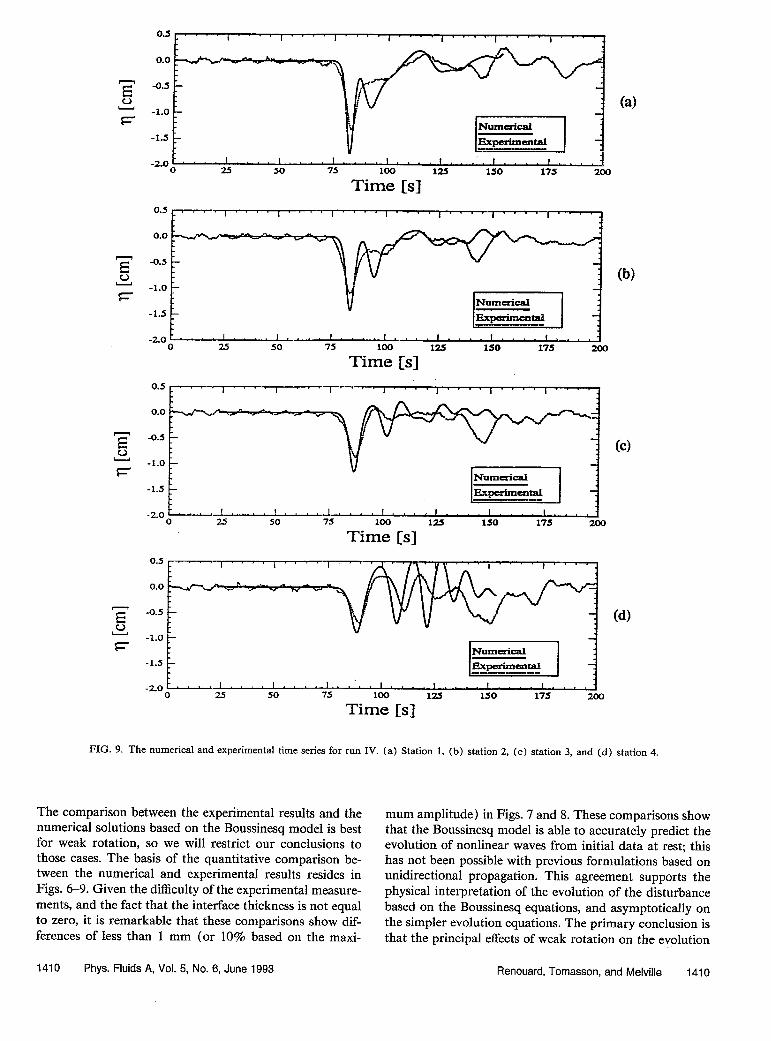
FIG. 9. The numerical and experimental time series for run IV. (a) Station 1, (b) station 2, (c) station 3, and (d) station 4.
The comparison between the experimental results and the numerical solutions based on the Boussinesq model is best
mum amplitude) in Figs. 7 and 8. These comparisons show
for weak rotation, so we will restrict our conclusions to that the Boussinesq model is able to accurately predict the
those cases. The basis of the quantitative comparison be- evolution of nonlinear waves from initial data at rest; this has not been possible with previous formulations based on
tween the numerical and experimental results resides in Figs. 6-9. Given the difficulty of the experimental measure-
unidirectional propagation. This agreement supports the physical interpretation of the evolution of the disturbance
ments, and the fact that the interface thickness is not equal to zero, it is remarkable that these comparisons show dif-
based on the Boussinesq equations, and asymptotically on
ferences of less than 1 mm (or 10% based on the maxi- the simpler evolution equations. The primary conclusion is that the principal effects of weak rotation on the evolution
1410 Phys. Fluids A, Vol. 5, No. 6, June 1993 Renouard, Tomasson, and Melville 1410

0.55 l-l I. 0.0
1 I
-0.5 -
-1.0 -
=l.s - L
-2.0 """'I " "'I ." .'. " " 0 2.5 SO
x [En,
100 125 II-J ICC0
FIG. 10. The initial disturbance for 7 used to investigate the origin of the second wave. The upstream end of the channel is at x=0.
of weakly nonlinear long waves, which were first observed experimentally,2*1 and subsequently numerically,5 are due to the resonant generation of PoincarC waves as initially described by Melville et al. ,6 and more recently by Tomas- son and Melville.’ The experimental results also support the use of the Boussinesq equations for studies of geo- strophic adjustment.
A secondary conclusion of the experimental and nu- merical results is that the second wave observed in many experiments may be due to the reflection of the leading wave which propagates toward the upstream end of the channel.
200
150
-7 2 100
h
JO
0 325 375 126 475 525 575 025
L L-1
FIG. 11. A contour plot of the numerical solution of Eqs. (31)-(33) for 7 at t=65 set from the run with the initial disturbance separated from the upstream end wall.
::2: 0 25 50 75 TiAz [s]
12.5 150 175 203
FIG. 12. Time series of 77 from the numerical solution for the initial disturbance ieparated from the upstream end wall.
ACKNOWLEDGMENTS
The authors are extremely grateful to X. Zhang, who helped perform the experiments, and did the initial data processing. They also wish to thank G. Chabert d’Hibres for his support. DPR thanks Professors J. P. Germain and C. C. Mei for many interesting comments on these exper- imental results.
This work was supported both by C.N.R.S. and N.S.F. (International Programs) as part of a joint program, and by O.N.R. (Coastal Science).
‘D. Renouard, G. Chabert d’Hieres, and X. Zhang, “An experimental study of strongly nonlinear waves in a rotating fluid,” I. Fluid Mach. 177, 381 (1987).
‘T. Maxworthy, “Experiments on solitary internal Kelvin waves,” J. Fluid Mech. 129, 362 ( 1983).
‘R. Grimshaw, “Evolution equations for weakly nonlinear, long internal waves,” Stud. Appl. Math. 73, 1 (1985).
4J. P. Germain and D. Renouard, “On permanent nonlinear waves in a rotating fluid,” Fluid Dyn. Res. 7, 263 ( 1991).
‘C Katsis and T. R. Akylas, “Solitary internal waves in a rotating chan- nel: A numerical study,” Phys. Fluids 30, 297 (1987).
6W. K. Melville, G. G. Tomasson, and D. P. Renouard, “On the stability of Kelvin waves,” J. Fluid Mech. 206, 1 ( 1989).
7R. Grimshaw and W. K. Melville, “On the derivation of the modified Kadomstev-Petviashvili equation,” Stud. Appl. Math. 80, 183 (1989).
*R. Grimshaw and S. Tang, ‘The rotation modified Kadomstev- Petviashvili equation: An analytical and numerical study,” Stud. Appl. Math. 83, 223 ( 1990).
9G. G. Tomasson and W. K. Melville, “Geostrophic adjustment in a channel: Nonlinear and dispersive effects,” J. Fluid Mech. 241, 23 (1992).
“G G Tomasson, “Nonlinear waves in a channel; three dimensional and . . rotational effects,” Sc.D. thesis, Massachusetts Institute of Technology, 1991.
“C! G Koop and 0. Butler, “An investigation of internal solitary waves . . in a two-fluid system,” J. Fluid Mech. 112, 225 ( 1981).
1411 Phys. Fluids A, Vol. 5, No. 6, June 1993 Renbuard, Tomasson, and Melville 1411