An Expansion of a Global Data Set on Educational Quality · An Expansion of a Global Data Set on...
68
Policy Research Working Paper 6536 An Expansion of a Global Data Set on Educational Quality A Focus on Achievement in Developing Countries Noam Angrist Harry Anthony Patrinos Martin Schlotter e World Bank Human Development Network Education Unit July 2013 WPS6536 Public Disclosure Authorized Public Disclosure Authorized Public Disclosure Authorized Public Disclosure Authorized Public Disclosure Authorized Public Disclosure Authorized Public Disclosure Authorized Public Disclosure Authorized
-
Upload
truonglien -
Category
Documents
-
view
226 -
download
0
Transcript of An Expansion of a Global Data Set on Educational Quality · An Expansion of a Global Data Set on...

Policy Research Working Paper 6536
An Expansion of a Global Data Set on Educational Quality
A Focus on Achievement in Developing Countries
Noam AngristHarry Anthony Patrinos
Martin Schlotter
The World BankHuman Development NetworkEducation UnitJuly 2013
WPS6536P
ublic
Dis
clos
ure
Aut
horiz
edP
ublic
Dis
clos
ure
Aut
horiz
edP
ublic
Dis
clos
ure
Aut
horiz
edP
ublic
Dis
clos
ure
Aut
horiz
edP
ublic
Dis
clos
ure
Aut
horiz
edP
ublic
Dis
clos
ure
Aut
horiz
edP
ublic
Dis
clos
ure
Aut
horiz
edP
ublic
Dis
clos
ure
Aut
horiz
ed

Produced by the Research Support Team
Abstract
The Policy Research Working Paper Series disseminates the findings of work in progress to encourage the exchange of ideas about development issues. An objective of the series is to get the findings out quickly, even if the presentations are less than fully polished. The papers carry the names of the authors and should be cited accordingly. The findings, interpretations, and conclusions expressed in this paper are entirely those of the authors. They do not necessarily represent the views of the International Bank for Reconstruction and Development/World Bank and its affiliated organizations, or those of the Executive Directors of the World Bank or the governments they represent.
Policy Research Working Paper 6536
This paper assembles a panel data set which measures cognitive achievement for 128 countries around the world from 1965 to 2010 in 5-year intervals. This data set is constructed from international achievement tests, such as the Programme for International Student Assessment and the Trends in International Mathematics and Science Study, which have become increasingly available since the late 1990s. The authors link these international assessments to regional ones, such as the South and Eastern African Consortium for Monitoring of Educational Quality, the Programme d’Analyse des Systemes Educatifs de la Confemen, and the Laboratorio Latinoamericano de Evaluacion de la Calidad de
This paper is a product of the Education Unit, Human Development Network. It is part of a larger effort by the World Bank to provide open access to its research and make a contribution to development policy discussions around the world. Policy Research Working Papers are also posted on the Web at http://econ.worldbank.org. The authors may be contacted at [email protected].
la Educacion, in order to produce one of the first globally comparable datasets on student achievement. In particular, this dataset is one of the first to include achievement in developing countries, including 29 African countries and 19 Latin American countries. This data set is an extension of an earlier data set constructed by Altinok and Murseli (2007). The authors provide a first attempt at using this dataset to identify causal factors that boost achievement. The results show that key drivers of global achievement are civil rights and economic freedom across all countries, and democracy and economic freedom in a subset of African and Latin American countries.

1""
An Expansion of a Global Data Set on Educational Quality: A Focus on Achievement in Developing Countries
Noam Angrist, Harry Anthony Patrinos, and Martin Schlotter*
August 13th, 2013
Abstract
In this paper, we assemble a panel data set which measures cognitive achievement for 128 countries around the world from 1965 to 2010 in 5-year intervals. This data set is constructed from international achievement tests, such as PISA and TIMMS, which have become increasingly available since the late 1990s. We link these international assessments to regional ones such as SACMEQ, PASEC and LLECE in order to produce one of the first globally comparable datasets on student achievement. In particular, our dataset is one of the first to include achievement in developing countries, including 29 African countries and 19 Latin American countries. This data set is an extension of an earlier data set constructed by Altinok and Murseli (2007). We provide a first attempt at using this dataset to identify causal factors that boost achievement. Our results show that key drivers of global achievement are civil rights and economic freedom across all countries, and democracy and economic freedom in a subset of African and Latin American countries.
JEL Classifications:" I2, J24, O15
Keywords: Quality, Education, International, Achievement, PISA, TIMSS
* The authors are associated with the World Bank, the University of Munich, and the Massachusetts Institute of Technology. The views expressed here are those of the authors and should not be attributed to the World Bank Group or to the author’s institutions.
2""
1. Introduction
A country’s education level is of huge importance to its economic success. Indeed, the economic
literature suggests that differences in human capital endowments among countries are largely
responsible for economic development gaps observed between industrialized nations and
developing countries. For a long time, most authors explained growth differences using
quantitative indicators such as years of schooling or enrollment rates in primary and secondary
schools (Barro 1991; Mankiw et al. 1992). However, recent evidence has shown a quite different
pattern: It is not the time spent in school that matters most, but rather what is effectively learned.
Thus, qualitative skills acquired during schooling play a decisive role in influencing a country’s
growth (Hanushek and Woessmann 2008).
This new insight comes at the same time as a large increase in availability of international
student achievement tests. These tests, carried out by institutions such as the OECD and the
International Association for the Evaluation of Educational Achievement (IEA), measure student
cognitive skills around the world. Several econometric studies show that qualitative indicators
measured by these international achievement tests explain growth patterns significantly more
than quantitative indicators, such as school enrollment (Hanushek and Woessmann 2008).
Moreover, recent analyses reveal a direct and persistent association between cognitive skills and
economic growth even controlling for unobserved country differences. Indeed, Hanushek and
Woessmann (2009a) use an instrumental variables methodology to demonstrate a causal chain
between a nation’s stock of cognitive skills and its economic growth.
This evidence motivates the identification of factors that enhance the stock of cognitive skills - a
key input in driving country growth. The most common tool in such analyses is the estimation of
education production functions which include a host of input factors, such as individual
characteristics, family background, school inputs (e.g. class size), and systemic elements (e.g.
accountability). These input factors drive an output, for example, educational success. In our
case, educational success is measured by the stock of cognitive skills (Hanushek 1979).
Some of the more recent economic literature makes an attempt to examine the effect of these
input factors on educational outcomes. While results from these studies vary, systemic effects
seem to matter hugely: Several studies, mostly using data from PISA and TIMSS, reveal large

3""
and positive effects of system elements on cognitive skills. Some of these key system elements
include increased school autonomy (Fuchs and Woessmann 2007), effective accountability
systems (Juerges et al. 2005), less stratified schooling systems (Hanushek and Woessmann 2006)
and competition between privately and publicly operated schools (West and Woesmann 2010).
These insights provide a first hint of successful education policies. Yet, the existing evidence has
several shortcomings, calling these policy implications into question.
The biggest shortcoming is a lack of consistent and comparable data on education quality across
countries, across tests and over time. In particular, many studies have relied on cross-country
comparisons, which ignore how educational systems vary over time. Studies have further relied
on the fact that international achievement tests are highly correlated (Rindermann, Heiner and
Stephen, 2009). While it is true that international achievement tests such as PISA and TIMMS
produce similar results, it is important to adjust for differences in their rigor and scaling. Finally,
much of the current literature relies only on international achievement tests, which often do not
include developing countries. Thus the implications of these studies are limited, and ignore those
countries that demand the most educational reform.
In this paper, we build on an approach taken by Altinok and Murseli (2007) that addresses many
of these limitations. First, we employ a novel methodology that allows us to include developing
countries by making regional assessments comparable to international ones. Many developing
countries do not participate in international tests such as PISA and TIMMS. However, they do
participate in regional assessments, which if made comparable to international assessments,
would provide insight into achievement in developing regions. For example, many Latin
American countries participate in the UNESCO Laboratorio Latinoamericano para la Evaluación
de la Calidad de la Educación (LLECE) and many African countries participate in the South and
Eastern African Consortium for Monitoring Educational Quality (SACMEQ).
Second, we link different tests by fixing them to the cognitive performance of the United States.
This approach allows us to incorporate a time dimension into our analysis, since the United
States has participated in almost all international assessments since their inception. Thus, the
U.S. provides a good anchor point and enables us to generate a uniform database of international
achievement.

4""
In particular, we develop a massive database consisting of 128 countries, over 40 of which are
located in the developing world. This database further captures test scores from 1965-2010 in
five-year steps. Our main approach is to extend a data set created by Altinok and Murseli (2007)
that makes test scores comparable across various achievement tests. To this end, we link regional
tests to international ones by using countries that participated in both as reference points. Next,
we link international tests by using the United States, which has participated in each for the past
half century, as an anchor. Finally, we use the United States National Assessment of Education
Progress (NAEP) to standardize test scores over time. The database we ultimately produce is an
extension of the Altinok and Murseli (2007) database using data from the 2009 PISA survey, and
employs pieces from methodologies developed by Altinok and Murseli (2007) as well as
Hanusheck and Kimko (2000).
As a next step, we use our database to confirm the insight which motivated this paper: Although
we know that education leads to country growth, increased school enrollments have not
necessarily produced greater learning outcomes (Hanusheck and Woessman 2008). Since we
ultimately care about country growth, the lack of impact of increased enrollment rates on
learning is concerning.
Figures 1.0 and 1.1 use our data set to show that, on average, higher rates of schooling align with
higher tests score. However, in recent years test scores have stagnated, even as the “no
schooling” rate has continued to plummet. In some countries, test scores have even dropped.
Figure 1.0: Average no schooling rate scatter plot (1965-2010)
Note: Data comes from Barro lee 2001

5""
Figure 1.1: Average adjusted test scores scatter plot (1965-2010)
Thus, our data confirms that increased schooling is not synonymous with increased educational
achievement, prompting an exploration of what does actually produce better learning outcomes.
To this end, we extend the Altinok and Murseli (2007) dataset as well as make a first attempt to
use such an internationally comparable dataset to answer this question. We include a host of
potential explanatory variables, namely governance, to draw inferences about educational inputs
that result in the most effective educational systems. Our findings have implications for
policymakers aiming to affect country growth through educational channels.
The paper is structured as follows: In section 2 we explain the methods we use to build our test
score database, focusing on advantages and possible shortcomings. Section 3 provides
descriptive results of our database and overall trends. Section 4 describes the robustness of our
adjusted test score database. Section 5 presents an application of this data set and describes the
different econometric methods we use in order to estimate the association between tests scores
and explanatory factors. Section 6 includes results from our causal analysis and application of
this data set. Section 7 concludes.
2. Methodological Considerations
While far from perfect, outcomes of international achievement tests are useful measures of
educational quality. Among several advantages, international achievement tests allow us to
compare achievement gains across countries and thus identify key factors that might be
associated with country-by-country variation (Hanushek and Woessmann 2010). Several studies
have exploited this unique feature in order to study determinants of achievement such as school

6""
autonomy, accountability systems, tracking or the privately operated share of an education
system (Hanushek and Kimko, 2000; Barro and Lee, 2001; Hanushek and Woessman, 2006). As
an example, high levels of school autonomy and competition between publicly and privately
operated education systems characterize the highest ranked countries on international
assessments. Thus, policy reforms favoring these systemic features seem to boost achievement.
Yet, it might be premature to draw conclusions from simple cross-sectional comparisons of
countries for two main reasons. First, it is likely that time-varying factors bias these regressions.
Second, it is possible that these factors are subject to omitted variable bias and are therefore not
entirely causal; For example, a third factor, such as governance indicators, might be driving
school autonomy as well as achievement. If we exclude this factor, it seems as though school
autonomy is driving higher test scores, where in fact governance indicators are driving both and
is our main input of interest.
Beyond these econometric and methodological shortcomings, even if associations between
systemic features and cognitive skill were causal, existing results are only valid for countries
included in specific samples. Since mostly industrialized nations participate in international
achievement tests, these findings are significantly less relevant for developing countries. This is
an issue since these poorly performing countries demand the most rigorous and effective
interventions. In particular, there exist many unanswered research questions pertaining to
education quality in developing countries. For example, while a large gap in economic growth
between the industrialized world and developing countries is evident, it is not apriori clear
whether this is due to differences in human capital endowments, policies or institutions. Such
underlying differences in a country’s educational performance have important implications. One
might think that education systems are tremendously underdeveloped in such countries. If this is
the case, they require fundamental support in the form of basic resources and infrastructure
rather than school autonomy, accountability or tracking.
In order to address these issues, we build on studies conducted by Hanushek and Woessmann
(2009b) as well as Altinok and Murseli (2007) in order to link regional assessments to
international assessments. Indeed, while many developing countries do not participate in
international tests, Latin America and Africa have at least participated in regional achievement
tests carried out during the 1990s and recent years. These tests include the UNESCO Laboratorio

7""
Latinoamericano de Evaluacion de la Calidad de la Educación (LLECE) and the Segundo
Estudio Regional Comparativo y Explicativo (SERCE), which test students in third, fourth and
sixth grades in a set of Latin American and Caribbean countries. Two tests with a focus on
Africa include the South and Eastern African Consortium for Monitoring of Educational Quality
(SACMEQ) and the Programme d’Analyse des Systemes Educatifs de la Confemen (PASEC).
Specifically, SACMEQ conducted two surveys for South and Eastern African countries for third
and fourth grade, and PASEC carried out two waves of testing for second and fifth graders in
Francophone Africa.
We utilize all of these tests by making the achievement scores comparable. To this end, we link
the results of regional tests – LLECE, SERCE, PASEC and SACMEQ – to international tests
such as PISA, TIMMS and PIRLS. As mentioned earlier, in order to normalize achievement test
results across tests and time we mainly build on the previous work of Altinok and Murseli (2007)
and their attempt to build an international database on human capital quality. In particular we
extend their results from 2003 until 2010. In addition we refer to Hanushek and Kimko (2000)
who tried to construct a similarly comparable database across tests, countries and time.
Our approach first builds on Hanushek and Kimko (2000). We exploit the availability of a
United States test score in all international achievement surveys conducted since the early 1960s.
Therefore, we can express each country’s performance in relation to the US for a given test in a
given year. Thus, US tests scores are a reference point, making country achievement comparable
across tests. Furthermore, the national testing regime of the US allows for a comparison of test
results over time: The almost biannually conducted National Assessment of Educational Progress
(NAEP) yields comparable results of US-student achievement (in different subjects and grades)
over time. Connecting these results to the most adjacent US score in the international
achievement tests delivers comparable US results over time. This adjusted score can then be
related to the results of all countries that participated in international achievement tests.
While this is a valid methodology, such an approach has limitations. One particular limitation is
that this approach ignores all surveys without United States test score availability, including
those regional tests mentioned above. To deal with this, Altinok and Murseli (2007) use a new
approach that exploits the appearance of a few countries in both international and regional
8""
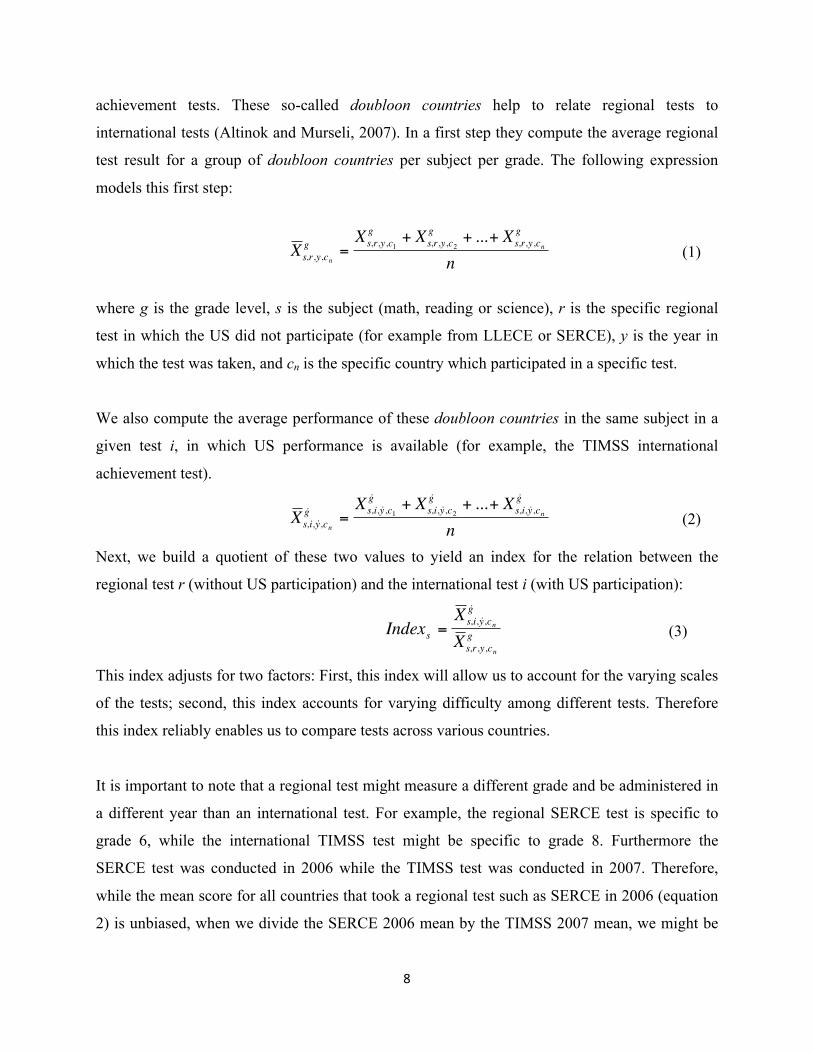
achievement tests. These so-called doubloon countries help to relate regional tests to
international tests (Altinok and Murseli, 2007). In a first step they compute the average regional
test result for a group of doubloon countries per subject per grade. The following expression
models this first step:
€
X s,r,y,cn
g =Xs,r,y,c1
g + Xs,r,y,c2g + ...+ Xs,r,y,cn
g
n (1)
where g is the grade level, s is the subject (math, reading or science), r is the specific regional
test in which the US did not participate (for example from LLECE or SERCE), y is the year in
which the test was taken, and cn is the specific country which participated in a specific test.
We also compute the average performance of these doubloon countries in the same subject in a
given test i, in which US performance is available (for example, the TIMSS international
achievement test).
€
X s,i, ˙ y ,cn
˙ g =Xs,i, ˙ y ,c1
˙ g + Xs,i, ˙ y ,c2
˙ g + ...+ Xs,i, ˙ y ,cn
˙ g
n (2)
Next, we build a quotient of these two values to yield an index for the relation between the
regional test r (without US participation) and the international test i (with US participation):
€
Indexs =X s,i, ˙ y ,cn
˙ g
X s,r,y,cn
g """ " " """"""""""""""(3)
This index adjusts for two factors: First, this index will allow us to account for the varying scales
of the tests; second, this index accounts for varying difficulty among different tests. Therefore
this index reliably enables us to compare tests across various countries.
It is important to note that a regional test might measure a different grade and be administered in
a different year than an international test. For example, the regional SERCE test is specific to
grade 6, while the international TIMSS test might be specific to grade 8. Furthermore the
SERCE test was conducted in 2006 while the TIMSS test was conducted in 2007. Therefore,
while the mean score for all countries that took a regional test such as SERCE in 2006 (equation
2) is unbiased, when we divide the SERCE 2006 mean by the TIMSS 2007 mean, we might be

9""
concerned about the integrity of the index. This potential bias, however, does not seriously affect
the outcome of our methodology for two important reasons. First, we use the index to translate
original scores; since the same index is used for all original scores, each score is transformed
equally. Second, it is unlikely that tests changed from year to year in a way that differentially
affected certain countries, thus eliminating the concern of a potential bias in our index. For
example, even if TIMSS 2007 was made more challenging as a result of 2006 SERCE test
scores, which is highly unlikely to begin with, this change should not impact Colombia more
than Bolivia. Thus, the index we produce can be a powerful and unbiased tool to link
international achievement tests with regional tests.
Finally, we multiply our index by the regional test scores for those countries who did not
participate in any test with a US comparison:
€
ˆ X s,i,y,cn
g = X s,r,y,cn
g × Indexs (4)
Thus a test score from a regional achievement test has been converted to a score that is
comparable to an international test result with US participation. These test scores allow the
inclusion of developing countries, which participate only in regional assessments, to be included
in our international achievement data set.
Next, to compare international assessments across countries we adjust achievement test scores in
relation to the US. To this end, we construct a similar index to the one above. We create a ratio
between US scores on the NAEP and on international achievement tests per subject in the most
adjacent year. We multiply by a factor of ten for scaling purposes.
"" " " " "
€
Indexs,y,US =Xs,NAEP, ˙ y ,US
˙ g
Xs,i,y,USg ×10 " " " """" """"(5)
We then multiply all raw and doubloon country test scores from equation (4) by our new index to
obtain test scores that are linked to the US and can be compared over time.
(6)
where z is an internationally comparable test score across tests, across countries and over time.
€
z = ˆ X s,i,y,cn
g × Indexs,y,US
10""
While this methodology generates comparable scores, like all other adjustment methods, this
method has its limitations. First, our transformation of regional scores into an internationally
comparable value is more accurate the more doubloon countries are available. If our Index relies
on just one doubloon country (just because it is the only country participating in both surveys), it
is quite ambitious to convert all other regional scores using this quotient.
Second, this approach refrains from adjusting a joint standard deviation over all tests. So,
although anchoring test scores allows us to match our results across surveys and over time, we
cannot say by exactly how much each country improved. For example, we might know that
country a outperforms country b by 20 adjusted points in year x, and that it has increased its
average test score level by about 40 adjusted points in year x+3. Now it outperforms country b
by 30 points. So, country a has done better in both years than country b and has also improved
over time. However, we cannot specify the scale of the improvement. Adjusted points do not
necessarily map one-to-one to any existing achievement scale and depend on which countries
participated in the survey as well as the contents of each test.
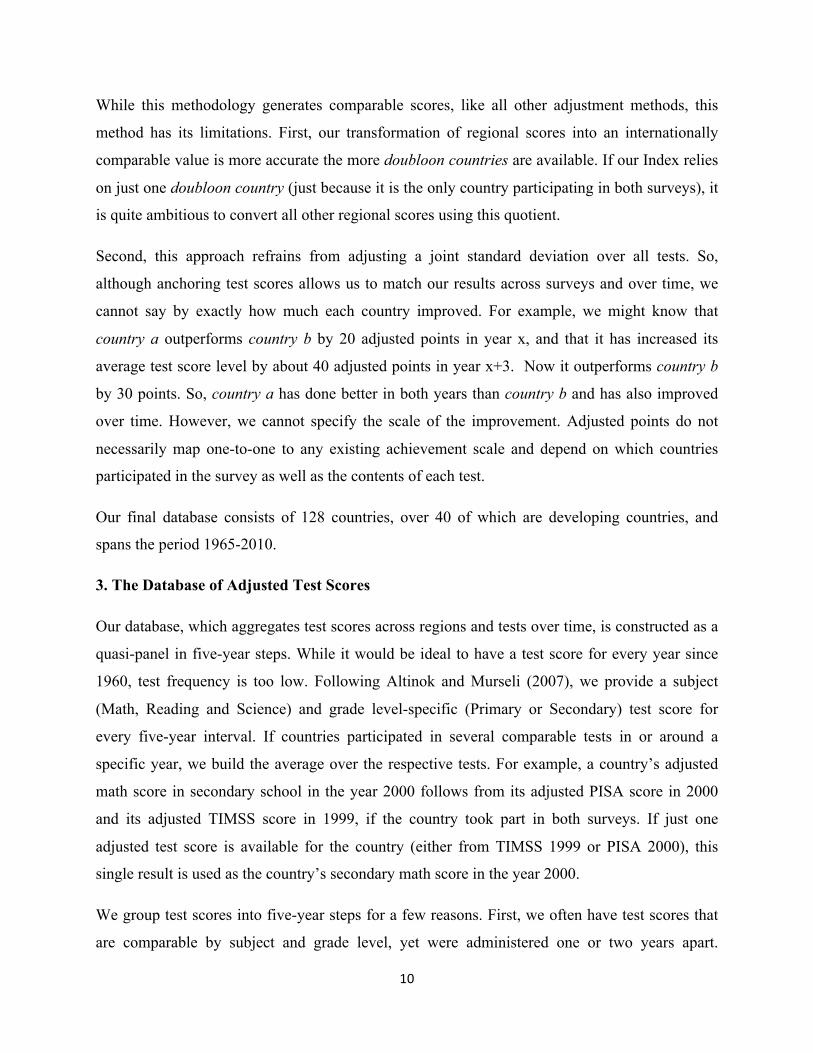
Our final database consists of 128 countries, over 40 of which are developing countries, and
spans the period 1965-2010.
3. The Database of Adjusted Test Scores
Our database, which aggregates test scores across regions and tests over time, is constructed as a
quasi-panel in five-year steps. While it would be ideal to have a test score for every year since
1960, test frequency is too low. Following Altinok and Murseli (2007), we provide a subject
(Math, Reading and Science) and grade level-specific (Primary or Secondary) test score for
every five-year interval. If countries participated in several comparable tests in or around a
specific year, we build the average over the respective tests. For example, a country’s adjusted
math score in secondary school in the year 2000 follows from its adjusted PISA score in 2000
and its adjusted TIMSS score in 1999, if the country took part in both surveys. If just one
adjusted test score is available for the country (either from TIMSS 1999 or PISA 2000), this
single result is used as the country’s secondary math score in the year 2000.
We group test scores into five-year steps for a few reasons. First, we often have test scores that
are comparable by subject and grade level, yet were administered one or two years apart.

11""
Therefore, unless we align our scores by year, we will not be able to linearly regress our
explanatory variables on our outcome variables. We therefore focus on years that can be
included in our analysis and group adjacent years into them. Second, there exist unequal
distributions of time where tests might not have been administered, and so five-year steps of data
allows us to maximize continuity of test scores between 1965-2010. Third, we need equal steps
since if we have a seven-year jump between test scores followed by a three year jump, then our
explanatory variables might explain a time gap in learning instead of specific determinants of
achievement. Indeed, we assume that four additional years of schooling will boost achievement.
One particular transformation to note occurs during our extension of the Altinok and Murseli
data from 2003 to 2010. Since we have data from 2003 and TIMSS/SERCE/PISA data from
2006 and 2007 we average these results and group them into the year 2005. Further, we group
our adjusted PISA 2009 scores into the year 2010 in order to be compatible with the remaining
adjusted test scores which occur in five-year steps.
Below, we highlight a few descriptive results on primary test scores in mathematics to showcase
our database. In particular, we stratify our results by region and income level in order to present
a coherent picture of overall achievement trends. Figure 2.0 and 2.1 describes test score
availability for primary math scores from 1985-2010 by region and income level, respectively.
Figure 2.0: Presence of primary math test scores by region (1985-2010)

12""
Figure 2.1: Presence of primary math test scores by income level (1985-2010)
The results from Figures 2.0 and 2.1 demonstrate that by creating an internationally comparable
test score database, we have managed to obtain coverage even for developing and low-income
countries, although data on these countries still remain scarcer than more developed countries.
Next we use primary math scores in our adjusted test score database to highlight achievement
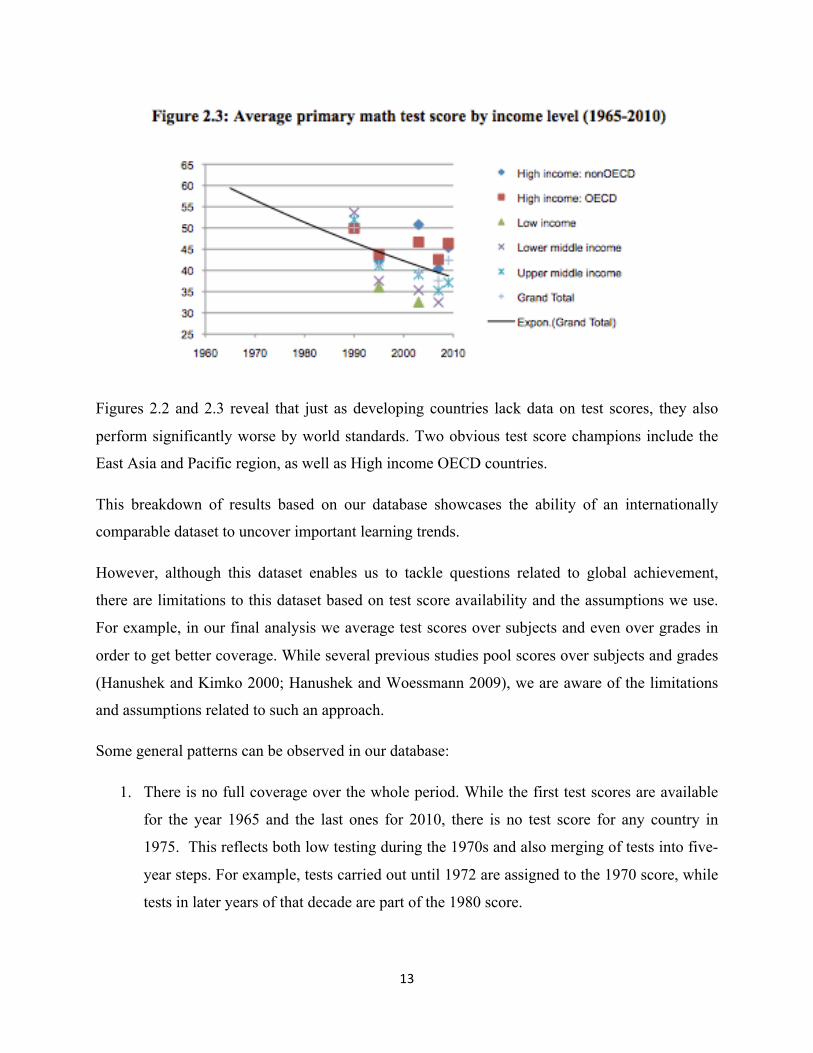
trends. Figures 2.2 and 2.3 showcase the average adjusted test score by region and income level,
respectively. We further include a metric for the average adjusted test score in each year to
determine which countries are performing well by world standards.
13""
Figures 2.2 and 2.3 reveal that just as developing countries lack data on test scores, they also
perform significantly worse by world standards. Two obvious test score champions include the
East Asia and Pacific region, as well as High income OECD countries.
This breakdown of results based on our database showcases the ability of an internationally
comparable dataset to uncover important learning trends.
However, although this dataset enables us to tackle questions related to global achievement,
there are limitations to this dataset based on test score availability and the assumptions we use.
For example, in our final analysis we average test scores over subjects and even over grades in
order to get better coverage. While several previous studies pool scores over subjects and grades
(Hanushek and Kimko 2000; Hanushek and Woessmann 2009), we are aware of the limitations
and assumptions related to such an approach.
Some general patterns can be observed in our database:
1. There is no full coverage over the whole period. While the first test scores are available
for the year 1965 and the last ones for 2010, there is no test score for any country in
1975. This reflects both low testing during the 1970s and also merging of tests into five-
year steps. For example, tests carried out until 1972 are assigned to the 1970 score, while
tests in later years of that decade are part of the 1980 score.

14""
2. Coverage differs by subject: While math test scores are already available for a set of
countries in the mid-1960s (by the IEA assessment First International Math Study
(FIMS)), reading and science results are not available until the 1970s (First International
Science Study (SISS) and First International Reading Study (FIRS)).
3. We have also different coverage by grade: Surveys that have assessed students in primary
school are much scarcer than assessments carried out in secondary school. There is, for
example, no primary math score for any country before the year 1995 (from TIMSS).
Similarly, the first reading score for primary school students only becomes available in
1990 (from the Second International Reading Study (SIRS).
4. There exist many gaps by subject. While the first reading assessment took place during
the early 1970s (FIRS), there is a 20-year vacancy until 1990 when the Second
international Reading Study (SIRS) was conducted. In math, there is also a fifteen-year
gap between the 1965 scores and the 1980 results.
5. Coverage by country and world regions differs considerably. In fact, African and Latin
American countries did not participate in any surveys until the 1990s, when regional tests
such as SACMEQ, PASEC and LLECE were first setup. Some pre-1990 test score
estimates exist for outlier countries (for example FIRS scores in Chile and Malawi from
1970 or SIMS scores in Swaziland and Nigeria from 1980), but no broad coverage exists
that could facilitate intra-regional comparisons or averaging of scores.
The facts described above can be studied in detail when looking at the graphs provided in the
Annex. We provide coverage by grade level (for primary school, see Figures A1-A5; for
secondary school see Figures B1-B5) for every country that has participated in any test from
1965 until 20101. We also show coverage if scores are averaged over different grade levels (see
Tables C1-C5).
The World Maps in Figure 1 and Figure 2 deliver an even more stylized overview. They show
countries by whether they are part of our database or not, i.e. have at least one adjusted test score
at any point in time in any subject at any grade or no test score at all (Figure 1). Moreover,
"""""""""""""""""""""""""""""""""""""""""""""""""""""""""""""1 Coverage by subject is available on request. The coverage between 2003 and 2010 (stemming from countries’ participation in PISA 2009, PISA 2006, TIMMS 2007, PIRLS 2006 and SERCE 2006) is reported in the graphs. The adjusted test scores of the Altinok and Murseli (2007) database, however, only covers the period until 2003 (PISA and TIMSS 2003 are the most recent assessment integrated in their overview).
15""
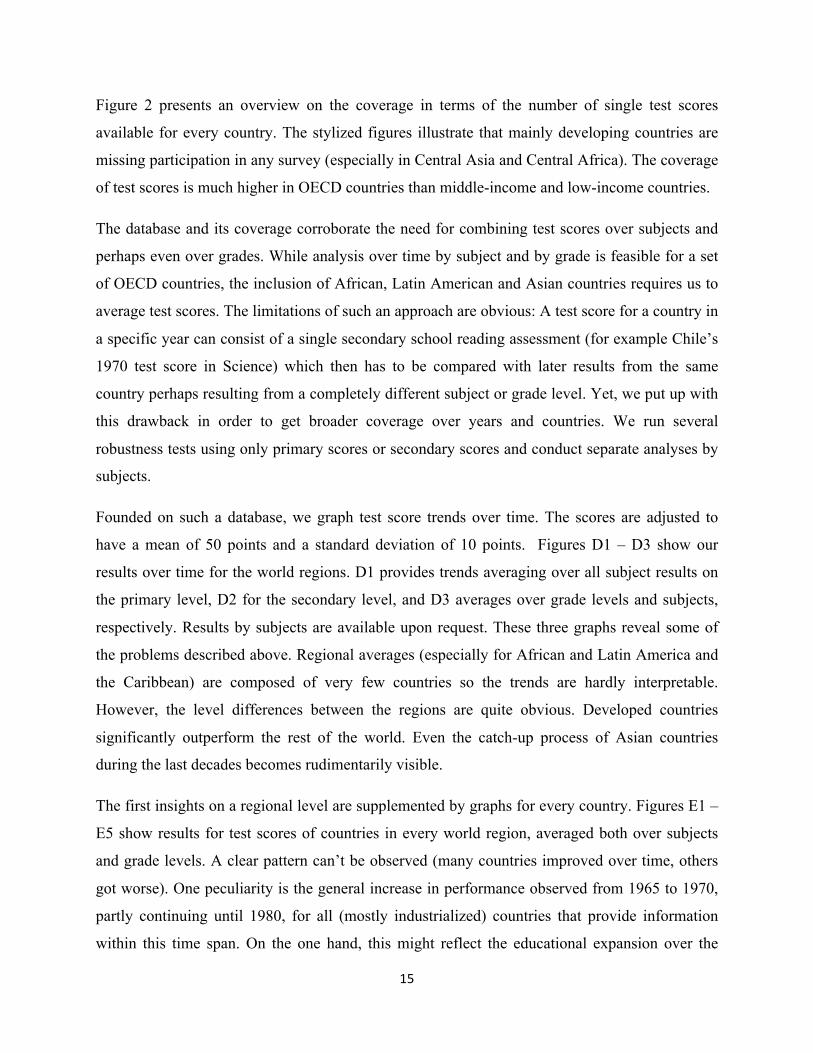
Figure 2 presents an overview on the coverage in terms of the number of single test scores
available for every country. The stylized figures illustrate that mainly developing countries are
missing participation in any survey (especially in Central Asia and Central Africa). The coverage
of test scores is much higher in OECD countries than middle-income and low-income countries.
The database and its coverage corroborate the need for combining test scores over subjects and
perhaps even over grades. While analysis over time by subject and by grade is feasible for a set
of OECD countries, the inclusion of African, Latin American and Asian countries requires us to
average test scores. The limitations of such an approach are obvious: A test score for a country in
a specific year can consist of a single secondary school reading assessment (for example Chile’s
1970 test score in Science) which then has to be compared with later results from the same
country perhaps resulting from a completely different subject or grade level. Yet, we put up with
this drawback in order to get broader coverage over years and countries. We run several
robustness tests using only primary scores or secondary scores and conduct separate analyses by
subjects.
Founded on such a database, we graph test score trends over time. The scores are adjusted to
have a mean of 50 points and a standard deviation of 10 points. Figures D1 – D3 show our
results over time for the world regions. D1 provides trends averaging over all subject results on
the primary level, D2 for the secondary level, and D3 averages over grade levels and subjects,
respectively. Results by subjects are available upon request. These three graphs reveal some of
the problems described above. Regional averages (especially for African and Latin America and
the Caribbean) are composed of very few countries so the trends are hardly interpretable.
However, the level differences between the regions are quite obvious. Developed countries
significantly outperform the rest of the world. Even the catch-up process of Asian countries
during the last decades becomes rudimentarily visible.
The first insights on a regional level are supplemented by graphs for every country. Figures E1 –
E5 show results for test scores of countries in every world region, averaged both over subjects
and grade levels. A clear pattern can’t be observed (many countries improved over time, others
got worse). One peculiarity is the general increase in performance observed from 1965 to 1970,
partly continuing until 1980, for all (mostly industrialized) countries that provide information
within this time span. On the one hand, this might reflect the educational expansion over the

16""
industrialized world during the 1960s. On the other hand, it could also be due to the fact that all
1965 scores consist of a single math test from the First International Math Study on secondary
level (FIMS), whereas the test score of 1970 is exclusively averaged over Science and Reading
scores (from FISS and SISS in 1970), even including scores from primary school Reading.
Longer lasting trends, especially for the Latin American and Caribbean countries require
inclusion of assessments carried out after 2003 (PISA 2009, TIMMS 2007, PISA 2006, PIRLS
2006 and especially SERCE).
It is important to note that given the scarcity of previous data on test scores, our extension of the
Altinok and Murseli (2007) data set is significant, especially by allowing for the inclusion of
more developing countries.
In addition, since there was an error in the 2006 PISA survey in the United States, and the United
States is our reference point for all countries, no reading scores since 2003 from any country
were internationally comparable until the inclusion of 2009 United States PISA reading scores in
our dataset.
Another key contribution of this data set is the inclusion of more doubloon countries, since two
new Latin American countries (Panama and Peru) participated in the 2009 PISA Survey. The
inclusion of these two new countries expands our sample of doubloon countries by 33 percent up
to 8 counties. Since we use the average test scores of all doubloon countries within a region to
calculate our test score adjustment index (described in section 2), this addition improves the
accuracy of our adjusted test scores for developing countries.
Finally, whereas Altinok and Museli (2007) include data from 2003 and in a recent updated
paper (Altinok and De Meuleester 2010) for 2007, we intentionally group our most recent test
score data into 5-year steps. We average 2003 and 2007 results into 2005 test scores, and group
2009 data into the year 2010. This approach allows us to align recent adjusted test scores to
previous test score intervals in the data set. As discussed in section 2, this generates the most
accurate dependent variable of educational outcomes since if our test score steps are uneven we
might pick up differences in years of schooling instead of determinants of achievement in our
final analysis.

17""
4. Robustness of Database
In order to get an idea of how accurate our adjusted test score database is, we first outline some
examples. While the Altinok/Murseli database just provides data until 2003, we extend the series
until 2009 including SERCE 2006, PISA 2006, TIMSS 2007 and PISA 2009 data. We use the
adjusting method described in Section 2 in order to predict PISA 2006 and TIMSS 2007 values
for those developing countries that have not participated in international achievement tests. In a
further step, we adjust these values in relation to the United States international achievement
scores. For predicting TIMSS 2007 scores, we use the two countries El Salvador and Colombia
as Doubloon Countries because they participated in both surveys (SERCE and TIMSS 2007).
For PISA 2006 we have four Doubloon Counties (Argentina, Brazil, Chile and Columbia). For
PISA 2009 we have eight Doubloon Countries (Argentina, Brazil, Chile, Colombia, Mexico,
Panama Peru, Uruguay). For TIMSS 2007 8th grade scores in math and science we use SERCE
values in 6th grade in math and science. For PISA values in math, reading and science we apply
the respective SERCE values from 6th grade. For 4th grade Science scores we do not have an
adequate SERCE value as Science is only tested in 6th grade in this study. We also do not have
predicted science values for Brazil and Chile in PISA 2006 or 2009 as those countries did not
participate in the SERCE science test.
For all doubloon countries we can conduct a robustness check by comparing predicted values
generated using the Altinok/Murseli methodology to their original TIMSS or PISA value. Such a
robustness check ensures that our methodology for standardizing test scores is valid. If our
predicted values align with the original PISA or TIMMS score for doubloon countries we can be
more confident that our predicted scores effectively predict unbiased standardized projections of
regional test scores for all countries.
Table 1.0 summarizes our comparison between original and predicted values. We see that
predicted scores in both reading and science always remain within 10 points from their original
TIMSS or PISA value. These differences account for less than one tenth of a standard deviation,
indicating that we have generated relatively accurate predicted scores. We have just one case
where the difference between the original value and the predicted one is higher than 20 points.
This difference exists for math scores in Columbia.

18""
The difference from our predicted and original scores ranges from 1-23 points for math and from
0-9 for reading and science. This shows a clear pattern that our index predicts reading and
science scores more accurately than math scores.
However, even a difference of 23 points for Chile in math - our largest recorded discrepancy -
constitutes just a fifth of a standard deviation taken for all country adjusted test scores. This
indicates that even our larger discrepancy in math is insignificant.
Most differences are much lower than our ranges indicate, with some differences netting zero,
which is the most accurate result. This holds true even for TIMSS where the adjustment Index is
based on just two countries (Colombia and El Salvador) which, as outlined before, usually
aggravates the computation of a precise exchange factor. This alleviates our concern that we can
only rely on indexes that use a large number of doubloon countries to produce reliable predicted
scores. Even our estimates, which use limited doubloon countries, produce reliable results.
However, we do benefit from having more doubloon countries overall in our dataset than the
original Altinok and Murseli dataset, which improves the general accuracy of our index.
An additional robustness check we conduct involves comparing projections for doubloon
countries that participate in both PISA and TIMMS achievement tests. Studies show that
achievement on international tests is highly correlated (Rindermann, Heiner and Stephen, 2009).
Therefore, by comparing projections for doubloon countries that have both PISA and TIMMS
scores, we can verify that our estimates are consistent across achievement tests.
The results from our robustness check are detailed in Table 1.0 and verify the reliability of our
predicted scores.

19""
Table 1.0: Original Test Scores vs. Adjusted Test Scores
Notes: Original shows the raw scores of the countries in PISA 2006, PISA 2009 and/or TIMSS 2007. Predicted is
the score that we would yield for the countries if we applied the Altinok/Murseli method.
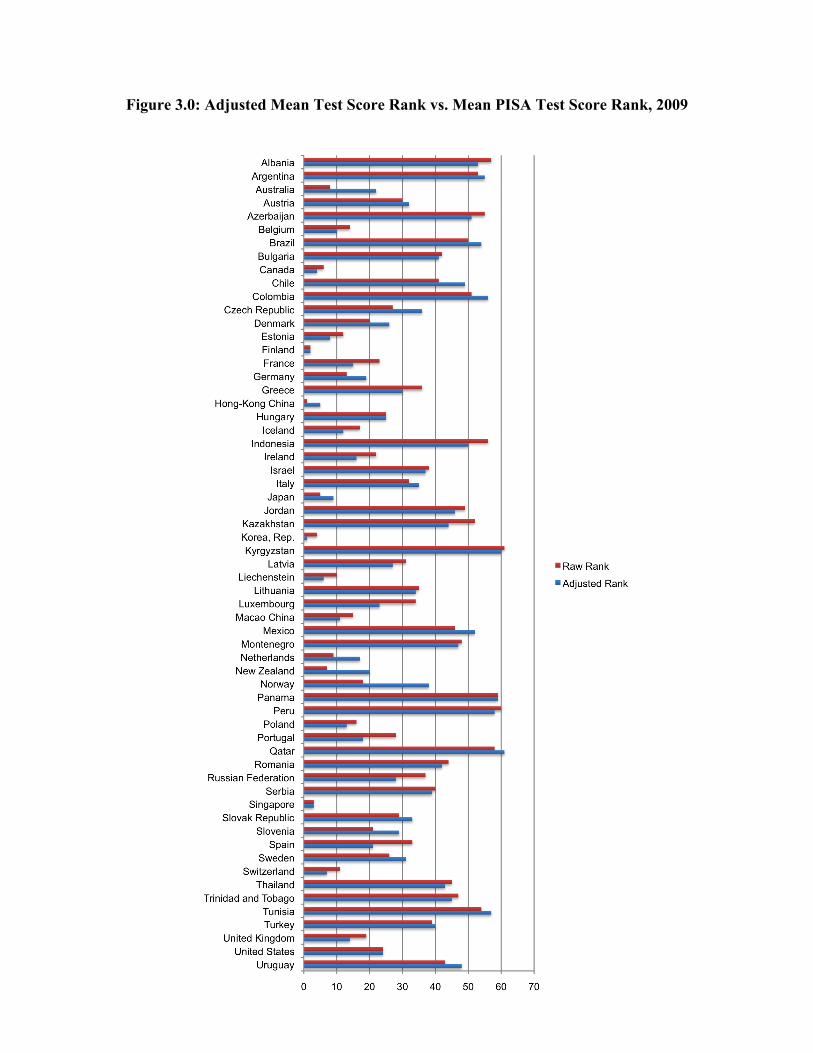
As an additional robustness check, we include descriptive data on country achievement as
measured by raw scores on the 2009 PISA. Our goal is to juxtapose raw scores from the 2009
PISA with our average mean score calculated from the Altinok/Murseli method. We see that our
adjusted test scores similarly rank those countries that perform best on the raw PISA scale,
validating our conversion method. Figure 3.0 details the relative rank of each country based on
their adjusted test scores and raw test scores. The average rank differential is around 3-5,
indicating that our adjusted test scores generally simulate the raw data.
20""
Figure 3.0: Adjusted Mean Test Score Rank vs. Mean PISA Test Score Rank, 2009
21""
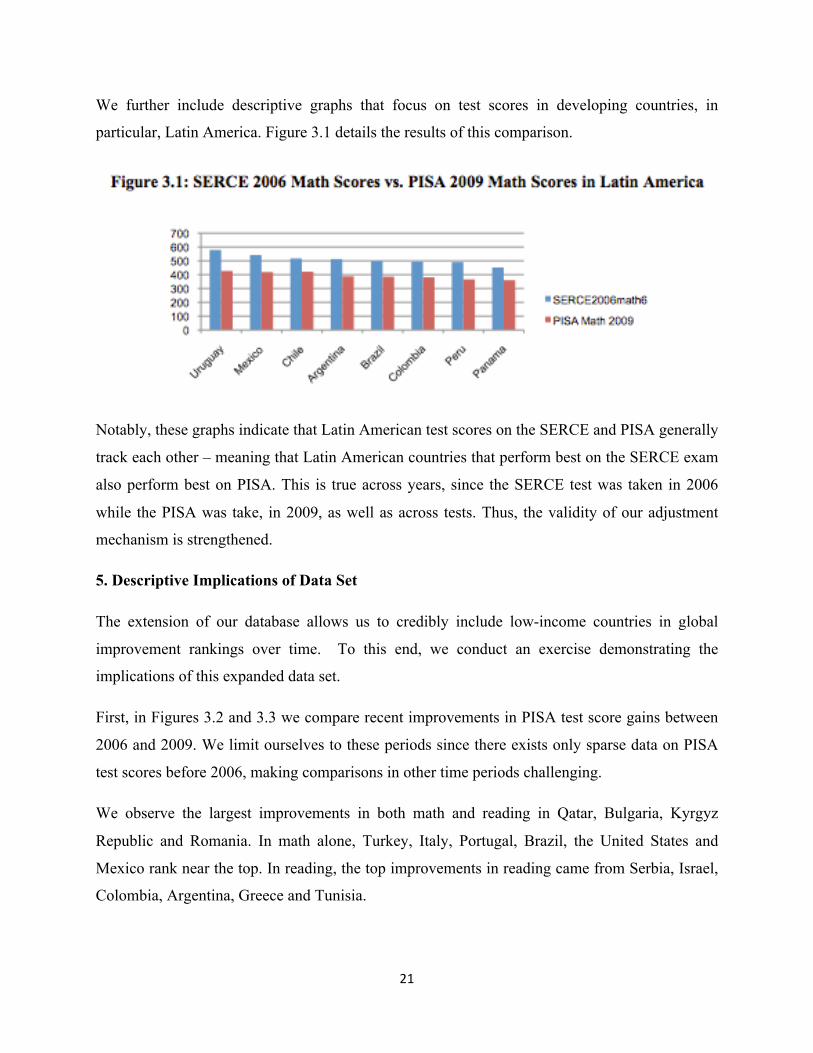
We further include descriptive graphs that focus on test scores in developing countries, in
particular, Latin America. Figure 3.1 details the results of this comparison.
Notably, these graphs indicate that Latin American test scores on the SERCE and PISA generally
track each other – meaning that Latin American countries that perform best on the SERCE exam
also perform best on PISA. This is true across years, since the SERCE test was taken in 2006
while the PISA was take, in 2009, as well as across tests. Thus, the validity of our adjustment
mechanism is strengthened.
5. Descriptive Implications of Data Set
The extension of our database allows us to credibly include low-income countries in global
improvement rankings over time. To this end, we conduct an exercise demonstrating the
implications of this expanded data set.
First, in Figures 3.2 and 3.3 we compare recent improvements in PISA test score gains between
2006 and 2009. We limit ourselves to these periods since there exists only sparse data on PISA
test scores before 2006, making comparisons in other time periods challenging.
We observe the largest improvements in both math and reading in Qatar, Bulgaria, Kyrgyz
Republic and Romania. In math alone, Turkey, Italy, Portugal, Brazil, the United States and
Mexico rank near the top. In reading, the top improvements in reading came from Serbia, Israel,
Colombia, Argentina, Greece and Tunisia.

22""
Figure 3.2: PISA Math Improvement (06-09) Figure 3.3: PISA Reading Improvement (06-09)

23""
Next, we compare test score gains using our expanded test score dataset in Figure 3.4. Since our
adjusted test scores database is both standardized and comprehensive, linking regional test scores
to international tests and pooling subjects and grade levels, we can accomplish two things we
were unable to using only raw PISA scores. First, we can extend our comparison to a larger time
period: 1995-2010. Second, we include additional countries, namely developing countries, in
order to rank their learning progress on a global scale.
Figure 3.4: Average Improvement in Adjusted Test Scores (1995-2010)
"
"
"
"
"
Note: countries with missing data points in either 1995 or 2010 are not included in this graph.
Using adjusted tests scores, which include more developing countries and cover a longer
horizon, the top global performers include: Jordan, Iceland, Portugal, Canada, Hong Kong
(SAR), Greece, the United Kingdom, New Zealand, and Singapore. There are only a few
similarities in our comparison between raw PISA scores and adjusted test scores. For example,
Greece and Portugal remain top performers. However, our adjusted test scores reveal a
somewhat novel list of top performers, which includes countries that are typically ignored, such
as Jordan and Iceland. Thus, by expanding our dataset and using standardized metrics, we gain
new perspective on learning progress over time and across the globe. "
Next, we introduce a figure, which aims to create an even more comprehensive ranking of
learning progress. Given that developing countries often lack data, Figure 3.4, which compares
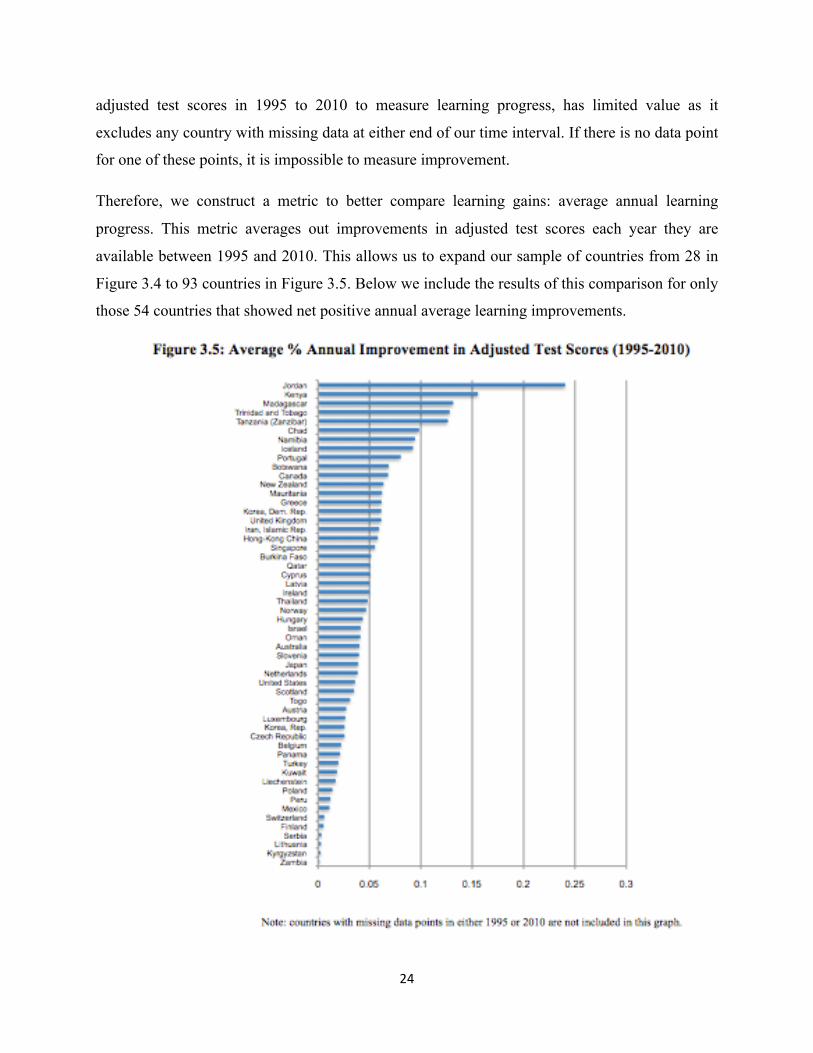
24""
adjusted test scores in 1995 to 2010 to measure learning progress, has limited value as it
excludes any country with missing data at either end of our time interval. If there is no data point
for one of these points, it is impossible to measure improvement.
Therefore, we construct a metric to better compare learning gains: average annual learning
progress. This metric averages out improvements in adjusted test scores each year they are
available between 1995 and 2010. This allows us to expand our sample of countries from 28 in
Figure 3.4 to 93 countries in Figure 3.5. Below we include the results of this comparison for only
those 54 countries that showed net positive annual average learning improvements. "

25""
According to this adjusted ranking, we obtain a new list of top performers over the last fifteen
years. The top improvements come from Jordan, Kenya, Madagascar, Trinidad and Tobago,
Tanzania, Chad, Namibia, Iceland, Portugal, Botswana, Canada, and New Zealand. All top
performers except Portugal, Canada, and New Zealand are new to the list. In particular, many
recent top performers appear to be developing countries.
Our adjusted test score database can better inform policy on a standardized and global scale, thus
enabling policymakers to determine and target meaningful education reforms for countries that
need it most.
6. Application of Data Set
Our database consists of internationally comparable test scores from 1965-2010 and provides a
useful measure of education quality. This outcome measure can be used for an empirical analysis
of the determinants of educational performance. We provide a first example of how to use our
extended and updated data set to determine causal inputs in successful education systems.
One major motivation for this analysis stems from the concentration of specific types of
countries on both ends of the achievement spectrum. Indeed, most of the countries that perform
worse than the world adjusted test score average are concentrated in Africa, Latin America, and
the Middle East, and are considered developing countries. This large discrepancy begs the
question: why do some countries achieve better learning outcomes when other countries do not?
To this end, we use our panel data set to demonstrate one possible causal analysis to explain
differences in qualitative achievement on international assessments. In particular we focus on
governance variables.
A) Approach
In this section, we briefly explain our econometric strategy, aimed at reducing omitted variable
bias and other biases. We also detail the set of explanatory variables included in our dataset. The
estimation strategies we want to apply are the following: First, we use a fixed effects approach,
capitalizing on the variation in systemic elements over countries and time in order to establish a
causal link between such elements and resulting cognitive skills. Second, we control for certain
confounding factors such as macroeconomic indicators. Third, we include lagged variables as
26""
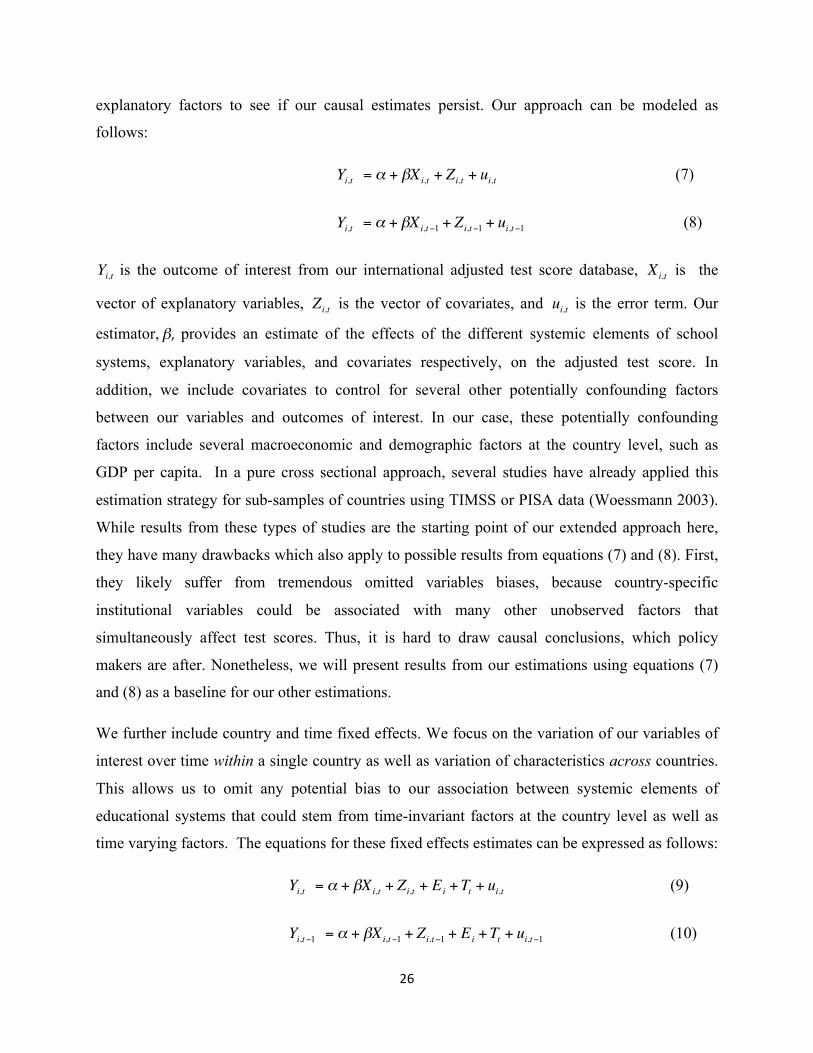
explanatory factors to see if our causal estimates persist. Our approach can be modeled as
follows:
" " " " "
€
Yi,t = α + βXi,t + Zi,t + ui,t " " " """"""""""""""""(7)
"" " " " "
€
Yi,t = α + βXi,t−1 + Zi,t−1 + ui,t−1"" " """"" """"(8)
€
Yi,t is the outcome of interest from our international adjusted test score database,
€
Xi,t is the
vector of explanatory variables,
€
Zi,t is the vector of covariates, and
€
ui,t is the error term. Our
estimator,
€
β," provides an estimate of the effects of the different systemic elements of school
systems, explanatory variables, and covariates respectively, on the adjusted test score. In
addition, we include covariates to control for several other potentially confounding factors
between our variables and outcomes of interest. In our case, these potentially confounding
factors include several macroeconomic and demographic factors at the country level, such as
GDP per capita. In a pure cross sectional approach, several studies have already applied this
estimation strategy for sub-samples of countries using TIMSS or PISA data (Woessmann 2003).
While results from these types of studies are the starting point of our extended approach here,
they have many drawbacks which also apply to possible results from equations (7) and (8). First,
they likely suffer from tremendous omitted variables biases, because country-specific
institutional variables could be associated with many other unobserved factors that
simultaneously affect test scores. Thus, it is hard to draw causal conclusions, which policy
makers are after. Nonetheless, we will present results from our estimations using equations (7)
and (8) as a baseline for our other estimations.
We further include country and time fixed effects. We focus on the variation of our variables of
interest over time within a single country as well as variation of characteristics across countries.
This allows us to omit any potential bias to our association between systemic elements of
educational systems that could stem from time-invariant factors at the country level as well as
time varying factors. The equations for these fixed effects estimates can be expressed as follows:""
€
Yi,t = α + βXi,t + Zi,t + Ei +Tt + ui,t (9)
€
Yi,t−1 = α + βXi,t−1 + Zi,t−1 + Ei +Tt + ui,t−1 (10)

27""
€
Ei "is an entity fixed effect at the country level and tT "is a time fixed effect at the year level. This
approach allows us to eliminate further bias by controlling for both differences across countries
as well as changing determinants within a country over time. Thus, our results can more likely be
interpreted as causal. Still, we could be confronted with unobserved heterogeneity as soon as
systemic changes coincide with other changes that drive test scores. This issue is exaggerated
due to temporal gaps in our data. For this reason, we also control for a host of macroeconomic
explanatory variables that vary over time.
B) Data
Next we present a systematic overview of all the explanatory variables that enter in our analysis.
We also discuss the difficulties that arise due to missing data in some of our core indicators of
educational systems.
In particular, we complement the adjusted test score database with explanatory factors such as
the overall governance of countries. A recent study by King et al. (2010) suggests that several
governance indicators have a particularly significant impact on the rate of return to education.
This finding is based on T.W. Schultz’ hypothesis (1975) that economic returns to schooling
vary with the capacity to manage unforeseeable price, productivity or technology shocks (see
King et al. 2010, p. 3). Thus, more freedom and rights allow individuals to reallocate their time
and resources when unforeseeable shocks occur. In turn, investing in human capital becomes
critical to ensure that individual reallocation is allowed and is efficient.
While this positive association between better governance indicators and higher returns to
education is robust to the inclusion of several macroeconomic indicators, better governance
indicators might also coincide with positive institutional changes that affect returns to education.
To this end, we break down governance into more specific indicators. Specifically, we include a
measure for Economic Freedom from the Heritage Foundation’s Index of Economic Freedom.
This data exists since 1994 and provides an index consisting of several indicators such as the
ease to open a business, openness to trade, taxes relative to income etc. We further include
Globalization, which comes from an Index by Dreher (2006) for the years 1970-2006. We also
add a measure for Civil Rights from the Empowerment Rights Index (which is available since

28""
1981, see Cingranelli and Richards 2005). The Empowerment Rights indicator is constructed
from several sub-indicators such as freedom of speech, freedom to participate in politics and
freedom of religion. We also include a ranking that rates countries by their democratic
institutions (on a scale from 0 to 10), which comes from the Freedom House Imputed Polity
measure (available since 1972).
Apart from the measures for country governance, we add several macroeconomic variables
including the population of the country, the log of GDP per Capita and the openness of the
country2.
Governance and macroeconomic variables are included in our data set in five-year steps from
1965-2010, when available, in order to align with our adjusted test score database.
C) Results
Next we provide results on the association between our explanatory governance variables
discussed above, and adjusted test scores. Results are reported in Table 2.0. Our dependent
variable is the overall Average Score, the Average Primary Score and the Average Secondary
Score. We control for macroeconomic factors such as GDP per Capita, Population and Trade
Openness. Columns (1)-(3) provide cross-sectional evidence pooling data over time, without
country or time fixed effects.
We find positive associations between our indicators for Globalization, Economic Freedom and
Democracy and test scores in columns (1), (2) and (3), respectively. As discussed, this
association could suffer from unobserved omitted variables at the country-level and which vary
over time. To address these biases, we include fixed effects in columns (4), (5), (6), and (7).
Specifically, in column (4) we include country fixed effects and control for macroeconomic
factors. Column (5) includes country and time fixed effects as well as macroeconomic controls.
Column (6) and (7) include lagged governance indicators in order to explore whether changes in
governance in period t-1 affect contemporaneous test scores.
"""""""""""""""""""""""""""""""""""""""""""""""""""""""""""""2 Population measures stem from the United Nations National accounts, GDP data and Openness from the PENN World Tables.

29""
Column (5) is of the most interest, since these results can most credibly be interpreted as causal
due to implicit controls for potential effects at the country level and over time. Our results
indicate that Economic Freedom is positively and statistically significantly associated with
higher test scores. This effect persists from our country-fixed specification in column (4). This
result indicates that as economic freedom increases, so do people’s capacity to respond to
shocks, as evidenced by King et al. (2010). Thus the returns to education rise as families and
students internalize the benefit of going to school (Bóo, 2010). As a result, students invest more
in their own human capital.
Additionally, we find that although Civil Rights have a positive and statistically significant affect
on test scores in our country-fixed effects model, this effect disappears when we control for time-
varying factors. One potential explanation for this is that civil rights are an indicator for a merit-
based society where education leads to better life outcomes. Thus, when civil rights are high
students and families invest in education. However, when you control for time-varying effects
within a country, this impact disappears. This suggests that the rise of merit-based opportunities
over time not speaking freely, for example, drive achievement. Indeed, when we include a lagged
variable for Civil Rights, we see that a high baseline amount of civil rights has positive impacts
on achievement, but an additional marginal increase in civil rights actually results in less
achievement. This might be the case since too many civil rights might distract from education.
For example, increased civil rights might result in more teacher strikes.

30""
Table 2.0: Test Scores and Governance Indicators
Without Country Fixed Effects With Fixed Effects
Dependent Variable
Average Score
(1)
Average Primary Score
(2)
Average Secondary Score
(3)
Average Score
(4)
Average Score
(5)
Average Score
(6)
Average Score
(7)
Civil Rights -0.012 0.23 -0.183 0.698** -0.022 -0.508* (0.26) (0.29) (0.3) (0.32) (0.34) (0.29) Globalization 0.155*** -0.026 0.105 0.149* 0 0.002 (0.05) (0.06) (0.06) (0.08) (0.07) (0.07) Democracy 0.478 0.201 0.760** -0.192 -0.039 0.524 (0.31) (0.36) (0.38) (0.78) (0.68) (1.07) Economic Freedom 0.053 0.196** 0.025 0.177* 0.168* 0.028 (0.07) (0.08) (0.08) (0.1) (0.1) (0.12) Openness (in percent) 0.020* 0.013 0.031** 0.060** 0.038 -0.003 -0.001 (0.01) (0.01) (0.01) (0.03) (0.03) (0.03) (0.03)
Log Population 1.207*** 0.701 0.507 4.798 -
13.259* 57.878** 43.967** (0.37) (0.46) (0.38) (6.82) (7.44) (24.64) (20.38) Log GDP per Capita 3.114*** 2.623*** 3.728*** -3.146 -4.375 -6.801** -6.908** (0.64) (0.72) (0.78) (3.05) (3.93) (2.62) (2.71) Lag of Civil Rights 0.437* 0.604** (0.22) (0.23) Lag of Globalization -0.130* -0.106* (0.08) (0.06) Lag of Democracy -0.056 -0.014 (0.35) (0.32) Lag of Economic Freedom 0.065 0.083 (0.1) (0.11) Lag of Openness (in percent) 0.002 0.002 (0.03) (0.03) Lag of Log Population
-65.913***
-50.916***
(22.26) (19.21) Lag of Log GDP per Capita -1.936 -1.17 (4.41) (4.19) R-Squared 0.632 0.497 0.587 0.171 0.936 0.652 0.622 Observations 186 122 120 186 186 138 138 Number of Countries 95 84 72 95 95 91 91
Notes: Dependent Variable: Score averaged over all test score domains. Columns (1), (2) and (3) report OLS estimations. Columns (4), (5), (6) and (7) report Fixed Effects Estimations. Column (4) includes country fixed effects, Column (5) includes both country and time fixed effects, and Columns (6) and (7) include country fixed effects as well as lagged variables. All regressions are estimated with robust standard errors, clustered on the country level.

31""
Since we are especially interested in educational progress in developing countries, we next
estimate the same regressions for a sub-sample of African and Latin American countries. We
include countries for which we have at least two test scores over time as well as information on
governance and macroeconomic indicators. Specifically, we analyze 24 African countries and 17
Latin American countries in our fixed effects estimations.
We focus on the results of column (5) in Table 2.1, since it includes time and fixed effects and is
therefore most causal. We find a significant and positive effect for both Democracy and
Economic Freedom on the average test score in our sub-sample of Latin American and African
countries. Like in Table 2.0, it seems that some dimension of more favorable governance
indicators boost educational attainment even in developing countries. It is interesting to note that
Democracy and Economic Freedom are the key governance indicators that boost test scores in
developing countries, while in more developed countries, Economic Freedom and Civil Rights
matter most.

32""
Table 2.1: Test Scores and Governance Indicators: African and Latin American Countries
Without Country Fixed Effects With Country Fixed Effects
Average
Score Average
Score Average
Score Average
Score Average
Score Average
Score Average Score
(1) (2) (3) (4) (5) (6) (7)
Civil Rights -1.057* -0.569 -0.454 -0.613 0.028 -1.187 -0.844
(0.59) (0.73) (0.4) (0.93) (1.0) (0.77) (0.75)
Globalization -0.204* -0.164 -0.162** 0.098 -0.055 -0.087 -0.065
(0.12) (0.11) (0.08) (0.18) (0.12) (0.1) (0.11)
Democracy 0.66 1.5 0.387 1.776*** 3.200** 1.592** 1.555**
(0.63) (1.04) (0.47) (0.55) (1.4) (0.62) (0.69)
Economic Freedom 0.281 0.315** 0.298*** 0.432** 0.15 0.231** 0.205*
(0.19) (0.13) (0.11) (0.21) (0.1) (0.11) (0.11)
Openness (in percent) -0.008 0.005 -0.003 -0.001 -0.026 0.004 0
(0.04) (0.03) (0.03) (0.05) (0.08) (0.03) (0.04)
Log Population 0.905 1.704 1.371 -12.679 -28.566 -2.115 14.821
(1.34) (0.91) (0.8) (8.03) -29.28 (6.49) (15.3)
Log GDP per Capita 2.123 -1.274 3.203** -4.146 -7.948 -8.056 0.184
(1.71) (2.26) (0.94) (5.92) (11.29) (4.91) (7.21)
R-Squared 0.35 0.416 0.46 0.486 0.802 0.455 0.95
Observations 40 28 68 40 28 68 68
Number of Countries 24 17 41 24 17 41 41
Notes: Dependent Variable: Score averaged over all test score domains. Columns (1), (2), and (3) report OLS estimations for Africa, Latin America, and both, respectively. Column (4), (5), (6) and (7) report Fixed Effects Estimations. In particular, column (4), (6), and (7) report country fixed effects for Africa, Latin America, and both, respectively. Column (5) reports country fixed and time fixed effects for Latin America. All regressions are estimated with robust standard errors and are clustered on the country level.
6. Conclusion
In this paper, we present the construction of an international database comparable across
countries and over time. Our focus is on the inclusion of developing countries, with the goal of
evaluating which causal factors contribute most to cognitive skill attainment around the world. In
particular, we use the methodology of Altinok and Murseli (2007) to build a data set of
comparable test scores from 1965-2010 for a set of 128 countries.

33""
To construct this data set we standardized international assessments, such as PISA and TIMMS,
across types of exams by linking them to the United States as a reference point, since the United
States participates in all international assessments. We further standardized tests over time by
linking our United States reference point to the National Assessment of Educational Progress
(NAEP), which has been administered in the United States since 1969. Finally, we include
developing countries that have participated in regional assessments such as LLECE, PASEC, and
SACMEQ, by using scores from doubloon countries that participated in both a regional and
international assessment as an index.
While our database allows the comparison of many countries over time, the development of this
database still requires improvements and extensions. For example, our database should
continually be updated with results from the most recent international and regional achievement
tests. Additionally, our anchoring methodology for developing countries, which makes use of
doubloon countries, could be made more accurate. As time goes on and more Latin American
and African countries participate in PISA and TIMMS, this will become increasingly feasible.
Our ultimate goal is to use our extended and updated version of the Altinok and Murseli (2007)
database to inform us about which causal inputs lead to better learning. To that end, we provide
an application of our international database.
We are interested in governance indicators and macroeconomic variables and identify some
insightful associations between our governance indicators and adjusted test score outcomes.
Governance indicators involving Economic Freedom and Civil Rights show positive associations
with test scores. For a sub-set of Latin American and African countries, however, only Economic
Freedom and Democracy significantly affect student achievement. These results are robust to the
inclusion of several governance and macroeconomic indicators as well as lagged variables. The
use of country and time fixed effects supports a causal interpretation of our results.
Our paper marks only a starting point in benchmarking progress in human capital quality and
educational institutions around the globe. We have created one of the first databases on student
achievement that is comparable across tests, across countries and over time. We also include the
first wide array of developing countries in such an international database. More research must be
done in order to improve our approach. In particular, there should be a focus on credibly

34""
adjusting test scores so as to compare them over different surveys and years. In addition,
countries should be encouraged to participate in as many international surveys as possible. Such
a development would ease the interpretation and reliability of all methods that seek to make
diverse test scores comparable. Finally, further research might utilize our dataset to causally
identify inputs, beyond governance variables, which boost achievement.

35""
References
Altinok, Nadir and Murseli, Hatidje (2007): International Database on Human Capital Quality.
Economics Letters 96 (2): 237-244.
Barro, Robert J. (1991): Economic Growth in a Cross Section of Countries. Quarterly Journal of
Economics 106 (2): 407-443.
Barro, Robert J. (1998): Determinants of Economic Growth: A Cross-Country Empirical Study,”
MIT Press Books, The MIT Press, edition 1, volume 1, number 0262522543.
Barro, Robert J. and Lee, Jong-Wha (2010): “A New Data Set of Educational Attainment in the
World 1950-2010,” NBER Working Papers 15902, National Bureau of Economic Research, Inc.
Beck, Thorsten, Feyen, Erik, Ize, Alain, Moizeszowicz, Florencia (2008): Benchmarking
Financial Development. World Bank Policy Research Working Paper 4638.
Bóo, Florencia (2010): Returns to Education and Macroeconomic Shocks: Evidence from
Argentina. IZA Discussion Paper.
Brunello, Giorgio and Checci, Daniele (2007): Does school tracking affect equality of
opportunity? New international evidence. Education Policy 22 (October): 781-861.
Cingranelli, David L. and Richards, David L. (2005): Measuring the Level, Pattern, and
Sequence of Government Respect for Physical Integrity Rights. International Studies Quarterly
43(2): 407–17.
Dreher, Axel (2006): Does Globalization Affect Growth? Evidence from a New Index of
Globalization. Applied Economics 38(10):1091–110.
Fuchs, Thomas and Woessmann, Ludger (2007): What Accounts for International Differences in
Student Performance? A Re-Examination Using PISA Data. Empirical Economics 32 (2-3):
433-464.
Hanushek, Eric A. (1979): Conceptual and Empirical Issues in the Estimation of Educational
Production Functions, Journal of Human Resources 14 (3): 351-388.

36""
Hanushek, Eric A. and Kimko, Denis D. (2000): Schooling Labor-Force Quality and the Growth
of Nations. American Economic Review 90 (5): 1184-1208.
Hanushek, Eric A. and Woessmann, Ludger (2006): Does Educational Tracking Affect
Performance and Inequality? Differences-in-Differences Evidence across Countries. Economic
Journal 116 (510): C63-C76.
Hanushek, Eric A. and Woessmann, Ludger (2008): The Role of Cognitive Skill in Economic
Development. Journal of Economic Literature 46 (3): 607-668.
Hanushek, Eric A. and Woessmann, Ludger (2009a): Do Better Schools Lead to more Growth?
Cognitive Skills, Economic Outcomes, And Causation. NBER Working Paper 14633.
Hanushek, Eric A. and Woessmann, Ludger (2009b): Schooling, Cognitive Skills, And the Latin
American Growth Puzzle. NBER Working Paper 15066.
Hanushek, Eric A. and Woessmann, Ludger (2010): The Economics of International Differences
in Educational Achievement. NBER Working Paper 15949.
Juerges, Hendrik, Schneider, Kerstin and Büchel, Felix (2005): The Effect Of Central Exit
Examinations On Student Achievement: Quasi-Experimental Evidence From TIMSS Germany.
Journal of the European Economic Association 3(5): 1134-1155.
King, Elizabeth M., Montenegro, Claudio E. and Orazem, Peter F. (2010): Economic Freedom,
Human Rights, and the Returns to Human Capital – An Evaluation of the Schultz Hypothesis.
World Bank Policy Research Working Paper 5405.
Lee, Jomg-Wha and Barro, Robert J. (2001): Schooling Quality in a Cross section of Countries.
Economica 68 (272): 465-488.
Mankiw, N. Gregory, Romer, David, and Weil, David N. (1992): A Contribution to the Empirics
of Economic Growth. Quarterly Journal of Economics 107 (2): 407-437.
Patrinos, Harry A., Jakubowski, Maicej, Porta Emilio E. and Wisniewski, Jerzy (2010): The
Impact of the 1999 Education Reform in Poland. World Bank Policy Research Working Paper
5263.
37""
Rindermann. Heiner, Ceci, Stephen J. (2009): Educational Policy and Country Outcomes in
International Cognitive Competence Studies. Perspectives on Psychological Science 4 (6): 551-
577.
Schultz, Theodore (1975): The Value of Ability to Deal with Disequilibra. Journal of Economic
Literature 13 (3): 827-846.
West, Martin R. and Woessmann, Ludger (2010): Every Catholic Child in a Catholic School:
Historical Resistance to State Schooling, Contemporary School Competition, and Student
Achievement across Countries. Economic Journal 120 (546): F299-F255.
Woessmann, Ludger (2003): Schooling Resources, Educational Institutions, and Student
Performance: The International Evidence. Oxford Bulletin of Economics and Statistics 65 (2):
117-170.
"

38
ANNEX
Figure A1: Test Score Availability by Country – Primary Scores Averaged over Subjects
OECD Countries
Notes: Every Marker indicates the availability of a test score for the respective five year span.
The number in brackets behind countries’ names show the overall ability of single test scores (by
subject and by grade) for the respective country over the whole span between 1965 and 2006.
1960 1965 1970 1975 1980 1985 1990 1995 2000 2003 2006
Australia Austria Belgium (FI) Belgium (FR) Canada Chile Czech Republic Denmark Finland France Germany Greece Hungary Iceland Ireland Italy Japan Korea, Rep. Luxemburg Me1ico Netherlands New Zealand Norway Poland Portugal Slovak Republic Slovenia Spain Sweden Switzerland Turkey United Kingdom United Sates

39
Figure A2: Test Score Availability by Country – Primary Scores Averaged over Subjects
Non-OECD European Countries
Notes: Every Marker indicates the availability of a test score for the respective five-year span.
The number in brackets behind countries’ names show the overall ability of single test scores (by
subject and by grade) for the respective country over the whole span between 1965 and 2006.
1960 1965 1970 1975 1980 1985 1990 1995 2000 2003 2006
Armenia
Bulgaria
Cyprus
Latvia
Lithuania
Macedonia, FYR
Moldova
Romania
Russian Federation
Yugoslavia, Fed. Rep. Georgia

40
Figure A3: Test Score Availability by Country – Primary Scores Averaged over Subjects
Asian Countries
Notes: Every Marker indicates the availability of a test score for the respective five year span.
The number in brackets behind countries’ names show the overall ability of single test scores (by
subject and by grade) for the respective country over the whole span between 1965 and 2006.
1960 1965 1970 1975 1980 1985 1990 1995 2000 2003 2006
China
Chinese Tapei
Hong-Kong China India
Indonesia
Iran, Islamic Rep. Israel
Japan
Jordan
Korea, Dem. Rep. Korea, Rep.
Kuwait
Oman
Philippines
Qatar
Singapore
Syrian Arab Republic Thailand

41
Figure A4: Test Score Availability by Country – Primary Scores Averaged over Subjects
Latin American and Caribbean Countries
Notes: Every Marker indicates the availability of a test score for the respective five year span.
The number in brackets behind countries’ names show the overall ability of single test scores (by
subject and by grade) for the respective country over the whole span between 1965 and 2006
1960 1965 1970 1975 1980 1985 1990 1995 2000 2003 2006
Argentina
Bolivia
Brazil
Chile
Colombia
Cuba
Dominican Republic Ecudaor
El Salvador
Guatemala
Honduras
Mexico
Nicaragua
Panama
Paraguay
Peru
Trinidad and Tobago Uruguay
Venezuela, RB

42
Figure A5: Test Score Availability by Country – Primary Scores Averaged over Subjects
African Countries
Notes: Every Marker indicates the availability of a test score for the respective five year span.
The number in brackets behind countries’ names show the overall ability of single test scores (by
subject and by grade) for the respective country over the whole span between 1965 and 2006.
1960 1965 1970 1975 1980 1985 1990 1995 2000 2003 2006
Botswana Burkina Faso Cameroon Chad Cote d'Ivoire Kenya Lesotho Madagascar Malawi Mali Mauritania Mauritius Morocco Mozambique Namibia Niger Senegal Seychelles South Africa Swaziland Tanzania (Main Land) Tanzania (Zanzibar) Togo Tunisia Uganda Zambia Zimbabwe

43
Figure B1: Test Score Availability by Country – Secondary Scores Averaged over Subjects
OECD Countries
Notes: Every Marker indicates the availability of a test score for the respective five year span.
The number in brackets behind countries’ names show the overall ability of single test scores (by
subject and by grade) for the respective country over the whole span between 1965 and 2006.
1960 1965 1970 1975 1980 1985 1990 1995 2000 2003 2006
Australia Austria Belgium (FI) Belgium (FR) Canada Chile Czech Republic Denmark Finland France Germany Greece Hungary Iceland Ireland Italy Japan Korea, Rep. Liechenstein Luxembourg Mexico Netherlands New Zealand Norway Poland Portugal Slovak Republic Slovenia Spain Sweden Switzerland Turkey United Kingdom United Sates
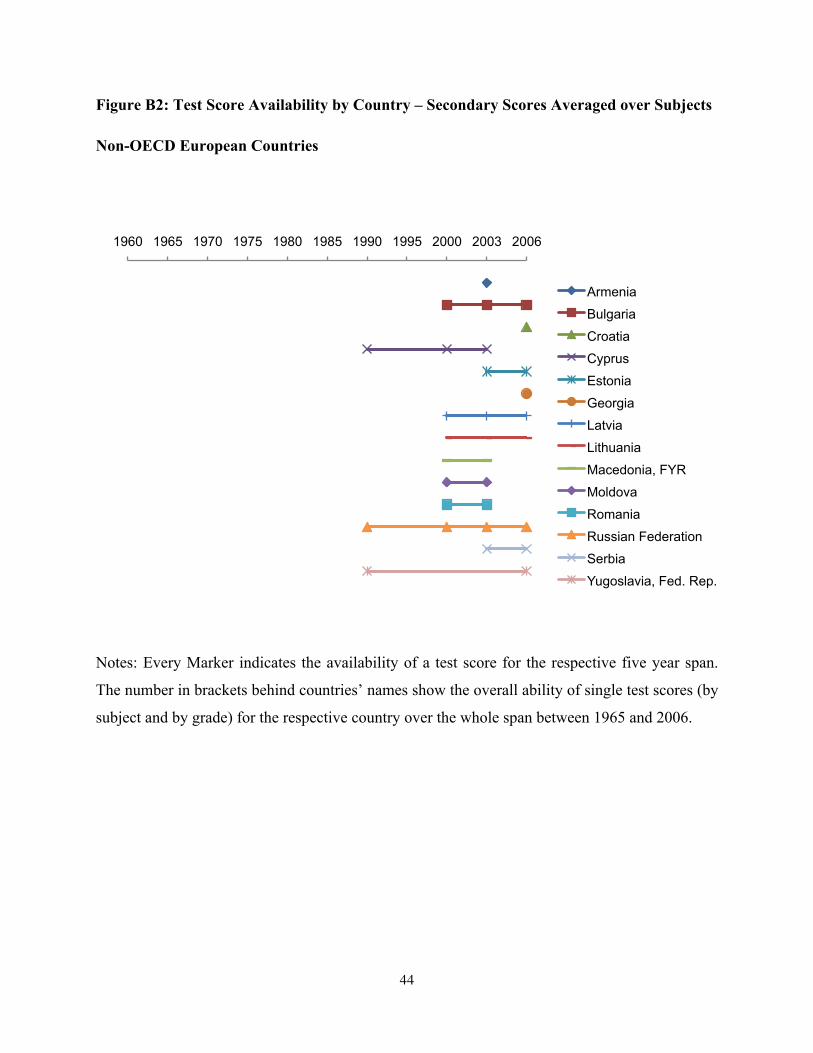
44
Figure B2: Test Score Availability by Country – Secondary Scores Averaged over Subjects
Non-OECD European Countries
Notes: Every Marker indicates the availability of a test score for the respective five year span.
The number in brackets behind countries’ names show the overall ability of single test scores (by
subject and by grade) for the respective country over the whole span between 1965 and 2006.
1960 1965 1970 1975 1980 1985 1990 1995 2000 2003 2006
Armenia
Bulgaria
Croatia
Cyprus
Estonia
Georgia
Latvia
Lithuania
Macedonia, FYR
Moldova
Romania
Russian Federation
Serbia
Yugoslavia, Fed. Rep.
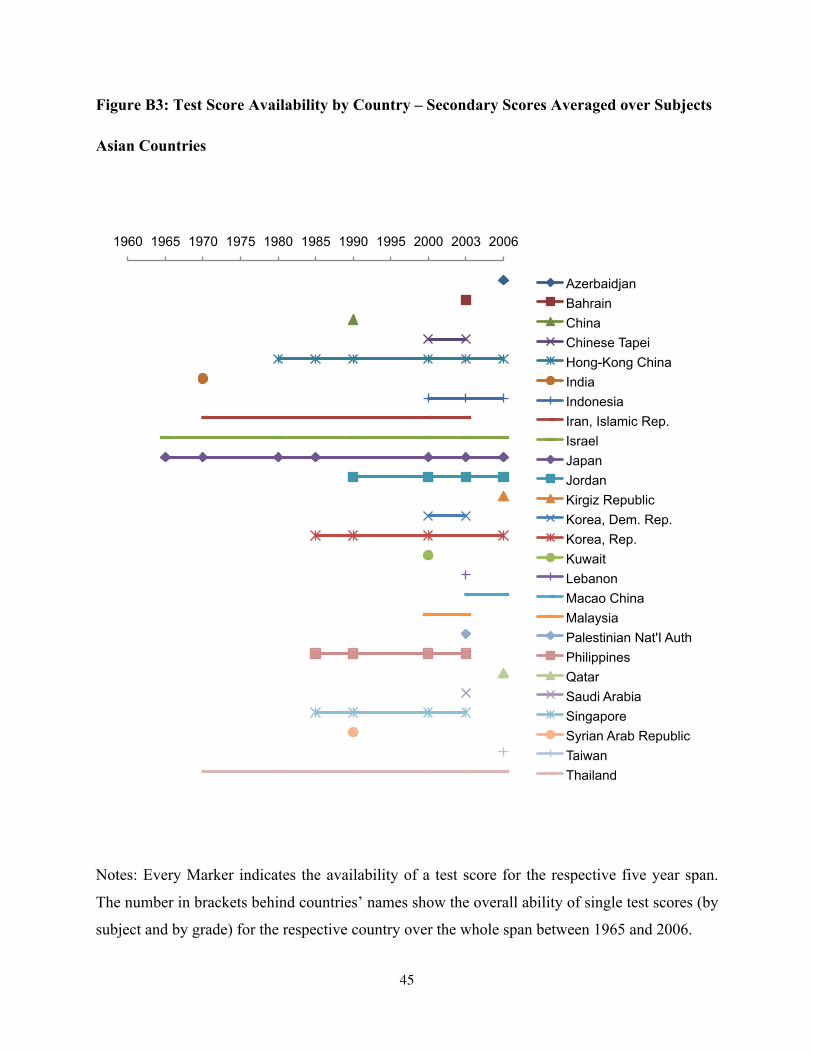
45
Figure B3: Test Score Availability by Country – Secondary Scores Averaged over Subjects
Asian Countries
Notes: Every Marker indicates the availability of a test score for the respective five year span.
The number in brackets behind countries’ names show the overall ability of single test scores (by
subject and by grade) for the respective country over the whole span between 1965 and 2006.
1960 1965 1970 1975 1980 1985 1990 1995 2000 2003 2006
Azerbaidjan Bahrain China Chinese Tapei Hong-Kong China India Indonesia Iran, Islamic Rep. Israel Japan Jordan Kirgiz Republic Korea, Dem. Rep. Korea, Rep. Kuwait Lebanon Macao China Malaysia Palestinian Nat'I Auth Philippines Qatar Saudi Arabia Singapore Syrian Arab Republic Taiwan Thailand

46
Figure B4: Test Score Availability by Country – Secondary Scores Averaged over Subjects
Latin American and Caribbean Countries
Notes: Every Marker indicates the availability of a test score for the respective five year span.
The number in brackets behind countries’ names show the overall ability of single test scores (by
subject and by grade) for the respective country over the whole span between 1965 and 2006.
1960 1965 1970 1975 1980 1985 1990 1995 2000 2003 2006
Argentina
Brazil
Chile
Colombia
Cuba
Dominican Republic El salvador
Mexico
Panama
Paraguay
Peru
Trinidad and Tobago Uruguay
Venezuela, RB

47
Figure B5: Test Score Availability by Country – Secondary Scores Averaged over Subjects
African Countries
Notes: Every Marker indicates the availability of a test score for the respective five year span.
The number in brackets behind countries’ names show the overall ability of single test scores (by
subject and by grade) for the respective country over the whole span between 1965 and 2003.
1960 1965 1970 1975 1980 1985 1990 1995 2000 2003 2006
Botswana
Egypt, Arab Rep.
Ghana
Malawi
Morocco
Mozambique
Nigeria
South Africa
Swaziland
Tunisia
Zimbabwe

48
Figure C1: Test Score Availability by Country – Scores Averaged over Grades and Subject
OECD Countries
Notes: Every Marker indicates the availability of a test score for the respective five year span.
The number in brackets behind countries’ names show the overall ability of single test scores (by
subject and by grade) for the respective country over the whole span between 1965 and 2006.
1960 1965 1970 1975 1980 1985 1990 1995 2000 2003 2006
Australia (18) Japan (19) Germany (16) Netherlands (22) Finland (18) Sweden (20) United Kingdom (24) United Sates (29) Belgium (FR) (10) France (17) New Zealand (19) Hungary (27) Italy (24) Chile (16) Canada (22) Luxembourg (11) Ireland (18) Spain (17) Norway (19) Poland (12) Korea, Rep. (11) Greece (14) Iceland (15) Denmark (12) Switzerland (13) Portugal (17) Austria (11) Mexico (15) Slovenia (13) Czech Republic (12) Liechenstein (9) Slovak Republic (9) Turkey (9) Belgium (FI) (12)

49
Figure C2: Test Score Availability by Country – Scores Averaged over Grades and Subject
Non-OECD European Countries
Notes: Every Marker indicates the availability of a test score for the respective five year span.
The number in brackets behind countries’ names show the overall ability of single test scores (by
subject and by grade) for the respective country over the whole span between 1965 and 2006.
1960 1965 1970 1975 1980 1985 1990 1995 2000 2003 2006
Cyprus (11)
Russian Federation (17)
Yugoslavia, Fed. Rep. (6) Latvia (15)
Bulgaria (9)
Macedonia, FYR (6)
Romania (9)
Lithuania (11)
Moldova (8)
Estonia (5)
Serbia (6)
Armenia (4)
Croatia (3)
Georgia (1)
Montenegro (3)

50
Figure C3: Test Score Availability by Country – Scores Averaged over Grades and Subject
Asian Countries
Notes: Every Marker indicates the availability of a test score for the respective five year span.
The number in brackets behind countries’ names show the overall ability of single test scores (by
subject and by grade) for the respective country over the whole span between 1965 and 2006.
Japan (19) Israel (16) Thailand (15) Iran, Islamic Rep. (13) India (3) Hong-Kong China (19) Philippines (9) Singapore (14) Korea, Rep. (11) Indonesia (10) Jordan (10) China (3) Syrian Arab Republic (4) Oman (1) Korea, Dem. Rep. (8) Kuwait (6) Malaysia (4) Chinese Tapei (10) Bahrain (2) Lebanon (2) Palestinian Nat'I Auth (2) Saudi Arabia (2) Macao China (6) Azerbaischan (3) Kyrgyz Republic (3) Qatar (4) Taiwan (3)

51
Figure C4: Test Score Availability by Country – Scores Averaged over Grades and Subject
Latin American and Caribbean Countries
Notes: Every Marker indicates the availability of a test score for the respective five year span.
The number in brackets behind countries’ names show the overall ability of single test scores (by
subject and by grade) for the respective country over the whole span between 1965 and 2006.
1960 1965 1970 1975 1980 1985 1990 1995 2000 2003 2006
Chile (16) Brazil (14) Venezuela, RB (4) Trinidad and Tobago (3) Argentina (8) Mexico (15) Colombia (10) Bolivia (6) Cuba (5) Dominican Republic (7) Honduras (6) Paraguay (7) Peru (8) Uruguay (8) Ecuador (4) El Salvador (5) Guatemala (4) Nicaragua (4) Panama (5)

52
Figure C5: Test Score Availability by Country – Scores Averaged over Grades and Subject
African Countries
Notes: Every Marker indicates the availability of a test score for the respective five year span.
The number in brackets behind countries’ names show the overall ability of single test scores (by
subject and by grade) for the respective country over the whole span between 1965 and 2006.
1960 1965 1970 1975 1980 1985 1990 1995 2000 2003 2006
Malawi (6) Nigeria (2) Swaziland (3) Zimbabwe (2) Botswana (7) Mozambique (3) Kenia (3) Namibia (3) Tanzania (Zanzibar) (3) Burkina Faso (2) Cameroon (2) Chad (2) Cote d'Ivoire (2) Mauritania (2) Togo (2) Senegal (2) Mauritius (5) Uganda (5) Zambia (5) Tunisia (13) Morocco (11) Madagascar (4) Mali (4) Niger (4) Lesotho (2) Seychelles (2) Tanzania (Main Land) (2) South Africa (7) Egypt, Arab Rep. (2) Ghana (2)

53
Figure D1: Test Score Trends over Time averaging over all Test Domains (on Primary
School Level)
Notes: Every Marker indicates the average test score for the respective world region averaged
over all test domains (Math, Reading and Science), only including tests with primary school
students. The numbers at the markers indicate the number of countries over which the average is
computed.
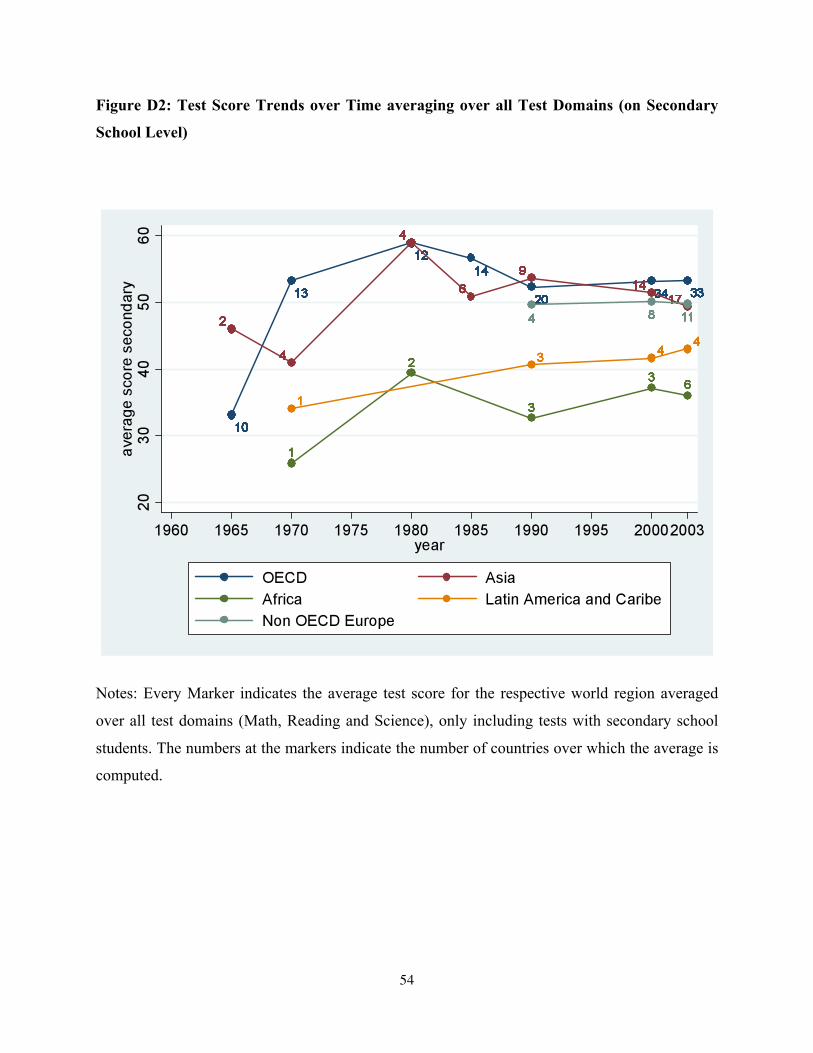
54
Figure D2: Test Score Trends over Time averaging over all Test Domains (on Secondary
School Level)
Notes: Every Marker indicates the average test score for the respective world region averaged
over all test domains (Math, Reading and Science), only including tests with secondary school
students. The numbers at the markers indicate the number of countries over which the average is
computed.

55
Figure D3: Test Score Trends over Time averaging over all Test Domains (on Secondary
School Level)
Notes: Every Marker indicates the average test score for the respective world region averaged
over all test domains (Math, Reading and Science) and all grade levels. The numbers at the
markers indicate the number of countries over which the average is computed.
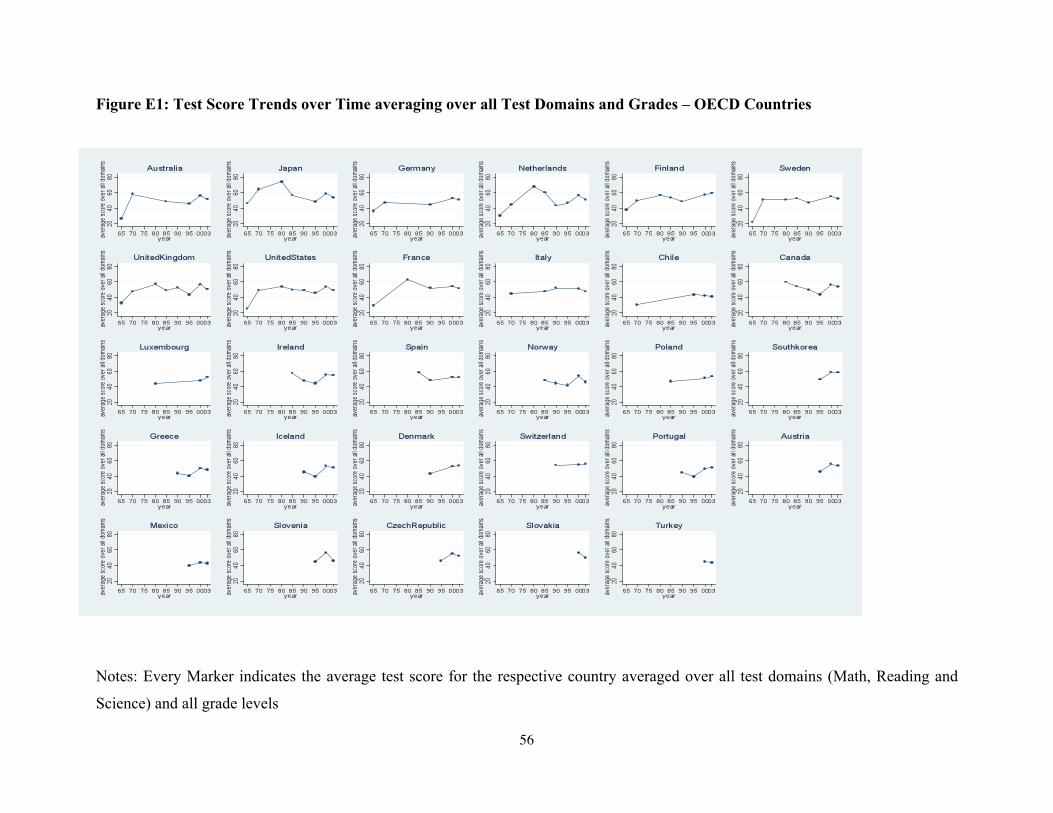
56
Figure E1: Test Score Trends over Time averaging over all Test Domains and Grades – OECD Countries
Notes: Every Marker indicates the average test score for the respective country averaged over all test domains (Math, Reading and
Science) and all grade levels

57
Figure E2: Test Score Trends over Time averaging over all Test Domains and Grades – Non-OECD European Countries
Notes: Every Marker indicates the average test score for the respective country averaged over all test domains (Math, Reading and
Science) and all grade levels
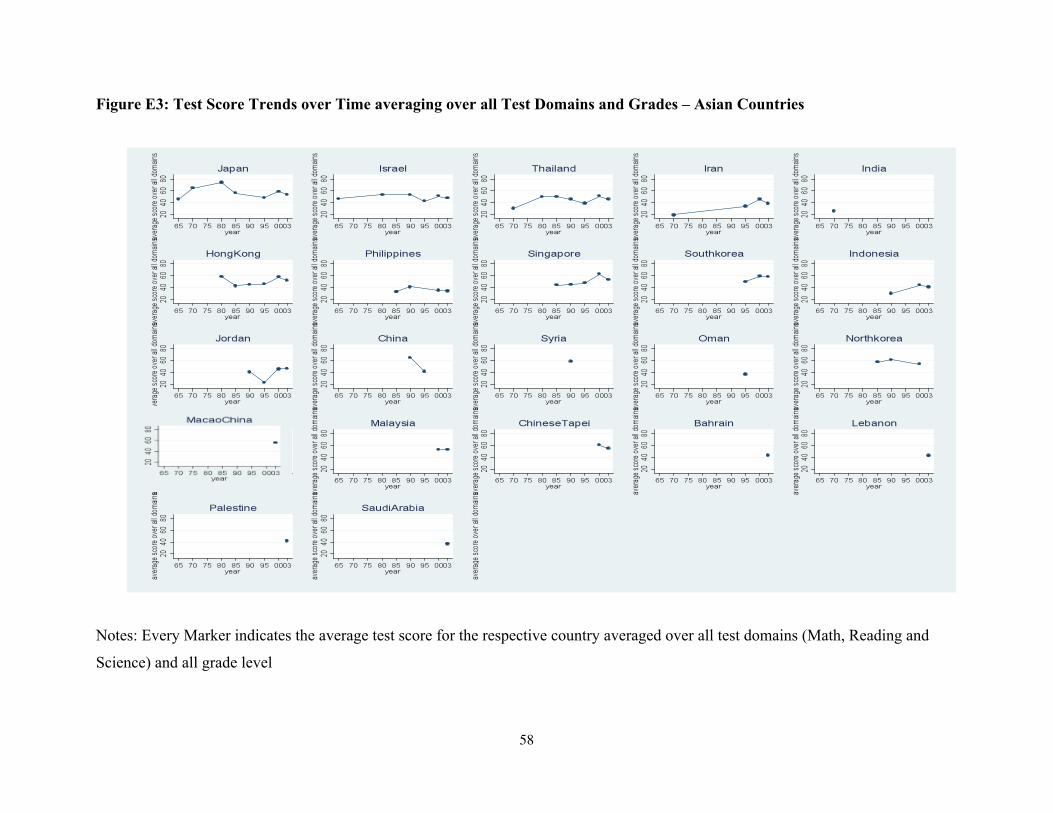
58
Figure E3: Test Score Trends over Time averaging over all Test Domains and Grades – Asian Countries
Notes: Every Marker indicates the average test score for the respective country averaged over all test domains (Math, Reading and
Science) and all grade level
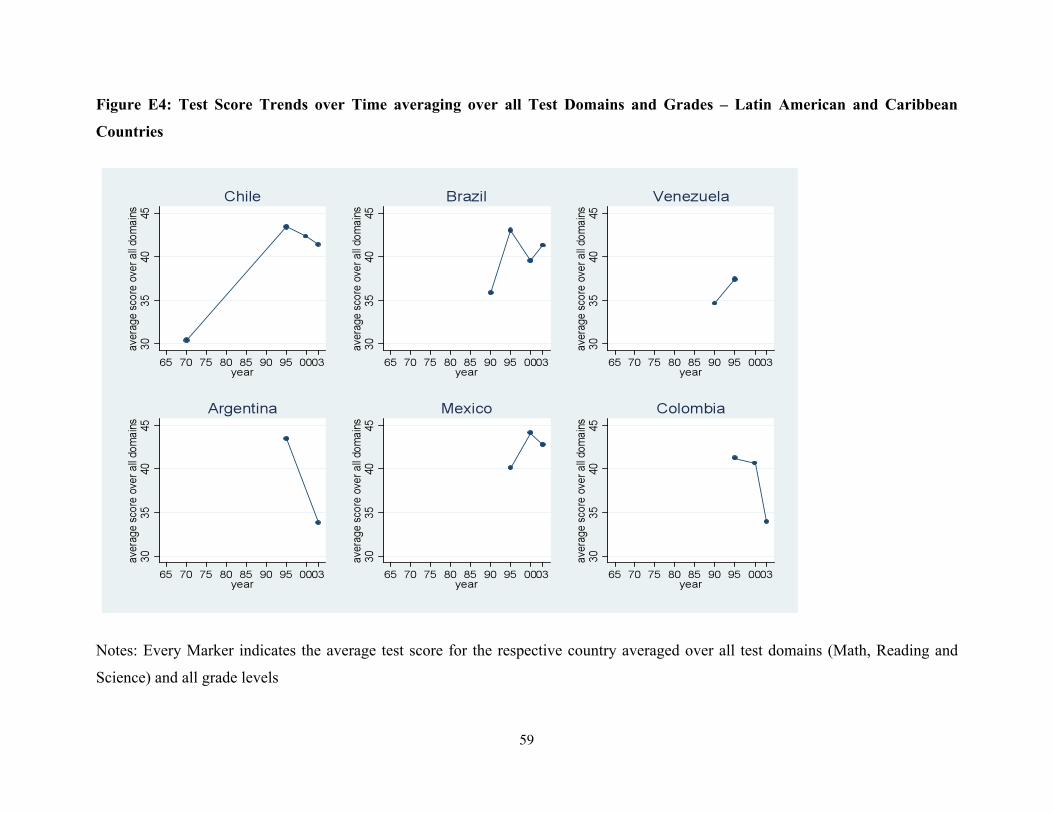
59
Figure E4: Test Score Trends over Time averaging over all Test Domains and Grades – Latin American and Caribbean
Countries
Notes: Every Marker indicates the average test score for the respective country averaged over all test domains (Math, Reading and
Science) and all grade levels
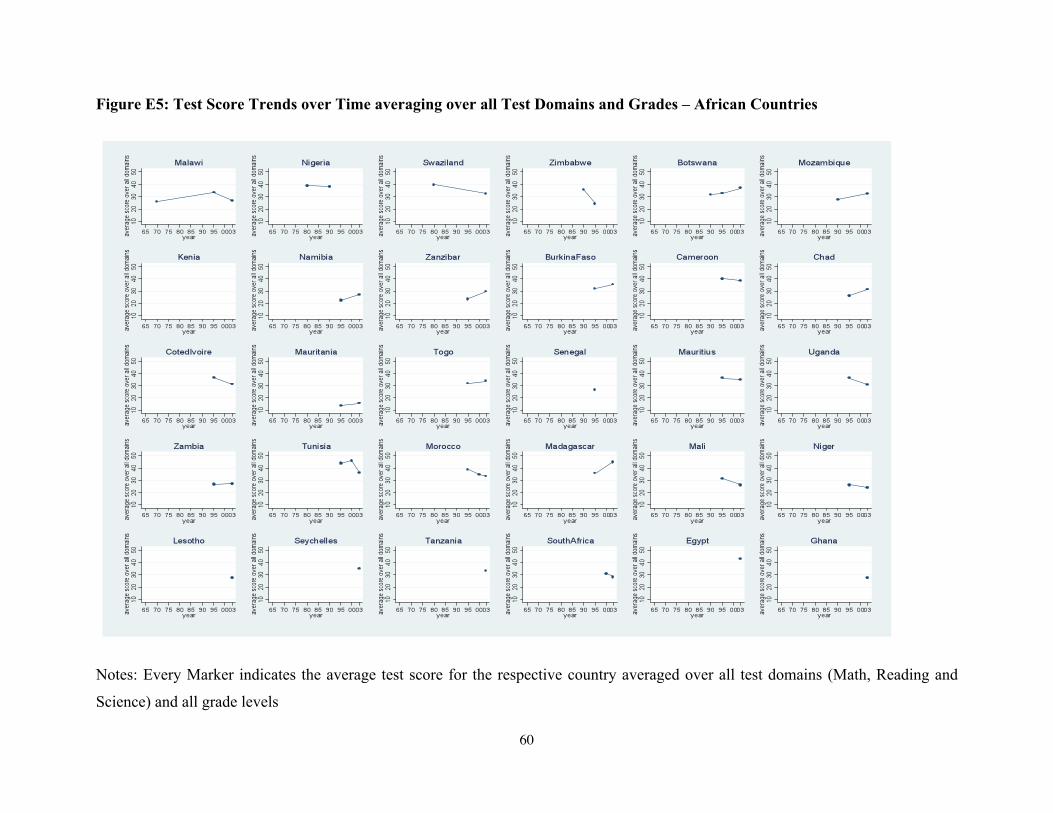
60
Figure E5: Test Score Trends over Time averaging over all Test Domains and Grades – African Countries
Notes: Every Marker indicates the average test score for the respective country averaged over all test domains (Math, Reading and
Science) and all grade levels

63

64

65

66
Table G5: Average Adjusted Mean Scores in Latin America
Table G6: Average SERCE Scores in Latin America, Reading and Math
33 34 35 36 37 38 39 40 41 42 43 44
Uruguay Chile Mexico Brazil Argentina Colombia Peru Panama
Average Mean Score
0
100
200
300
400
500
600
700
SERCE2006math6
SERCE2006read6

67
Table G7: Average SERCE Math Scores vs. PISA Math Scores in Latin America
Table G8: PISA Improvement in Latin America countries from 2006 to 2009
0
100
200
300
400
500
600
700
Uruguay Mexico Chile Argentina Brazil Colombia Peru Panama
SERCE2006math6
PISA Math 2009

68
Figure G9: Annual average standard deviations from the mean for countries with more
than one test score and adjusted test scores above the mean in a given year (1965-2010)
Figure G10: Annual average standard deviations from the mean for countries with more
than one test score and adjusted test scores below the mean in a given year (1965-2010)