an example in the road sector -...
23
Brussels 16 th November 2016 João Morgado Pavement Unit Manager Asset Management Review and Monitoring Asset management and maintenance planning an example in the road sector 1 st Open Workshop
Transcript of an example in the road sector -...
Brussels 16th November 2016
João MorgadoPavement Unit Manager Asset Management Review and Monitoring
Asset management and maintenance planningan example in the road sector
1st Open Workshop
AGENDA
01 INFRAESTRUTURAS DE PORTUGAL
02 ASSETS UNDER IP’s JURISDICTION
03 PAVEMENT MANAGEMENT SYSTEM
04 SUPPORT TO DECISION-MAKING
05 FINAL REMARKS AND OPEN CHALLENGES

As per Decree-Law n. 91/2015 dated 29 May, and taking effects as of 1st June 2015, Rede Ferroviária Nacional- Refer, E.P.E. (REFER, E.P.E.) hereby incorporates by merger EP – Estradas de Portugal, S.A. (EP, S.A.) andbecomes a public limited company named Infraestruturas de Portugal, S.A. (IP, S.A.). The merger byincorporation extincts EP, S.A. and its duties and competences are transferred to IP, S.A..
CompanyNational Road Network General Concessionaire
Long-term Concession Contract of 75 years (until 2082)
Shareholder Base: Portuguese State (100%)
MissionFinancing, operation and development of the road network integrating the National Road Plan (except thenetwork under private concession);
The design, construction, financing, maintenance, operation and development of the future road network.
ResponsibilitiesFulfilment of performance indicators: Level of Service, Road Safety and Environmental Sustainability
Profile
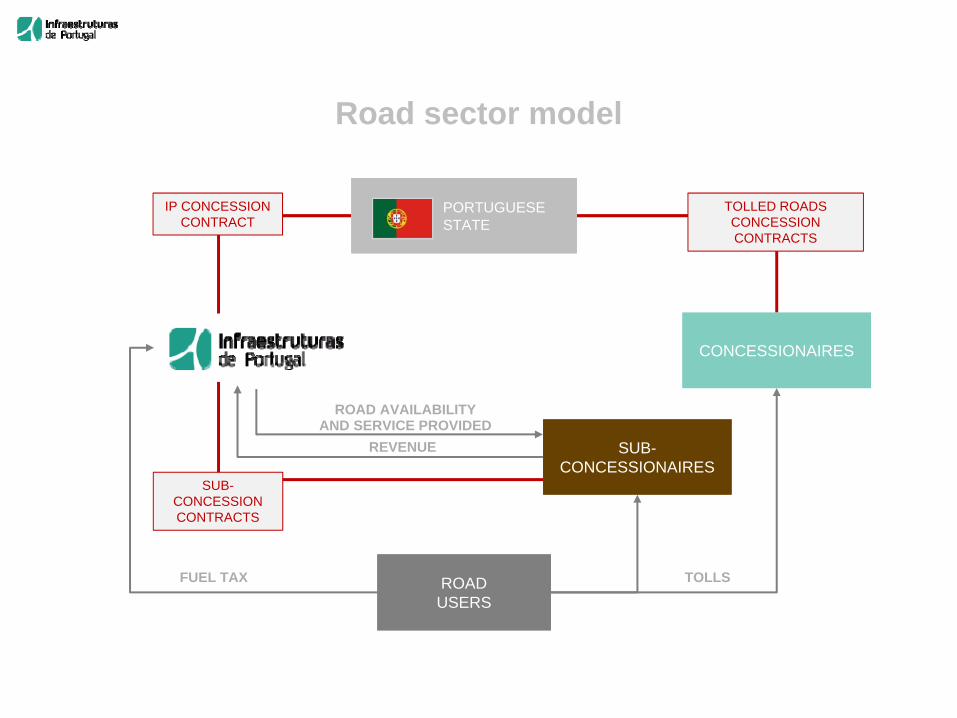
IP CONCESSION CONTRACT
TOLLSFUEL TAX
ROAD AVAILABILITYAND SERVICE PROVIDED
REVENUE
CONCESSIONAIRESCONCESSIONAIRES
ROADUSERSROADUSERS
PORTUGUESESTATEPORTUGUESESTATE
TOLLED ROADS CONCESSION CONTRACTS
SUB-CONCESSION CONTRACTS
SUB-CONCESSIONAIRES
SUB-CONCESSIONAIRES
Road sector model
NATIONAL ROAD
NETWORK
NATIONAL ROAD
NETWORK
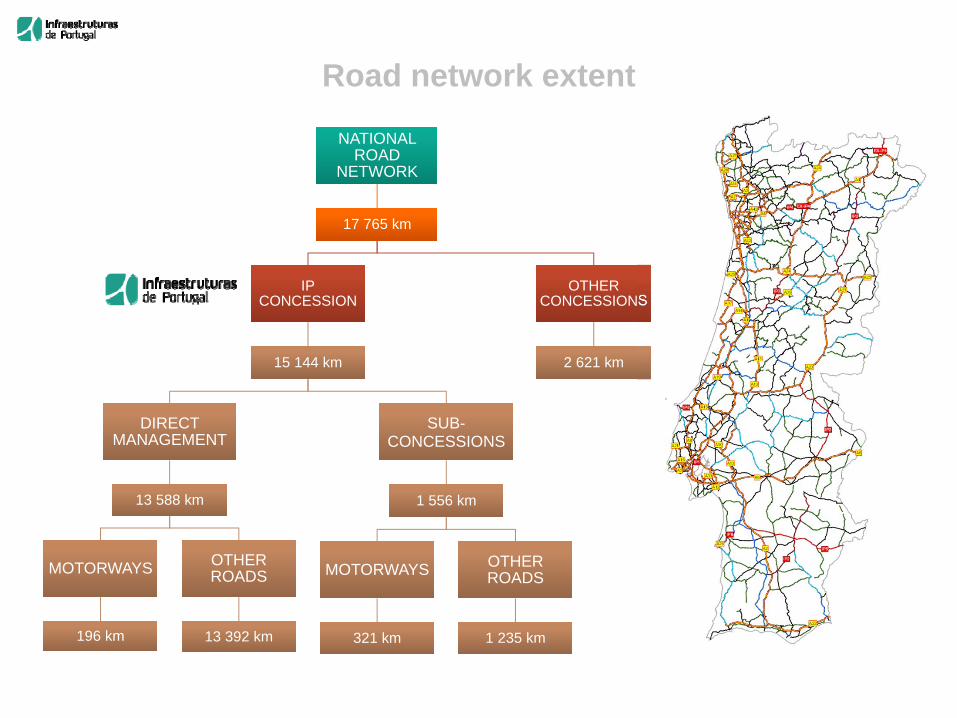
17 765 km17 765 km
OTHER CONCESSIONS
OTHER CONCESSIONS
2 621 km2 621 km
IP CONCESSION
IP CONCESSION
15 144 km15 144 km
SUB-CONCESSIONS
SUB-CONCESSIONS
1 556 km1 556 km
OTHER ROADSOTHER ROADS
1 235 km1 235 km
MOTORWAYSMOTORWAYS
321 km321 km
DIRECT MANAGEMENT
DIRECT MANAGEMENT
13 588 km13 588 km
OTHER ROADSOTHER ROADS
13 392 km13 392 km
MOTORWAYSMOTORWAYS
196 km196 km
Road network extent

Classified Roads (9 774 km)
• Principal Itineraries (443 km)
• Complementary Itineraries (1 579 km)
• National Roads (4 465 km)
• Regional Roads (3 287 km)
Declassified Roads (3 814 km)
Road assets under IP jurisdiction
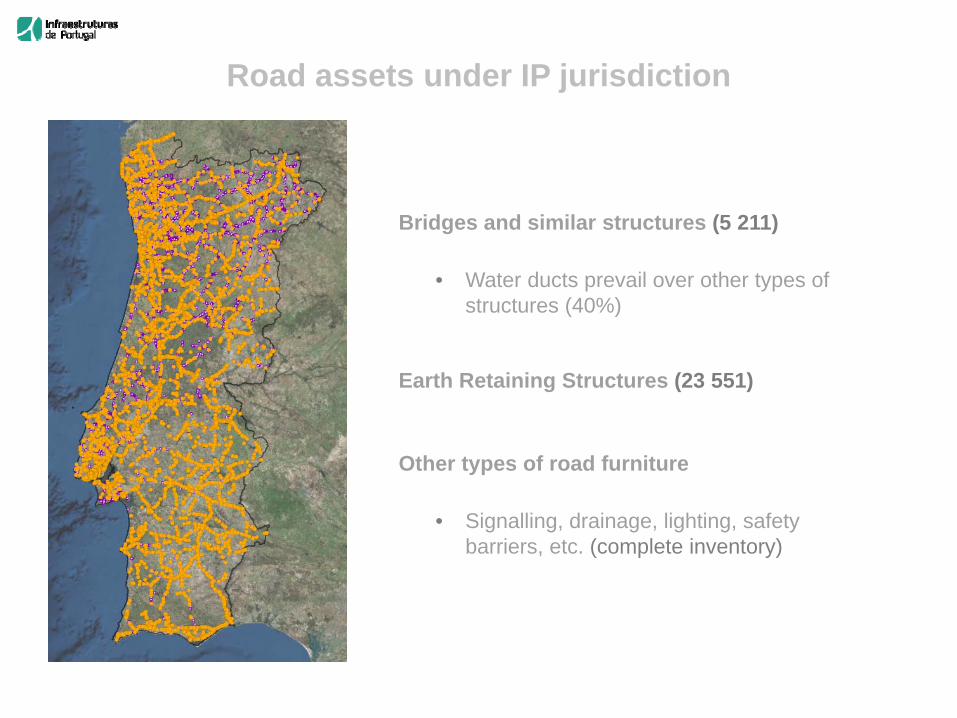
Bridges and similar structures (5 211)
• Water ducts prevail over other types of structures (40%)
Earth Retaining Structures (23 551)
Other types of road furniture
• Signalling, drainage, lighting, safety barriers, etc. (complete inventory)
Road assets under IP jurisdiction

SGPavPavement
Management System
SGPavPavement
Management System
SGOABridge
Management System
SGOABridge
Management System
SGOCEarth
Retaining Structures
Management System
SGOCEarth
Retaining Structures
Management System
IP Asset Management Systems

Annual condition surveysPavement
quality data
Performance model
Pavement quality
prediction
Strategies evaluationMulti-annual intervention
plans
Design and construction
Pavements database Pavement
description and historic record
2003 | Project start
2007 | Production start
Pavement Management System overview
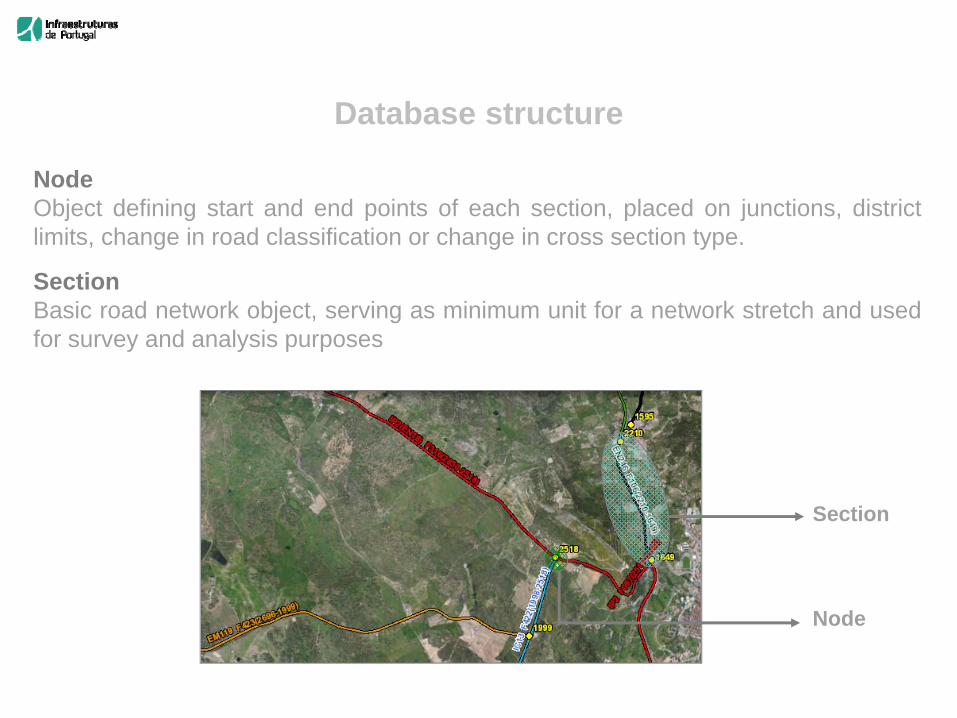
NodeObject defining start and end points of each section, placed on junctions, districtlimits, change in road classification or change in cross section type.
SectionBasic road network object, serving as minimum unit for a network stretch and usedfor survey and analysis purposes
Section
Node
Database structure

• Road network features
section id, location data, geometric data (per section)
• Traffic data
AADT, heavy vehicle rate, growth rate, axle aggressiveness (per section)
• Pavement condition data (global and parametric)
Quality Index (global) (per section/1000 m/100 m per year)
Condition parameters (longitudinal unevenness, transverse unevenness, area with cracking, macrotexture, friction) (per section/1000 m/100 m/10 m per year)
• Pavement subgrade bearing capacity (per section)
• Historic record of all pavement interventions, allowing the assessment of the structural capacity (start and end km, materials, layer thicknesses, etc.)
• Front and rear images (per 10 m per year)
Database contents

Visual inspection Laser RST SCRIMVIZIROAD equipment (visual surface defects identification with linear and GPS referencing)
Laser vehicle collecting unevenness (longitudinal and transverse), macrotexture, geometry and front and rear images
SCRIM vehicle collecting wet skid resistance and macrotexture
Used for project level surveys Used for network surveys (over 90% per year) since 2011
Used for network surveys (partial extent) since 2012
Survey methods and annual coverage

PAVEMENT QUALITY INDEX
automatic evaluation
IQ = f (longitudinal unevenness, transverse unevenness and cracking)
assessed by the operatorautomatic evaluation
Good: IQ > 3.5 Fair: 2.5 < IQ < 3.5 Poor: 1.5 < IQ < 2.5 Bad: IQ < 1.5
0.5t2t
IRI0.0002030t C0.03R0.002139e5IQ t
PAVEMENT QUALITY RANK
Besides each individual condition parameter, a global quality index is used:
NON-STRUCTURAL MAINTENANCE STRUCTURAL MAINTENANCE
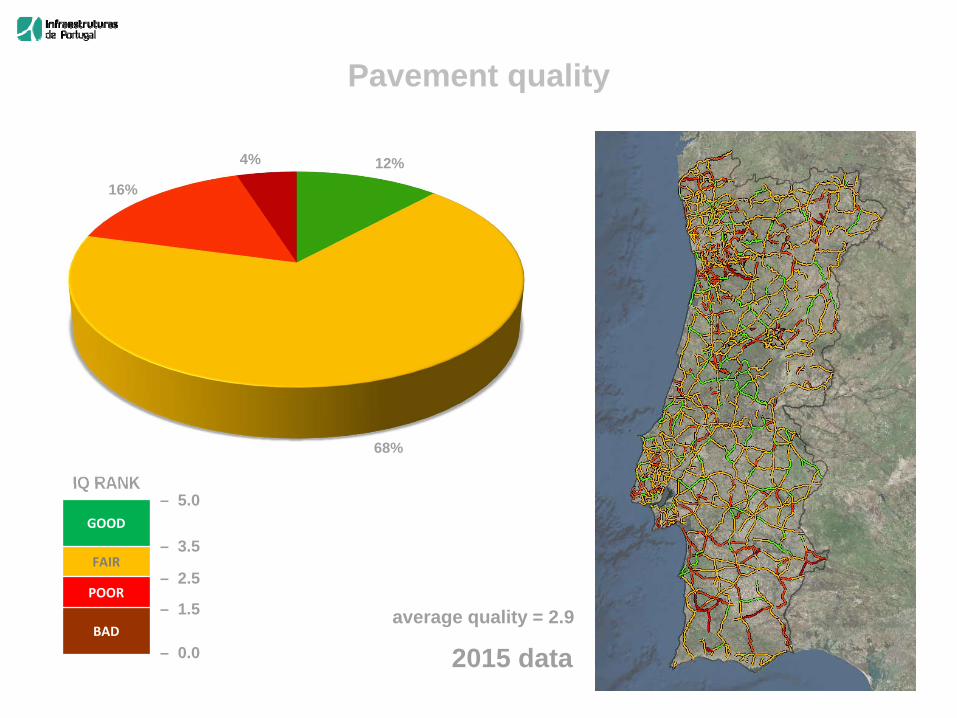
2015 data
GOOD
FAIR
POOR
BAD
– 5.0
– 3.5
– 2.5
– 0.0
– 1.5 average quality = 2.9
IQ RANK
12%
68%
16%
4%
Pavement quality

Section general information
Global quality overview
DATA VISUALISATION
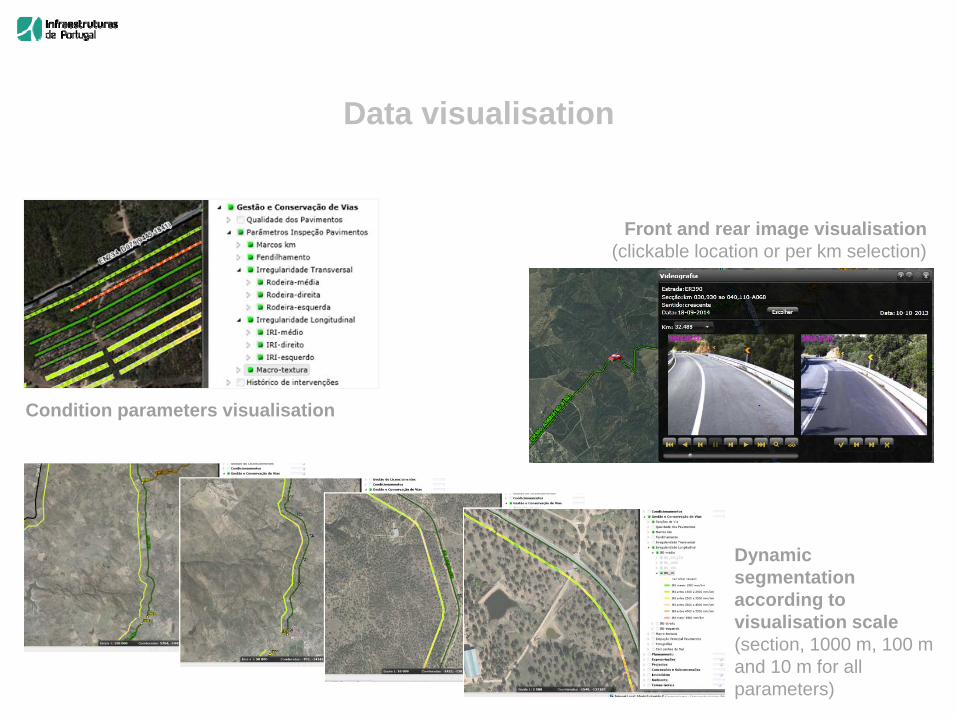
Condition parameters visualisation
Dynamic segmentation according to visualisation scale(section, 1000 m, 100 m and 10 m for all parameters)
Front and rear image visualisation(clickable location or per km selection)
Data visualisation

Linear visualisation for condition parameters
Statistical analysis for condition parameters
Cross section visualisation for each 10 m
Information automatically provided by SGPavGraf web app(per section per year)
Data visualisation and web apps
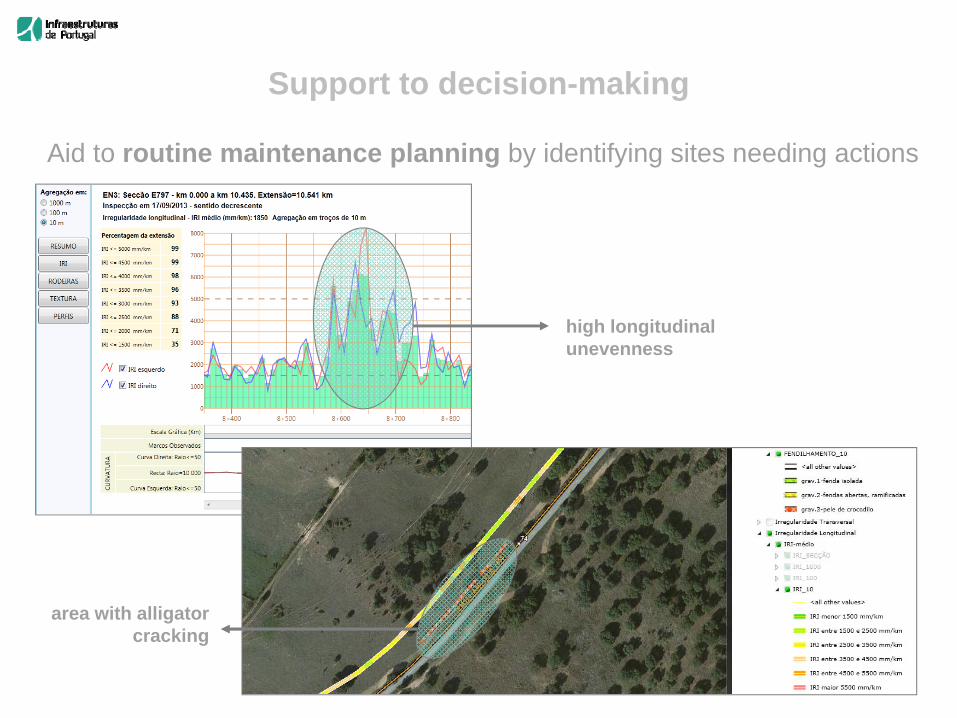
Aid to routine maintenance planning by identifying sites needing actions
high longitudinal unevenness
area with alligator cracking
Support to decision-making

Pavement performance modelling allowing the early identification of future maintenance needs
3.76 3.68 3.65 3.63 3.61 3.60 3.58 3.57 3.55 3.54 3.53
4.10 3.97 3.92 3.88 3.84 3.81 3.79 3.76 3.74 3.71 3.69
2.15 2.00 1.85 1.71 1.60 1.50 1.40 1.30 1.20 1.09 0.99
4.10 3.97 3.92 3.88 3.84 3.81 3.78 3.76 3.73 3.71 3.68
1.89 1.76 1.66 1.57 1.49 1.41 1.32 1.24 1.16 1.08 1.00
2.63 2.52 2.46 2.42 2.39 2.36 2.33 2.30 2.27 2.25 2.22
2.08 1.94 1.78 1.63 1.48 1.33 1.18 1.03 0.88 0.75 0.75
2.64 2.49 2.34 2.19 2.04 1.89 1.74 1.59 1.44 1.29 1.14
2.95 2.80 2.65 2.52 2.46 2.41 2.35 2.31 2.26 2.22 2.17
3.00 2.90 2.80 2.70 2.60 2.50 2.40 2.30 2.20 2.10 2.00
3.80 3.70 3.60 3.50 3.40 3.30 3.20 3.10 3.00 2.90 2.80
2.86 2.76 2.66 2.56 2.46 2.36 2.26 2.16 2.06 1.96 1.86
2.35 2.20 2.09 2.02 1.96 1.91 1.85 1.80 1.76 1.71 1.66
2.63 2.48 2.38 2.31 2.26 2.21 2.16 2.11 2.07 2.03 1.99
2.83 2.68 2.60 2.54 2.49 2.44 2.40 2.35 2.31 2.28 2.24
2.85 2.70 2.60 2.55 2.51 2.47 2.44 2.40 2.37 2.34 2.31
2.38 2.23 2.08 1.93 1.78 1.63 1.48 1.33 1.18 1.03 0.88
Network-wide future pavement condition evaluation
Performance assessment of different maintenance alternatives
Support to decision-making

• Heuristic method to rank interventions and assign them to each analysis year according to the expected budget
• Ranking is made based on two criteria: investment/traffic demand ratio (35%) and the road condition deterioration rate (65%)
• The result is a 5-year maintenance plan, designed to meet strategic quality targets
Annualinvestment
0
Analysis year (n)
n+2n+1 n+3 …
Ln
n
Budget optimisation and prioritisation of maintenance interventions
Support to decision-making

The recent IP SGPav developments contributed decisively to itsconsolidation
• by eliminating the subjectivity in the collection of conditionparameters
• by the extent of the information available (annual networkcoverage over 90%)
It resulted in a wider SGPav recognition, not only from its everydayusers, but also from top management
Final remarks
Given the heterogeneity of the IP network (hierarchy, traffic demandand attributes), several challenges arise
• Forecasting road condition efficiently
• Performance indicators enhancement
• Decision-support improvement
Common asset management framework for both road and rail
Open challenges