An Examination of Unwarranted Sentencing Disparity - MSCCSP
52
An Examination of Unwarranted Sentencing Disparity Under Maryland’s Voluntary Sentencing Guidelines Report to The Maryland Commission on Criminal Sentencing Policy 50 Maryland Avenue Rockville, Maryland 20850 by Claire Souryal Charles Wellford University of Maryland Department of Criminology and Criminal Justice 2220 LeFrak Hall College Park, MD 20740 November 21, 1997
Transcript of An Examination of Unwarranted Sentencing Disparity - MSCCSP

An Examination of Unwarranted Sentencing Disparity Under Maryland’s Voluntary Sentencing Guidelines
Report to
The Maryland Commission on Criminal Sentencing Policy 50 Maryland Avenue
Rockville, Maryland 20850
by
Claire Souryal Charles Wellford
University of Maryland
Department of Criminology and Criminal Justice 2220 LeFrak Hall
College Park, MD 20740
November 21, 1997

ii
TABLE OF CONTENTS
List of Tables List of Figures 1. Introduction 1 2. Literature Review 3
2.1 Racial Disparity in Sentencing 3 2.2 Sentencing Guidelines & Racial Disparity in Sentencing 7
3. Methods 10
3.1 Data 11 3.1.1 Missing-Data Values 3.1.2 Sample Characteristics
3.2 Analytic Strategy 12 3.3 Measures 14
3.3.1. Dependent Variables 3.3.2 Independent Variables
4. Results 16
4.1 The Incarceration Decision 16 4.1.1 Crime Category-Specific Approach
4.2 Sentence Length 18 4.2.1 Crime Category-Specific Approach
4.3 Racial Disparity Among Consistent and Inconsistent Sentences 19 4.3.1. Consistent Subsample 4.3.2 Inconsistent Subsample
4.4 Summary 22 5. Conclusion 23
iii
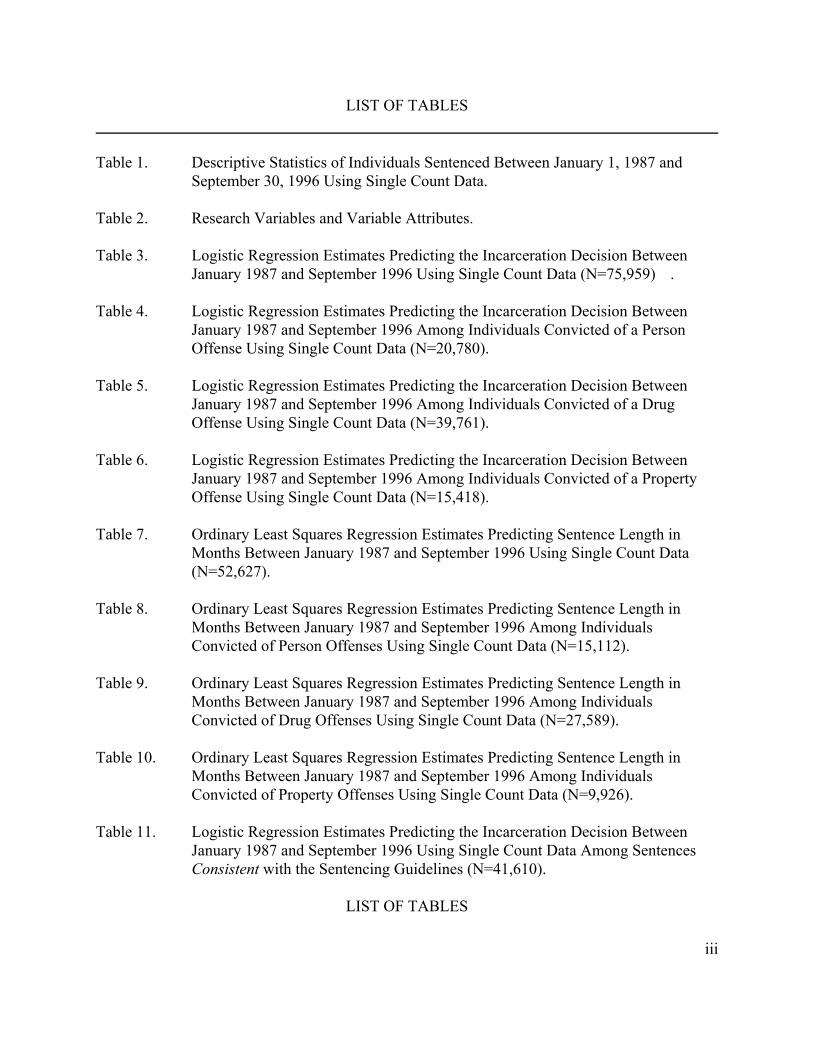
LIST OF TABLES Table 1. Descriptive Statistics of Individuals Sentenced Between January 1, 1987 and
September 30, 1996 Using Single Count Data. Table 2. Research Variables and Variable Attributes. Table 3. Logistic Regression Estimates Predicting the Incarceration Decision Between
January 1987 and September 1996 Using Single Count Data (N=75,959) . Table 4. Logistic Regression Estimates Predicting the Incarceration Decision Between
January 1987 and September 1996 Among Individuals Convicted of a Person Offense Using Single Count Data (N=20,780).
Table 5. Logistic Regression Estimates Predicting the Incarceration Decision Between
January 1987 and September 1996 Among Individuals Convicted of a Drug Offense Using Single Count Data (N=39,761).
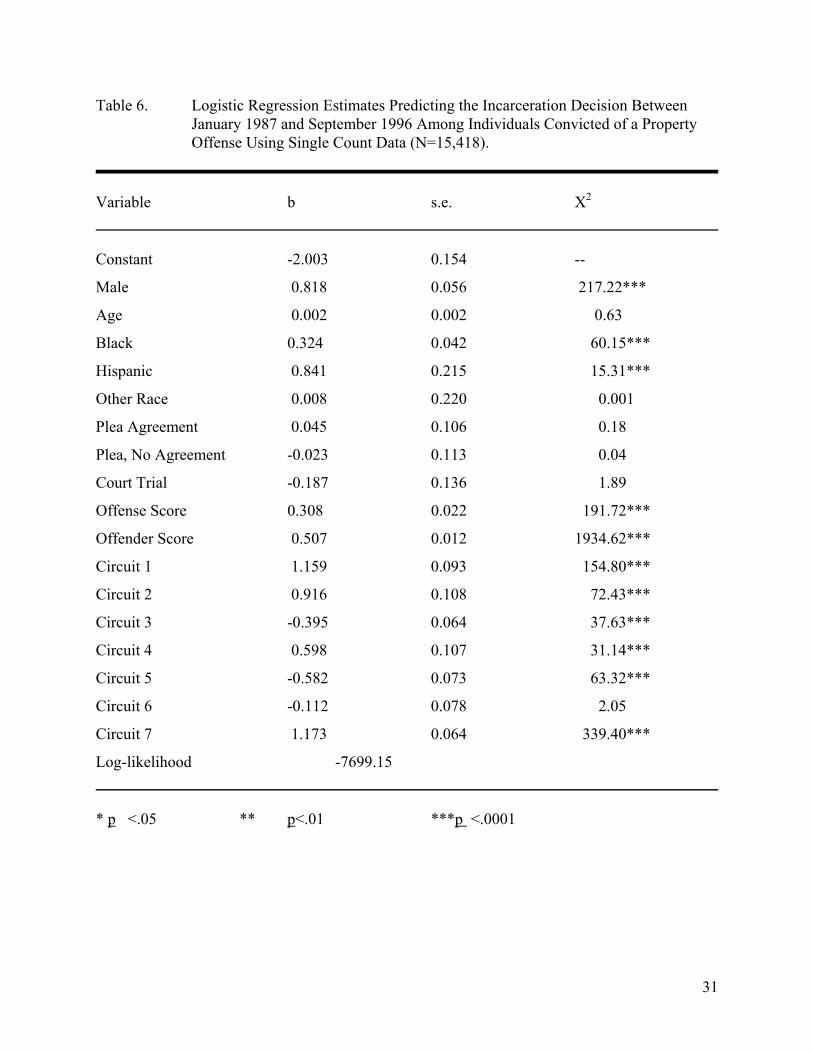
Table 6. Logistic Regression Estimates Predicting the Incarceration Decision Between
January 1987 and September 1996 Among Individuals Convicted of a Property Offense Using Single Count Data (N=15,418).
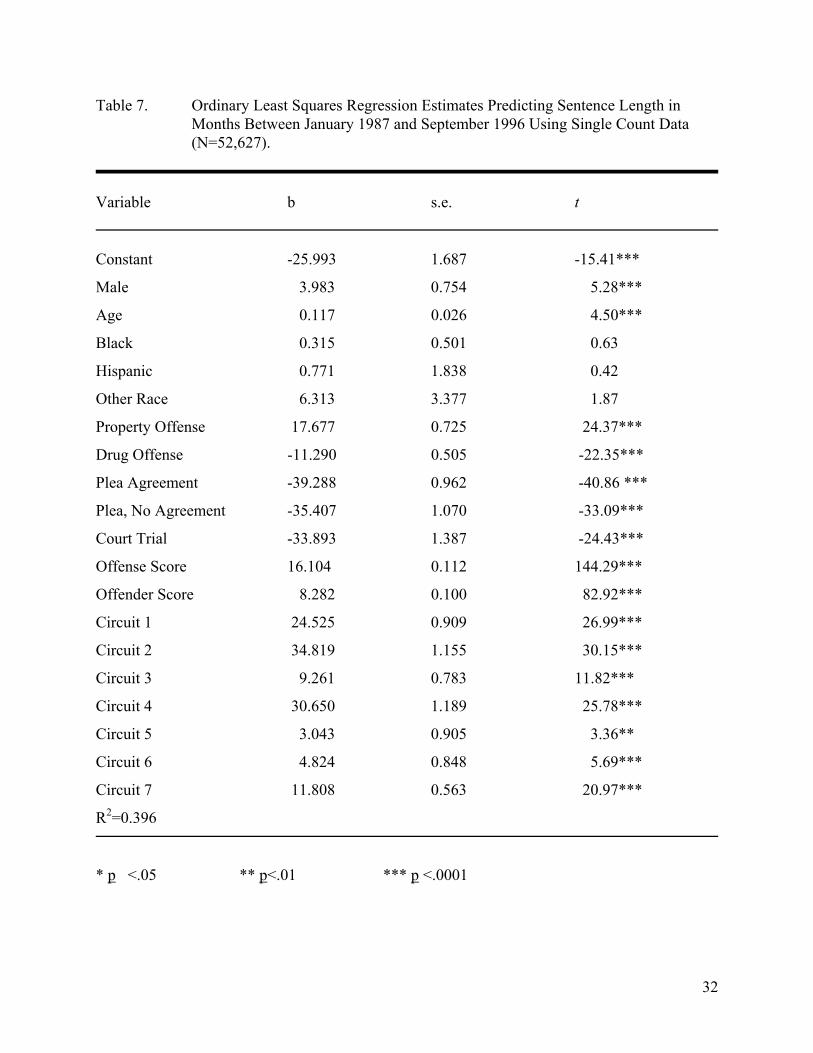
Table 7. Ordinary Least Squares Regression Estimates Predicting Sentence Length in
Months Between January 1987 and September 1996 Using Single Count Data (N=52,627).
Table 8. Ordinary Least Squares Regression Estimates Predicting Sentence Length in
Months Between January 1987 and September 1996 Among Individuals Convicted of Person Offenses Using Single Count Data (N=15,112).
Table 9. Ordinary Least Squares Regression Estimates Predicting Sentence Length in
Months Between January 1987 and September 1996 Among Individuals Convicted of Drug Offenses Using Single Count Data (N=27,589).
Table 10. Ordinary Least Squares Regression Estimates Predicting Sentence Length in
Months Between January 1987 and September 1996 Among Individuals Convicted of Property Offenses Using Single Count Data (N=9,926).
Table 11. Logistic Regression Estimates Predicting the Incarceration Decision Between
January 1987 and September 1996 Using Single Count Data Among Sentences Consistent with the Sentencing Guidelines (N=41,610).
LIST OF TABLES

iv
Table 12. Comparison of Incarceration Decision (Y/N) Among White Defendants Convicted
of Drug Offenses and Sentenced in Compliance with the Sentencing Guidelines.
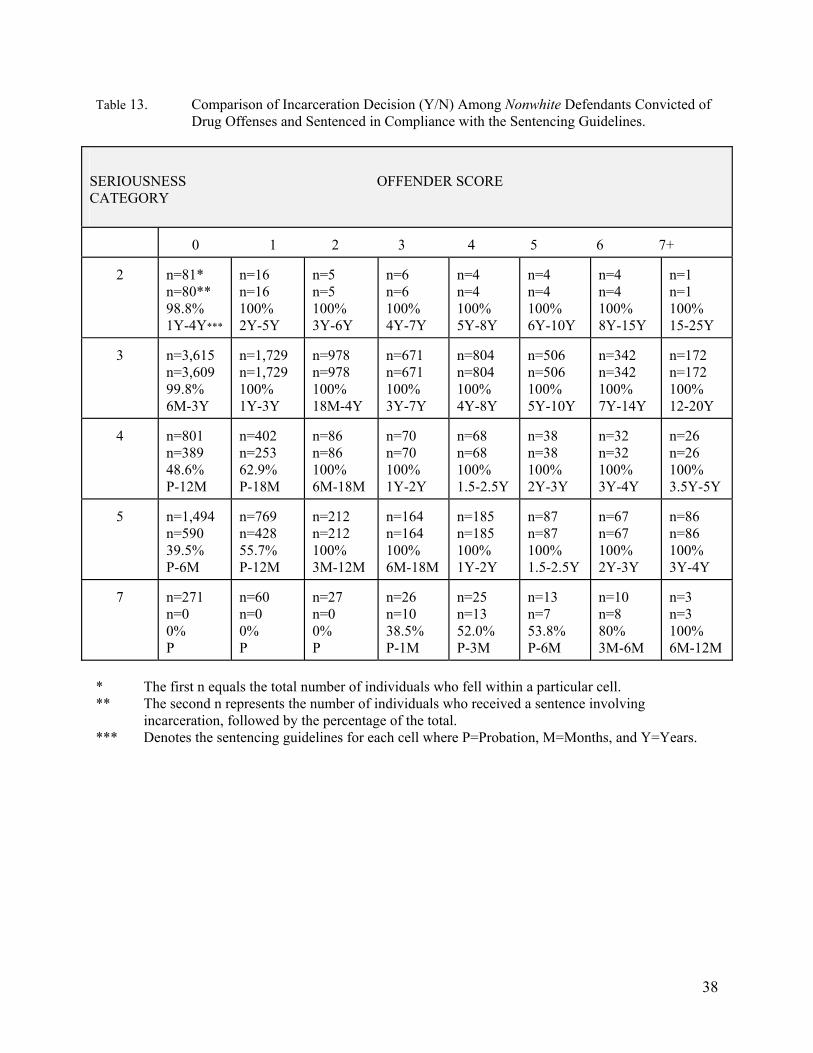
Table 13. Comparison of Incarceration Decision (Y/N) Among Nonwhite Defendants Convicted of Drug Offenses and Sentenced in Compliance with the Sentencing Guidelines.
Table 14. Ordinary Least Squares Regression Estimates Predicting Sentence Length
Between January 1987 and September 1996 Among Sentences Consistent with the Sentencing Guidelines Using Single Count Data (N=29,153).
Table 15. Logistic Regression Estimates Predicting the Incarceration Decision Between
January 1987 and September 1996 Using Single Count Data Among Sentences Inconsistent with the Sentencing Guidelines (N=34,348).
Table 16. Ordinary Least Squares Regression Estimates Predicting Sentence Length
Between January 1987 and September 1996 Among Sentences Inconsistent with the Sentencing Guidelines Using Single Count Data (N=23,473).

v
LIST OF FIGURES Figure 1. Predicted Probability of Incarceration for a Hypothetical Individual with Mean
Values on All Variables Except Race. Figure 2. Predicted Probability of Incarceration for a Hypothetical Individual with Mean
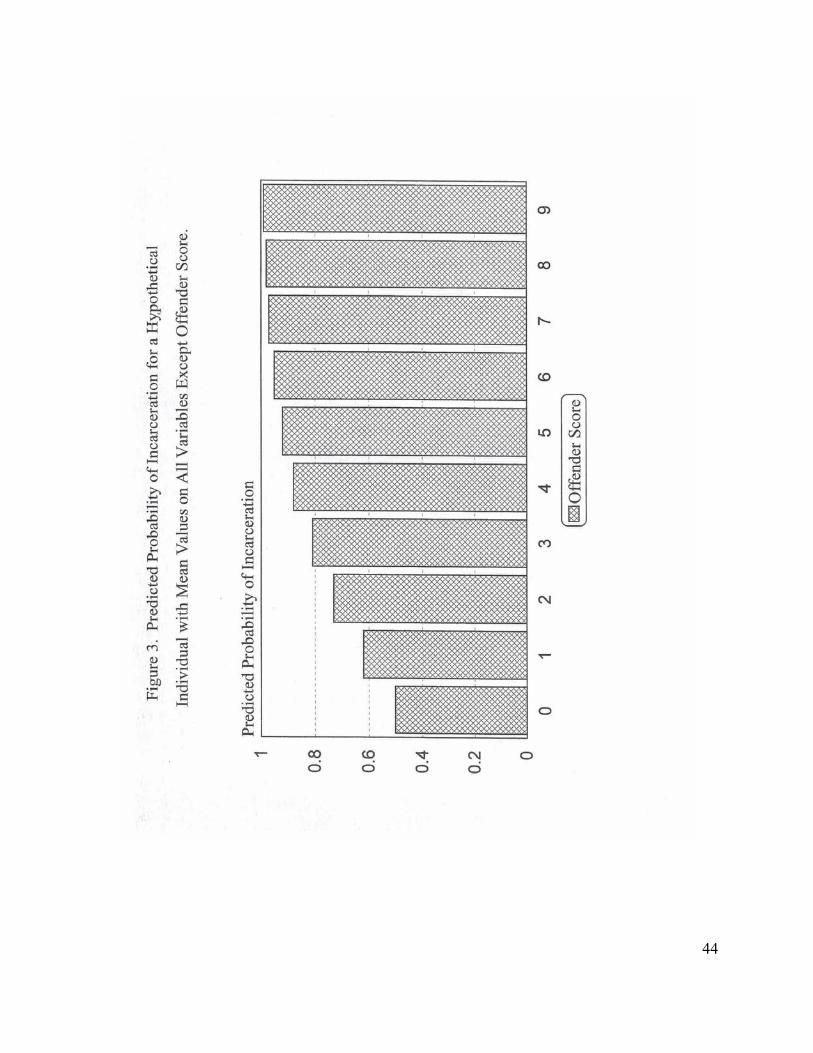
Values on All Variables Except Race. Figure 3. Predicted Probability of Incarceration for a Hypothetical Individual with Mean
Values on All Variables Except Offender Score. Figure 4. Predicted Probability of Incarceration for a Hypothetical Individual with Mean
Values on All Variables Except Offense Score.
1
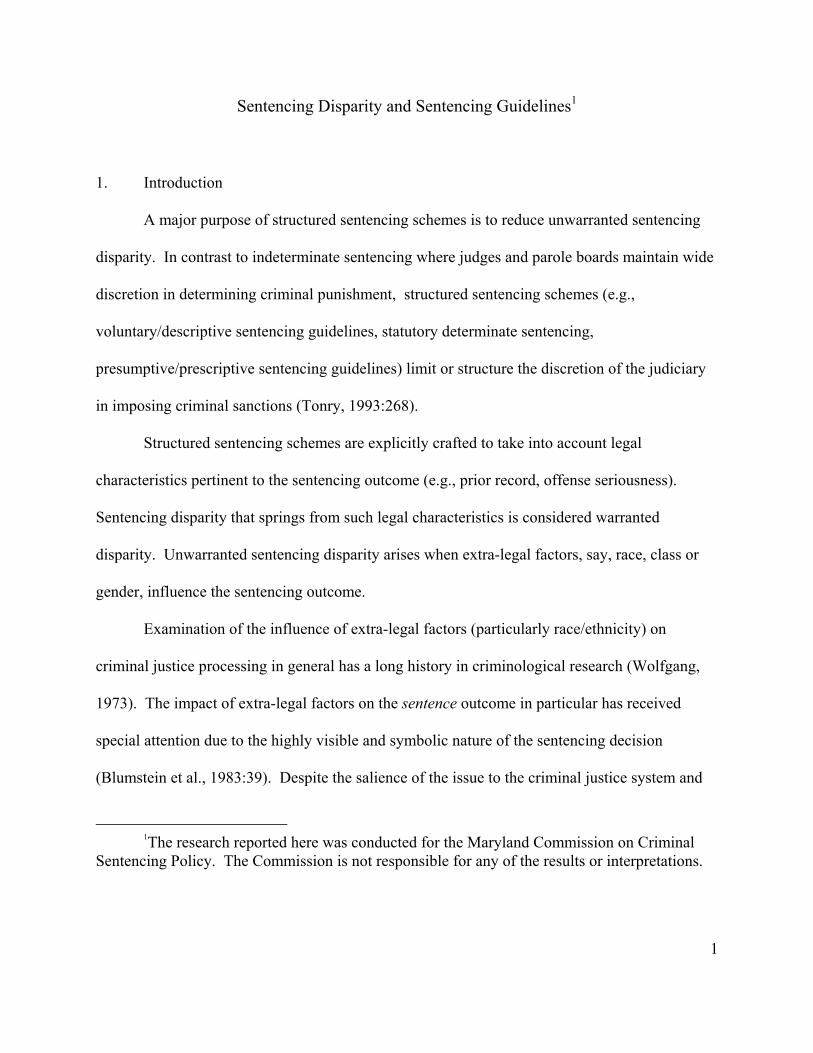
Sentencing Disparity and Sentencing Guidelines1
1. Introduction
A major purpose of structured sentencing schemes is to reduce unwarranted sentencing
disparity. In contrast to indeterminate sentencing where judges and parole boards maintain wide
discretion in determining criminal punishment, structured sentencing schemes (e.g.,
voluntary/descriptive sentencing guidelines, statutory determinate sentencing,
presumptive/prescriptive sentencing guidelines) limit or structure the discretion of the judiciary
in imposing criminal sanctions (Tonry, 1993:268).
Structured sentencing schemes are explicitly crafted to take into account legal
characteristics pertinent to the sentencing outcome (e.g., prior record, offense seriousness).
Sentencing disparity that springs from such legal characteristics is considered warranted
disparity. Unwarranted sentencing disparity arises when extra-legal factors, say, race, class or
gender, influence the sentencing outcome.
1The research reported here was conducted for the Maryland Commission on Criminal
Sentencing Policy. The Commission is not responsible for any of the results or interpretations.
Examination of the influence of extra-legal factors (particularly race/ethnicity) on
criminal justice processing in general has a long history in criminological research (Wolfgang,
1973). The impact of extra-legal factors on the sentence outcome in particular has received
special attention due to the highly visible and symbolic nature of the sentencing decision
(Blumstein et al., 1983:39). Despite the salience of the issue to the criminal justice system and
2
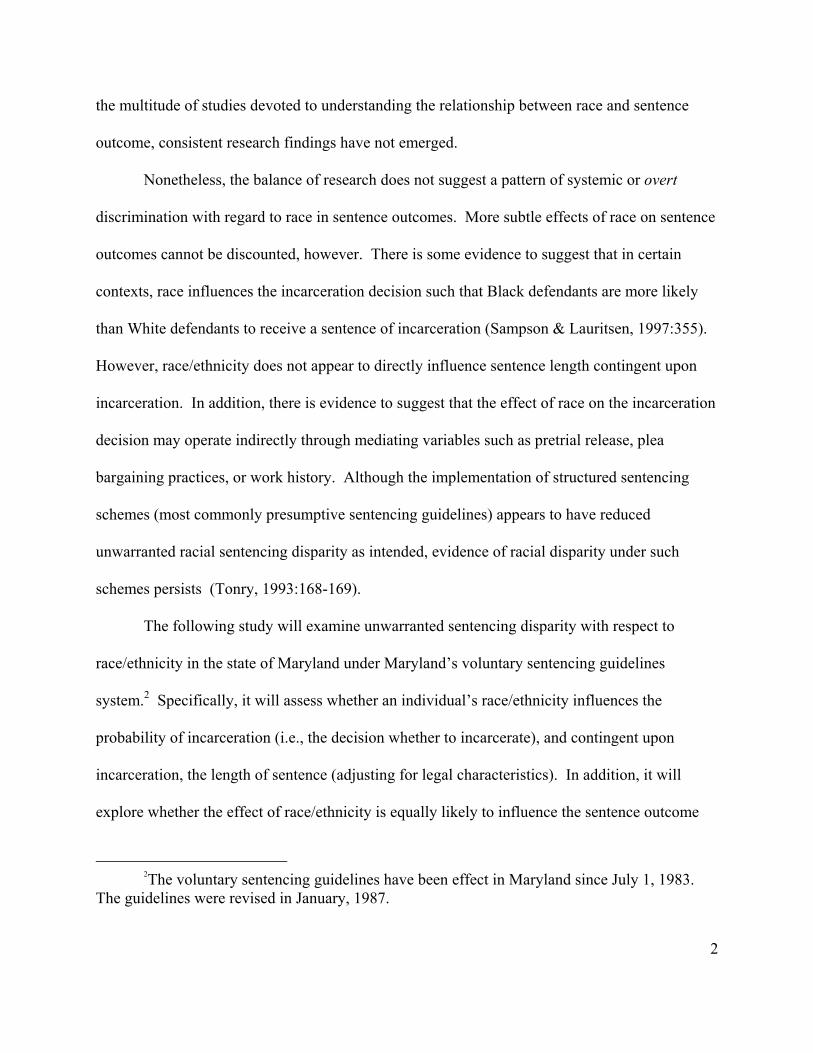
the multitude of studies devoted to understanding the relationship between race and sentence
outcome, consistent research findings have not emerged.
Nonetheless, the balance of research does not suggest a pattern of systemic or overt
discrimination with regard to race in sentence outcomes. More subtle effects of race on sentence
outcomes cannot be discounted, however. There is some evidence to suggest that in certain
contexts, race influences the incarceration decision such that Black defendants are more likely
than White defendants to receive a sentence of incarceration (Sampson & Lauritsen, 1997:355).
However, race/ethnicity does not appear to directly influence sentence length contingent upon
incarceration. In addition, there is evidence to suggest that the effect of race on the incarceration
decision may operate indirectly through mediating variables such as pretrial release, plea
bargaining practices, or work history. Although the implementation of structured sentencing
schemes (most commonly presumptive sentencing guidelines) appears to have reduced
unwarranted racial sentencing disparity as intended, evidence of racial disparity under such
schemes persists (Tonry, 1993:168-169).
The following study will examine unwarranted sentencing disparity with respect to
race/ethnicity in the state of Maryland under Maryland’s voluntary sentencing guidelines
system.2 Specifically, it will assess whether an individual’s race/ethnicity influences the
probability of incarceration (i.e., the decision whether to incarcerate), and contingent upon
incarceration, the length of sentence (adjusting for legal characteristics). In addition, it will
explore whether the effect of race/ethnicity is equally likely to influence the sentence outcome
2The voluntary sentencing guidelines have been effect in Maryland since July 1, 1983.
The guidelines were revised in January, 1987.

3
among sentences that are consistent (or inconsistent) with the sentencing guidelines. The
sentence outcome of roughly 81,000 individuals convicted in Maryland Circuit Courts between
January, 1987 and September, 1996 will be analyzed.
2. Literature Review
2.1 Racial Disparity in Sentencing. The overrepresentation of minorities in prison
populations relative to their percentage of the U.S. population clearly raises the possibility of
unwarranted sentencing disparity.3 Whether the observed disproportionality in prison
populations stems from disproportional involvement of minorities in crime and/or to disparate or
discriminatory treatment by the criminal justice system has been the subject of considerable
debate (e.g., Crutchfield, 1994:166-167).
While the vast majority of sentencing research examines the correlation between
race/ethnicity and sentencing outcome at the individual level, another approach assesses
disproportionality in imprisonment by comparing aggregate Uniform Crime Report (UCR) arrest
statistics and imprisonment rates by race. For example, Blumstein (1982) compared official
UCR arrest statistics and imprisonment rates at the national level and found that 80% of the
racial disproportionality in prisons in 1974 and 1979 appeared to be explained by disproportional
involvement of minorities in crime.
3A prison sentence is clearly the culmination of a series of criminal justice system
decisions.
Crutchfield et al. (1994:173) replicated Blumstein’s approach using data collected in

4
1982 and found that 90% of the racial disproportionality in prisons nationwide may be attributed
to disproportional minority involvement in crime. Crutchfield et al. (1994:175) then extended
the analysis one step further by examining state level statistics. The state-level analysis revealed
considerable variation in patterns of imprisonment. In some states, for example, racial
disproportionality in imprisonment appeared to be entirely explained by disproportionate
involvement in crime (i.e., arrest rates), whereas in other states less than sixty percent of the
disproportionality in imprisonment was similarly explained. The Crutchfield et al. (1994:175)
analysis revealed that approximately 66% of the imprisonment disparity in the state of Maryland
in 1982 was explained by differences in rates of arrest for Whites and Nonwhites.
The most common form of sentencing disparity research examines the relationship
between race/ethnicity and sentence outcome at the individual level. However, distinguishing
the unique effect of extra-legal factors such as race on sentencing outcomes has proven to be a
formidable methodological task. Research efforts suffer from omitted variable bias or
measurement error (where variables relevant to the explanation of the sentence outcome which
are also associated with race are either excluded from explanatory models or inadequately
measured, thereby biasing the effect of race on the sentence outcome) (Blumstein et al.,
1983:16). Sample selection bias also presents a problem in estimating the effect of race on
sentence outcome when unobserved, nonrandom screening processes which occur at earlier
decision-points in the criminal justice process (e.g., arrest or charging decisions) and are also
associated with race are not taken into account (Klepper et al., 1983:64-65).
Over the last 60 years, four “Waves” of this line of sentencing research have been
identified (distinguished mainly by methodological advances) (Zatz, 1987:71-81). The earliest

5
research (Wave 1) on the relationship between race and sentencing revealed that race exerted a
significant effect on sentence outcome. Wave I research (1930s-mid-1960s), however, is suspect
because it generally failed to control for relevant legal factors associated with the sentencing
outcome (e.g., prior record). The second Wave of research (late 1960s-1970s) employed
controls for legal factors such as prior record. Reviews of Wave II research (e.g., Hagan, 1974;
Kleck, 1981) suggested that the apparent effect of race on sentencing outcome was largely an
artifact of the failure in prior research to control for legally relevant variables (in particular, prior
record). Thus, Wave II research appeared to advance what has been dubbed the “no
discrimination thesis” (NDT), although it did in fact draw attention to the possibility of indirect
or interactive effects of race on sentence outcome.
Wave III research (1970s-1980s) is characterized by the use of more sophisticated
statistical techniques intended to adjust for “selection bias” and “omitted variable bias.” Wave
III research also explored the possibility of indirect effects of race on sentencing (e.g., race
affects pretrial release status which in turn influences sentence) or interaction effects (e.g., the
effect of race on sentencing varies depending on whether an individual has a prior record). Such
research, for example, suggested that Blacks in some jurisdictions may be less likely to plead
guilty which in turn affects the incarceration decision (Welch et al., 1985:73). Although Wave
III research did not yield consistent findings, importantly it called the NDT into question. As
Sampson & Lauritsen (1997:348) explain it suggested that “there is some discrimination, some of
the time, in some places.”
Wave IV research began in the 1980s and continues into the present. Wave IV may be
distinguished from Wave III not necessarily by methodological advances but by the advent of
6
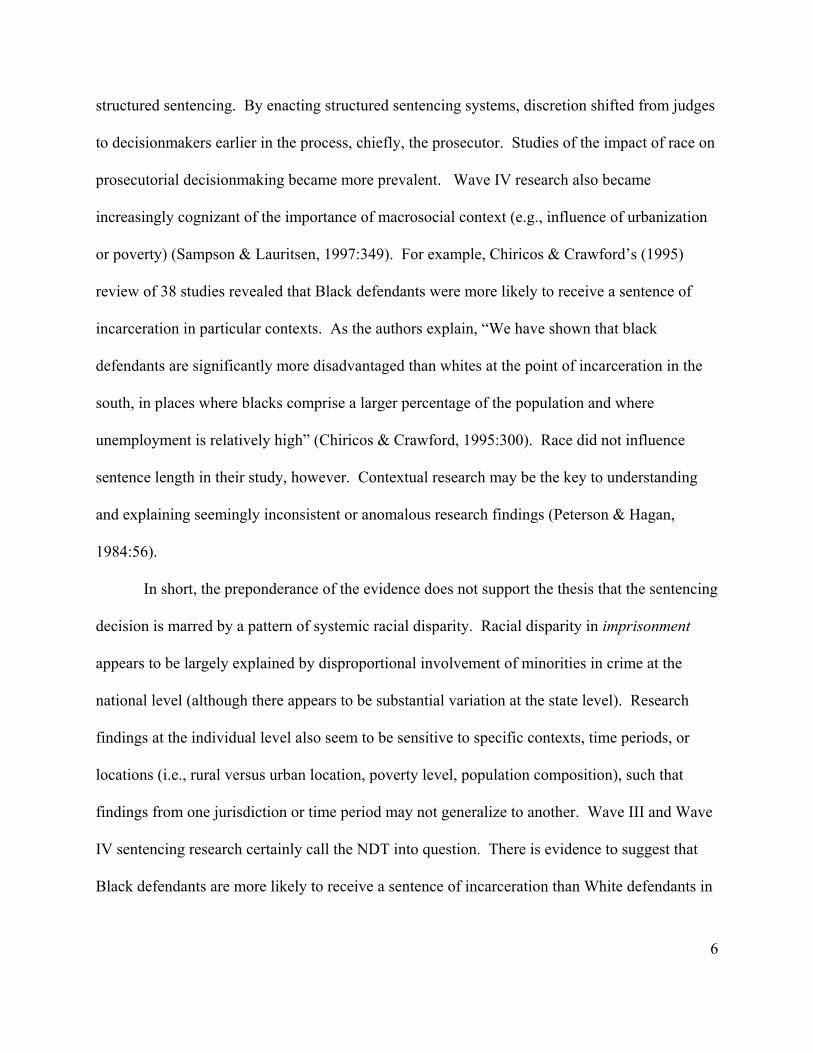
structured sentencing. By enacting structured sentencing systems, discretion shifted from judges
to decisionmakers earlier in the process, chiefly, the prosecutor. Studies of the impact of race on
prosecutorial decisionmaking became more prevalent. Wave IV research also became
increasingly cognizant of the importance of macrosocial context (e.g., influence of urbanization
or poverty) (Sampson & Lauritsen, 1997:349). For example, Chiricos & Crawford’s (1995)
review of 38 studies revealed that Black defendants were more likely to receive a sentence of
incarceration in particular contexts. As the authors explain, “We have shown that black
defendants are significantly more disadvantaged than whites at the point of incarceration in the
south, in places where blacks comprise a larger percentage of the population and where
unemployment is relatively high” (Chiricos & Crawford, 1995:300). Race did not influence
sentence length in their study, however. Contextual research may be the key to understanding
and explaining seemingly inconsistent or anomalous research findings (Peterson & Hagan,
1984:56).
In short, the preponderance of the evidence does not support the thesis that the sentencing
decision is marred by a pattern of systemic racial disparity. Racial disparity in imprisonment
appears to be largely explained by disproportional involvement of minorities in crime at the
national level (although there appears to be substantial variation at the state level). Research
findings at the individual level also seem to be sensitive to specific contexts, time periods, or
locations (i.e., rural versus urban location, poverty level, population composition), such that
findings from one jurisdiction or time period may not generalize to another. Wave III and Wave
IV sentencing research certainly call the NDT into question. There is evidence to suggest that
Black defendants are more likely to receive a sentence of incarceration than White defendants in

7
certain contexts (Chiricos & Crawford, 1995:300; Spohn et al., 1981:86). Evidence also
suggests that race may have an indirect effect on the incarceration decision.
2.2 Sentencing Guidelines & Racial Disparity in Sentencing.
Structured sentencing schemes were implemented in response to the growing
disillusionment with indeterminate sentencing in the late 1970s and 1980s. Disillusionment
with indeterminate sentencing sprang from a number of sources including, for example, the
desire to limit discretion and demand accountability from public officials, the shift from
utilitarian to retribuvist philosophies, growing skepticism regarding the efficacy of rehabilitation
programs, and findings of racial disparity (Blumstein et al., 1983: 61-66). As Blumstein et al.
(1983:61) report between 1975 and January 1982, “11 states abolished parole release for the
majority of offenders, 17 states established administrative rules for release decisions (e.g., parole
guidelines), more than 30 states passed mandatory minimum sentence laws, and, in almost every
state, judges experimented with guidelines to structure their own sentencing decisions.”
Voluntary sentencing guidelines were one of the forerunners of structured sentencing
schemes (Tonry, 1988:276). As the name suggests, judges are not required by law to comply
with voluntary sentencing guidelines and as a consequence defendants do not possess a right to
be sentenced according to the guidelines. Generally instituted by judges, voluntary sentencing
guidelines are by and large descriptive in nature. In other words, they are expected to serve as a
model of past sentencing behavior (Blumstein et al., 1983:135). Presumptive sentencing
guidelines, on the other hand, possess legal authority since they are mandated statutorily and are
subject to appellate sentence review. Judges are expected to sentence according to the guidelines
or provide an explanation for noncompliance. Presumptive sentencing guidelines are generally
8
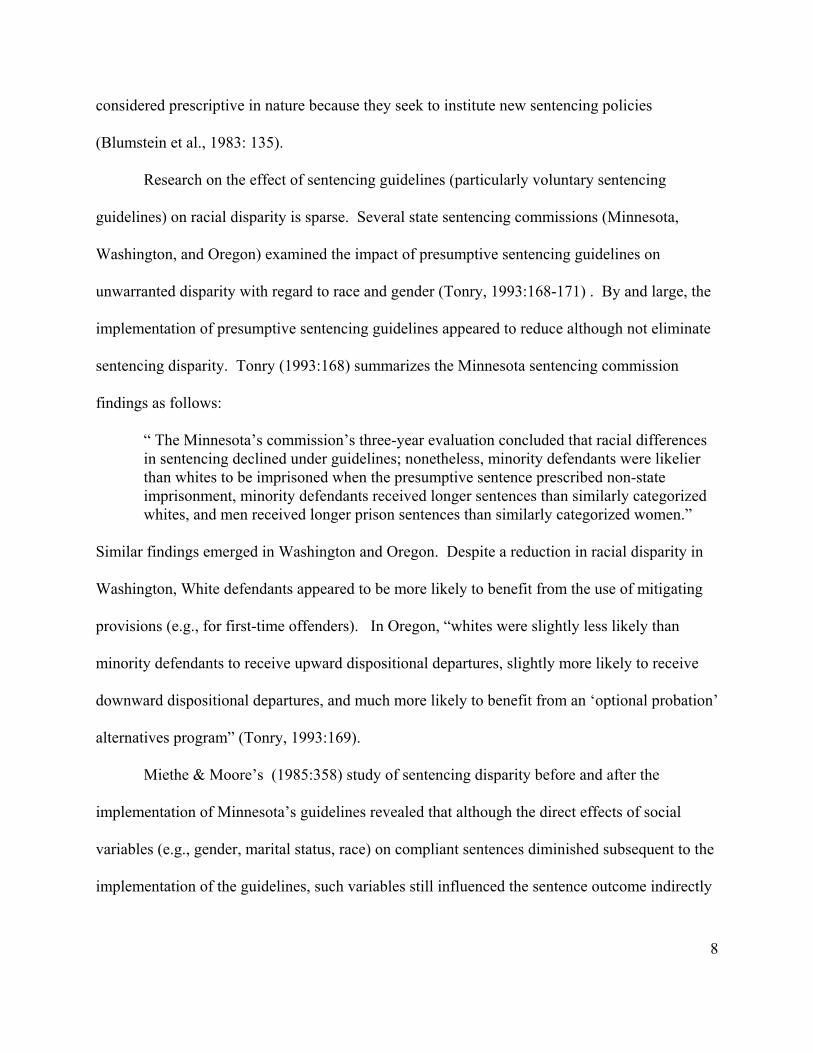
considered prescriptive in nature because they seek to institute new sentencing policies
(Blumstein et al., 1983: 135).
Research on the effect of sentencing guidelines (particularly voluntary sentencing
guidelines) on racial disparity is sparse. Several state sentencing commissions (Minnesota,
Washington, and Oregon) examined the impact of presumptive sentencing guidelines on
unwarranted disparity with regard to race and gender (Tonry, 1993:168-171) . By and large, the
implementation of presumptive sentencing guidelines appeared to reduce although not eliminate
sentencing disparity. Tonry (1993:168) summarizes the Minnesota sentencing commission
findings as follows:
“ The Minnesota’s commission’s three-year evaluation concluded that racial differences in sentencing declined under guidelines; nonetheless, minority defendants were likelier than whites to be imprisoned when the presumptive sentence prescribed non-state imprisonment, minority defendants received longer sentences than similarly categorized whites, and men received longer prison sentences than similarly categorized women.”
Similar findings emerged in Washington and Oregon. Despite a reduction in racial disparity in
Washington, White defendants appeared to be more likely to benefit from the use of mitigating
provisions (e.g., for first-time offenders). In Oregon, “whites were slightly less likely than
minority defendants to receive upward dispositional departures, slightly more likely to receive
downward dispositional departures, and much more likely to benefit from an ‘optional probation’
alternatives program” (Tonry, 1993:169).
Miethe & Moore’s (1985:358) study of sentencing disparity before and after the
implementation of Minnesota’s guidelines revealed that although the direct effects of social
variables (e.g., gender, marital status, race) on compliant sentences diminished subsequent to the
implementation of the guidelines, such variables still influenced the sentence outcome indirectly
9
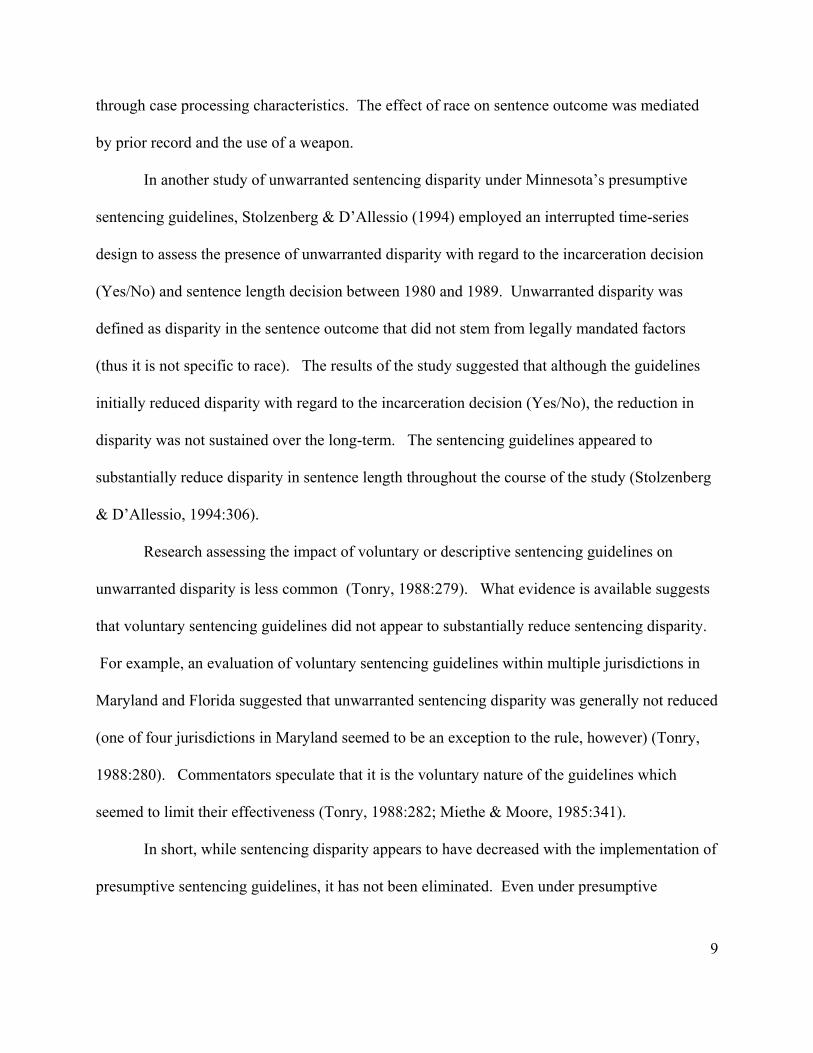
through case processing characteristics. The effect of race on sentence outcome was mediated
by prior record and the use of a weapon.
In another study of unwarranted sentencing disparity under Minnesota’s presumptive
sentencing guidelines, Stolzenberg & D’Allessio (1994) employed an interrupted time-series
design to assess the presence of unwarranted disparity with regard to the incarceration decision
(Yes/No) and sentence length decision between 1980 and 1989. Unwarranted disparity was
defined as disparity in the sentence outcome that did not stem from legally mandated factors
(thus it is not specific to race). The results of the study suggested that although the guidelines
initially reduced disparity with regard to the incarceration decision (Yes/No), the reduction in
disparity was not sustained over the long-term. The sentencing guidelines appeared to
substantially reduce disparity in sentence length throughout the course of the study (Stolzenberg
& D’Allessio, 1994:306).
Research assessing the impact of voluntary or descriptive sentencing guidelines on
unwarranted disparity is less common (Tonry, 1988:279). What evidence is available suggests
that voluntary sentencing guidelines did not appear to substantially reduce sentencing disparity.
For example, an evaluation of voluntary sentencing guidelines within multiple jurisdictions in
Maryland and Florida suggested that unwarranted sentencing disparity was generally not reduced
(one of four jurisdictions in Maryland seemed to be an exception to the rule, however) (Tonry,
1988:280). Commentators speculate that it is the voluntary nature of the guidelines which
seemed to limit their effectiveness (Tonry, 1988:282; Miethe & Moore, 1985:341).
In short, while sentencing disparity appears to have decreased with the implementation of
presumptive sentencing guidelines, it has not been eliminated. Even under presumptive
10
sentencing guidelines, White defendants appear to be more likely to benefit from sentencing
alternatives.
3. Methods
3.1 Data.
In order to investigate the possibility of unwarranted sentencing disparity under
Maryland’s voluntary sentencing guidelines, the population of persons (N=80,608) convicted of
a single offense in a Maryland Circuit Court between January, 1987 and September, 1996 were
analyzed. The database was provided by the Maryland Administrative Office of the Courts to
the University of Maryland Center for Applied Policy Studies. The data were extracted from
courtroom worksheets which are routinely completed by court clerks at each circuit court. The
accuracy of the database was verified using random samples drawn from the total database.
The database contains attributes of the offense and offender, as well as case-processing
characteristics. Offender attributes include basic demographic characteristics such as sex,
race/ethnicity, and age as well as an offender score summarizing an individual’s prior record.
Offense attributes include offense type and an offense seriousness score. Offenses are
categorized into person, property, or drug offenses since a separate sentencing matrix is used for
each crime category. Case processing characteristics include mode of disposition and Circuit
Court. Mode of disposition consists of the following: (1) plea agreement; (2) plea, no
agreement; (3) jury trial; and (4) court trial.
Variables specific to the Maryland sentencing guidelines include the offense score and
the offender score. These variables are of particular importance to the study since prior research
indicates that offense seriousness and prior record are the most influential factors in determining
11
sentence outcomes (Blumstein et al., 1983:11). The Offense score provides a measure of the
seriousness of the offense. The Offender score provides a summary measure of an individual’s
prior record.
The database also contains the sentence outcome for each individual. Data describing the
sentence outcomes included, for example, whether an individual received a sentence involving
incarceration and the length of that sentence (e.g., incarceration time, suspended time, actual
time). If an individual was not sentenced to incarceration, the length of the probation term and
whether a fine was imposed were also available. Lastly, data regarding whether the sentencing
judge complied with the sentencing guidelines were documented.
3.1.1. Missing-Data Values. Missing-data values did not pose a serious problem.
Missing-data values were most prevalent among demographic variables. The percentage of
missing-data values for each variable, however, did not exceed 3%. For example, 2.3% of the
sample were missing age, 2.0% were missing race, 0.7% were missing sex. The most commonly
missing case processing variable was disposition type (1.2%). As a consequence, missing data-
values were assumed to be “missing at random” and cases with missing data-values were
excluded from the analyses. Missing data-values are considered to missing at random if the
probability that they are missing is independent of the true value of the incompletely observed
variable (Little, 1992:1229).
3.1.2. Sample Characteristics. Roughly, 81,000 individuals had been convicted of a
single offense between January 1, 1987 and September 30, 1996 in one of eight Maryland circuit
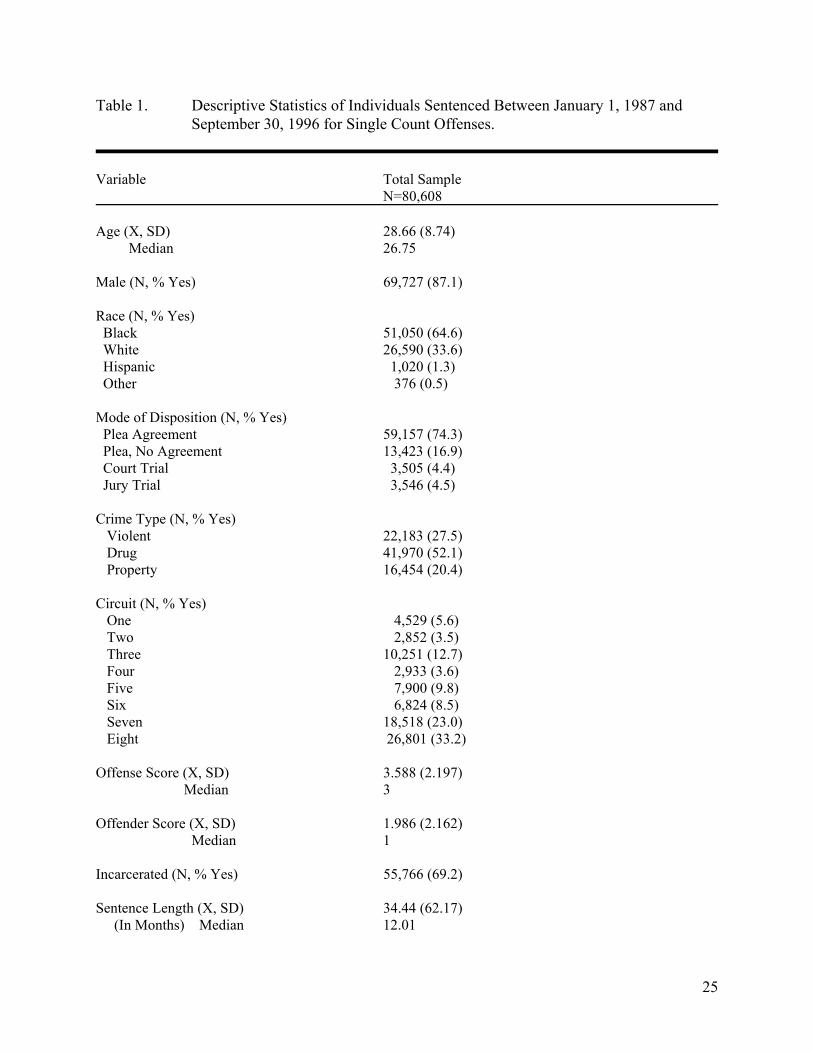
courts. Descriptive statistics are shown in Table 1. The percentage of persons convicted of an
offense each year was similar over the course of the evaluation although a slightly smaller
12
percentage of the sample had been sentenced during calendar year 1986 (8%) or 1987 (9%), as
compared to calendar years 1988 through 1995 (11%). Over half of the defendants had been
processed in three of the eight Maryland Circuits: (1) Circuit three (13%); (2) Circuit seven
(23%); and (3) Circuit eight (33%).4
Convicted defendants were 29 years of age on average. Roughly 87% were male. Sixty-
five (65%) of the defendants were Black, 34% were White, 1.3% were Hispanic, and 0.5% had
been classified as “other.”
The most common mode of disposition was a plea agreement (74.3%) followed by a plea
without agreement (16.9%), and either court or jury trials (8.9%). Just over half of the sample
had been convicted of a drug offense (52.1%). Conviction of a violent offense was second most
common (28%) followed by a property offense (20%).
Approximately, 69% of the sample received a sentence involving a term of incarceration.
The average length of incarceration (actual sentence) was 34 months (median of 12 months).
Approximately, 55% of the sentences imposed were consistent with the Maryland sentencing
guidelines. Among sentences that were not consistent with the guidelines, 38% fell under the
guideline recommendation and 8% exceeded the guideline recommendation.
3.2 Analytic Strategy
4Circuit three consists of the following counties: Baltimore county and Harford counties.
Circuit seven consists of Calvert county, Charles county, Prince George’s county, and St. Mary’s county. Circuit eight consists solely of Baltimore city.

13
A sentence outcome consists of two separate decisions: (1) the decision whether to
incarcerate; and (2) the decision as to the length of incarceration. As noted in Section 2., prior
research suggests that the factors that influence each decision are not necessarily synonymous.
Therefore, each decision will be analyzed separately here.
Logistic regression models will be estimated to examine the effect of legal and extra-
legal factors on the incarceration decision (Yes/No). Logistic regression is commonly used to
analyze the relationship between a set of explanatory variables and a binary outcome. Logistic
regression is based on the cumulative logistic probability function which relates probabilities of
the dependent variable to the explanatory variables (Hanushek & Jackson, 1977:187). The
logistic transformation of the dependent variable represents the logarithm of the odds of an event
occurring (Pindyck & Rubinfeld, 1991:259). Ordinary least squares (OLS) regression will be
used to assess the influence of legal and extra-legal factors on sentence length (among
individuals who have been sentenced to a term of incarceration). Since each person included in
the model has a non-zero sentence length, the dependent variable will be truncated at zero.
Regression models will be estimated first using the total sample. Since the Maryland
sentencing guidelines utilize separate matrices for each crime type and the offense seriousness
measure (a primary determinant of sentence outcome) varies slightly across crime categories, a
crime-specific approach will also be adopted whereby separate models will be estimated for
person, drug, and property offenses. The crime-specific approach will allow us to assess
whether there is an interaction between crime type and race. That is, whether sentencing
disparity with regard to race is more or less likely within certain categories of crime.
Lastly, additional models will be estimated in order to determine whether the effect of

14
race differs depending on whether the imposed sentence was consistent or inconsistent with the
sentencing guidelines. Models will be estimated to assess the effect of race on both the
incarceration decision and sentence length among only those sentences that were consistent with
the sentencing guidelines. Similarly, models will be estimated to examine the effect of race
among only those sentences that were inconsistent with the sentencing guidelines.
The regression analyses rest on the assumption that the regression model has been
correctly specified -- that is, that all relevant variables associated with the sentencing decision
are included in the model. It also rests on the assumption that key constructs such as offense
seriousness have been adequately measured. To the extent that our models exclude variables
that affect the sentencing outcome or provide only partial measures of such constructs, they may
be vulnerable to omitted variable bias or measurement error. If the omitted variables (or
inadequately measured variables) are associated with both race and the sentencing outcome, the
estimate of the effect of race on sentencing may be biased. As a consequence, the results of the
analyses must be interpreted with caution.
3.3 Measures
3.3.1 Dependent Variables. The first dependent variable of interest will be whether an
individual received a sentence that involved a term of incarceration independent of the length of
sentence. A binary indicator will be created whereby an individual receives a code of 1 if they
are sentenced to a term of incarceration and a 0 otherwise.
The second dependent variable will consist of the length of incarceration measured in
months contingent on being sentenced to prison. Therefore only individuals who receive a term

15
of incarceration will be included in the analysis. Length of incarceration represents the actual
time an individual is expected to serve (i.e., total sentence length less suspended time).
3.3.2 Independent Variables. The independent or explanatory variables included in the
regression models are shown below. Variable attributes are illustrated in Table 2.
Age Race Sex Type of Offense Mode of Disposition Offense Score Offender Score Circuit
Explanatory variables have been constructed as follows: (1) age is measured in years as a
continuous variable; (2) race is measured as a set of binary indicators (coded 1 or 0) for each
race/ethnicity (Black, White, Hispanic, and “Other”); (3) sex is represented by a binary measure
(Male=1; Female=0); (4) disposition type consists of binary measures coded 1 or 0 for each
disposition type (plea agreement, plea without agreement, court trial, and jury trial); and (5)
circuit consists of a set of binary measures coded 1 or 0 to represent each circuit.
The measure of offense seriousness varies across crime categories since it was
specifically created for use with the person offense matrix of the sentencing guidelines. For
person offenses, it combines the seriousness category of the offense (which is statutorily
determined) with three indicators of the nature of the offense (i.e., whether the victim was
injured, whether a weapon was used, and whether the victim was especially vulnerable). The
Offense score ranges from 1 to 15 (15 is the most serious offense score). Since information
regarding victim injury, etc. is not generalizable to drug and property offenses, the seriousness
16
category of each offense was used as a measure of offense seriousness. The seriousness category
is one component of the offense score for person offenses. Thus, it is a comparable, though not
identical measure.5
The Offender score provides a summary measure of an individual’s prior record. It
consists of the following factors: (1) whether the individual was involved with the criminal
justice system at the time of the instant offense (0=no/1=yes); (2) juvenile record (0=not more
than one finding of delinquency, 1=two or more findings without commitment or one
commitment, 2=two or more commitments); (3) prior adult record (0=none, 1=minor,
2=moderate, 3=major); (4) prior adult parole/probation violations (0=no, 1=yes). The Offender
score ranges from 0 to 9 with a score of 9 representing the most serious Offender score.
4. Results
4.1 The Incarceration Decision
Logistic regression models were estimated to examine the effect of legal and extra-legal
factors on the incarceration decision using the SAS System (SAS, 1990). The results of analyses
using the total sample are shown in Table 3.
5Note that for drug and property offenses, the seriousness category was converted to a
point score identical to the point score conversion used for person offenses.
Adjusting for the influence of legally relevant factors race exerted a positive and
statistically significant effect on the incarceration decision. Both Black and Hispanic offenders
were more likely to receive a sentence of incarceration than White offenders. The predicted

17
probability of incarceration is shown in Figure 1. The predicted probability of incarceration for
White defendants with mean/median values on all other explanatory variables included in the
model was π=0.56. In comparison, the predicted probability of incarceration for Black
defendants was π=.65 and the predicted probability of incarceration for Hispanic defendants was
π=0.77. Figure 2 illustrates the predicted probability of incarceration when Black, Hispanic, and
individuals classified as “Other race” are combined into one category. The predicted probability
of incarceration for White defendants is π=0.56, whereas the predicted probability of
incarceration for Nonwhite defendants is π=0.65. Due to the relatively small sample size of
Hispanic and “other” individuals, the predicted probabilities mirror the predicted probabilities of
White and Black offenders when each race/ethnicity is modeled separately.
As expected, both the Offense score and Offender score exerted a strong, positive effect
on the incarceration decision. The more serious the offense or the more serious an individual’s
prior record, the greater the probability of an incarceration sentence. Figures 3 and 4 illustrate
the predicted probability of incarceration for each level of the Offender score (0-9) and each
level of the Offense score (1-15), with all other explanatory variables held constant at their mean
or median value.6,7 As illustrated in Figure 3, the predicted probability of incarceration for an
individual with an Offender score of zero equals π=0.5. As the Offender score approaches 9, the
6Note that due to the skewed distribution of the Offense score and Offender score, the
median value was used instead of the mean.
7The logistic regression function was used to calculate the predicted probability of incarceration (King, 1989:104-105). The predicted probability of incarceration refers to a hypothetical individual characterized by average levels of all explanatory variables in the model except Offense score or Offender score (which were allowed to vary over their range).

18
predicted probability of incarceration is virtually π=1.0. Similarly, the predicted probability of
incarceration for an individual with an Offense score of one and mean or median value on all
other variables included in the model is less than π=0.5. The predicted probability of individuals
with an Offense score of 6 or more exceeds π=0.8 (see Figure 4). Examination of other variables
included in the model suggested the following: (1) males were significantly more likely to be
incarcerated than females; (2) older individuals were less likely to be incarcerated than younger
individuals; and (3) individuals who were convicted subsequent to a plea agreement, or plea
without agreement, or a court trial were significantly less likely to be incarcerated than
individuals who were convicted by means of a jury trial.
4.1.1. Crime Category-Specific Approach. In addition to the total analysis, the effect of
race on the incarceration decision was examined within each crime category. The results are
shown in Tables 4-6. By and large, the effect of race on incarceration did not vary dramatically
among crime categories. The magnitude of the effect did appear to be stronger among
individuals convicted of drug offenses.8 The only other notable difference among the models
was related to disposition type. Disposition type did not appear to influence the incarceration
decision among property offenders.
4.2 Sentence Length
OLS regression models were estimated to assess the influence of race on sentence length.
Regression estimates using the total sample are shown in Table 7. Overall, the results of the
8Note, however, that race-by-crime type interaction effects did not contribute
significantly to the total model.
19
analysis were similar to the logistic model predicting the incarceration decision. Notably,
however, race did not exert a statistically significant effect on sentence length.
Offense score and Offender score exerted a positive and statistically significant on
sentence length. Males received longer sentences than females. Here, however, older
individuals received longer sentences than younger individuals. Individuals who were
adjudicated by means of a plea agreement, plea without agreement, or court trial received shorter
sentences than individuals who were adjudicated by means of a jury trial.
4.2.1. Crime Category-Specific Approach. The OLS regression models were estimated
separately within each crime category. The results of the analyses are shown in Tables 8-10.
Examination of the effect of race on sentence length within each crime category revealed that
race exerted a significant effect among persons convicted of drug offenses only. Race did not
influence sentence length among persons convicted of person or property offenses.
Variables that exerted statistically significant effects on sentence length across all three
crime categories included the Offense score, Offender score, and disposition type. While males
were more likely than females to receive longer sentences in person and drug offenses, male and
female property offenders appeared to receive sentences of equal lengths. Lastly, while older
individuals were more likely to receive longer sentences among person and property offenses, an
individual’s age did not influence sentence length if convicted of a drug offense.
4.3 Racial Disparity Among Consistent and Inconsistent Sentences
The total sample was divided into two subsamples: individuals who received sentences
that were consistent with the sentencing guidelines and individuals who received sentences that
20
were inconsistent with the sentencing guidelines (either above or below the suggested range).
Fifty-five percent of the total sample received sentences that were consistent with the sentencing
guidelines. Logistic and OLS regression equations were then estimated to assess the effect of
race on the incarceration decision (Y/N) and sentence length within each subsample. If
adherence to the sentencing guidelines reduces sentencing disparity by race, the effect of race in
this subsample would be expected to be negligible. Due to the relatively small sample size of
Hispanic and “other” defendants and to the inclusion of interaction effects, race/ethnicity was
collapsed into White versus Nonwhite (Black, Hispanic, and “Other”).
4.3.1. Consistent Subsample. Logistic regression equation were estimated to assess the
impact of race/ethnicity on the incarceration decision among individuals who received sentences
that were consistent with the sentencing guidelines. The full set of explanatory variables were
included in the model in addition to race-by-crime-category interaction effects. Race-by-crime
interaction effects were added because prior analyses suggested that the effect of race may vary
by crime type.
The parameter estimates are shown in Table 11. The results reveal that race exerted a
significant effect on the incarceration decision even among consistent sentences. The interaction
effect between race and crime category (particularly the drug crime category) also exerted a
strong statistically significant effect on the incarceration decision, suggesting that the effect of
race on the incarceration decision varied by crime category.
In order to further explore the suggestion of a race effect and a race-by-crime type
interaction effect, the percentage of White and Nonwhite defendants who fell within each cell of
the drug offense matrix and were incarcerated was examined (see Tables 12 and 13). Table 12

21
contains the percentage of White individuals who fell within each cell of the drug offense
sentencing matrix and received a sentence of incarceration. Table 13 contains the percentage of
Nonwhite individuals who fell within each cell of the drug offense sentencing matrix and
received a sentence of incarceration. Comparison of the percentage of White and Nonwhite
individuals within each cell of the drug offense sentencing matrix revealed that when judges
were given the option to impose either probation or a short term of incarceration, Nonwhite
offenders were more likely to receive a sentence involving incarceration than White offenders.
For example, 36% of White offenders who were convicted of a drug offense with a seriousness
category of four who had an Offender score of zero received a term of incarceration, whereas
49% of Nonwhite offenders who fell within the same cell of the sentencing matrix received a
sentence of incarceration. Thus, race appeared to influence the incarceration decision even
among sentences that were consistent with the guidelines. The magnitude of the effect was
particularly strong for drug offenses. Notably, among sentences that were consistent with the
guidelines, mode of disposition did not exert a significant influence on the incarceration
decision.
With regard to sentence length among consistent cases, race appeared to have a slight
direct effect on sentence length (see Table 14). The interaction effect between race and drug
crime category also exerted a statistically significant effect on sentence length. Examination of
the mean and median sentence length within each cell of the drug offense matrix for White and
Nonwhite defendants did not reveal substantively large differences, however.
4.3.2 Inconsistent Subsample. Logistic regression models were also estimated to
examine the impact of race among the subsample of individuals who received sentences that

22
were inconsistent with the sentencing guidelines (see Table 15). Again, the direct effect of race
on the incarceration decision was statistically significant. Inclusion of race-by-crime category
interaction effects failed to reveal a significant interaction between race and drug crime category.
The effect of race on sentence length among sentences that were not inconsistent with the
sentencing guidelines was marginal (see Table 16). The interaction effect between race and drug
crime category was not statistically significant among sentences that were inconsistent with the
guidelines.
4.4 Summary
In summary, examination of the effect of race on the incarceration decision using logistic
regression models suggested that race affects the probability of incarceration in a nontrivial
manner adjusting for the effect of legal characteristics. The predicted probability of
incarceration for White offenders holding all other explanatory variables constant at their
mean/median is π=0.56, whereas the predicted probability of incarceration for Nonwhite
offenders is π=0.65. The influence of race on the incarceration decision does not appear to vary
by crime type.
OLS regression models were used to examine whether race influences sentence length
contingent upon incarceration. Using the total sample, race did not appear to influence sentence
length adjusting for the effect of legally relevant variables (e.g., offense score, offender score,
crime type). However, the crime category-specific approach appeared to uncover an interaction
between crime category and race. Specifically, race appeared to influence the sentence length of
individuals convicted of drug offenses, but not the sentence length of individuals convicted of
23
person or property offenses.
The total sample of individuals was then subdivided into those individuals who received
sentences that were consistent with the sentencing guidelines and those individuals who received
sentences that were inconsistent with the sentencing guidelines. The results suggested that race
influenced the incarceration decision among consistent and inconsistent sentences. A significant
interaction effect between race and drug crime category further revealed that the magnitude of
the effect of race on the sentencing decision was greater among individuals convicted of drug
offenses and sentenced in compliance with the sentencing guidelines. Under this scenario,
Nonwhite offenders convicted of drug offenses were substantially more likely to receive short
terms of incarceration (rather than probation) than White offenders. The direct effect of race on
sentence length was small among both consistent and inconsistent sentences.
5. Conclusion
The results of the present study are largely consistent with prior research. Offense
seriousness and prior record were the most powerful predictors of sentence outcome. Race was
found to influence the incarceration decision net of legal factors in the total sample, but not
sentence length. Notably, the effect of race on sentence length varied by crime category. Black
and Hispanic defendants convicted of drug offenses were more likely to receive longer sentences
than White defendants. Furthermore, race influenced the incarceration decision regardless of
whether the sentence was consistent or inconsistent with the sentencing guidelines. The
magnitude of the effect of race on the incarceration decision was particularly strong among
individuals convicted of drug offenses and sentenced in compliance with the sentencing

24
guidelines.
These findings are also consistent with the emerging research on the effects of sentencing
guidelines. While such systems seem to reduce racial disparity in sentencing, they do not
eliminate it. When structured sentencing systems allow a choice between prison and an
alternative to prison, Black defendants are more likely to receive a prison sentence. In order to
eliminate this form of disparity, sentencing patterns will have to be constantly monitored. In
addition, it may be necessary to minimize the opportunity for judges to make such choices.
25
Table 1. Descriptive Statistics of Individuals Sentenced Between January 1, 1987 and September 30, 1996 for Single Count Offenses.
Variable Total Sample N=80,608 Age (X, SD) 28.66 (8.74) Median 26.75 Male (N, % Yes) 69,727 (87.1) Race (N, % Yes) Black 51,050 (64.6) White 26,590 (33.6) Hispanic 1,020 (1.3) Other 376 (0.5) Mode of Disposition (N, % Yes) Plea Agreement 59,157 (74.3) Plea, No Agreement 13,423 (16.9) Court Trial 3,505 (4.4) Jury Trial 3,546 (4.5) Crime Type (N, % Yes) Violent 22,183 (27.5) Drug 41,970 (52.1) Property 16,454 (20.4)
Circuit (N, % Yes) One 4,529 (5.6) Two 2,852 (3.5) Three 10,251 (12.7) Four 2,933 (3.6) Five 7,900 (9.8) Six 6,824 (8.5) Seven 18,518 (23.0) Eight 26,801 (33.2) Offense Score (X, SD) 3.588 (2.197) Median 3 Offender Score (X, SD) 1.986 (2.162) Median 1
Incarcerated (N, % Yes) 55,766 (69.2) Sentence Length (X, SD) 34.44 (62.17) (In Months) Median 12.01

26
Table 2. Research Variables and Variable Attributes. SEX
1= Male 0= Female
RACE
1=Black; 0=Other 1=White; 0=Other 1=Hispanic; 0=Other 1=Other Race; 0=Other
AGE
Age in Years
MODE OF DISPOSITION
1=Plea; 0=Other 1=Plea w/o Agreement; 0=Other 1=Court trial; 0=Other 1=Jury trial; 0=Other
CIRCUIT
Circuit: 1= Dorchester, Somerset, Wicomico, Worcester Counties 2= Caroline, Cecil, Kent, Queen Anne’s, Talbot Counties 3= Baltimore and Harford Counties 4= Allegany, Garrett, Washington Counties 5= Anne Arundel, Carroll, Howard Counties 6= Montgomery, Frederick Counties 7= Calvert, Charles, Prince George’s, St. Mary’s Counties 8= Baltimore City
CRIME CATEGORY
1=Person; 0=Other 1=Drug; 0=Other 1=Property; 0=Other
OFFENSE SERIOUSNESS CATEGORY (varies by crime type)
Person Offense : Seriousness Category (1, 2, 3, 4, 5, 6, 7)*
+ Victim Injury: 0= No injury
1= Injury, Non-permanent 2= Permanent Injury or Death
+ Weapon Usage 0= No weapon 1= Weapon Other than Firearm 2= Firearm or Explosive
+ Special Vulnerability of Victim
0= No 1= Yes
Drug Offense: Seriousness Category (2, 3, 4, 5, 7)* Property Offense: Seriousness Category (2, 3, 4, 5, 6, 7)* * Seriousness category is converted to a point score ranging from 1 to 10. The higher the point score, the more more serious the offense.

27
Table 2. Research Variables and Variable Attributes. OFFENDER SCORE
Relationship to CJ System at time of offense:
+ 0= None or Pending Cases 1= Court or Other Criminal Justice
Supervision Juvenile Delinquency
0= Not More Than One Finding of Delinquency or Over Age 25
+ 1= Two or More Findings, None or One Commitment
2= Two or More Commitments Adult Record
0= None 1= Minor
+ 3= Moderate 5= Major
Prior Adult Parole/Probation Violations
0= No 1= Yes
SENTENCE INVOLVING INCARCERATION
Incarceration 0= No
1= Yes
SENTENCE LENGTH
Sentence Length in Months
COMPLIANCE
Compliance with Sentencing Guidelines: 1= Within guidelines
2= Under guidelines 3= Above guidelines

28
Table 3. Logistic Regression Estimates Predicting the Incarceration Decision Between January 1987 and September 1996 Using Single Count Data (N=75,959). Variable b s.e. X2 Constant -1.788 0.076 --
Male 0.659 0.026 664.81***
Age -0.012 0.001 127.90 ***
Black 0.374 0.021 325.80***
Hispanic 0.958 0.086 123.91***
Other Race 0.101 0.124 0.67
Property Offense 0.218 0.030 53.87***
Drug Offense -0.071 0.023 10.08**
Plea Agreement -0.246 0.053 21.58***
Plea, No Agreement -0.342 0.056 37.21***
Court Trial -0.243 0.068 12.83**
Offense Score 0.330 0.006 3348.26***
Offender Score 0.493 0.006 7061.79***
Circuit 1 1.739 0.048 1337.85***
Circuit 2 1.527 0.056 734.16***
Circuit 3 -0.080 0.030 7.39**
Circuit 4 1.371 0.055 625.98***
Circuit 5 -0.215 0.034 40.21***
Circuit 6 0.342 0.035 95.15***
Circuit 7 1.543 0.028 3020.38***
Log-likelihood -36260.56 * p <.05 ** p<.01 ***p <.0001

29
Table 4. Logistic Regression Estimates Predicting the Incarceration Decision Between January 1987 and September 1996 Among Individuals Convicted of a Person Offense Using Single Count Data (N=20,780).
Variable b s.e. X2 Constant -1.001 0.135 --
Male 0.846 0.059 208.49***
Age -0.025 0.002 195.85 ***
Black 0.242 0.040 36.03***
Hispanic 0.454 0.143 10.07**
Other Race 0.155 0.211 0.538
Plea Agreement -0.497 0.092 29.01***
Plea, No Agreement -0.498 0.101 24.51***
Court Trial -0.439 0.124 12.60**
Offense Score 0.319 0.009 1282.08***
Offender Score 0.520 0.012 1821.50***
Circuit 1 1.279 0.094 184.96***
Circuit 2 0.751 0.111 46.04***
Circuit 3 -0.457 0.055 67.92***
Circuit 4 1.028 0.108 91.22***
Circuit 5 -0.146 0.069 4.44*
Circuit 6 -0.035 0.070 0.26
Circuit 7 0.944 0.054 303.50***
Log-likelihood -9241.03 * p <.05 ** p<.01 ***p <.0001

30
Table 5. Logistic Regression Estimates Predicting the Incarceration Decision Between January 1987 and September 1996 Among Individuals Convicted of a Drug Offense Using Single Count Data (N=39,761).
Variable b s.e. X2 Constant -2.221 0.110 --
Male 0.569 0.034 283.08***
Age -0.008 0.002 25.72***
Black 0.456 0.030 224.31***
Hispanic 1.380 0.131 110.88***
Other Race 0.032 0.213 0.02
Plea Agreement -0.254 0.083 9.26**
Plea, No Agreement -0.383 0.087 19.42***
Court Trial -0.085 0.105 0.65
Offense Score 0.363 0.008 1914.12***
Offender Score 0.466 0.008 3135.40***
Circuit 1 2.248 0.072 978.82***
Circuit 2 2.229 0.087 649.73***
Circuit 3 0.161 0.044 13.69**
Circuit 4 1.921 0.083 534.16***
Circuit 5 -0.149 0.048 9.76**
Circuit 6 0.664 0.049 185.08***
Circuit 7 1.962 0.040 2382.47***
Log-likelihood -18935.12 * p <.05 ** p<.01 ***p <.0001
31
Table 6. Logistic Regression Estimates Predicting the Incarceration Decision Between January 1987 and September 1996 Among Individuals Convicted of a Property Offense Using Single Count Data (N=15,418).
Variable b s.e. X2 Constant -2.003 0.154 --
Male 0.818 0.056 217.22***
Age 0.002 0.002 0.63
Black 0.324 0.042 60.15***
Hispanic 0.841 0.215 15.31***
Other Race 0.008 0.220 0.001
Plea Agreement 0.045 0.106 0.18
Plea, No Agreement -0.023 0.113 0.04
Court Trial -0.187 0.136 1.89
Offense Score 0.308 0.022 191.72***
Offender Score 0.507 0.012 1934.62***
Circuit 1 1.159 0.093 154.80***
Circuit 2 0.916 0.108 72.43***
Circuit 3 -0.395 0.064 37.63***
Circuit 4 0.598 0.107 31.14***
Circuit 5 -0.582 0.073 63.32***
Circuit 6 -0.112 0.078 2.05
Circuit 7 1.173 0.064 339.40***
Log-likelihood -7699.15 * p <.05 ** p<.01 ***p <.0001
32
Table 7. Ordinary Least Squares Regression Estimates Predicting Sentence Length in Months Between January 1987 and September 1996 Using Single Count Data (N=52,627).
Variable b s.e. t Constant -25.993 1.687 -15.41***
Male 3.983 0.754 5.28***
Age 0.117 0.026 4.50***
Black 0.315 0.501 0.63
Hispanic 0.771 1.838 0.42
Other Race 6.313 3.377 1.87
Property Offense 17.677 0.725 24.37***
Drug Offense -11.290 0.505 -22.35***
Plea Agreement -39.288 0.962 -40.86 ***
Plea, No Agreement -35.407 1.070 -33.09***
Court Trial -33.893 1.387 -24.43***
Offense Score 16.104 0.112 144.29***
Offender Score 8.282 0.100 82.92***
Circuit 1 24.525 0.909 26.99***
Circuit 2 34.819 1.155 30.15***
Circuit 3 9.261 0.783 11.82***
Circuit 4 30.650 1.189 25.78***
Circuit 5 3.043 0.905 3.36**
Circuit 6 4.824 0.848 5.69***
Circuit 7 11.808 0.563 20.97***
R2=0.396
* p <.05 ** p<.01 *** p <.0001

33
Table 8. Ordinary Least Squares Regression Estimates Predicting Sentence Length in Months Between January 1987 and September 1996 Among Individuals Convicted of Person Offenses Using Single Count Data (N=15,112).
Variable b s.e. t Constant -53.587 4.351 -12.32***
Male 11.694 2.539 4.61***
Age 0.261 0.065 3.98***
Black 1.229 1.352 0.91
Hispanic -4.664 5.230 -0.89
Other Race 6.413 7.992 0.80
Plea Agreement -53.276 2.282 -23.35 ***
Plea, No Agreement -46.601 2.656 -17.54***
Court Trial -47.666 3.549 -13.43***
Offense Score 21.570 0.213 101.41***
Offender Score 9.417 0.271 34.73***
Circuit 1 28.131 2.592 10.85***
Circuit 2 40.542 3.562 11.38***
Circuit 3 7.257 2.026 3.58**
Circuit 4 26.139 3.197 8.18***
Circuit 5 -2.306 2.365 -0.97
Circuit 6 0.944 2.453 0.38
Circuit 7 8.500 1.585 5.36***
R2=0.455
* p <.05 ** p<.01 *** p <.0001

34
Table 9. Ordinary Least Squares Regression Estimates Predicting Sentence Length in Months Between January 1987 and September 1996 Among Individuals Convicted of Drug Offenses Using Single Count Data (N=27,589).
Variable b s.e. t Constant -4.574 1.435 -3.19**
Male 3.352 0.584 5.73***
Age -0.037 0.023 -1.60
Black 4.082 0.458 8.92***
Hispanic 9.807 1.473 6.66***
Other Race 15.541 3.445 4.51***
Plea Agreement -29.345 0.890 -32.99***
Plea, No Agreement -27.833 0.973 -28.61***
Court Trial -23.855 1.238 -19.26***
Offense Score 7.106 0.120 59.04***
Offender Score 7.983 0.087 91.89***
Circuit 1 18.623 0.770 24.19***
Circuit 2 28.970 0.958 30.25***
Circuit 3 7.535 0.730 10.32***
Circuit 4 29.906 1.034 28.92***
Circuit 5 0.380 0.824 0.46
Circuit 6 3.500 0.699 5.00***
Circuit 7 8.578 0.463 18.52***
R2=0.355
* p <.05 ** p<.01 *** p <.0001

35
Table 10. Ordinary Least Squares Regression Estimates Predicting Sentence Length in Months Between January 1987 and September 1996 Among Individuals Convicted of Property Offenses Using Single Count Data (N=9,926).
Variable b s.e. t Constant -3.423 2.452 -1.40
Sex 0.347 1.143 0.30
Age 0.161 0.039 4.12***
Black -0.216 0.663 -0.33
Hispanic 1.099 3.166 0.35
Other Race -0.025 4.383 -0.01
Plea Agreement -18.279 1.506 -12.14 ***
Plea, No Agreement -15.518 1.640 -9.46***
Court Trial -13.744 2.084 -6.59***
Offense Score 6.328 0.318 19.93***
Offender Score 7.488 0.144 52.10***
Circuit 1 13.710 1.321 10.38***
Circuit 2 13.734 1.619 8.48***
Circuit 3 12.905 1.095 11.79***
Circuit 4 14.968 1.741 8.60***
Circuit 5 0.228 1.275 0.18
Circuit 6 1.406 1.292 1.09
Circuit 7 7.158 0.914 7.83***
R2=0.285
* p <.05 ** p<.01 *** p <.0001

36
Table 11. Logistic Regression Estimates Predicting the Incarceration Decision Between January 1987 and September 1996 Using Single Count Data Among Sentences Consistent with the Sentencing Guidelines (N=41,610).
Variable b s.e. X2 Constant -4.661 0.137 --
Male 0.558 0.044 162.75***
Age -0.011 0.002 38.33***
Nonwhite 0.292 0.061 23.32***
Property Offense 1.210 0.067 331.25***
Drug Offense 0.276 0.060 21.26***
Nonwhite*Property 0.071 0.084 0.72
Nonwhite*Drug 0.871 0.079 122.59***
Plea Agreement 0.035 0.086 0.16
Plea, No Agreement -0.038 0.092 0.17
Court Trial -0.079 0.113 0.49
Offense Score 1.145 0.015 5577.55***
Offender Score 1.469 0.023 4162.15***
Circuit 1 1.449 0.072 408.81***
Circuit 2 1.195 0.087 186.78***
Circuit 3 -0.486 0.055 77.05***
Circuit 4 0.749 0.088 72.02***
Circuit 5 -0.336 0.062 29.45***
Circuit 6 0.015 0.063 0.06
Circuit 7 1.628 0.050 1062.80***
Log-likelihood -12159.697
* p <.05 ** p<.01 ***p <.0001

37
Table 12. Comparison of Incarceration Decision (Y/N) Among White Defendants Convicted of Drug Offenses and Sentenced in Compliance with the Sentencing Guidelines.
SERIOUSNESS OFFENDER SCORE CATEGORY
0 1 2 3 4 5 6 7+
2
n=9* n=9** 100% 1Y-4Y***
n=3 n=3 100% 2Y-5Y
n=1 n=1 100% 3Y-6Y
n=1 n=1 100% 4Y-7Y
---- 5Y-8Y
---- 6Y-10Y
---- 8Y-15Y
n=1 n=1 100% 15Y-25Y
3
n=589 n=585 99.3% 6M-3Y
n=403 n=400 99.3 1Y-3Y
n=177 n=177 100% 18M-4Y
n=128 n=128 100% 3Y-7Y
n=135 n=135 100% 4Y-8Y
n=98 n=98 100% 5Y-10Y
n=69 n=69 100% 7Y-14Y
n=31 n=31 100% 12Y-20Y
4
n=1,379 n=500 36.3% P-12M
n=551 n=290 52.6% P-18M
n=103 n=103 100% 6M-18M
n=74 n=74 100% 1Y-2Y
n=38 n=38 100% 1.5Y-2.5Y
n=17 n=17 100% 2Y-3Y
n=20 n=20 100% 3Y-4Y
n=10 n=10 100% 3.5Y-5Y
5
n=766 n=181 23.6% P-6M
n=463 n=193 41.7% P-12M
n=81 n=81 100% 3M-12M
n=79 n=79 100% 6M-18M
n=80 n=80 100% 1Y-2Y
n=40 n=40 100% 1.5-2.5Y
n=27 n=27 100% 2Y-3Y
n=44 n=44 100% 3Y-4Y
7
n=599 n=2 0.3% P
n=152 n=0 0% P
n=59 n=1 1.7% P
n=46 n=15 32.6% P-1M
n=44 n=17 38.6% P-3M
n=15 n=8 53.3% P-6M
n=7 n=7 100% 3M-6M
n=9 n=9 100% 6M-12M
* The first n equals the total number of individuals who fell within a particular cell. ** The second n represents the number of individuals who received a sentence involving
incarceration, followed by the percentage of the total. *** Denotes the sentencing guidelines for each cell where P=Probation, M=Months, and Y=Years.
38
Table 13. Comparison of Incarceration Decision (Y/N) Among Nonwhite Defendants Convicted of Drug Offenses and Sentenced in Compliance with the Sentencing Guidelines.
SERIOUSNESS OFFENDER SCORE CATEGORY
0 1 2 3 4 5 6 7+
2
n=81* n=80** 98.8% 1Y-4Y***
n=16 n=16 100% 2Y-5Y
n=5 n=5 100% 3Y-6Y
n=6 n=6 100% 4Y-7Y
n=4 n=4 100% 5Y-8Y
n=4 n=4 100% 6Y-10Y
n=4 n=4 100% 8Y-15Y
n=1 n=1 100% 15-25Y
3
n=3,615 n=3,609 99.8% 6M-3Y
n=1,729 n=1,729 100% 1Y-3Y
n=978 n=978 100% 18M-4Y
n=671 n=671 100% 3Y-7Y
n=804 n=804 100% 4Y-8Y
n=506 n=506 100% 5Y-10Y
n=342 n=342 100% 7Y-14Y
n=172 n=172 100% 12-20Y
4
n=801 n=389 48.6% P-12M
n=402 n=253 62.9% P-18M
n=86 n=86 100% 6M-18M
n=70 n=70 100% 1Y-2Y
n=68 n=68 100% 1.5-2.5Y
n=38 n=38 100% 2Y-3Y
n=32 n=32 100% 3Y-4Y
n=26 n=26 100% 3.5Y-5Y
5
n=1,494 n=590 39.5% P-6M
n=769 n=428 55.7% P-12M
n=212 n=212 100% 3M-12M
n=164 n=164 100% 6M-18M
n=185 n=185 100% 1Y-2Y
n=87 n=87 100% 1.5-2.5Y
n=67 n=67 100% 2Y-3Y
n=86 n=86 100% 3Y-4Y
7
n=271 n=0 0% P
n=60 n=0 0% P
n=27 n=0 0% P
n=26 n=10 38.5% P-1M
n=25 n=13 52.0% P-3M
n=13 n=7 53.8% P-6M
n=10 n=8 80% 3M-6M
n=3 n=3 100% 6M-12M
* The first n equals the total number of individuals who fell within a particular cell. ** The second n represents the number of individuals who received a sentence involving
incarceration, followed by the percentage of the total. *** Denotes the sentencing guidelines for each cell where P=Probation, M=Months, and Y=Years.

39
Table 14. Ordinary Least Squares Regression Estimates Predicting Sentence Length in Months Between January 1987 and September 1996 Among Sentences Consistent with the Sentencing Guidelines Using Single Count Data (N=29,153).
Variable b s.e. t Constant -55.553 2.051 -27.09***
Sex -1.672 0.882 -1.89
Age 0.165 0.031 5.39***
Nonwhite 1.972 0.999 1.97*
Property 21.233 1.214 17.49***
Drug -7.955 1.096 -7.26***
Nonwhite*Property -1.607 1.467 -1.10
Nonwhite*Drug -7.981 1.283 -6.22***
Plea Agreement -24.195 1.079 -22.42 ***
Plea, No Agreement -21.925 1.211 -18.11***
Court Trial -22.512 1.579 -14.25***
Offense Score 21.000 0.135 155.89***
Offender Score 12.913 0.124 104.49***
Circuit 1 13.537 0.995 13.61***
Circuit 2 20.896 1.393 15.01***
Circuit 3 3.751 0.914 4.10***
Circuit 4 13.697 1.464 9.36***
Circuit 5 5.604 1.090 5.14***
Circuit 6 5.737 1.021 5.62***
Circuit 7 10.390 0.650 15.98***
R2=0.588
* p <.05 ** p<.01 *** p <.0001

40
Table 15. Logistic Regression Estimates Predicting the Incarceration Decision Between January 1987 and September 1996 Using Single Count Data Among Sentences Inconsistent with the Sentencing Guidelines (N=34,348).
Variable b s.e. X2 Constant -0.484 0.121 --
Male 0.556 0.038 219.97***
Age -0.006 0.002 16.33***
Nonwhite 0.291 0.058 25.53***
Property Offense -0.478 0.070 46.59***
Drug Offense -0.413 0.058 51.40***
Nonwhite*Property 0.172 0.088 3.85*
Nonwhite*Drug -0.115 0.069 2.80
Plea Agreement -0.383 0.083 21.22***
Plea, No Agreement -0.465 0.087 28.45***
Court Trial -0.339 0.103 10.74**
Offense Score 0.077 0.008 97.09***
Offender Score 0.344 0.007 2458.01***
Circuit 1 2.327 0.102 522.87***
Circuit 2 2.185 0.107 416.53***
Circuit 3 -0.117 0.041 8.05**
Circuit 4 2.056 0.100 421.77***
Circuit 5 -0.227 0.046 24.19***
Circuit 6 0.504 0.050 102.46***
Circuit 7 1.464 0.042 1191.49***
Log-likelihood -18064.562
* p <.05 ** p<.01 ***p <.0001

41
Table 16. Ordinary Least Squares Regression Estimates Predicting Sentence Length in Months Between January 1987 and September 1996 Among Sentences Inconsistent with the Sentencing Guidelines Using Single Count Data (N=23,473).
Variable b s.e. t Constant -5.705 2.798 -2.04***
Sex 7.846 1.174 6.69***
Age 0.146 0.040 3.65**
Nonwhite 2.602 1.332 1.95*
Property 17.599 1.698 10.37***
Drug -6.597 1.464 -4.51***
Nonwhite*Property -2.801 2.088 -1.34
Nonwhite*Drug 0.336 1.703 0.20
Plea Agreement -48.271 1.589 -30.37 ***
Plea, No Agreement -43.249 1.746 -24.77***
Court Trial -39.497 2.238 -17.65***
Offense Score 11.712 0.170 68.83***
Offender Score 4.908 0.153 32.11***
Circuit 1 32.545 1.584 20.55***
Circuit 2 42.313 1.736 24.37***
Circuit 3 11.513 1.226 9.39***
Circuit 4 40.071 1.750 22.90***
Circuit 5 -0.465 1.358 -0.34
Circuit 6 3.087 1.262 2.45*
Circuit 7 9.941 0.905 10.98***
R2=0.252
* p <.05 ** p<.01 *** p <.0001

42

43
44

45
46
References Blumstein, A. (1982). "On the Racial Disproportionality of the U.S. States' Prison Populations."
Journal of Criminal Law and Criminology, 73(3):1259-1281. Blumstein, A., Cohen, J., Martin, S.E., & M. Tonry, eds. (1983). Research on Sentencing: The
Search for Reform. 2 vols. Washington, D.C.: National Academy Press. Chiricos, T.G. & C. Crawford. (1995). "Race and Imprisonment: A Contextual Assessment of the
Evidence." In D. Hawkins (ed.) Ethnicity, Race, and Crime: Perspectives across Time and Place. Albany: State University of New York Press.
Crutchfield, R.D., Bridges, G.S., & S.R. Pritchford. (1994). "Analytical and Aggregation Biases
in Analyses of Imprisonment: Reconciling Discrepancies in Studies of Racial Disparity." Journal of Research in Crime and Delinquency, 31(2):166-182.
Hagan, J. (1974). "Extra-legal Attributes and Criminal Sentencing: An Assessment of a
Sociological Viewpoint." Law and Society Review, 8:357-384. Hanushek, E.A. & J.E. Jackson. (1977). Statistical Methods for Social Scientists. San Diego:
Academic Press, Inc. King, G. (1989). Unifying Political Methodology: The Likelihood Theory of Statistical Inference.
Cambridge: Cambridge University Press. Kleck, G. (1981). "Racial Discrimination in Criminal Sentencing: A Critical Evaluation of the
Evidence with Additional Evidence on the Death Penalty." Criminology, 46:783-805. Klepper, S., Nagin, D., & L. Tierney. (1983). "Discrimination in the Criminal Justice System: A
Critical Appraisal of the Literature." In Blumstein, A., Cohen, J., Martin, S.E., & M. Tonry (eds.) Research on Sentencing: The Search for Reform. 2 vols. Washington, D.C.: National Academy Press.
Little, R.J.A. (1992). "Regression with Missing X's: A Review." Journal of the American Statistical
Association, 87(420):1227-1237. Miethe, T.D. & C.A. Moore. (1985). “Socioeconomic Disparities Under Determinate Sentencing
Systems: A Comparison of Preguideline and Postguideline Practices in Minnesota.” Criminology, 23(2):337-363.
Peterson, R.D. & J. Hagan. (1984). “Changing Conceptions of Race: Towards an Account of
Anomalous Findings of Sentencing Research.” American Sociological Review, 49:56-70.

47
References
Pindyck, R.S. & D.L. Rubinfeld. (1991). Econometric Models and Economic Forecasts (third edition). New York: McGraw-Hill.
Sampson, R.J. & J.L. Lauritsen. (1997). "Racial and Ethnic Disparities in Crime and Criminal
Justice in the United States." In M. Tonry (ed.) Ethnicity, Crime, and Immigration: Comparative and Cross-National Perspectives, Crime and Justice: A Review of Research (vol. 21). Chicago: The University of Chicago Press.
SAS Institute (1990). SAS/STAT User's Guide. Cary, North Carolina: SAS Institute. Spohn, C., Gruhl, J. & S. Welch. (1981-82). “The Effect of Race on Sentencing: A Re-examination
of an Unsettled Question.” Law and Society Review, 16(1):71-88. Stolzenberg, L. & S.J. D'Allessio. (1994). "Sentencing and Unwarranted Disparity: An Empirical
Assessment of the Long-Term Impact of Sentencing Guidelines in Minnesota." Criminology, 32(2):301-309.
Tonry, M. (1988). "Structured Sentencing." In M. Tonry & N. Morris (eds.) Crime and Justice: A
Review of Research (vol. 10). Chicago: The University of Chicago Press. Tonry, M. (1993). "Sentencing Commissions." In M. Tonry (ed.) Crime and Justice: A Review of
Research (vol. 17). Chicago: The University of Chicago Press. Welch, S., Spohn, C. & J. Gruhl. (1985). “Convicting and Sentencing Differences Among Black,
Hispanic, and White Males in Six Localities.” Justice Quarterly, 2:67-79. Wolfgang, M.E. & M. Riedel. (1973). “Race, Judicial Discretion, and the Death Penalty.” The
Annals of The American Academy of Political and Social Science, 407:119-133. Zatz, M. (1987). "The Changing Forms of Racial/Ethnic Biases in Sentencing." Journal of
Research in Crime and Delinquency, 24:69-92.