An Examination of Their Characteristics and … Examination of Their Characteristics and...
22
I N s t i t u t e N s t i t u t e t h e t h e This material was prepared by the Brandes Institute, a division of Brandes Investment Partners ® . It is intended for infor- mational purposes only. It is not meant to be an offer, solicitation, or recommendation for any product or services. The foregoing reflects the thoughts and opinions of the Brandes Institute. Copyright © 2004 Brandes Investment Partners, LP. ALL RIGHTS RESERVED. Brandes Investment Partners and the Brandes Investment Partners logo are trademarks of Brandes Investment Partners, LP. Brandes Investment Partners ® is a registered trademark in the United States. Users agree not to copy, reproduce, distribute, publish, or in any way exploit this material, except that users may make a print copy for their own personal, non-commercial use. Brief pas- sages from any article may be quoted with appropriate credit to the Brandes Institute. Longer passages may be quot- ed only with prior written approval from the Brandes Institute. For more information about Brandes Institute research projects, visit our website at http://www.brandes.com/institute. Concentrated Portfolios: An Examination of Their Characteristics and Effectiveness A research study by the Brandes Institute in conjunction with Global Wealth Allocation September 2004
Transcript of An Examination of Their Characteristics and … Examination of Their Characteristics and...

I N s t i t u t eN s t i t u t e
t h et h e
This material was prepared by the Brandes Institute, a division of Brandes Investment Partners®. It is intended for infor-mational purposes only. It is not meant to be an offer, solicitation, or recommendation for any product or services. Theforegoing reflects the thoughts and opinions of the Brandes Institute.
Copyright © 2004 Brandes Investment Partners, LP. ALL RIGHTS RESERVED. Brandes Investment Partners and theBrandes Investment Partners logo are trademarks of Brandes Investment Partners, LP. Brandes Investment Partners®
is a registered trademark in the United States. Users agree not to copy, reproduce, distribute, publish, or in any wayexploit this material, except that users may make a print copy for their own personal, non-commercial use. Brief pas-sages from any article may be quoted with appropriate credit to the Brandes Institute. Longer passages may be quot-ed only with prior written approval from the Brandes Institute. For more information about Brandes Institute researchprojects, visit our website at http://www.brandes.com/institute.
Concentrated Portfolios:An Examination of Their Characteristicsand EffectivenessA research study by the Brandes Institute in conjunction withGlobal Wealth Allocation
September 2004

I. Executive Summary Many investment industry practitioners believe that more concentrated portfolios deliver better returns, albeit with greater volatility. To investigate whether this assumption is justified, and to examine better the characteristics associated with concentrated portfolios, we developed a new tool to measure concentration: the Concentration Coefficient (“CC”). The CC is the inverse of the sum of the squares of the weights of the stocks in a portfolio.
Gauging concentration exclusively by the number of holdings in a portfolio can be misleading. By using the CC, we believe it is possible to see more clearly the underlying level of concentration in a portfolio.
We measure CCs of portfolios in different peer groups (U.S. large-cap value, U.S. large-
cap growth, U.S. small-cap value, U.S. small-cap growth, and international), and note their fluctuations over time. Peer group CCs are significantly different, leading to the conclusion that what is considered a “concentrated” portfolio should vary across peer groups. In particular, portfolios in the large-cap growth and large-cap value peer groups tend to be more concentrated than small cap or international.
In aggregate, and across peer groups, we find that concentrated portfolios, in and of
themselves, do not provide improved returns, nor do they provide improved volatility-adjusted returns. However, due to the nature of our database, we cannot draw any conclusions on whether managers with consistent outperformance in diversified portfolios would have delivered enhanced returns if they had introduced more concentrated versions of the same strategy. However, investors can apply the CC measure themselves to such comparatives in order to investigate this issue.
In our opinion, selecting a set of managers purely because they are concentrated may not provide incremental returns. Only after the most appropriate manager has been selected should the amount of concentration come under review. II. Introduction Portfolio concentration has received increased attention in recent years, particularly related to the introduction of strategies with a deliberate focus on limiting the number of stocks. The implicit assumption is that more concentrated portfolios provide better returns to investors,1 given that these portfolios are by definition more “active.” While volatility of those returns may be higher, the question also can be asked whether the risk-adjusted returns of such concentrated portfolios also are higher.
1 For example, focusing on the influence of industry concentration on mutual fund performance between 1984 and 1999, Kacpercyzyk, Sialm, and Zheng conclude that industry concentration “is positively related to fund performance” (page 1). The complete research report, authored by Marcin Kacperczyk, Clemens Sialm, and Lu Zheng, is titled, “Do Skilled Fund Managers Diversify Less? On Concentration and Performance of Actively Managed Mutual Funds.” A working paper, it was written in October 2003. For details, visit the following website: http://www-personal.umich.edu/~mkacpe/ We recognize that separately managed accounts and mutual funds do not share the same fee, regulatory or expense structures. However, we believe mutual funds, as cited in this report, represent an acceptable substitute for separately managed accounts or composite performance within the context of our discussion on concentrated portfolios.

2
The industry’s research on the characteristics of concentration is not yet well developed. Not only are there few studies of the effects of concentration, there has not been a definition of concentration which is both widely accepted and useful as an analytical tool. Conventional methods for estimating concentration include assessing the weights of a portfolio’s top 10 holdings or simply counting the total number of holdings. We aimed to develop a more effective approach, using the weights of all securities in a portfolio. In this paper, we use an intuitive yet rigorous definition of concentration, the Concentration Coefficient (CC), based on research at the Brandes Institute and modified by Global Wealth Allocation (GWA), a London-based consultant. We also examine the characteristics of this measure across a broad range of portfolios. The research was conducted by the Brandes Institute and GWA using data provided by Russell/Mellon Analytical Services. We believe our findings and the CC may be useful for investors and consultants in assessing the benefits of concentrated portfolios and gaining sharper insights on the true nature of portfolio concentration. III. The Data We analyzed concentration across portfolios in five equity peer groups:
• U.S. Large Cap Value (LCV) • U.S. Large Cap Growth (LCG) • U.S. Small Cap Value (SCV) • U.S. Small Cap Growth (SCG) • International (INTL)
Each peer group, defined by Russell/Mellon, contained a minimum of 75 separately managed portfolios. We examined the groups independently and in aggregate. Russell/Mellon provided holdings and portfolio performance data on a quarterly basis for managers it tracked in each group between January 1, 1992 and September 30, 2003.2 In order to preserve manager anonymity, Russell/Mellon did not provide the names of the managers in each peer group. Under the guidance of the Brandes Institute, GWA designed a proprietary, relational database to store and analyze the portfolio holdings and return data and draw preliminary conclusions. In the body of this paper, we explore results in detail, addressing questions about the relationship between performance, risk, and concentration for the five style peer groups over the 11¾ years ending September 30, 2003.
2 Universe participants are selected by the Russell/Mellon (RM) research division based on portfolio fundamentals and specific universe criteria. These published universes consist of tax-free, fully discretionary investment advisor, bank and/or insurance company portfolios. Returns are reported gross of fees including income. Participants tend to remain static from quarter to quarter. Studies have shown there is no correlation between the size of a universe and its quality unless you have consistency in the participants over time. Russell-published universes exclude composites and back tested model portfolios. These types of portfolios do not account for the impacts of real time trading activity and any frictional cash. The database consists of buyable portfolios from which consulting clients can select. To eliminate potential upward drift, RM freezes historical performance into the universes. Some of the portfolios that are included in the Russell-published universe database are on in-house verification. Returns also are reported by investment managers and banks, which are screened through a reasonability process each quarter. Outliers are questioned and validated to ensure accuracy in the reporting process.

3
IV. Measuring Concentration Often, concentration is measured by the number of stocks in a portfolio. The problem with this approach is that it takes no account of the portfolio weights of the holdings. For example, a 50-stock portfolio could be equally weighted (2% in each stock). Alternatively, an individual investor might have half of his or her 50-stock portfolio in one stock (typically the employer company), but equally weight the rest of the holdings. The concentration characteristics of the two portfolios are very different, but both have an identical number of stocks. To address such shortcomings, the Brandes Institute researched an improved definition of concentration. The initial approach used the sum of the squares of the weights of the stocks in a portfolio. Conceptually, this approach is well known in measures of industrial concentration, where it is expressed as the Herfindahl Index.3 In order to make this measure more intuitive for practitioners in the investment industry, GWA modified the measure by inverting it. This expresses portfolio concentration as the equivalent number of equal-weighted stocks. We define this as the portfolio’s Concentration Coefficient or CC. Thus, the CC is defined as:
( )1
1
2,
−
=
⎟⎠
⎞⎜⎝
⎛≡ ∑
N
i
Pti
P
twCC
where P is the portfolio N is the number of stocks held in the portfolio Wi,t is the weight of the ith stock in the portfolio at time t Building on our previous example, we can illustrate the concentration for three very different portfolios, each containing 50 stocks. In short, the lower the CC, the more concentrated the portfolio. See Exhibit 1 on the next page.
3 The Herfindahl Index (or Herfindahl-Hirschman Index or HHI) measures market concentration and competition. Defined as the sum of the squares of the market shares of each firm in an industry, it measures firm size relative to the overall industry. It can range from zero to 10,000. The U.S. Department of Justice uses the HHI to help determine whether proposed mergers raise antitrust concerns. As the market concentration increases, competition and efficiency tend to decrease, raising the potential for collusion and monopolistic practices. The HHI is based on work by Orris Herfindahl, an environmental economist, and Albert O. Hirschman, a member of the Institute for Advanced Study at Princeton University.

4
Exhibit 1: Assessing Concentration
Portfolio Portfolio Composition CC 1. Equal Weighted 50, equally weighted stocks 50.0 2. Institutional
10 stocks at 4% 10 stocks at 3% 30 stocks at 1%
35.7
3. Individual Company stock is 51% 49 other stocks at 1%
3.8
Note that the equally weighted portfolio represents the least concentrated structure, and hence the maximum possible CC for that number of stocks.4 As a portfolio moves away from equal weightings, its equal-weighted stock equivalent decreases, indicating the extent of increased concentration. For example, at the other end of the spectrum in Exhibit 1, the proportion of the “Individual” portfolio’s CC to that maximum is 7.6% (3.8 divided by 50), representing a very high degree of concentration. One way to interpret this CC of 3.8 is that an equally weighted portfolio of four stocks would have about the same degree of concentration as that Individual portfolio. We believe the CC provides an intuitive measure of concentration that can be understood in the context of the conventional “number of stocks approach” used to indicate the degree of concentration. One application of this measure is to compare the CC to the number of stocks in a portfolio to illustrate the degree of “hidden” concentration. This affords a new approach for evaluating specific portfolios as well as a new basis for comparison across portfolios. Note that the CC also can measure country and industry concentration by simply replacing stock weights with industry or country weights. Further, the calculation can be done for the equity only part of a portfolio, or if cash positions need to be taken into account, then cash could be treated as a single “position.” However, for stock concentration, inclusion of cash can produce significant distortions, so this study focuses on equity only data.
4 For an equally weighted portfolio, the weight of each stock is 1/n. Using the CC formula, which inverts the sums of the squares of the weights of individual holdings, we arrive at a CC that equals the number of holdings.

5
V. Characteristics Exhibit 2 illustrates the average CC versus the number of stocks in each portfolio for all 475 portfolios in the five peer groups we studied from 1992 to 2003, the most recent period during which consistent holdings and performance data are available from Russell/Mellon.5 As described earlier, the CC is limited to a number that is less than or equal to the number of holdings. This CC limit is shown by the dotted, diagonal line in Exhibit 2. Equally weighted portfolios plot on this diagonal line. Exhibit 2
The widespread pattern of plot points reveals that portfolios can achieve the same degree of concentration with a diverse number of holdings. For example, portfolios with 80-100 stocks span a CC range from 26 to 100. Conversely, a CC of 100 can be achieved with as few as 100 – or as many as 300 stocks. As the different peer group portfolios are selected from universes with varying characteristics, their CCs should be expected to differ systematically, as well as vary over time.
5 Note that we make no attempt to account for the reasons why certain portfolios are more or less concentrated than others. Not only does the nature of the data prevent such analysis, it is beyond the scope of our objective. Our results also do not account for the sector or country distribution among holdings in portfolios. We cannot detect and compare one portfolio that was more heavily concentrated in the technology sector, for example, versus another that had a significant concentration in financials. However, as noted above, the CC certainly may be applied to such analysis.
Source: The Brandes Institute; Global Wealth Allocation; Russell/Mellon Analytical Services.
Concentration Coefficent vs. # of Stocks
0
100
200
300
0 50 100 150 200 250 300concentration coefficient
# of
stoc
ks
Concentration Coefficient vs. # of Stocks

6
Exhibit 3 shows how CCs for each peer group in aggregate have fluctuated over our study period. Each line shows how the average CC for all portfolios in that peer group varies over time, plotted on a quarterly basis. Exhibit 3
Note the significant differences in CC over time and between peer groups. The large-cap groups (both for value and growth) tended to be the most concentrated. The CC of the large-cap growth (LCG) peer group trended down during the 1996-2000 technology-led stock bubble, possibly due to the appreciation of a select group of very large tech stocks. Large-cap value (LCV) was not materially impacted by this effect. International was less concentrated than U.S. large caps over the full period, but recently has tended toward increased concentration. Part of this may be for a similar reason to the concentration of the LCG peer group (the bull market), but an additional factor may be the increasing influence of international managers who use stock picking as their primary style, as opposed to top-down country allocation.6 Small cap (SC), both for value and growth styles, has become less concentrated. In addition to comparing concentration across portfolios, we used the CC to investigate benchmarks and the relationship between them and their peer groups.
6 Source: InterSec 2003 Year End Industry Report.
Source: The Brandes Institute; Global Wealth Allocation; Russell/Mellon Analytical Services.
Concentration Coefficient of Peer Groups
30
45
60
75
90
105
Mar-92 Feb-94 Jan-96 Dec-97 Nov-99 Oct-01 Sep-03
conc
entra
tion
coef
ficie
nt
LCVLCGSCVSCGInt'l
Concentration Coefficient of Peer Groups
7
The following indices were used as benchmarks7 for each peer group:
• U.S. Large Cap Value (LCV) – Russell 1000 Value Index • U.S. Large Cap Growth (LCG) – Russell 1000 Growth Index • U.S. Small Cap Value (SCV) – Russell 2000 Value Index • U.S. Small Cap Growth (SCG) – Russell 2000 Growth Index • International (INTL) – MSCI EAFE Index
Exhibit 4 illustrates the CCs for the large-cap indices (including the international index) going back to 1980. Holdings data for the MSCI EAFE Index was available starting in 1997. Exhibit 4
Although the large-cap growth and value indices typically have well over 200 stocks, their CCs are lower, given that they are market cap weighted, not equally weighted. This is especially noticeable for LCG, as a relatively smaller number of stocks represent a large weighting within the index. As shown in the chart, the international index has been less concentrated than the larger-cap U.S. indices. At the same time, its CC has been far lower than its number of constituents, which usually has been in excess of 1,000. For the small-
cap indices, CCs ranged from a high of 775 for the SCG index to just under 500. (See Exhibit 68.) The higher CCs for the small-cap indices, relative to the large-cap indices, are a function of the greater number of stocks in the smaller-cap indices and the lack of concentration at the larger end of these indices relative to large cap. For example, the top 10 stocks in the LCG index represent 32.7% of its total weight, while the top 10 stocks in the SCG index represent only 3.7%.9 The total number of stocks in each universe is shown in Exhibit 5.
7 See “Disclosure” for definitions of each benchmark. 8 We used a rolling, 4-quarter average of CCs for the small-cap peer groups to seasonally adjust the data. Each June 30, Russell identifies 2000 stocks for inclusion in its small-cap indices. As each year progresses, a significant portion of constituents migrates out of the index for a variety of reasons (appreciation, depreciation, acquisition, bankruptcy, etc.). Thus, each year when Russell reconstituted its small-cap indices (restoring the indices to 2000 stocks), we saw a spike in the CC results. To mitigate the impact of this annual reconstitution and see more clearly how the CCs were shifting over time, we applied a 4-quarter rolling average. See Appendix for the unadjusted quarterly small-cap CC chart. 9 Source: Russell 3000 Index via FactSet, as of 12/31/03.
Source: The Brandes Institute; Global Wealth Allocation; Russell/Mellon Analytical Services.
Concentration Coefficient of Benchmarks(Large Cap and International)
0
50
100
150
200
250
300
Jun-80 Jun-85 Jun-90 Jun-95 Jun-00
Con
cent
ratio
n C
oeff
icie
nt
R1000V R1000G EAFE
Concentration Coefficient of Benchmarks(Large Cap and International)

8
Exhibit 5
As shown in Exhibit 6, the SCV index exhibited similar behavior to the SCG index but with less variability. We note that both small-cap indices exhibited pronounced downward spikes that corresponded with strong bull markets. This was likely due to the larger weightings in a small number of stocks during these bull market periods. Exhibit 6
Universe # stocks LCV 295 LCG 248 SCV 1412 SCG 1382 IN 1005
Source: Frank Russell Co. and MSCI via FactSet, as of 12/31/03. For the U.S. universes, large-cap stocks are defined as over $5 billion in market capitalization and small caps are defined as under $2 billion. Even excluding mid-cap stocks, the total for the four U.S. universes is greater than 3000 as different Russell indices may contain the same stocks. See “Disclosure” for index definitions.
Source: The Brandes Institute; Global Wealth Allocation; Russell/Mellon Analytical Services.
Concentration Coefficient of Benchmarks (Small Cap, 4-Qtr Average)
450
500
550
600
650
700
750
800
Jun-81 Jun-85 Jun-89 Jun-93 Jun-97 Jun-01
R2000V R2000G
Concentration Coefficient of Benchmarks(Small Cap, 4-Qtr Average)

9
Exhibit 7
After observing the characteristics of the benchmarks, we compared each absolute peer group’s CC to its corresponding style index. This is expressed as a percentage ratio in Exhibit 7. Based on our results, we note ratios for the small-cap peer groups are much lower than the international and large-cap peer groups. The greater number of constituents and the lack of a small number of size-dominant stocks in the benchmark are largely responsible for these much lower ratios relative to large caps and international.
Among large caps, the ratio for LCG was the highest. It climbed steadily throughout the 1996-2000 bull market. As noted earlier, we believe the outperformance of a select group of large-cap growth stocks, particularly within the index, coinciding with the technology-stock bubble, contributed to this phenomenon. Because each of these indices is capitalization weighted, surging performance for a handful of stocks dramatically increased their weighting in the LCG index. In turn, this reduced the index’s CC more quickly than the peer group’s CC, causing the ratio of the peer group to the index CC to rise. Note the decline in the ratio in late 2000 through 2002 as the tech-stock bubble burst. The ratio for each of the groups increased during our study period, signifying that the peer groups may be becoming slightly less concentrated relative to their benchmarks. However, the only peer group where there appeared to be a significant and steady increasing ratio was large-cap value. Its ratio moved from 32.3% in March 1992 to 57.8% by September 2003. This change was driven primarily by the benchmark CC, which declined significantly over the period, while the peer group CC was fairly steady. That LCV benchmark decline can be seen in Exhibit 4, with the additional observation that 1992 was close to the peak in the CC of the Russell 1000 Value Index. As such, we can draw the conclusion that while the ratios of each peer group CC to benchmark CC fluctuate significantly over time, there does not appear to be a systematic trend.
Source: The Brandes Institute; Global Wealth Allocation; Russell/Mellon Analytical Services. Portfolio data is historical, as reported to Russell/Mellon Analytical Services.
Ratio of Peer Group CC to Benchmark CC
0%
20%
40%
60%
80%
100%
Mar-92 Mar-94 Mar-96 Mar-98 Mar-00 Mar-02
LCVLCGSCVSCGInt'l
Ratio of Peer Group CC to Benchmark CC
10
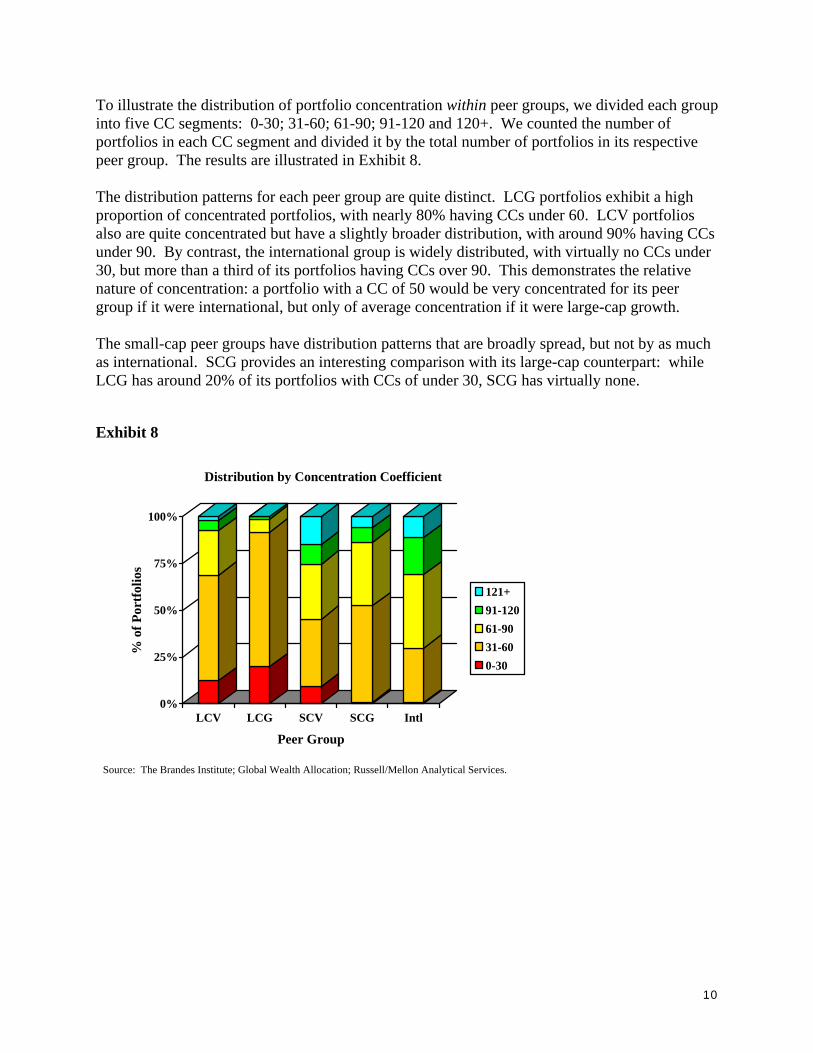
To illustrate the distribution of portfolio concentration within peer groups, we divided each group into five CC segments: 0-30; 31-60; 61-90; 91-120 and 120+. We counted the number of portfolios in each CC segment and divided it by the total number of portfolios in its respective peer group. The results are illustrated in Exhibit 8. The distribution patterns for each peer group are quite distinct. LCG portfolios exhibit a high proportion of concentrated portfolios, with nearly 80% having CCs under 60. LCV portfolios also are quite concentrated but have a slightly broader distribution, with around 90% having CCs under 90. By contrast, the international group is widely distributed, with virtually no CCs under 30, but more than a third of its portfolios having CCs over 90. This demonstrates the relative nature of concentration: a portfolio with a CC of 50 would be very concentrated for its peer group if it were international, but only of average concentration if it were large-cap growth. The small-cap peer groups have distribution patterns that are broadly spread, but not by as much as international. SCG provides an interesting comparison with its large-cap counterpart: while LCG has around 20% of its portfolios with CCs of under 30, SCG has virtually none. Exhibit 8
0%
25%
50%
75%
100%
% o
f Por
tfol
ios
LCV LCG SCV SCG Intl
Peer Group
Distribution by Concentration Coefficient
121+91-12061-9031-600-30
Source: The Brandes Institute; Global Wealth Allocation; Russell/Mellon Analytical Services.
Distribution by Concentration Coefficient

11
In addition to investigating CC at different points in time and within each peer group, we examined the relationship between portfolio size and CC, with the hypothesis that increasing portfolio size would be associated with an increasing CC (i.e. more diversification).10 As shown in Exhibit 9, the slope of the regression line is significantly positive, especially as this chart is on a log scale. This indicates a positive correlation between these variables, as anticipated in the hypothesis. However, the explanatory power of portfolio size is relatively weak, with an r2 of only 0.09. Thus, while portfolio size clearly does impact concentration, other factors specific to the manager’s approach may have more impact on the degree of concentration in a portfolio.11 Exhibit 9
10 In evaluating portfolio size, our comparison is limited to our universe sample. Because of the anonymity of managers, we could not aggregate portfolios to approximate the asset size of a style composite. While composite data would be a more accurate variable, we note the evidence of a trend in our existing findings, even on limited data. 11 r2 can be interpreted as the proportion of the total variation in one number that is related to the variation in a second number. The higher the r2, the more significant the relationship. Thus, r2 results close to 1.00 mean that changes in one variable are substantially explained by changes in the other. In this example, the r2 of 0.09 reflects a relatively weak relationship.
Concentration Coefficient vs. Portfolio Size(log scale)
r2 = 0.09$1
$10
$100
$1,000
$10,000
0 50 100 150 200concentration coefficient
Port
folio
size
(US$
mill
ion)
Source: The Brandes Institute; Global Wealth Allocation; Russell/Mellon Analytical Services.
Concentration Coefficient vs. Portfolio Size(log scale)

12
To examine this relationship more easily for each peer group, we “removed the dots” and plotted the “best fit” regression lines for each group in Exhibit 10. Exhibit 10
We note that all the best-fit regression lines are positively sloped, using a log scale, suggesting that the relationship between portfolio size and concentration is evident for all five groups. However, none of these best-fit regression lines for the groups in our study shows a strong explanatory relationship between CC and portfolio size. The highest r2 was 0.17 for the small-cap value and small-cap growth groups. While the highest among the groups in our sample, these results are not statistically meaningful. The lowest r2 was 0.02 for the large-cap value group.12 In the next section, we explore the relationship between the CC and returns. VI. Returns And Volatility-Adjusted Returns Now, we turn our attention to how concentration affected the performance of portfolios. To measure performance, we used cumulative relative returns. For each portfolio with at least 12 quarters of consecutive returns, we measured the annualized return relative to the benchmark for the entire history of that portfolio in the database.13 We then calculated the average CC for each portfolio, and plotted the results in Exhibit 11. Implicit in the popularity of focused or highly concentrated portfolios is an assumption that such portfolios exhibit better relative performance than less concentrated portfolios.
12 We observed that the highest slope was for large-cap growth, suggesting a greater influence on CC as the portfolio grows. This may affect how large-cap growth portfolios are managed, however, the limited data prevents a specific conclusion on this issue. 13 Note that some portfolios had return data missing for sporadic periods; because we were measuring relative returns, these missing quarters (which were scored as zero relative return) did not materially impact the cumulative relative return. Because this approach uses “filled data,” we tested an alternate approach to the analysis, using every available 12-quarter period of consecutive data for each portfolio in each peer group. This provides a higher number of data points and gives more emphasis to those portfolios with longer results sequences (as a portfolio with longer than 12 quarters of consecutive data will provide multiple overlapping data points). When charts 10 through 15 were run using these definitions, the conclusions were substantially the same, suggesting similar conclusions could be drawn from the “non-filled data.”
r2 LCV 0.02 LCG 0.08 SCV 0.17 SCG 0.17 INTL 0.10
Source: The Brandes Institute; Global Wealth Allocation; Russell/Mellon Analytical Services.
Concentration Coefficient vs. Portfolio Size
$10
$100
$1,000
$10,000
0 50 100 150 200concentration coefficient
port
folio
siz
e (U
S$ m
illio
ns)
Concentration Coefficient vs. Portfolio Size

13
Exhibit 11
However, as shown in Exhibit 11, we find no statistical relationship between concentration and performance. The regression line is flat and r2 is 0.14 There does appear to be a cone-shaped distribution suggesting that as concentration increased, the dispersion of results increased. This suggests that more concentration in holdings of (assumed) unchanged volatility will result in a wider range of portfolio outcomes.15
14 We recognize that there may be a variety of other factors contributing to the relationship between concentration and performance that we did not (or could not) control for in our methodology. Such factors include management fees, transaction costs, cash positions, currency hedging tactics, emerging markets exposure, and country or industry exposure. Thus, our results do not suggest a strict causal relationship between concentration and performance. 15 We note that our period of study (1992 to 2003) was one of unusual market volatility, including the technology-stock bubble of the late ‘90s and sharp, subsequent bear market. These market conditions influenced results.
Concentration Coefficient vs. Relative Annualized Performance
(R2 = 0.00)
-20%
-10%
0%
10%
20%
0 50 100 150 200concentration coefficient
Rel
ativ
e an
nual
ized
pe
rfor
man
ce
Source: The Brandes Institute; Global Wealth Allocation; Russell/Mellon Analytical Services. Performance is historical, as reported to Russell/Mellon Analytical Services.
Concentration Coefficient vs. Relative Annualized Performance

14
Focusing on individual peer groups did not yield evidence of any material relationship between CC and average yearly outperformance. The small-cap value and international peer groups had flat or slightly positively sloped regression lines while the two growth groups and large-cap value had slight negative slopes. However, the r2 for each group, as shown in the table in Exhibit 12 was very low, providing essentially no explanatory power of performance through concentration. For the table in Exhibit 12, the slope is measured as the percentage change in relative performance for each 100-unit change in CC. Exhibit 12
Source: The Brandes Institute; Global Wealth Allocation; Russell/Mellon Analytical Services. Calculations based upon historical performance, as reported to Russell/Mellon Analytical Services.
Concentration Coefficient vs. Relative Annualized Performance
-20%
-10%
0%
10%
20%
0 50 100 150 200concentration coefficient
rela
tive
annu
aliz
ed p
erfo
rman
ce
r 2 Slope LCV .00 -0.3 LCG .02 -4.0 SCV .00 0.0 SCG .01 -3.0 INTL .00 0.8
CC vs. Relative Ann. Perf.
Concentration Coefficient vs. Relative Annualized Performance

15
In addition to returns, we investigated the relationship between concentration and volatility, as measured by tracking error. As illustrated in Exhibit 13 below, the regression line has a negative slope, indicating that tracking error declines along with concentration. Again, the r2 is low and this regression does not appear to provide a significant statistical connection. Exhibit 13
As we did with performance, we then focused on individual groups, as shown in Exhibit 14. While the r2 remained low for each group, all five regression lines were negatively sloped. For the table in Exhibit 14, the slope is measured as the change in tracking error for each 100-unit change in CC. This pattern is similar to that of the portfolio size statistic: we found there was a relationship between the CC and volatility in each peer group, but the low r2 showed no significant explanatory power.
Exhibit 14
Concentration Coefficient vs. Tracking Error
(R2 = 0.01)
0.00
0.10
0.20
0.30
0 50 100 150 200concentration coefficient
Tra
ckin
g er
ror
Source: The Brandes Institute; Global Wealth Allocation; Russell/Mellon Analytical Services. Performance is historical, as reported to Russell/Mellon Analytical Services.
Source: The Brandes Institute; Global Wealth Allocation; Russell/Mellon Analytical Services. Calculations based upon historical performance, as reported to Russell/Mellon Analytical Services.
Concentration Coefficient vs. Tracking Error
0.00
0.10
0.20
0.30
0 50 100 150 200concentration coefficient
trac
king
err
or
r 2 Slope
LCV .08 -.02 LCG .04 -.05 SCV .04 -.01 SCG .03 -.03 INTL .08 -.03
CC vs. Tracking Error
Concentration Coefficient vs. Tracking Error
Concentration Coefficient vs. Tracking Error

16
Next, we combined results for relative return and tracking error to calculate the portfolios’ information ratios,16 and then plotted this against the CCs. This relationship is dominated by the relative return component (which showed no meaningful relationship) and the essentially flat to modestly negative slopes of the tracking error regression lines had no material impact on the information ratio results, as illustrated in Exhibits 15 and 16. For the table in Exhibit 16, slope is measured as the change in information ratio for each 100-unit change in CC. Exhibit 15
Exhibit 16
16 Information Ratio compares a portfolio’s alpha with its tracking error and is designed to show how much outperformance an actively managed portfolio delivers for every unit of tracking error it posts.
Concentration Coefficient vs. Information Ratio
(R2 = 0.00)-2.00
-1.00
0.00
1.00
2.00
0 50 100 150 200concentration coefficient
info
rmat
ion
ratio
Source: The Brandes Institute; Global Wealth Allocation; Russell/Mellon Analytical Services. Performance is historical, as reported to Russell/Mellon Analytical Services.
Source: The Brandes Institute; Global Wealth Allocation; Russell/Mellon Analytical Services. Calculations based upon historical performance, as reported to Russell/Mellon Analytical Services.
Concentration Coefficient vs. Information Ratio
-2.00
-1.00
0.00
1.00
2.00
0 50 100 150 200concentration coefficient
info
rmat
ion
ratio r 2 Slope
LCV .00 -.23LCG .00 .09SCV .00 -.01SCG .00 .05INTL .01 .13
CC vs. Information Ratio
Concentration Coefficient vs. Information Ratio
Concentration Coefficient vs. Information Ratio

17
VII. Focused Portfolios Recently, an increasing number of investment products have been introduced as focused or “best of the best” strategies. With these portfolios, managers are prepared to concentrate heavily, using only their top stock picks. While the anonymous nature of the data in this study prevents a comparison of specific managers who have diversified and focused offerings, we can look at peer group data among the most concentrated portfolios in our sample. In this phase of our research we sought answers to these questions:
1. In each peer group, does the subgroup of the most concentrated portfolios (CC under 6017) show any evidence of a correlation of CC with relative returns? 2. Does that subgroup on average post better relative returns than the whole peer group?
With respect to the first question, Exhibits 17 and 18 suggest there is no systematic relationship in the sub-groups. The r2 statistics are still very low, and the regression lines have modest slopes, if any, providing conflicting evidence. For the table in Exhibit 18 (on the next page), the slope is measured as the percentage change in relative performance for each 100-unit change in CC. The growth groups and large-cap value regression lines have a slight negative slope, while the small-cap value and international groups have slight positive slopes. Statistically, there appears to be no confirming evidence of any material relationship between extreme levels of concentration and relative performance. Exhibit 17
17 We used a CC of 60 to designate “most” concentrated because our data provided sufficient observations at this level to make our conclusions statistically significant.
Concentration Coefficient (0-60) vs. Relative Annualized Performance
(R2 = 0.00)
-20%
-10%
0%
10%
20%
0 15 30 45 60concentration coefficient
Rel
ativ
e an
nual
ized
per
form
ance
Source: The Brandes Institute; Global Wealth Allocation; Russell/Mellon Analytical Services. Performance is historical, as reported to Russell/Mellon Analytical Services.
Concentration Coefficient (0-60) vs. Relative Annualized Performance

18
Exhibit 18
With regard to the second question, we analyzed the average performance of all the portfolios in each peer group relative to their respective benchmarks, then separated those with CCs below 60 (“focused”) from those with CCs over 60 (“diversified”). Consistent with our previous findings, concentration showed little relationship with performance. As shown in Exhibit 19, the focused portfolios for large-cap value, small-cap value, and small-cap growth performed slightly worse than their diversified counterparts. International and large-cap growth peer groups showed the reverse: slight outperformance by focused portfolios. Note that we hesitate in placing great significance on these results given the relatively small number of observations in our peer groups and the limited time period of our study. Nevertheless, there seems to be no supporting statistical evidence for systematic outperformance by focused portfolios. Exhibit 19: Performance Difference – Focused vs. Diversified
Average Performance Difference Focused (CC under 60) – Diversified (CC over 60)
LCV -0.51% LCG 0.53% SCV -0.50% SCG -0.56% INTL 1.05%
Source: The Brandes Institute; Global Wealth Allocation; Russell/Mellon Analytical Services. Calculations based upon historical performance, as reported to Russell/Mellon Analytical Services.
Source: The Brandes Institute; Global Wealth Allocation; Russell/Mellon Analytical Services. Calculations based upon historical performance, as reported to Russell/Mellon Analytical Services.
Concentration Coefficient (0-60) vs. Relative Ann. Performance
-20%
-10%
0%
10%
20%
0 15 30 45 60concentration coefficient
rela
tive
annu
aliz
ed p
erfo
rman
ce
r 2 SlopeLCV .01 -2.0LCG .04 -0.9SCV .04 7.0SCG .01 -7.0INTL .06 13.0
CC (0-60) vs. Relative Annualized Perf.
Concentration Coefficient (0-60) vs. Relative Annualized Performance

19
VIII. Conclusions Until now, concentration in portfolios has not been well defined, but increasingly seems to be regarded as a positive, based on the recent pace of introductions of more focused portfolios. In this study, we believe we have provided a more useful definition of concentration, in that it can be measured easily, can be applied to all types of portfolios, and allows comparisons over time, against peers, and against indices. We are hopeful that investment managers, consultants, and their clients will be able to use this concentration coefficient as an objective measure for improved understanding of portfolio characteristics. As such, this paper offers a starting point for additional work. The nature of the data (including anonymity of managers) limits our conclusions to the study of the concentration characteristics of aggregate peer groups. We cannot provide insight in this paper regarding its application to specific managers or portfolios. This task is therefore left to the reader, to apply the concentration coefficient formula to compare specific portfolios or managers. However, applying the concept to available universes of peer group portfolios provides no evidence to support the implicit assumption in the adoption of more focused portfolios. More concentration, in and of itself, does not provide improved returns, nor does it provide improved volatility-adjusted returns. Due to the anonymity of the data as noted above, we are not able to test what happens when a manager with consistent outperformance in a diversified portfolio introduces a more concentrated version of the same strategy. Thus, while outside the scope of this research, it is entirely possible that such an outperforming manager can provide even more outperformance by increasing concentration (and vice versa, of course). In our opinion, what is evident is that investors, when selecting investment managers, should not assume that concentration is the “right answer.” In aggregate, selecting a set of managers purely because they are concentrated, likely will result in no improvement in aggregate performance, and could actually impair volatility-adjusted performance. Selecting the most appropriate manager should be the correct approach. Only when that decision is made, should the amount of concentration come under review.

20
Appendix Exhibit A1 was referenced in footnote 7 in the body of the paper. It illustrates the unadjusted quarterly CC for the small-cap indices. Exhibit A1
Source: The Brandes Institute; Global Wealth Allocation; Russell/Mellon Analytical Services.
Small Cap CCs
350
600
850
Mar-80 Mar-85 Mar-90 Mar-95 Mar-00
Con
cent
ratio
n C
oeff
icie
nt
R2000V R2000G
Small Cap CCs

21
Disclosure Index Definitions Russell 1000® Value Index: The Russell 1000 Value Index is an unmanaged index that measures the performance of those Russell 1000 Index companies with lower price-to-book ratios and lower forecasted growth rates. It includes the reinvestment of dividends and income, but does not reflect fees, brokerage commissions, or other expenses of investing. Russell 1000® Growth Index: The Russell 1000 Growth Index is an unmanaged index that measures the performance of those Russell 1000 Index companies with higher price-to-book ratios and higher forecasted growth rates. It includes the reinvestment of dividends and income, but does not reflect fees, brokerage commissions, or other expenses of investing. Russell 2000® Value Index: The Russell 2000 Value Index is an unmanaged index that measures the performance of those Russell 2000 Index companies with lower price-to-book ratios and lower forecasted growth rates. It includes the reinvestment of dividends and income, but does not reflect fees, brokerage commissions, or other expenses of investing. Russell 2000® Growth Index: The Russell 2000 Growth Index is an unmanaged index that measures the performance of those Russell 2000 Index companies with higher price-to-book ratios and higher forecasted growth rates. It includes the reinvestment of dividends and income, but does not reflect fees, brokerage commissions, or other expenses of investing. The Russell 3000® Index: the Russell 3000 Index is an unmanaged index designed to measure the performance of the broad U.S. equity universe representing approximately 98% of the U.S. market. The Russell 3000 is completely reconstituted annually. It includes the reinvestment of dividends and income, but does not reflect fees, brokerage commissions, or other expenses of investing. MSCI EAFE Index: The MSCI EAFE Index consists of equities from Europe, Australasia, and the Far East. The index is often used as a benchmark for international equity portfolios and includes dividends and distributions, but does not reflect fees, brokerage commissions, or other expenses of investing. This material is intended for informational purposes only. It is not meant to be an offer, solicitation or recommendation to purchase or sell any particular security outside of a managed account. It should not be assumed that any security, holdings, or sector discussed were or will be profitable, or that the investment recommendations or decisions we make in the future will be profitable or will equal the investment performance discussed herein. International securities involve additional risk such as currency fluctuation and political instability. Stocks of small companies usually experience more volatility than mid and large sized U.S. companies. No investment plan or strategy can assure a profit or protect against loss. Please note that all indices are unmanaged and are not available for direct investment. This information was prepared, in part, by the Brandes Institute, a division of Brandes Investment Partners. The foregoing reflects the thoughts and opinions of Brandes Investment Partners. Brandes Investment Partners is a registered trademark in the United States.
11988 El Camino Real I Suite 500 I P.O. Box 919048 I San Diego, CA 92191-9048 I 858.755.0239 I 800.237.7119
Fax 858.755.0916 I www.brandes.com/institute I [email protected]


![spcl.inf.ethz.chspcl.inf.ethz.ch/Publications/.pdf/pushpull-slides.pdf · spcl.inf.ethz.ch @spcl_eth 1. Forward traversals BETWEENNESS CENTRALITY BRANDES [1] [1] U. Brandes. A faster](https://static.fdocuments.us/doc/165x107/5f93dd3f74a1c70c3d675e39/spclinfethz-spclinfethzch-spcleth-1-forward-traversals-betweenness-centrality.jpg)