An Examination of Socially Responsible Board Structure for firms
24
An Examination of Socially Responsible Firms’ Board Structure 1 ELIZABETH WEBB School of Business Administration, 5998 Alcala Park, San Diego, CA 92110, USA, E-mail: [email protected] Abstract. This study investigates the structure of the board of directors at socially responsible (SR) firms. Using a sample of 394 SR firms and comparing these to a matched sample of firms, I find that SR firms have characteristics associated with effective board structures. For instance, SR firms have more outsiders and women directors, and less instance of CEO/Chairman duality than non-SR firms. Results are similar when using a continuous measure of social responsibility. Also, I document that SR firms have higher Governance Index scores than the matched sample. Overall, this suggests that a reason for shareholders’ appeal in socially responsible firms and mutual funds may be because these firms have stronger governance mechanisms in place than do non-SR firms. In addition, it appears that effective governance structures are more likely to exist in firms that focus on a broad range of stakeholders, rather than in firms that have a strict focus on shareholder wealth maximization. Key words: agency theory, boards of directors, corporate governance, social responsibility, socially responsible investing 1. Introduction With the crash of tech stocks in the late 1990s and the proliferation of corporate accounting scandals a few years later, corporate governance has become a central issue in the business world. Since the cost of personally monitoring firms is too high for individual investors to bear, they must rely on governance mechanisms whose function it is to monitor manager activity on behalf of the shareholders. Without a strong governance sys- tem in place, managers may take advantage of their insider position at the expense of shareholders. It is precisely this activity that has caused de- creases in overall stock market investments, yet one sector of the market remained strong. Investments in so-called socially responsible firms (SR) and mutual funds have increased, despite the fact that historical returns on these investments are not different from other firms and funds. 2 In fact, in February 2003 Lipper, a firm that tracks 80,000 mutual funds Journal of Management and Governance 8: 255–277, 2004. Ó 2004 Kluwer Academic Publishers. Printed in the Netherlands. 255
description
Examination into the Social Responsibility of the Board Structure established by firms
Transcript of An Examination of Socially Responsible Board Structure for firms
An Examination of Socially Responsible Firms’
Board Structure1
ELIZABETH WEBBSchool of Business Administration, 5998 Alcala Park, San Diego, CA 92110, USA, E-mail:[email protected]
Abstract. This study investigates the structure of the board of directors at sociallyresponsible (SR) firms. Using a sample of 394 SR firms and comparing these to a matched
sample of firms, I find that SR firms have characteristics associated with effective boardstructures. For instance, SR firms have more outsiders and women directors, and lessinstance of CEO/Chairman duality than non-SR firms. Results are similar when using a
continuous measure of social responsibility. Also, I document that SR firms have higherGovernance Index scores than the matched sample. Overall, this suggests that a reason forshareholders’ appeal in socially responsible firms and mutual funds may be because these
firms have stronger governance mechanisms in place than do non-SR firms. In addition, itappears that effective governance structures are more likely to exist in firms that focus on abroad range of stakeholders, rather than in firms that have a strict focus on shareholder
wealth maximization.
Key words: agency theory, boards of directors, corporate governance, social responsibility,
socially responsible investing
1. Introduction
With the crash of tech stocks in the late 1990s and the proliferation ofcorporate accounting scandals a few years later, corporate governance hasbecome a central issue in the business world. Since the cost of personallymonitoring firms is too high for individual investors to bear, they mustrely on governance mechanisms whose function it is to monitor manageractivity on behalf of the shareholders. Without a strong governance sys-tem in place, managers may take advantage of their insider position at theexpense of shareholders. It is precisely this activity that has caused de-creases in overall stock market investments, yet one sector of the marketremained strong. Investments in so-called socially responsible firms (SR)and mutual funds have increased, despite the fact that historical returnson these investments are not different from other firms and funds.2 In fact,in February 2003 Lipper, a firm that tracks 80,000 mutual funds
Journal of Management and Governance 8: 255–277, 2004.
� 2004 Kluwer Academic Publishers. Printed in the Netherlands.255
worldwide, reported that SR mutual funds experienced a net inflow of$1.5 billion in 2002, while the non-designated SR funds in the US expe-rienced a total outflow of $10.5 billion.
Interest in socially responsible firms is not a new phenomenon. Since theaugust 1971 launch of the Pax World Balance Fund, the first mutual fund inthe US to use broad-based social and financial criteria for screening pur-poses, ‘‘green’’ mutual funds have flourished in the past three decades. SRfunds generally are comprised of the equity of firms that are screened on thebasis of several characteristics of stakeholder awareness including communityinvestment, environmental issues, employment practices, and shareholderrights. According to the Social Investment Forum, nearly $1 of every $8under professional management in the US is in a SR portfolio, and socialinvestment grew from $1.185 trillion in 1997 to $2.16 trillion in 1999. Thisgrowth rate is roughly twice that of all assets under professional managementin the US. By 2003, Lipper reported that 199 SR investment funds were inexistence, up from 88 funds in 1999.
Despite increases in investor interest in SR firms, there is little evidencesuggesting that these firms have stronger financial performance than theircompetitors. A reason for this may simply be that some investors prefersocially responsible firms because these firms do more social good. The factthat these firms are deemed SR implies that they are concerned with firmstakeholders. Since stakeholder consideration is central to Tirole’s (2001)view of corporate governance, these firms may have stronger governancestructures in place. Strong governance may be important to all investors(especially in the midst of corporate transgressions), regardless of personal orinstitutional interest in corporate social responsibility. The purpose of thisstudy, therefore, is to investigate corporate governance structures of SRfirms, since interest in strong monitoring in light of today’s corporateindignities may influence investor choice. Specifically, I analyze the charac-teristics of the boards of directors of SR and non-SR firms. The resultssupport the hypothesis that SR firms possess characteristics associated withstronger board structure.
Johnson (1966) called for more empirical work to be done in analyzingdistinctions in SR firm behavior, and 40 years later, further exploration isstill needed. This study adds to the growing literature on the SR firms andcorporate governance by, specifically, showing how firms characterized as SRare better able to minimize agency problems through effective boardstructure arrangements. Additionally, the results suggest that firms withstrong boards in place are more likely to be firms focused on a variety ofstakeholders. This study also helps to fill a research gap that existsconcerning the relationship between SR firms and governance structure.
The rest of the paper is organized as follows: Section 2 reviews the liter-ature on strong board structure characteristics, and socially responsible
256 ELIZABETH WEBB
firms, and presents hypotheses; Section 3 describes the data and methodol-ogy; Section 4 analyzes the results; and Section 5 concludes.
2. Literature Review and Hypotheses
2.1. DEFINING STRONG BOARD STRUCTURE
According to Jensen and Meckling (1976), the board of directors acts onshareholders’ behalf to monitor managers as a market solution to the con-tracting problems inherent in organizations. The results of over 20 years ofboard structure research indicate that boards that are best able to do this arethose that can best alleviate agency problems between shareholders andmanagers through independent internal control.
In a survey paper on corporate governance and board effectiveness, Johnand Senbet (1998) find that empirical governance literature suggests that thedegree of board independence is related to composition, and that indepen-dence fosters board effectiveness. Several examples follow. Beasley et al.(2000) find evidence that weak governance structure is associated with agencyproblems and subsequent poor performance. The authors analyze the boardcharacteristics of firms with instances of financial statement fraud andcompare these results to a benchmark sample. Results indicate that thefraudulent companies have weak (ineffective) governance structures relativeto the benchmark (no-fraud) firms. As compared to fraud firms, the no-fraudfirms have more outsiders on the board, shorter tenure for board members,less chance that the CEO is the founder of the firm, smaller probability thatthe CEO is the chairman of the board, and are more likely to have ablockholder (a shareholder holding more than 5% of the outstanding stock)on the board.
Howton et al. (2001) analyze board structure and IPO underpricing. Theauthors show that because of the monitoring function provided by boardmembers for shareholders of the firm, a strong board (more outside owner-ship) will alleviate agency problems between the two parties by reducingasymmetric information, and thus reducing the extent of IPO underpricing.
Core et al. (1999) also report that firms with weaker governance structureshave more agency problems. They find an inverse relationship between boardstrength and characteristics such as the percentage of the board composed ofinside directors, board size, ‘‘gray’’ directors (those directors who are notofficially insiders, but who perform substantial services for the firm in ex-change for compensation), directors over the age of 69, busy directors(directors on three or more other boards), and CEO is also the board chair.
Studies on specific board characteristics support the idea that strongboards are those that possess characteristics contributing to independence.For example, Ferris et al. (2003) find that directors with multiple board
AN EXAMINATION OF SOCIALLY RESPONSIBLE FIRMS 257
appointments (busy directors) are effective monitors. This is consistent withShivdasani (1993), who also finds that the same argument holds for outsidedirectors who are CEOs of other companies. In a study on founding familyCEOs, Jayaraman et al. (2000) find that the relationship between stockperformance and founder management (CEO is the founder) is positive forsmall firms yet negative for large firms. Rosenstein and Wyatt (1997) look therelationship between stock market reaction to inside director appointmentsand insider stock ownership. They find that a significant negative and zeroreaction occurs when insiders own very little or a very large portion of thefirm’s stock, respectively.
The literature emphasizes characteristics that encourage active monitoringon the part of directors. In most industries and situations, having more of thegood characteristics and less of the bad is preferred. An exception to this ruleis in the banking industry, where larger boards are more efficient than havingfew directors.3 In addition, the literature focuses primarily on publicly tradedUS firms and therefore consideration of private firms and foreign countries’regulatory environment is needed before extending results and implicationsinternationally.
2.2. INCORPORATING SOCIAL RESPONSIBILITY
While corporate governance and board structure are becoming mainstreamtopics in academic literature, the area of social responsibility has receivedmuch less attention. Milton Friedman defined ‘‘corporate social responsi-bility’’ in 1970 when he said that it is ‘‘to conduct the business in accordancewith shareholders’ desires, which generally will be to make as much money aspossible while conforming to the basic rules of society, both those embodiedin law and those embodied in ethical custom.’’ More recently, Carroll (1991)uses a broader definition of corporate social responsibility. According toCarroll, corporate social responsibility ‘‘refers to a business entity’s attentionto and fulfillment of responsibilities to multiple stakeholders which exist atvarious levels: economic, legal, ethical, and philanthropic’’. SR firms there-fore are those firms considered to be positively affecting a broad class ofstakeholders.
Studies on the relationship between corporate social responsibility andfinancial performance report mixed results. Waddock and Graves (1997)address the question of whether CSP and financial performance are re-lated. Using a constructed index from the firm Kinder, Lydenberg, andDomini and financial statement data, they find that CSP and profitabilityare positively related.4 They suggest that causality goes both ways in thatfirms with strong financial performance have slack resources that can bespent on CSP measures, and that good social performance ‘‘may be linked
258 ELIZABETH WEBB
to good managerial practice,’’ which in turn leads to strong financialperformance. These results are consistent with earlier evidence by McGuireet al. (1988), who find a positive relationship between prior stock marketand accounting-based measures of performance and socially responsibility.
However, in their study on the financial effects of shareholder pressure inthe boycott of South Africa, Teoh et al. (1999) find that the divestment hadno effect on stock price. Avoidance of South African investments is oftenused as a filter for firms in SR mutual funds. Thus it appears that despitebeing the most visible and successful instance of social activism aimed atcorporate investment policies, the boycott of South Africa had little financialimpact. Also, Hillman and Keim (2001) show that participating in socialissues that are unrelated to the core business of the firm actually hurts thefirm’s financial performance.
Given the mixed results of SR firms’ financial performance, it is worth-while to explore any distinction in other areas of firm organization that mightlead to reasons for investors’ sustained growth and interest in these types offirms. Tirole (2001) defines corporate governance as ‘‘the design of institu-tions that induce or force management to internalize the welfare of stake-holders.’’ In that vein, I analyze the characteristics in socially responsiblefirms’ boards of directors since these firms publicly acknowledge theirstakeholders and therefore may have stronger governance systems in placegiven Tirole’s view of corporate governance. The null hypothesis in this paperis that there is no difference in the characteristics of SR and non-SR firms’boards of directors. The alternative hypothesis is that SR boards possessmore characteristics associated with stronger boards than do non-SR boards.
3. Data and Methodology
3.1. DATA COLLECTION AND CHARACTERISTICS
To measure and compare the corporate governance structure characteristicsof SR vs non-SR firms, the 400 firms in the DSI (as of November 2001) areused along with a matched sample. The DSI is a portfolio of ethicallyscreened stocks from publicly traded firms in the US The social investmentresearch firm of Kinder, Lydenberg, Domini and Company constructs theindex. Firms in this index must pass multiple broad-based social screens.Firms must have a positive record of shareholder activism, communityinvestment, environmental concerns, human rights, employment, and prod-ucts and services. Firms from the alcohol, tobacco, and gambling industries,as well as firms involved in weapon and nuclear power production, areexcluded from the index.
The use of the DSI is appropriate as a sample of SR firms as it encom-passes a wide range of social and environmental screens. An important
AN EXAMINATION OF SOCIALLY RESPONSIBLE FIRMS 259
advantage for using the DSI over other available socially screened portfoliosis that a group of independent researchers applies the same broad set ofcriteria to the firms.
Each firm from the DSI is matched with a non-SR firm based onindustry and size (as in Beasley (1996)). Matching by industry is animportant control in board structure literature, since optimal boardcharacteristics vary by industry (see Gillan et al. (2003)). The non-SRfirms in this study are then selected by locating the firm closest in marketcapitalization (size) to each SR firm within the same three-digit SIC code(industry) in 2001. Thus, an initial sample of 400 SR firms and 400non-SR firms is compiled.5
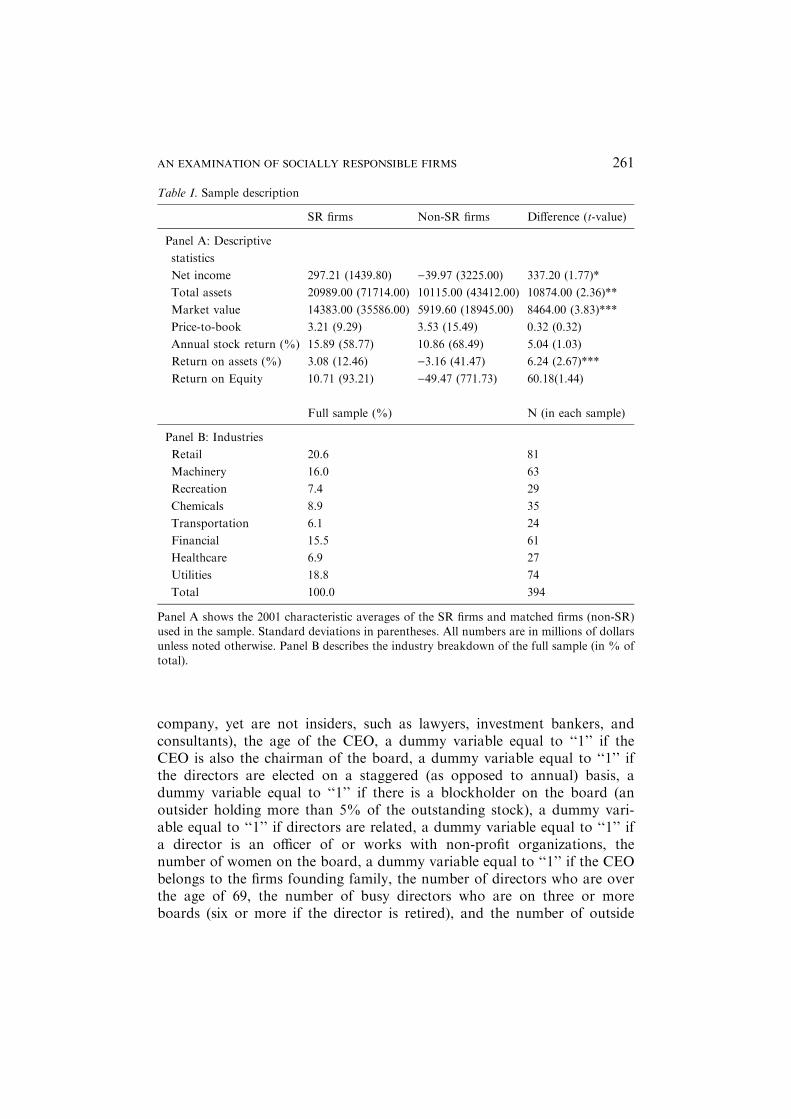
Panel A in Table I shows the characteristics of both samples from 2001. Itis evident that the SR firms from the DSI are larger overall than the matchedsample. The SR firms have significantly higher net income, total assets,market value, and return on assets than the non-SR sample. This is to beexpected, since many of the firms listed in the DSI are large firms within theirindustry, and once a firm is included in the matched sample it cannot be usedas a match for a subsequent SR firm. This results in the tendency of matchedfirms to be smaller than SR firms within the same industry. According toGillan et al. (2003), industry matching is important in empirical boardstructure research such that size differences between samples may not affectoverall results. Later, this assumption is tested in the robustness checks.Price-to-book ratios, annual returns, and return on equity are not signifi-cantly different between samples, supporting the motivation for this studysince investment popularity in SR firms is growing despite negligible gains infinancial returns. Data on the SR sample and the matched firms taken from1998 to 2000 show similar results (not reported).
Panel B of Table I shows the industry representation for both the SR andnon-SR samples (since they are matched by industry, both have the samerepresentation). Industries are identified using the Fama and French (1997)industry assignment schedule which apportions firms into one of 48 indus-tries based on four-digit SIC codes. To conserve space, the 48 industries aredivided into eight general categories. The DSI and the subsequent matchedsample are widely distributed in terms of industry.
Structural characteristics of the board of directors for both samples aretaken from proxy statements issued in 2001.6 In order to test the hypothesisthat SR firms have stronger governance structures in place than their non-SR counterparts, sixteen board characteristics are analyzed as outlined inSection 2. Variables collected from proxy statements include the following:the number of insiders (those directors who are currently employed by thefirm or have been employed by the firm in the past), the number of out-siders (directors with no affiliation to the firm), the number of ‘‘gray’’directors (directors who are have substantial business relationships with the
260 ELIZABETH WEBB
company, yet are not insiders, such as lawyers, investment bankers, andconsultants), the age of the CEO, a dummy variable equal to ‘‘1’’ if theCEO is also the chairman of the board, a dummy variable equal to ‘‘1’’ ifthe directors are elected on a staggered (as opposed to annual) basis, adummy variable equal to ‘‘1’’ if there is a blockholder on the board (anoutsider holding more than 5% of the outstanding stock), a dummy vari-able equal to ‘‘1’’ if directors are related, a dummy variable equal to ‘‘1’’ ifa director is an officer of or works with non-profit organizations, thenumber of women on the board, a dummy variable equal to ‘‘1’’ if the CEObelongs to the firms founding family, the number of directors who are overthe age of 69, the number of busy directors who are on three or moreboards (six or more if the director is retired), and the number of outside
Table I. Sample description
SR firms Non-SR firms Difference (t-value)
Panel A: Descriptive
statistics
Net income 297.21 (1439.80) )39.97 (3225.00) 337.20 (1.77)*
Total assets 20989.00 (71714.00) 10115.00 (43412.00) 10874.00 (2.36)**
Market value 14383.00 (35586.00) 5919.60 (18945.00) 8464.00 (3.83)***
Price-to-book 3.21 (9.29) 3.53 (15.49) 0.32 (0.32)
Annual stock return (%) 15.89 (58.77) 10.86 (68.49) 5.04 (1.03)
Return on assets (%) 3.08 (12.46) )3.16 (41.47) 6.24 (2.67)***
Return on Equity 10.71 (93.21) )49.47 (771.73) 60.18(1.44)
Full sample (%) N (in each sample)
Panel B: Industries
Retail 20.6 81
Machinery 16.0 63
Recreation 7.4 29
Chemicals 8.9 35
Transportation 6.1 24
Financial 15.5 61
Healthcare 6.9 27
Utilities 18.8 74
Total 100.0 394
Panel A shows the 2001 characteristic averages of the SR firms and matched firms (non-SR)used in the sample. Standard deviations in parentheses. All numbers are in millions of dollarsunless noted otherwise. Panel B describes the industry breakdown of the full sample (in % oftotal).
AN EXAMINATION OF SOCIALLY RESPONSIBLE FIRMS 261
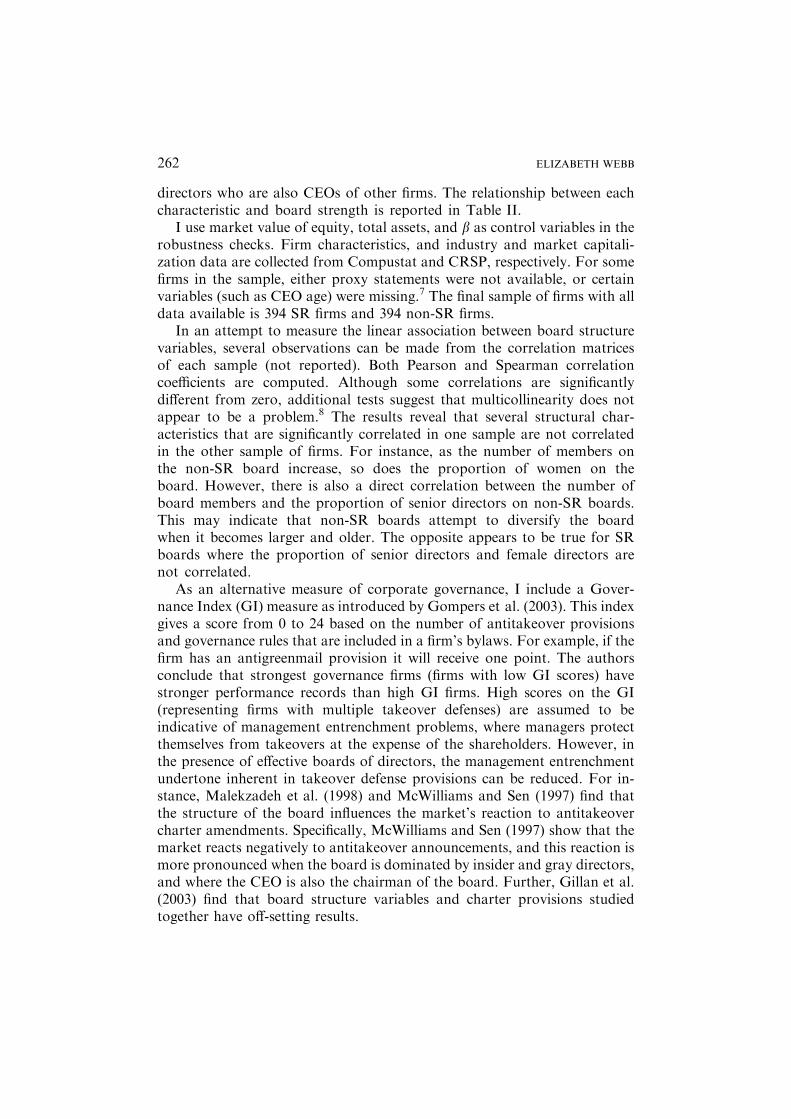
directors who are also CEOs of other firms. The relationship between eachcharacteristic and board strength is reported in Table II.
I use market value of equity, total assets, and b as control variables in therobustness checks. Firm characteristics, and industry and market capitali-zation data are collected from Compustat and CRSP, respectively. For somefirms in the sample, either proxy statements were not available, or certainvariables (such as CEO age) were missing.7 The final sample of firms with alldata available is 394 SR firms and 394 non-SR firms.
In an attempt to measure the linear association between board structurevariables, several observations can be made from the correlation matricesof each sample (not reported). Both Pearson and Spearman correlationcoefficients are computed. Although some correlations are significantlydifferent from zero, additional tests suggest that multicollinearity does notappear to be a problem.8 The results reveal that several structural char-acteristics that are significantly correlated in one sample are not correlatedin the other sample of firms. For instance, as the number of members onthe non-SR board increase, so does the proportion of women on theboard. However, there is also a direct correlation between the number ofboard members and the proportion of senior directors on non-SR boards.This may indicate that non-SR boards attempt to diversify the boardwhen it becomes larger and older. The opposite appears to be true for SRboards where the proportion of senior directors and female directors arenot correlated.
As an alternative measure of corporate governance, I include a Gover-nance Index (GI) measure as introduced by Gompers et al. (2003). This indexgives a score from 0 to 24 based on the number of antitakeover provisionsand governance rules that are included in a firm’s bylaws. For example, if thefirm has an antigreenmail provision it will receive one point. The authorsconclude that strongest governance firms (firms with low GI scores) havestronger performance records than high GI firms. High scores on the GI(representing firms with multiple takeover defenses) are assumed to beindicative of management entrenchment problems, where managers protectthemselves from takeovers at the expense of the shareholders. However, inthe presence of effective boards of directors, the management entrenchmentundertone inherent in takeover defense provisions can be reduced. For in-stance, Malekzadeh et al. (1998) and McWilliams and Sen (1997) find thatthe structure of the board influences the market’s reaction to antitakeovercharter amendments. Specifically, McWilliams and Sen (1997) show that themarket reacts negatively to antitakeover announcements, and this reaction ismore pronounced when the board is dominated by insider and gray directors,and where the CEO is also the chairman of the board. Further, Gillan et al.(2003) find that board structure variables and charter provisions studiedtogether have off-setting results.
262 ELIZABETH WEBB
Table II. Summary of strong board characteristics from prior research
Characteristic Relationship with
board strength
Related research
Percentage of outsiders + Core, Holthausen, and
Larcker (1999) (CHL)
Fama (1980)
Beasley (1996)
Howton, Howton, and Olson (2001)
Percentage of insiders ) CHL (1999)
Rosenstein and Wyatt (1997)
Percentage of ‘‘gray’’ directors ) CHL (1999)
Board size ) Yermack (1996)
CEO is not chairman + CHL (1999)
Jensen (1993)
Yermack (1996)
Board diversity + Carter, Simkins, and Simpson (2003)
Senior citizens on board ) CHL (1999)
Busy directors + Shivdasani (1993)
CHL (1999)
Ferris, Jagannathan, and
Pritchard (2003)
Blockholder on board + Beasley (1996)
CEO is from founding family ) Burkart, Panuzi, and Schleifer (2002)
Jayaraman, Khorana, Nelling, and
Covin (2000)
Bacon, Cornett, and Davidson (1997)
Senior CEO ) CHL (1999)
Board meetings ) Bacon, Cornett, and Davidson (1997)
Annual elections + Jensen (1993)
Family directors ) Jensen (1993)
CEO directors + Shivdasani (1993)
Directors with non-profits +
Governance Index ) Gompers, Ishii, and Metrick (2003)
Gillan, Hartzell, and Starks (2003)
McWilliams and Sen (1997)
Percentage of outsiders indicates the fraction of the board that is not affiliated with thecompany. Percentage of insiders represents the fraction of the total board members who are(or have been) also officers of the company. Percentage of gray directors is those directors whohave substantial business relationships with the company, yet are not insiders. Senior citizens
include any director that is over the age of 69. Busy directors indicate the percentage ofdirectors who are on three or more other boards (six or more if board member is retired).Blockholder indicates whether or not an outside director holds more than 5% of the
outstanding stock of the firm. Senior CEO indicates that the CEO is over the age of 69. Familyindicates the presence of related board members. CEO directors represent the percentage ofoutside directors who are also CEOs of other firms. GI represents the Governance Index
antitakeover score as measured by Gompers et al. (2003).
AN EXAMINATION OF SOCIALLY RESPONSIBLE FIRMS 263
Since board structure can alter the nature of antitakeover amendments,firms with stronger board characteristics in place may be able to afford moretakeover provisions without contributing to management entrenchment. Forthis reason, the hypothesis is that SR firms should have lower GI scores thanthe non-SR firms, but this difference may be small.
An additional variable is collected for a portion of the total sample fromthe KLD Socrates Database. This database compiles a continuous scoringmechanism that rates companies on the various degrees of social responsi-bility including community, diversity, employee interests, environment, andshareholder interests.
3.2. METHODOLOGY
Univariate and multivariate analyses are used to test the hypothesis that SRboards are stronger than non-SR boards. I use a two-sample paired t-test andnonparametric paired Wilcoxon rank-sum test for difference of means inorder to compare specific board structure variables between SR andnon-designated SR firms in a univariate setting.
I use logistic regression to examine the relationship between firm type(either SR or non-SR) and board structure in a multivariate setting. Theequation is as follows
probðy ¼ 1Þ ¼ e�xb
1þ exb
where y ¼ 1 if the firm is socially responsible, 0 otherwise, and X is the vectorof the sixteen governance structure variables described in the Section 3.1. andb is the vector of parameters plus an intercept term.
Also, by using a continuous measure of social responsibility I am able toanalyze the effect of board structure. To examine whether or not boardcharacteristics are related to social responsibility, I report a multipleregression model with the KLD score as the dependent variable and theboard data as independent variables.
4. Results
4.1. UNIVARIATE STATISTICS
The results for the two-sample paired t-tests and Wilcoxon rank sum tests aredocumented in Table III. Both tests provide similar results. There is a sta-tistically significant difference between SR and non-SR firms for ten of theseventeen governance structure variables (including GI score). For nine ofthe ten significant board structure variables, the hypothesized relationshipsbetween governance variables of SR and non-SR firms are supported.
264 ELIZABETH WEBB
However, the GI score and board size have the opposite sign as to what wasexpected, supporting evidence suggesting that takeover defenses and boardstructure are substitute methods of effective governance.9
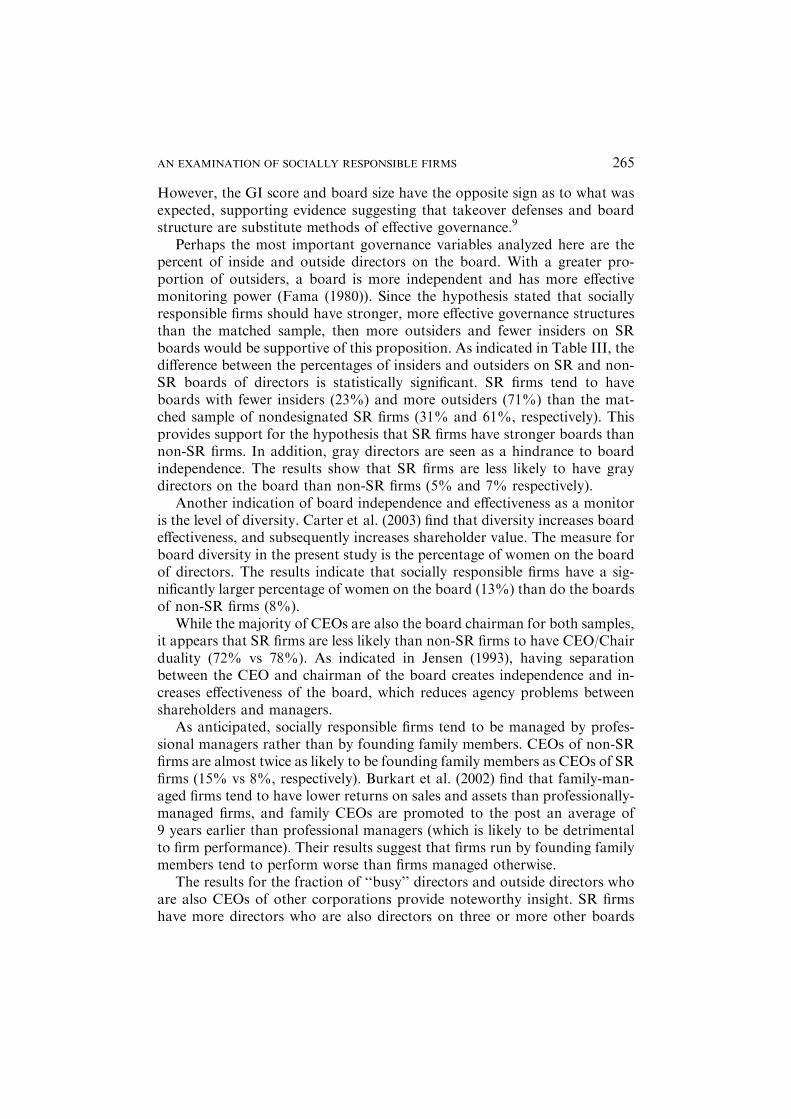
Perhaps the most important governance variables analyzed here are thepercent of inside and outside directors on the board. With a greater pro-portion of outsiders, a board is more independent and has more effectivemonitoring power (Fama (1980)). Since the hypothesis stated that sociallyresponsible firms should have stronger, more effective governance structuresthan the matched sample, then more outsiders and fewer insiders on SRboards would be supportive of this proposition. As indicated in Table III, thedifference between the percentages of insiders and outsiders on SR and non-SR boards of directors is statistically significant. SR firms tend to haveboards with fewer insiders (23%) and more outsiders (71%) than the mat-ched sample of nondesignated SR firms (31% and 61%, respectively). Thisprovides support for the hypothesis that SR firms have stronger boards thannon-SR firms. In addition, gray directors are seen as a hindrance to boardindependence. The results show that SR firms are less likely to have graydirectors on the board than non-SR firms (5% and 7% respectively).
Another indication of board independence and effectiveness as a monitoris the level of diversity. Carter et al. (2003) find that diversity increases boardeffectiveness, and subsequently increases shareholder value. The measure forboard diversity in the present study is the percentage of women on the boardof directors. The results indicate that socially responsible firms have a sig-nificantly larger percentage of women on the board (13%) than do the boardsof non-SR firms (8%).
While the majority of CEOs are also the board chairman for both samples,it appears that SR firms are less likely than non-SR firms to have CEO/Chairduality (72% vs 78%). As indicated in Jensen (1993), having separationbetween the CEO and chairman of the board creates independence and in-creases effectiveness of the board, which reduces agency problems betweenshareholders and managers.
As anticipated, socially responsible firms tend to be managed by profes-sional managers rather than by founding family members. CEOs of non-SRfirms are almost twice as likely to be founding family members as CEOs of SRfirms (15% vs 8%, respectively). Burkart et al. (2002) find that family-man-aged firms tend to have lower returns on sales and assets than professionally-managed firms, and family CEOs are promoted to the post an average of9 years earlier than professional managers (which is likely to be detrimentalto firm performance). Their results suggest that firms run by founding familymembers tend to perform worse than firms managed otherwise.
The results for the fraction of ‘‘busy’’ directors and outside directors whoare also CEOs of other corporations provide noteworthy insight. SR firmshave more directors who are also directors on three or more other boards
AN EXAMINATION OF SOCIALLY RESPONSIBLE FIRMS 265
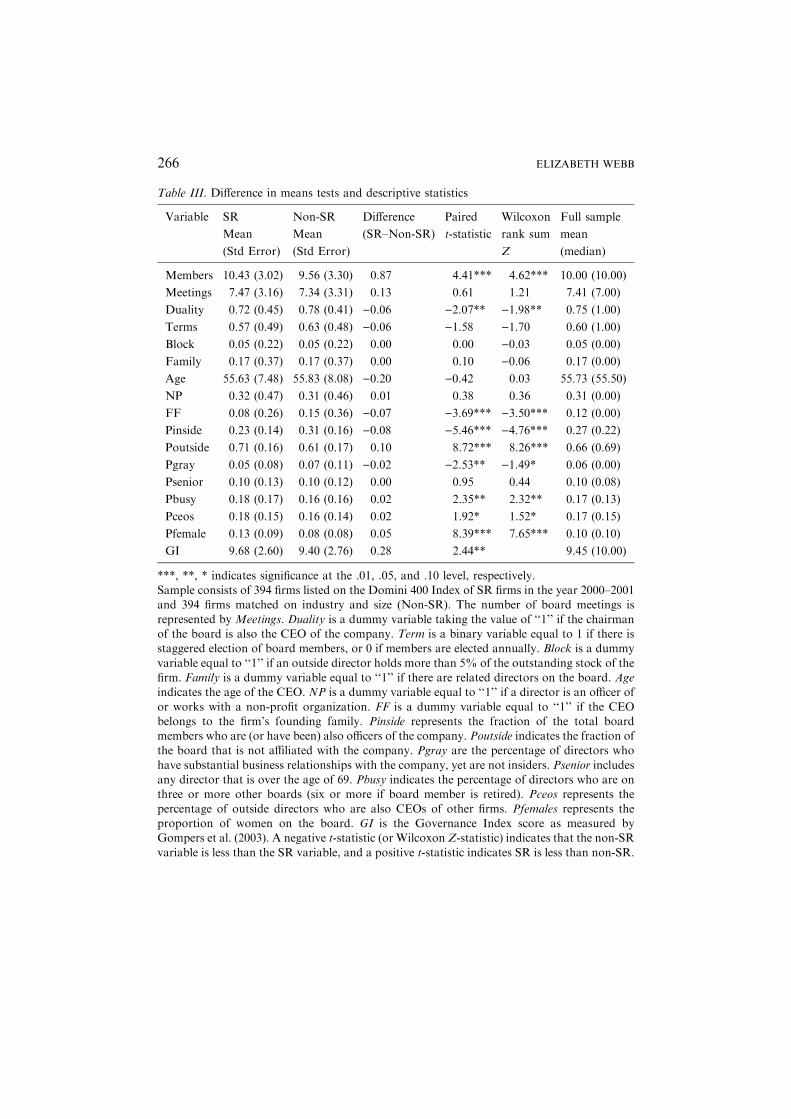
Table III. Difference in means tests and descriptive statistics
Variable SR
Mean
(Std Error)
Non-SR
Mean
(Std Error)
Difference
(SR–Non-SR)
Paired
t-statistic
Wilcoxon
rank sum
Z
Full sample
mean
(median)
Members 10.43 (3.02) 9.56 (3.30) 0.87 4.41*** 4.62*** 10.00 (10.00)
Meetings 7.47 (3.16) 7.34 (3.31) 0.13 0.61 1.21 7.41 (7.00)
Duality 0.72 (0.45) 0.78 (0.41) )0.06 )2.07** )1.98** 0.75 (1.00)
Terms 0.57 (0.49) 0.63 (0.48) )0.06 )1.58 )1.70 0.60 (1.00)
Block 0.05 (0.22) 0.05 (0.22) 0.00 0.00 )0.03 0.05 (0.00)
Family 0.17 (0.37) 0.17 (0.37) 0.00 0.10 )0.06 0.17 (0.00)
Age 55.63 (7.48) 55.83 (8.08) )0.20 )0.42 0.03 55.73 (55.50)
NP 0.32 (0.47) 0.31 (0.46) 0.01 0.38 0.36 0.31 (0.00)
FF 0.08 (0.26) 0.15 (0.36) )0.07 )3.69*** )3.50*** 0.12 (0.00)
Pinside 0.23 (0.14) 0.31 (0.16) )0.08 )5.46*** )4.76*** 0.27 (0.22)
Poutside 0.71 (0.16) 0.61 (0.17) 0.10 8.72*** 8.26*** 0.66 (0.69)
Pgray 0.05 (0.08) 0.07 (0.11) )0.02 )2.53** )1.49* 0.06 (0.00)
Psenior 0.10 (0.13) 0.10 (0.12) 0.00 0.95 0.44 0.10 (0.08)
Pbusy 0.18 (0.17) 0.16 (0.16) 0.02 2.35** 2.32** 0.17 (0.13)
Pceos 0.18 (0.15) 0.16 (0.14) 0.02 1.92* 1.52* 0.17 (0.15)
Pfemale 0.13 (0.09) 0.08 (0.08) 0.05 8.39*** 7.65*** 0.10 (0.10)
GI 9.68 (2.60) 9.40 (2.76) 0.28 2.44** 9.45 (10.00)
***, **, * indicates significance at the .01, .05, and .10 level, respectively.Sample consists of 394 firms listed on the Domini 400 Index of SR firms in the year 2000–2001and 394 firms matched on industry and size (Non-SR). The number of board meetings is
represented by Meetings. Duality is a dummy variable taking the value of ‘‘1’’ if the chairmanof the board is also the CEO of the company. Term is a binary variable equal to 1 if there isstaggered election of board members, or 0 if members are elected annually. Block is a dummy
variable equal to ‘‘1’’ if an outside director holds more than 5% of the outstanding stock of thefirm. Family is a dummy variable equal to ‘‘1’’ if there are related directors on the board. Ageindicates the age of the CEO. NP is a dummy variable equal to ‘‘1’’ if a director is an officer of
or works with a non-profit organization. FF is a dummy variable equal to ‘‘1’’ if the CEObelongs to the firm’s founding family. Pinside represents the fraction of the total boardmembers who are (or have been) also officers of the company. Poutside indicates the fraction ofthe board that is not affiliated with the company. Pgray are the percentage of directors who
have substantial business relationships with the company, yet are not insiders. Psenior includesany director that is over the age of 69. Pbusy indicates the percentage of directors who are onthree or more other boards (six or more if board member is retired). Pceos represents the
percentage of outside directors who are also CEOs of other firms. Pfemales represents theproportion of women on the board. GI is the Governance Index score as measured byGompers et al. (2003). A negative t-statistic (or Wilcoxon Z-statistic) indicates that the non-SR
variable is less than the SR variable, and a positive t-statistic indicates SR is less than non-SR.
266 ELIZABETH WEBB
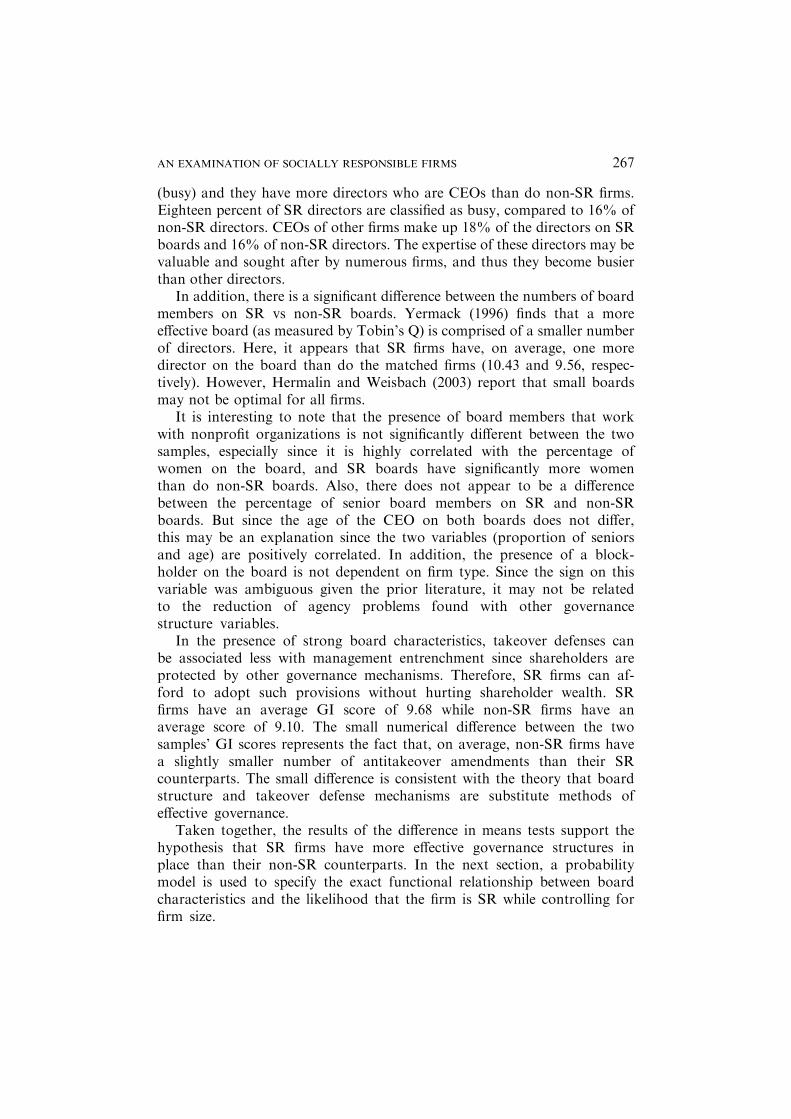
(busy) and they have more directors who are CEOs than do non-SR firms.Eighteen percent of SR directors are classified as busy, compared to 16% ofnon-SR directors. CEOs of other firms make up 18% of the directors on SRboards and 16% of non-SR directors. The expertise of these directors may bevaluable and sought after by numerous firms, and thus they become busierthan other directors.
In addition, there is a significant difference between the numbers of boardmembers on SR vs non-SR boards. Yermack (1996) finds that a moreeffective board (as measured by Tobin’s Q) is comprised of a smaller numberof directors. Here, it appears that SR firms have, on average, one moredirector on the board than do the matched firms (10.43 and 9.56, respec-tively). However, Hermalin and Weisbach (2003) report that small boardsmay not be optimal for all firms.
It is interesting to note that the presence of board members that workwith nonprofit organizations is not significantly different between the twosamples, especially since it is highly correlated with the percentage ofwomen on the board, and SR boards have significantly more womenthan do non-SR boards. Also, there does not appear to be a differencebetween the percentage of senior board members on SR and non-SRboards. But since the age of the CEO on both boards does not differ,this may be an explanation since the two variables (proportion of seniorsand age) are positively correlated. In addition, the presence of a block-holder on the board is not dependent on firm type. Since the sign on thisvariable was ambiguous given the prior literature, it may not be relatedto the reduction of agency problems found with other governancestructure variables.
In the presence of strong board characteristics, takeover defenses canbe associated less with management entrenchment since shareholders areprotected by other governance mechanisms. Therefore, SR firms can af-ford to adopt such provisions without hurting shareholder wealth. SRfirms have an average GI score of 9.68 while non-SR firms have anaverage score of 9.10. The small numerical difference between the twosamples’ GI scores represents the fact that, on average, non-SR firms havea slightly smaller number of antitakeover amendments than their SRcounterparts. The small difference is consistent with the theory that boardstructure and takeover defense mechanisms are substitute methods ofeffective governance.
Taken together, the results of the difference in means tests support thehypothesis that SR firms have more effective governance structures inplace than their non-SR counterparts. In the next section, a probabilitymodel is used to specify the exact functional relationship between boardcharacteristics and the likelihood that the firm is SR while controlling forfirm size.
AN EXAMINATION OF SOCIALLY RESPONSIBLE FIRMS 267
4.2. MULTIVARIATE STATISTICS
4.2.1. Logistic regression
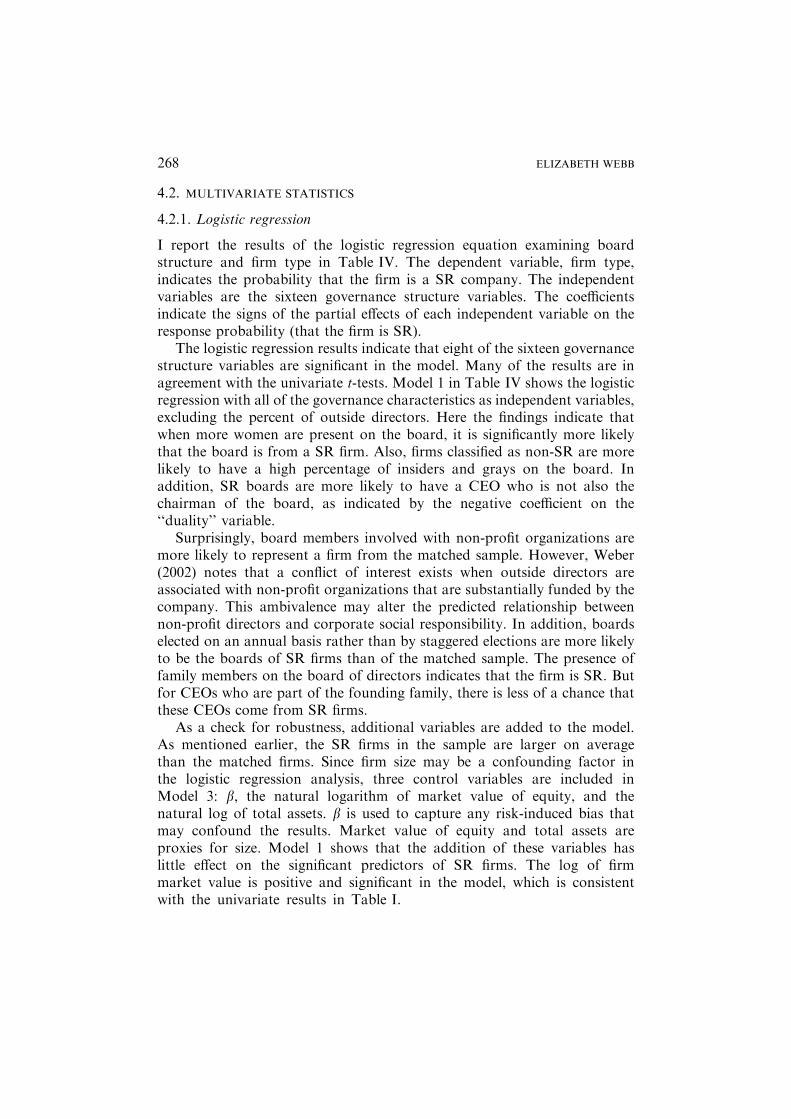
I report the results of the logistic regression equation examining boardstructure and firm type in Table IV. The dependent variable, firm type,indicates the probability that the firm is a SR company. The independentvariables are the sixteen governance structure variables. The coefficientsindicate the signs of the partial effects of each independent variable on theresponse probability (that the firm is SR).
The logistic regression results indicate that eight of the sixteen governancestructure variables are significant in the model. Many of the results are inagreement with the univariate t-tests. Model 1 in Table IV shows the logisticregression with all of the governance characteristics as independent variables,excluding the percent of outside directors. Here the findings indicate thatwhen more women are present on the board, it is significantly more likelythat the board is from a SR firm. Also, firms classified as non-SR are morelikely to have a high percentage of insiders and grays on the board. Inaddition, SR boards are more likely to have a CEO who is not also thechairman of the board, as indicated by the negative coefficient on the‘‘duality’’ variable.
Surprisingly, board members involved with non-profit organizations aremore likely to represent a firm from the matched sample. However, Weber(2002) notes that a conflict of interest exists when outside directors areassociated with non-profit organizations that are substantially funded by thecompany. This ambivalence may alter the predicted relationship betweennon-profit directors and corporate social responsibility. In addition, boardselected on an annual basis rather than by staggered elections are more likelyto be the boards of SR firms than of the matched sample. The presence offamily members on the board of directors indicates that the firm is SR. Butfor CEOs who are part of the founding family, there is less of a chance thatthese CEOs come from SR firms.
As a check for robustness, additional variables are added to the model.As mentioned earlier, the SR firms in the sample are larger on averagethan the matched firms. Since firm size may be a confounding factor inthe logistic regression analysis, three control variables are included inModel 3: b, the natural logarithm of market value of equity, and thenatural log of total assets. b is used to capture any risk-induced bias thatmay confound the results. Market value of equity and total assets areproxies for size. Model 1 shows that the addition of these variables haslittle effect on the significant predictors of SR firms. The log of firmmarket value is positive and significant in the model, which is consistentwith the univariate results in Table I.
268 ELIZABETH WEBB
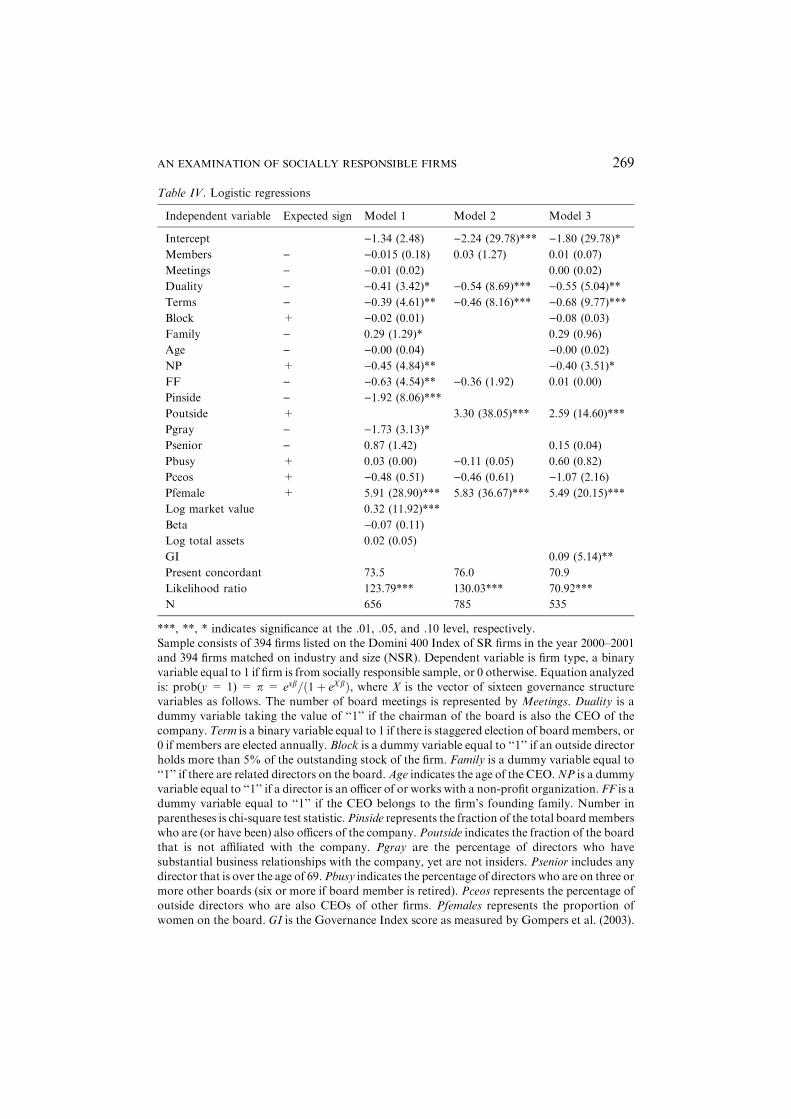
Table IV. Logistic regressions
Independent variable Expected sign Model 1 Model 2 Model 3
Intercept )1.34 (2.48) )2.24 (29.78)*** )1.80 (29.78)*
Members ) )0.015 (0.18) 0.03 (1.27) 0.01 (0.07)
Meetings ) )0.01 (0.02) 0.00 (0.02)
Duality ) )0.41 (3.42)* )0.54 (8.69)*** )0.55 (5.04)**
Terms ) )0.39 (4.61)** )0.46 (8.16)*** )0.68 (9.77)***
Block + )0.02 (0.01) )0.08 (0.03)
Family ) 0.29 (1.29)* 0.29 (0.96)
Age ) )0.00 (0.04) )0.00 (0.02)
NP + )0.45 (4.84)** )0.40 (3.51)*
FF ) )0.63 (4.54)** )0.36 (1.92) 0.01 (0.00)
Pinside ) )1.92 (8.06)***
Poutside + 3.30 (38.05)*** 2.59 (14.60)***
Pgray ) )1.73 (3.13)*
Psenior ) 0.87 (1.42) 0.15 (0.04)
Pbusy + 0.03 (0.00) )0.11 (0.05) 0.60 (0.82)
Pceos + )0.48 (0.51) )0.46 (0.61) )1.07 (2.16)
Pfemale + 5.91 (28.90)*** 5.83 (36.67)*** 5.49 (20.15)***
Log market value 0.32 (11.92)***
Beta )0.07 (0.11)
Log total assets 0.02 (0.05)
GI 0.09 (5.14)**
Present concordant 73.5 76.0 70.9
Likelihood ratio 123.79*** 130.03*** 70.92***
N 656 785 535
***, **, * indicates significance at the .01, .05, and .10 level, respectively.Sample consists of 394 firms listed on the Domini 400 Index of SR firms in the year 2000–2001and 394 firms matched on industry and size (NSR). Dependent variable is firm type, a binary
variable equal to 1 if firm is from socially responsible sample, or 0 otherwise. Equation analyzedis: prob(y = 1) = p = exb=ð1þ eXbÞ, where X is the vector of sixteen governance structurevariables as follows. The number of board meetings is represented by Meetings. Duality is adummy variable taking the value of ‘‘1’’ if the chairman of the board is also the CEO of the
company.Term is a binary variable equal to 1 if there is staggered election of boardmembers, or0 if members are elected annually. Block is a dummy variable equal to ‘‘1’’ if an outside directorholds more than 5% of the outstanding stock of the firm. Family is a dummy variable equal to
‘‘1’’ if there are related directors on the board.Age indicates the age of the CEO.NP is a dummyvariable equal to ‘‘1’’ if a director is an officer of or works with a non-profit organization. FF is adummy variable equal to ‘‘1’’ if the CEO belongs to the firm’s founding family. Number in
parentheses is chi-square test statistic.Pinside represents the fraction of the total boardmemberswho are (or have been) also officers of the company. Poutside indicates the fraction of the boardthat is not affiliated with the company. Pgray are the percentage of directors who have
substantial business relationships with the company, yet are not insiders. Psenior includes anydirector that is over the age of 69.Pbusy indicates the percentage of directors who are on three ormore other boards (six or more if board member is retired). Pceos represents the percentage ofoutside directors who are also CEOs of other firms. Pfemales represents the proportion of
women on the board. GI is the Governance Index score as measured by Gompers et al. (2003).
AN EXAMINATION OF SOCIALLY RESPONSIBLE FIRMS 269
Model 2 in Table IV includes only those independent variables that weresignificant in the univariate tests to explain differences in SR and non-SRboards. Here, only the proportion of outsiders is used to avoid any multi-collinearity issues with the logistic regression analysis. The results are againidentical to Model 1, except that the founding family variable is no longersignificant in the model.
In Model 3 of Table IV, I include the GI variable in the logistic regres-sions. Since sample size is significantly reduced when using the GI score (325SR firms and 210 non-SR firms), I do not include it in the previous models.The results of this regression are consistent with the prior results. CEO/Chairduality, election terms, non-profit affiliation, proportion of outsiders andproportion of women on the board are significant in the model. In addition,the GI score is positive and significant, indicating that SR firms are havehigher GI scores than non-SR firms, which is consistent with results fromunivariate tests reported in Table III. I also run regressions using the controlvariables and the significant variables from Model 3 (results not reported).Doing so does not change the results.
4.2.2. Continuous measure of corporate social responsibility
Next, I analyze the effect of board structure on social responsibility. Identicalindependent variables are used in Table V as in Model 2 in Table IV. In thiscase, I use the KLD Socrates social responsibility score as a continuousmeasure of social responsibility. A higher-score indicates a higher-degree ofcorporate social responsibility. Three separate regressions are run for the fullsample, SR firms, and matched firms, respectively.
As reported in Table V, several board characteristics for the full samplesignificantly explain variation in the KLD score. The number of boardmembers is directly related to the social responsibility score, which supportsthe original hypothesis according to Hermalin and Weisbach (2003) andresults found in the univariate tests in Table III. Also, when boards areelected on a staggered basis, the KLD score decreases.
This supports the initial hypothesis that boards elected annually should belinked with stronger board structures and subsequently with SR firms’boards. The proportions of outsiders and women on the board are directlyrelated to the KLD score, which also corroborates initial hypotheses. Controlvariables include log of market value of equity, beta, and log of total assets.10
Total assets, interestingly, is negatively related to the KLD score. Thisinformally supports the idea that size is not an overall determinant of whe-ther or not the firm is from the SR sample. This issue will be addressedfurther in the next section.
Next, separate regressions are run using the SR and non-SR samples.Interestingly, the matched firm regressions show no statistically significant
270 ELIZABETH WEBB
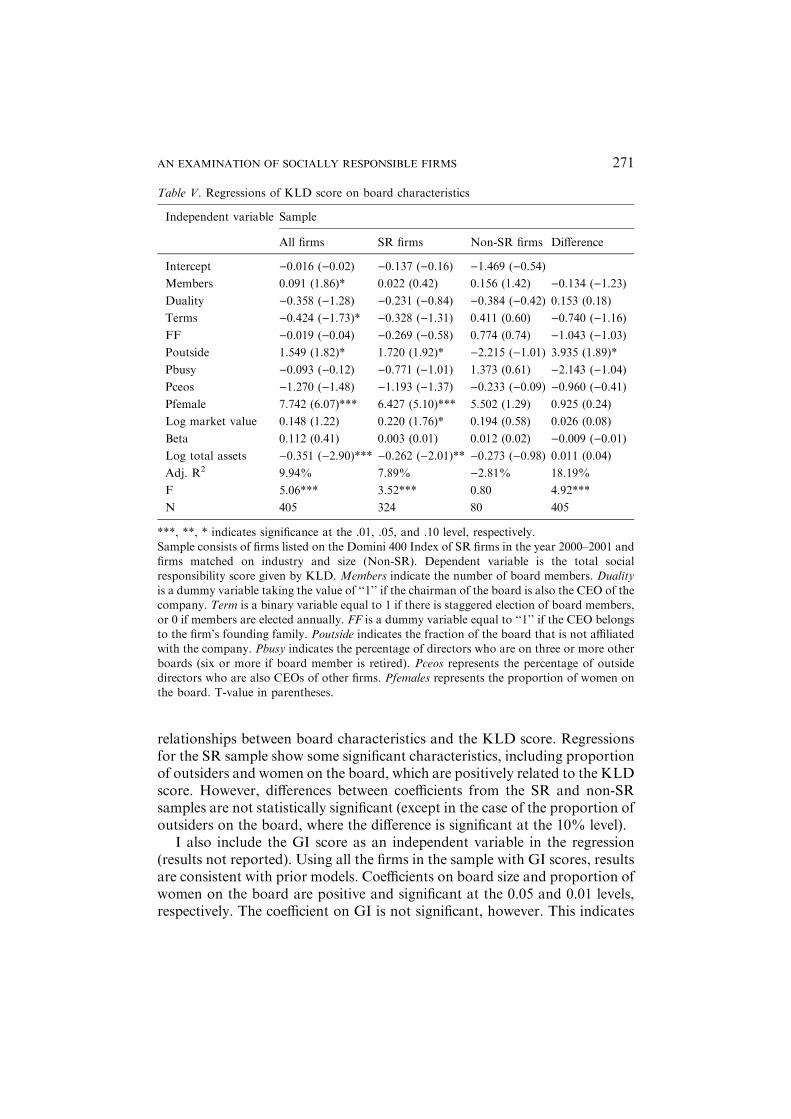
relationships between board characteristics and the KLD score. Regressionsfor the SR sample show some significant characteristics, including proportionof outsiders and women on the board, which are positively related to the KLDscore. However, differences between coefficients from the SR and non-SRsamples are not statistically significant (except in the case of the proportion ofoutsiders on the board, where the difference is significant at the 10% level).
I also include the GI score as an independent variable in the regression(results not reported). Using all the firms in the sample with GI scores, resultsare consistent with prior models. Coefficients on board size and proportion ofwomen on the board are positive and significant at the 0.05 and 0.01 levels,respectively. The coefficient on GI is not significant, however. This indicates
Table V. Regressions of KLD score on board characteristics
Independent variable Sample
All firms SR firms Non-SR firms Difference
Intercept )0.016 ()0.02) )0.137 ()0.16) )1.469 ()0.54)Members 0.091 (1.86)* 0.022 (0.42) 0.156 (1.42) )0.134 ()1.23)Duality )0.358 ()1.28) )0.231 ()0.84) )0.384 ()0.42) 0.153 (0.18)
Terms )0.424 ()1.73)* )0.328 ()1.31) 0.411 (0.60) )0.740 ()1.16)FF )0.019 ()0.04) )0.269 ()0.58) 0.774 (0.74) )1.043 ()1.03)Poutside 1.549 (1.82)* 1.720 (1.92)* )2.215 ()1.01) 3.935 (1.89)*
Pbusy )0.093 ()0.12) )0.771 ()1.01) 1.373 (0.61) )2.143 ()1.04)Pceos )1.270 ()1.48) )1.193 ()1.37) )0.233 ()0.09) )0.960 ()0.41)Pfemale 7.742 (6.07)*** 6.427 (5.10)*** 5.502 (1.29) 0.925 (0.24)
Log market value 0.148 (1.22) 0.220 (1.76)* 0.194 (0.58) 0.026 (0.08)
Beta 0.112 (0.41) 0.003 (0.01) 0.012 (0.02) )0.009 ()0.01)Log total assets )0.351 ()2.90)*** )0.262 ()2.01)** )0.273 ()0.98) 0.011 (0.04)
Adj. R2 9.94% 7.89% )2.81% 18.19%
F 5.06*** 3.52*** 0.80 4.92***
N 405 324 80 405
***, **, * indicates significance at the .01, .05, and .10 level, respectively.Sample consists of firms listed on the Domini 400 Index of SR firms in the year 2000–2001 and
firms matched on industry and size (Non-SR). Dependent variable is the total socialresponsibility score given by KLD. Members indicate the number of board members. Dualityis a dummy variable taking the value of ‘‘1’’ if the chairman of the board is also the CEO of thecompany. Term is a binary variable equal to 1 if there is staggered election of board members,
or 0 if members are elected annually. FF is a dummy variable equal to ‘‘1’’ if the CEO belongsto the firm’s founding family. Poutside indicates the fraction of the board that is not affiliatedwith the company. Pbusy indicates the percentage of directors who are on three or more other
boards (six or more if board member is retired). Pceos represents the percentage of outsidedirectors who are also CEOs of other firms. Pfemales represents the proportion of women onthe board. T-value in parentheses.
AN EXAMINATION OF SOCIALLY RESPONSIBLE FIRMS 271
that the GI score is not related to the KLD score after controlling for boardand size factors.
4.3. ROBUSTNESS CHECKS
4.3.1. Reduced samples
To test whether differences in board characteristics are driving the results, Irepeat the paired t-tests from Table III using samples that are split betweenthe above-median and below-median values for board size, proportion ofinsiders, proportion of outsiders, proportion of busy directors, proportion ofCEOs on the board, and proportion of women on the board. I evaluate thesevariables and their influence on the other board structure variables furthersince they are found to be significantly different between SR and non-SRfirms in the original tests. This process will help to identify the mostimportant structural differences between SR and non-SR boards bycontrolling for differences in certain governance structure variables.
For both ‘‘high’’ and ‘‘low’’ values for each structural variable, therecontinues to be a statistically significant relationship for both the proportionof outsiders and proportion of women on the board. Board size is signifi-cantly different in all models except when using samples divided on above-median proportion of insiders and above-median proportion of women onthe board. Duality, founding family CEO, proportion of insiders, and pro-portion of grays are also significantly different between the two samples formost of the subdivided firms. Additionally, process of director elections,proportion of senior directors and proportion of busy directors are signifi-cantly different in several samples, but not the majority of the reducedsamples. In conclusion, the univariate differences between SR and non-SRboards are robust to sample revisions based on high and low values of certainboard characteristics. Particularly, the proportion of outsiders and womenon the board, board size, duality, founding family CEOs, proportion ofinsiders and proportion of grays are significantly different between SRand non-SR boards even after controlling for differences in specific boardcharacteristics.
4.3.2. Potential sample bias
One criticism of using the DSI as the sample of socially responsible firms inthis study is that proxy voting guidelines screen for good governancecharacteristics. In order to affirm that these results are not simply due to asample bias, I reduce the sample to those DSI firms that are cross-listed onthe Calvert Social Index, which is another broad-based SR mutual fund
272 ELIZABETH WEBB
that does not list governance characteristics in proxy voting guidelines.This leaves 181 SR firms and 181 matched firms. The first column ofTable VI shows the paired t-test results between these reduced samples.The Calvert firms exhibit similar board characteristics as the Domini firmsindicating that these boards are more independent than the matchedsample boards. Specifically, these firms have more outside directors (andsubsequently less insiders and grays), more women on the board, less in-stances that the CEO is also the chairman of the board, more frequent useof annual elections of directors, and more CEOs on the board than thematched sample. Differences from the Domini sample include that meetingsand proportion of senior directors have different signs (but in both tests,t-values are not significant), and that proportion of busy directors is nolonger significant in the model. However, the strongest board characteris-tics that lead to independent and strong boards of directors are identical inboth SR samples, therefore eliminating the possibility of a sample bias.This supports the previous verification of the univariate tests, whichshowed that certain board characteristic differences between the two sam-ples are robust to reducing the sample by separating between small andlarge values of significant characteristics from Table III. Particularly, theproportion of outsiders and women on the board, board size, duality,founding family CEOs, proportion of insiders and proportion of grays aresignificantly different between SR and non-SR boards, which confirm theresults in Table VI.
In addition, to affirm that the results are based on a SR effect rather than asize effect, I reduce the sample to include only those SR firms whose matchedfirms are within at least 20% of the equity market value of the DSI firm. Thisgenerates a sample size of 101 SR firms and 101 matched firms. The uni-variate results using this sample are similar to those reported in Table III andare shown in the second column of Table VI. Again, the SR firms have moreoutsiders, less insiders, more women, lower instance of the CEO being fromthe founding family, and a greater instance of the CEO not also holding theposition of chairman of the board. Less influential characteristics differsomewhat with the full sample: the number of board members and theproportion of gray directors are not significant, and the director electionprocess (terms) is not significant in the model (although this was onlymarginally significant in the full sample).
I also test for differences in the GI score with the reduced samples. Thisreduces the samples further, and results are not reported in the table. The paireddifference t-tests between GI scores for SR and non-SR firms using both theCalvert cross-listed reduced sample and the size difference restriction sampleare consistent with Table III. Both are significantly different at the 0.05 level.
In summary of the reduced sample tests, characteristics that are thestrongest indicators of board strength and independence are consistently
AN EXAMINATION OF SOCIALLY RESPONSIBLE FIRMS 273
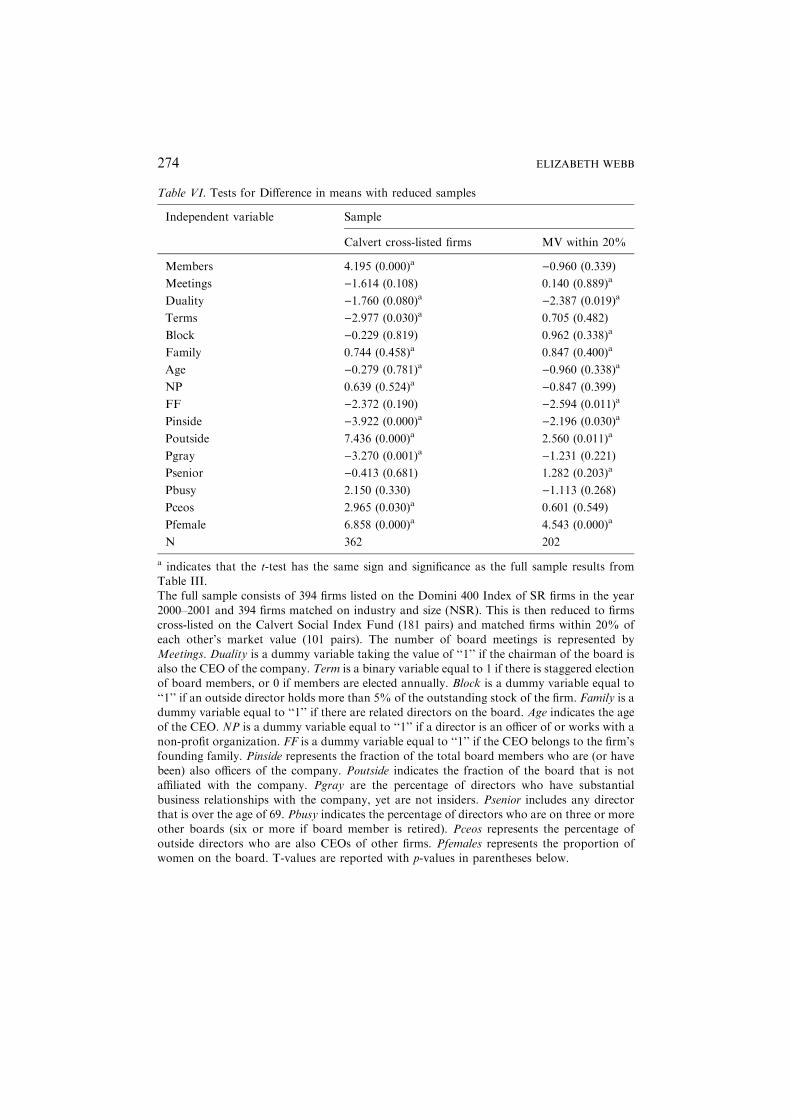
Table VI. Tests for Difference in means with reduced samples
Independent variable Sample
Calvert cross-listed firms MV within 20%
Members 4.195 (0.000)a )0.960 (0.339)
Meetings )1.614 (0.108) 0.140 (0.889)a
Duality )1.760 (0.080)a )2.387 (0.019)a
Terms )2.977 (0.030)a 0.705 (0.482)
Block )0.229 (0.819) 0.962 (0.338)a
Family 0.744 (0.458)a 0.847 (0.400)a
Age )0.279 (0.781)a )0.960 (0.338)a
NP 0.639 (0.524)a )0.847 (0.399)
FF )2.372 (0.190) )2.594 (0.011)a
Pinside )3.922 (0.000)a )2.196 (0.030)a
Poutside 7.436 (0.000)a 2.560 (0.011)a
Pgray )3.270 (0.001)a )1.231 (0.221)
Psenior )0.413 (0.681) 1.282 (0.203)a
Pbusy 2.150 (0.330) )1.113 (0.268)
Pceos 2.965 (0.030)a 0.601 (0.549)
Pfemale 6.858 (0.000)a 4.543 (0.000)a
N 362 202
a indicates that the t-test has the same sign and significance as the full sample results fromTable III.The full sample consists of 394 firms listed on the Domini 400 Index of SR firms in the year
2000–2001 and 394 firms matched on industry and size (NSR). This is then reduced to firmscross-listed on the Calvert Social Index Fund (181 pairs) and matched firms within 20% ofeach other’s market value (101 pairs). The number of board meetings is represented by
Meetings. Duality is a dummy variable taking the value of ‘‘1’’ if the chairman of the board isalso the CEO of the company. Term is a binary variable equal to 1 if there is staggered electionof board members, or 0 if members are elected annually. Block is a dummy variable equal to
‘‘1’’ if an outside director holds more than 5% of the outstanding stock of the firm. Family is adummy variable equal to ‘‘1’’ if there are related directors on the board. Age indicates the ageof the CEO. NP is a dummy variable equal to ‘‘1’’ if a director is an officer of or works with anon-profit organization. FF is a dummy variable equal to ‘‘1’’ if the CEO belongs to the firm’s
founding family. Pinside represents the fraction of the total board members who are (or havebeen) also officers of the company. Poutside indicates the fraction of the board that is notaffiliated with the company. Pgray are the percentage of directors who have substantial
business relationships with the company, yet are not insiders. Psenior includes any directorthat is over the age of 69. Pbusy indicates the percentage of directors who are on three or moreother boards (six or more if board member is retired). Pceos represents the percentage of
outside directors who are also CEOs of other firms. Pfemales represents the proportion ofwomen on the board. T-values are reported with p-values in parentheses below.
274 ELIZABETH WEBB
significant in the SR sample, while some of the more ambiguous boardstrength characteristics (such as proportion of busy and gray directors) maydiffer when using different samples. This result gives further insight as to thecentral characteristics of an ‘‘effective’’ board of directors.
5. Conclusion
The crisis in corporate governance has created a sense of distrust amonginvestors in the US. In growing numbers, investors are apparently consid-ering more than the firm’s financials when buying stock. A company’scommitment to social responsibility and monitoring on behalf of the stake-holders are becoming important issues in investment.
This study analyzes distinctions in the board structures of SR firms. Re-sults support the hypothesis that SR firms have more effective boards ofdirectors than their non-SR counterparts. The characteristics of SR boardsmay contribute to the continued investor interest in these types of firms, for itappears that stronger boards exist in firms that emphasize stakeholder utilitymaximization rather than a strict adherence to shareholder wealth maximi-zation strategies. These results add to the growing body of empirical litera-ture on corporate governance and highlight several important characteristicsof effective board of directors.
An important indication of board of directors’ independence and effec-tiveness is the composition of the board. SR boards have a significantlyhigher percentage of outside directors than the matched sample. Likewise,non-SR firms have more insiders and more ‘‘gray’’ directors on the boardthan SR firms. There are typically more women on SR boards, indicatingthat SR boards are more diverse than non-SR boards. Directors on SRboards tend to be busier, in that they serve on other boards and are oftenCEOs of other firms, but have fewer meetings than non-SR directors. SRboards have more directors on average than non-SR boards. The CEO is lesslikely to be from the founding family on an SR board, and is less likely to bethe firm’s chairman of the board of directors than CEOs from non-SRboards.
It is not clear from these results, however, that being SR is a precursorto having a strong corporate governance structure. If stakeholder con-sideration is rewarded by increased investor interest, and Tirole’s definitionof corporate governance as a monitor of managers on behalf of stake-holders is accepted, it seems reasonable to hypothesize that SR firmsshould have strong governance structures in place. Therefore, future re-search on the causality between corporate social responsibility and gov-ernance structure using a time series dataset would be a worthwhilecontribution to the governance literature.
AN EXAMINATION OF SOCIALLY RESPONSIBLE FIRMS 275
Notes
1 I would like to thank Jacqueline Garner, Michael Gombola, Thomas McWilliams, Gerard
Olson, and participants at the 2003 Eastern Finance Association conference for helpfulcomments and assistance. I am especially grateful to Edward Nelling for his guidance andsupport. All remaining errors are my own.2 Bernhut (2002) describes how there is no conclusive evidence on a correlation between
corporate social responsibility and stock price, but that subtle advantages, including greaterloyalty and commitment from stakeholders, are the main benefits of being socially responsible.3 This may be due to increased regulation in the banking industry. See, for example, Gillan
et al. (2002), and Adams and Mehran (2003).4 Kinder, Lydenberg, Domini & Co. is an agency that reports company profiles based ondifferent aspects of social responsibility including charitable giving, community involvement,
diversity, employee welfare, and the natural environment.5 The full sample of the socially responsible firms and their respective matched firms isavailable upon request.6 In some cases, proxy statements from 1999, 2000, or 2002 were used depending on availability.Proxy statements from 2001 were used for 90% of the SR firms and 96.6% of non-SR firms.7 Most often, a lack of a proxy statement was due to mergers or bankruptcies.8 VIF statistics are less than 10. The variance inflation factor (VIF) is equal to 1=ð1�R2
i Þ,where R2
i is the coefficient of multiple determination between variables.9 Eliminating the largest firms (top 1%) and smallest firms (bottom 1%) from the sampleyields a slight change in coefficients but identical significance levels and coefficient signs as
reported in Table III. Thus, outliers are not influencing the univariate results.10 In the event that total assets and market value are correlated, I also run the regressionsomitting market value from the set of independent variables. Results are consistent with those
reported in Table VII, although the p-value for the coefficient on the proportion of outsidersvariable using the full sample increases to 0.101 making this variable only marginally significant.
References
Adams, R. and H. Mehran: 2003, ‘‘Is Corporate Governance Different for Bank Holding
Companies?’’, Economic Policy Review 9: 123–142.Bacon, C., M. Cornett and W. Davidson: 1997, ‘‘The Board of Directors and Dual-Class
Recapitalizations’’, Financial Management 26: 5–23.
Beasley, M.: 1996, ‘‘Board of Director Composition and Financial Statement Fraud’’, TheAccounting Review 71: 443–466.
Beasley, M., J. Carcello, D. Hermanson and P. Lapides: 2000, ‘‘Fraudulent FinancialReporting: consideration of Industry Traits and Corporate Governance Mechanisms’’,
Accounting Horizons 14: 441–454.Bernhut, S.: 2002, ‘‘Corporate Social Responsibility’’, Ivey Business Journal, March/April, 18–
20.
Burkart, M., F. Panunzi and A. Shleifer: 2002, ‘‘Family Firms’’, Working Paper, NBER series.Carroll, A.: 1991, ‘‘CSP measurement: A Commentary on Methods for Evaluating an Illusive
Construct’’, Research in Corporate Social Performance and Policy 12.
Carter, D., B. Simkins and W. Simpson: 2003, ‘‘Corporate governance, board diversity, andfirm value’’, Financial Review 38: 33–53.
Core, J., R. Holthausen and D. Larcker: 1999, ‘‘Corporate governance, chief executive officercompensation, and firm performance’’, Journal of Financial Economics 51: 371–406.
Fama, E.: 1980, ‘‘Agency problem and the theory of the firm’’, Journal of Political Economy88: 288.
276 ELIZABETH WEBB
Fama, E. and K. French: 1997, ‘‘Industry Costs of Equity’’, Journal of Financial Economics 43:
153–194.Fama, E. and M. Jensen: 1983, ‘‘Separation of Ownership and Control’’, Journal of Law and
Economics 26: 301–325.
Ferris, S., M. Jagannathan and A. Pritchard: 2003, ‘‘Too busy to mind the business? Moni-toring by directors with multiple board appointments’’, Journal of Finance, forthcoming.
Friedman, M.: 1970, ‘‘The Social Responsibility of Business is to Increase its Profits’’, The
New York Times Magazine, September 13.Gillan, S., J. Hartzell and L. Starks: 2003, ‘‘Industries, investment opportunities, and cor-
porate governance structures’’, Working Paper, SSRN series, University of Delaware.
Gompers, P., J. Ishii and A. Metrick: 2003, ‘‘Corporate Governance and Equity Prices’’,Quarterly Journal of Economics 118: 107–155.
Hermalin, B. and M. Weisbach: 2003, ‘‘Board of Directors as an Endogenously Deter-mined Institution: A Survey of the Economic Literature’’, Economic Policy Review,
forthcoming.Hillman, A. and G. Keim: 2001, ‘‘Shareholder value, Stakeholder Management, and Social
Issues: What’s the bottom line?’’ Strategic Management Journal 22: 125–139.
Howton, S., S. Howton and G. Olson: 2001, ‘‘Board Ownership and IPO Returns’’, Journalof Economics and Finance 25: 100–112.
Jayaraman, N., A. Khorana, E. Nelling and J. Covin: 2000, ‘‘CEO Founder Status and Firm
Financial Performance’’, Strategic Management Journal 21: 1215–1224.Jensen, M.: 1993, ‘‘The Modern Industrial Revolution, Exit and the Failure of Internal
Control Systems’’, Journal of Finance 48: 831–880.
Jensen, M. and W. Meckling: 1976, ‘‘Theory of the firm: Managerial Behavior, agency costsand ownership structure’’, Journal of Financial Economics 34: 305–360.
John, K. and L. Senbet: 1998, ‘‘Corporate Governance and Board Effectiveness’’, Journal ofBanking and Finance 22: 371–403.
Johnson, O.: 1966, ‘‘Corporate Philanthropy: An Analysis of Corporate Contributions’’,Journal of Business 39: 489–504.
Malekzadeh, A., V. McWilliams and N. Sen: 1998, ‘‘Implications of CEO Structural and
Ownership Powers, Board Ownership and Composition on the Market’s Reaction toAntitakeover Charter Amendments’’, Journal of Applied Business Research 14: 53–62.
McGuire, J., A. Sundgren and T. Schneeweis: 1988, ‘‘Corporate Social Responsibility and
Firm Financial Performance’’, Academy of Management Journal 31: 854–872.McWilliams, V. and N. Sen: 1997, ‘‘Board Monitoring and Antitakeover Amendments’’,
Journal of Financial and Quantitative Analysis 32: 491–505.Rosenstein, S. and J. Wyatt: 1997, ‘‘Inside Directors, Board Effectiveness, and Shareholder
Wealth’’, Journal of Financial Economics 44: 229–250.Shivdasani, A.: 1993, ‘‘Board Composition, Ownership Structure, and Hostile Takeovers’’,
Journal of Accounting and Economics 16: 167–199.
Teoh, S., I. Welch and C. Wazzan: 1999, ‘‘The Effect of Socially Activist Investment Policieson the Financial Markets: Evidence From the South African boycott’’, Journal of Business72: 35–89.
Tirole, J.: 2001, ‘‘Corporate Governance’’, Econometrica 69: 1–35.Waddock, S. and S. Graves: 1997, ‘‘The Corporate Social Performance-Financial Perfor-
mance Link’’, Strategic Management Journal 18: 303–319.
Weber, J.: 2002, ‘‘Boardroom Charity: Reforms Don’t go far Enough’’, Business Week, June10: 28.
Yermack, D.: 1996, ‘‘Higher Market Valuation of Companies with a Small Board of Direc-tors’’, Journal of Financial Economics 40: 185–211.
AN EXAMINATION OF SOCIALLY RESPONSIBLE FIRMS 277

Reproduced with permission of the copyright owner. Further reproduction prohibited without permission.