An Evaluation of the Utility of Reading Curriculum-Based ...
76
Louisiana State University LSU Digital Commons LSU Doctoral Dissertations Graduate School 2016 An Evaluation of the Utility of Reading Curriculum-Based Measurement as Progress Monitoring Tools and Predictors of Comprehension Haley Elizabeth York Louisiana State University and Agricultural and Mechanical College Follow this and additional works at: hps://digitalcommons.lsu.edu/gradschool_dissertations Part of the Psychology Commons is Dissertation is brought to you for free and open access by the Graduate School at LSU Digital Commons. It has been accepted for inclusion in LSU Doctoral Dissertations by an authorized graduate school editor of LSU Digital Commons. For more information, please contact[email protected]. Recommended Citation York, Haley Elizabeth, "An Evaluation of the Utility of Reading Curriculum-Based Measurement as Progress Monitoring Tools and Predictors of Comprehension" (2016). LSU Doctoral Dissertations. 4313. hps://digitalcommons.lsu.edu/gradschool_dissertations/4313
Transcript of An Evaluation of the Utility of Reading Curriculum-Based ...

Louisiana State UniversityLSU Digital Commons
LSU Doctoral Dissertations Graduate School
2016
An Evaluation of the Utility of ReadingCurriculum-Based Measurement as ProgressMonitoring Tools and Predictors ofComprehensionHaley Elizabeth YorkLouisiana State University and Agricultural and Mechanical College
Follow this and additional works at: https://digitalcommons.lsu.edu/gradschool_dissertations
Part of the Psychology Commons
This Dissertation is brought to you for free and open access by the Graduate School at LSU Digital Commons. It has been accepted for inclusion inLSU Doctoral Dissertations by an authorized graduate school editor of LSU Digital Commons. For more information, please [email protected].
Recommended CitationYork, Haley Elizabeth, "An Evaluation of the Utility of Reading Curriculum-Based Measurement as Progress Monitoring Tools andPredictors of Comprehension" (2016). LSU Doctoral Dissertations. 4313.https://digitalcommons.lsu.edu/gradschool_dissertations/4313

AN EVALUATION OF THE UTILITY OF READING CURRICULUM-BASED MEASUREMENT AS PROGRESS MONITORING TOOLS AND
PREDICTORS OF COMPREHENSION
A Dissertation
Submitted to the Graduate Faculty of the Louisiana State University and
Agricultural and Mechanical College in partial fulfillment of the
requirements for the degree of Doctor of Philosophy
in
The Department of Psychology
by Haley Elizabeth York
B.A., Texas Tech University, 2009 M.A., Louisiana State University, 2013
December 2016

ii
TABLE OF CONTENTS
LIST OF TABLES ........................................................................................................................................................ iii
LIST OF FIGURES ....................................................................................................................................................... iv
ABSTRACT ................................................................................................................................................................... v
INTRODUCTION .......................................................................................................................................................... 1 Reading Comprehension .................................................................................................................................. 1 Identifying Students in Need of Special Education Services in Reading ........................................................ 4 Response to Intervention .................................................................................................................................. 4 Curriculum-based Measurement ...................................................................................................................... 6 Evidence for Reading CBM Measures within an RTI Framework ................................................................ 11 Form Effects and Passage Equivalence in Reading CBM ............................................................................. 19 Assessing Growth and Predicting Outcomes with CBM ............................................................................... 21 Current Study ................................................................................................................................................. 22
METHOD ..................................................................................................................................................................... 24 Participants ..................................................................................................................................................... 24 Measures ........................................................................................................................................................ 24 Procedural Integrity and Interobserver Agreement ........................................................................................ 26 Procedure ....................................................................................................................................................... 27 Data Analyses ................................................................................................................................................ 30
RESULTS ..................................................................................................................................................................... 38 Phase One: Identification of Equivalent Passage Sets ................................................................................... 38 Phase Two: Progress Monitoring ................................................................................................................... 41
DISCUSSION .............................................................................................................................................................. 51 Limitations ..................................................................................................................................................... 53 Future Directions ........................................................................................................................................... 54
REFERENCES ............................................................................................................................................................. 56
APPENDICES .............................................................................................................................................................. 63 Appendix A: A standard DIBELS Oral Reading Fluency (DORF) passage ................................................. 63 Appendix B: A standard AIMSweb R-Maze passage .................................................................................... 64 Appendix C: A standard DIBELS Retell Fluency (RTF) scoring procedure ................................................ 65 Appendix D: Procedural integrity checklist for DIBELS Oral Reading Fluency (DORF) ........................... 66 Appendix E: Procedural integrity checklist for DIBELS Retell Fluency (RTF) ........................................... 67 Appendix F: Procedural integrity checklist for AIMSweb R-Maze .............................................................. 68 Appendix G: Institutional Review Board Approval ...................................................................................... 69
VITA…. ....................................................................................................................................................................... 70

iii
LIST OF TABLES
Table 1. Procedural Integrity by Phase and Probe Type .............................................................................................. 27 Table 2. Interobserver Agreement by Phase and Probe Type ...................................................................................... 27 Table 3. Taxonomy of multilevel models for change fitted to CBM data ................................................................... 36 Table 4. Taxonomy of multilevel models for change fitted to CBM data ................................................................... 37 Table 5. Numerical and Rank Ordering of R-Maze Probes following Passage Equating ........................................... 38 Table 6. Numerical and Rank Ordering of DIBELS Oral Reading Fluency Probes following Passage Equating ...... 39 Table 7. Numerical and Rank Ordering of DIBELS Retell Fluency Probes following Passage Equating .................. 40 Table 8. Descriptive Statistics for Growth Models ...................................................................................................... 41 Table 9. Bivariate Correlations Between Predictors for Growth Model ...................................................................... 42 Table 10. Results of the Unconditional Means Model: AIMSweb R-Maze ................................................................ 42 Table 11. Results of the Unconditional Growth Model: AIMSweb R-Maze ............................................................... 43 Table 12. Results of the Conditional Model: AIMSweb R-Maze ................................................................................ 44 Table 13. Results of the Unconditional Means Model: DIBELS Oral Reading Fluency (DORF) .............................. 44 Table 14. Results of the Unconditional Growth Model: DIBELS Oral Reading Fluency (DORF) ............................ 45 Table 15. Results of the Conditional Model: DIBELS Oral Reading Fluency (DORF) .............................................. 46 Table 16. Results of the Unconditional Means Model: DIBELS Retell Fluency (RTF) ............................................. 46 Table 17. Results of the Unconditional Growth Model: DIBELS Retell Fluency (RTF) ............................................ 47 Table 18. Results of the Conditional Model: DIBELS Retell Fluency (RTF) ............................................................. 48 Table 19. Descriptive Statistics for Prediction Model ................................................................................................. 48 Table 20. Bivariate Correlations Between Predictors for Prediction Model ................................................................ 49 Table 21. Bivariate Correlations Between CBM Measures and WJ-IV Reading Comprehension Subtests ............... 49 Table 22. Results of the Unconditional Model: Predicting Reading Comprehension ................................................. 50 Table 23. Results of the Conditional Model: Predicting Reading Comprehension ..................................................... 50
iv
LIST OF FIGURES
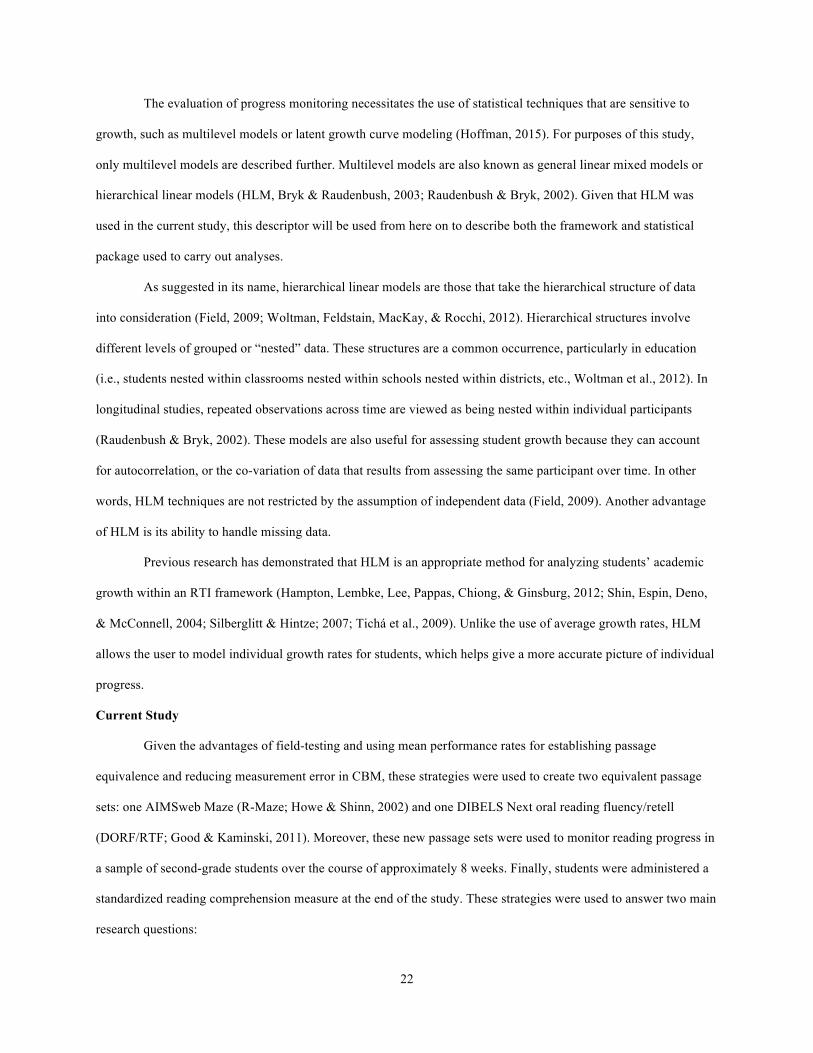
Figure 1. Sample student graphs of R-Maze scores (MAZE) as a function of measurement occasion (OCC). .......... 32 Figure 2. Aggregated average student R-Maze (Mean Maze) scores as a function of measurement occasion (Occ). 33 Figure 3. Sample student graphs of DIBELS oral reading fluency scores (ORF) as a function of measurement
occasion (OCC). ............................................................................................................................................. 33 Figure 4. Aggregated average student DIBELS oral reading fluency (Mean ORF) scores as a function of
measurement occasion (Occ). ........................................................................................................................ 34 Figure 5. Sample student graphs of DIBELS retell fluency scores (RETELL) as a function of measurement occasion
(OCC). ............................................................................................................................................................ 34 Figure 6. Aggregated average student DIBELS retell fluency (Mean Retell) scores as a function of measurement
occasion (Occ). .............................................................................................................................................. 35

v
ABSTRACT
Many American students struggle with reading, particularly in the area of comprehension. As such, early
identification of reading difficulties, use of evidenced-based interventions, and monitoring of student reading
progress over time is essential. Curriculum-based measurement (CBM) is a technically adequate, efficient tool
whose features and design make it a good candidate for early identification and progress monitoring purposes,
especially within a response to intervention framework. However, there is still some uncertainty regarding the utility
of reading CBM as progress monitoring tools. Specifically, the literature has suggested that variability in the
difficulty of CBM materials may influence how well these tools measure student growth over time. The present
study aimed to reduce CBM variability by using field-testing and rank-ordering of performance means to create two
equivalent second-grade reading CBM passage sets. These sets were derived from larger pools of extant,
commercially-available passage sets. One passage set included oral reading fluency and story recall tasks. The
second passage set was comprised of Maze tasks. These passage sets were then used to monitor progress in second-
grade students who were at-risk for reading problems. Scores from each type of task were also used to determine
which was the best predictor of student performance in reading comprehension. Hierarchical linear modeling was
used to analyze student growth on CBM measures, as well as predict reading comprehension. Results indicated that
only Maze tasks were sensitive to individual student growth over the study, and were the strongest predictors of
reading comprehension in this sample compared to oral reading fluency and recall. Implications, limitations, and
future directions are also discussed.

1
INTRODUCTION
The National Reading Panel (NRP; National Institute of Child Health and Human Development, 2000)
reviewed the extant reading research with the goal of identifying the most effective ways of teaching children to
read. After analyzing more than 100,000 studies, the panel identified five major areas of instruction that appear to be
essential for reading: phonemic awareness, phonics, fluency, vocabulary, and comprehension. The NRP’s findings
regarding these “Big 5” areas of reading have made significant contributions to the formulation of educational
curricula (i.e., Common Core State Standards, National Governors Associate Center for Best Practices, 2010) and
the design of interventions aimed at improving reading performance. Despite these efforts and education laws
designed to promote student achievement (i.e., Every Student Succeeds Act of 2015), American youth continue to
struggle with reading. According to the 2015 Nation’s Report Card, only 36% of fourth-graders and 34% of eighth-
graders in the United States scored at or above a proficient level, indicating they are able to draw conclusions and
make evaluations about what they read based on their understanding of the text (National Center for Education
Statistics, 2015).
While these statistics are daunting at a surface level, their deeper implications are a cause for even greater
concern. In upper elementary, middle school, and high school grades, student success becomes increasingly
dependent on general reading ability. For instance, poor readers are not only likely to have worse outcomes in
English and literature courses, but also in other subjects that rely on content-specific vocabulary and comprehension,
such as geography, history, and science (Espin & Deno, 1993). As students progress through school and have more
of their success dependent on reading and understanding various texts, Matthew Effects, or “the rich-get-richer
while the poor-get-poorer,” begin to emerge (Stanovich, 1986). Poor reading ability has also been associated with
other adverse outcomes, including placing students at a higher risk for school dropout and increased rates of
emotional and behavioral problems compared to typical readers (Arnold et al., 2005; Daniel et al., 2006).
Reading Comprehension
Given its essentiality in the reading process and its extension into nearly every other subject during later
grades, reading comprehension has long been a major focus of educational research, assessment, and intervention.
Meneghetti, Caretti, and De Beni (2006) define reading comprehension as “a complex cognitive ability requiring the
capacity to integrate text information with the knowledge of the listener/reader and resulting in the elaboration of a
mental representation (p. 291).” The operative term in this definition of comprehension seems to be complex, as

2
evidenced by research efforts aimed at identifying and measuring individual components that contribute to
comprehension. In an effort to simplify the complexity of comprehension, Gough and Tunmer (1986) proposed a
framework for better understanding reading, which they term the “simple view” of reading. In their model, reading
comprehension is the product of decoding skills and listening comprehension. Numerous researchers have used this
framework to design studies to better understand the construct of reading comprehension, and while the simple view
of reading has been shown to be a useful framework that is still in frequent use, it may be too simple to capture the
complexities of comprehension (Johnston, Barnes, & Desrochers, 2008).
Numerous other studies (e.g., Berninger, Abbott, Vermeulen, & Fulton, 2006; Catts, Herrera, Nielsen, &
Bridges, 2015; Kendeou, Van den Broek, White, & Lynch, 2009; Meneghetti et al., 2006; Nation, Cocksey, Taylor,
& Bishop, 2010; Tilstra, McMaster, Van den Broek, Kendeou, & Rapp, 2009;) have been conducted with the goal of
identifying specific components of reading comprehension and understanding how these components relate to future
comprehension. Overall, such studies have found that early skills in oral language (e.g., listening comprehension;
Catts et al., 2015; Kendeou et al., 2009), vocabulary (Berninger et al., 2006; Catts et al., 2015), and decoding
(Kendeou et al., 2009) show strong relationships to future comprehension abilities.
Furthermore, both Tilstra et al. (2009) and Berninger et al. (2006) found that reading fluency contributed
significant variance in measures of reading comprehension. Tilstra et al. (2009) found this for students in fourth,
seventh, and ninth grades, while Berninger and colleagues (2006) found similar effects for at-risk second graders.
Despite the importance of reading fluency, these authors cautioned that reading fluency is necessary, but may not be
sufficient, for the successful development reading comprehension in these students.
Indeed, a longitudinal study conducted by Nation et al. (2010) also suggests that indicators of reading
fluency and accuracy may not necessarily detect future reading comprehension difficulties. Results of their study
showed that students who were poor comprehenders at age 5 years were also poor comprehenders at age 8 years,
despite showing age-appropriate levels of accuracy and fluency in word reading. Given these findings, the authors
recommend early assessment for weaknesses in oral language skills in an effort to better identify students at risk for
reading comprehension difficulties.
Another study (Catts et al., 2015) echoes the recommendations provided by Nation et al. (2010) in
suggesting that early screening and assessment for oral language skills occur in addition to screening and assessment
of early literacy skills such as alphabetic principle and phonological awareness. Catts and colleagues indicate that

3
while early literacy screening is helpful in predicting future comprehension difficulties, the addition of oral language
skills screenings may add to this prediction.
Not only does reading comprehension seem to depend on a variety of skills, but it appears that the
contribution of these skills depends on other factors, including a reader’s age and skill level. Tilstra et al. (2009)
found that relationships between various reading skills and reading comprehension vary by student grade level, in
that more basic reading skills (e.g., decoding) are better predictors of comprehension in fourth graders, but that
higher-level skills (e.g., listening comprehension) becomes a stronger predictor in later grades. In addition, a study
by Kim, Wagner, and Foster (2011) investigated predictors of reading comprehension in first grade students.
Overall, they found that word-list reading fluency predicted reading comprehension better for average readers than
skilled readers, while listening comprehension predicted overall comprehension better for skilled readers compared
to average readers.
Given the complex nature of comprehension, it can be difficult to assess and intervene. As such, substantial
research efforts have been dedicated toward the identification of evidence-based assessments and interventions for
reading comprehension.
Reading comprehension assessment and intervention. While comprehension is broadly interpreted as an
understanding of what one reads, there is still debate regarding the best way to measure this construct (Keenan,
Betjemann, & Olson, 2008). Indeed, there are several different “comprehension” tests and subtests which
purportedly measure student understanding; however, these tests go about measuring comprehension in very
different ways. Common strategies for measuring comprehension include passage/story retell, sentence completion,
vocabulary skills, decoding, cloze tasks, true/false sentence recognition, sentence verification tasks, multiple-choice
questions, and open-ended questions. There is an ongoing debate regarding which method is best, and each has its
own advantages and disadvantages (see Cain & Oakhill, 2006 for a summary).
With each method, there are subtle differences in the components of comprehension measured and in the
types of language and cognitive skills required to perform the task. In fact, Keenan and colleagues (2008) compared
several common, standardized comprehension measures and found that these tests not only differ in the skills that
they measure, but in some cases the same tests assessed different skills depending on the reader’s developmental
level. As such, the authors recommend that consumers should consider what they are seeking to measure and how
when deciding on a measure of reading comprehension.

4
The majority of reading remediation in early elementary grades focuses on phonemic awareness, phonics,
decoding, and fluency. For students in upper elementary (i.e., grades 4-5), however, interventions targeting reading
comprehension become more prominent (Wanzek, Wexler, Vaughn, & Ciullo, 2010). This finding is not surprising
given that a shift from “learning to read” to “reading to learn” typically happens between third and fourth grades
(Chall & Jacobs, 2003). It is unclear whether this shift that is due to changes in student ability or changes in
educational expectations, as evidenced by the emphasis on fourth-grade standardized tests. Regardless, it is clear
that not all students are able to effectively shift into the “reading to learn” dynamic. Wanzek et al. (2010)
recommend that, for these readers, it is important to identify specific skill deficits that are resulting in poor reading
and provide evidence-based, multi-component interventions as appropriate.
Identifying Students in Need of Special Education Services in Reading
For students who exhibit substantial difficulties with reading, more intensive educational supports in the
area of reading may be warranted. If so, these students may qualify for special education services under a
verification of Specific Learning Disability (SLD) in reading. A recent report of students with disabilities indicates
that more than 5.8 million U.S. students aged 6-21 are classified as having a disability. Approximately 40% of these
students are receiving services under a verification of SLD, with the majority having an SLD in reading (U.S.
Department of Education, 2014).
Changes in special education legislation have had a major impact on the identification of students with
SLD, particularly following the reauthorization of the Individuals with Disabilities Education Act in 2004. This
legislation, known as the Individuals with Disabilities Education Improvement Act of 2004 (IDEIA; P.L. 108-446),
gave local education agencies a choice regarding the process by which they identify students with a specific learning
disability. The reauthorization removed the previous requirement of identifying the student based on a significant
intellectual/achievement discrepancy and added the option of using a process of identification based on the child’s
response to scientific, research-based intervention (U.S. Department of Education, 2004).
Response to Intervention
For local education agencies opting to use this updated process, Response to Intervention (RTI) is a useful
framework for identification of SLD. RTI is an educational problem-solving process that involves multiple tiers of
increasingly intense educational and behavioral supports (Germann, 2010). While RTI gained research and
professional attention following its inclusion in IDEIA, it is also a useful tool for large-scale school improvement, in

5
both general and special education (Gresham, Reschly, & Shinn, 2010). In fact, Fletcher and Vaughn (2009) indicate
that the primary goal of RTI in schools is to effectively prevent and remediate academic and behavioral concerns.
They indicated a secondary goal of RTI as a way of gathering data that assists in decision-making and the
identification of students with SLD. In order to accomplish these goals, RTI employs a standard set of strategies,
including: tiered systems of support matched to student need, provision of evidence-based interventions with
treatment integrity, problem solving, and data based decision-making. (Fletcher & Vaughn, 2009; Gresham et al.,
2010; Shinn, 2010).
In general, RTI frameworks identify three tiers of support. Tier 1 includes core instructional interventions
that are available to all students (i.e., universal), and are intended to be preventative and proactive. This tier also
involves universal screening, in which all students are administered an assessment tool designed to identify students
at risk for academic or behavioral problems (Fletcher & Vaughn, 2009). It is estimated that approximately 80-85%
of students will respond adequately to Tier 1 interventions and not require additional supports. Based on data
collected during Tier 1, students who are not showing adequate progress and are identified as requiring a greater
level of support advance to Tier 2 and receive more targeted academic or behavioral interventions. These
interventions are more intensive than Tier 1 interventions and are commonly administered in a small-group setting.
It is estimated that 10-15% of students will require Tier 2 supports. In accordance with policies of data based
decision-making, students in this tier are assessed regularly on some academic or behavioral outcome. This process
is known as progress monitoring and helps schools objectively determine whether the student is responding to
intervention efforts. Finally, students who do not respond to Tier 2 advance to Tier 3, where they receive intensive,
individualized intervention. An estimated 5% of students require this level of support (Sugai, Horner, & Gresham,
2002).
Specific to the use of RTI in the identification of SLD, schools typically use a dual-discrepancy approach.
In this approach, students must exhibit (a) severe low achievement compared to their peers, and (b) show evidence
of nonresponse to evidence-based intervention efforts implemented with integrity (Ardoin, Christ, Morena, Cormier,
& Klingbeil, 2013). The first discrepancy can be identified through universal screening in Tier 1, while progress
monitoring in subsequent tiers provides evidence of the second discrepancy (Shinn, 2010). Opponents of the use of
RTI in the identification of SLD maintain that comprehensive psychometric assessment is essential in identifying
SLD, and suggest that RTI should not be used as a diagnostic model. Further, these opponents indicate that RTI

6
should be used only as a remediation model during the pre-referral stage, which includes the time prior to students
being referred for a special education evaluation (Kavale, Kauffman, Bachmeir, & LeFever, 2008).
Despite ongoing controversy about the appropriateness of RTI in the identification of SLD (Fletcher &
Vaughn, 2009; Kavale et al., 2008), RTI and its characteristic components (e.g., treatment integrity and data based
decision-making) are becoming widespread in both research and practice. The current study focuses on data based
decision-making, and, more specifically, monitoring student progress in reading.
Best practices in data based decision-making. The two major components of data based decision-making
in RTI are universal screening and progress monitoring. The purpose of universal screening is to identify children
who are functioning significantly below the academic or behavioral standards expected for their grade or age.
Universal screening typically involves all students in a particular school building or district being administered an
academic or behavioral indicator three times per year: once in the fall, winter, and spring. Results of these
screenings help identify students who may be in need of more intensive services. Best practices for universal
screening include consideration of three key features when selecting a screening tool: the appropriateness of the tool
for the intended use, technical adequacy of the tool, and usability (Glover & Albers, 2007). Shinn (2010) indicates
that once schools identify a technically adequate tool, only then should they consider time- and cost-efficiency as a
factor.
Progress monitoring is the repeated, systematic assessment of behavior (National Center on Intensive
Intervention, 2012). It is an evidence-based practice that allows educators to set goals, assess growth, evaluate
effectiveness of intervention, and inform instructional changes (Deno 2003; Shapiro, Hilt-Panahon, & Gischlar,
2010). Within the context of RTI, it is recommended that schools explicitly use scientifically based assessment tools
to monitor progress at each tier, and that these same tools be used across tiers (Shinn, 2010). One of the most
common assessment tools used for both universal screening and progress monitoring purposes is curriculum-based
measurement.
Curriculum-based Measurement
Curriculum-based measurement (CBM) is a general outcome measure used to assess student performance
in basic academic skill areas (i.e., reading, math, spelling, writing) using a set of standardized measurement probes
(Deno, 1985; Hintze, Christ, & Methe, 2006). It is important to note the distinction between general outcome
measures such as CBM and specific subskill mastery approaches. General outcome measures represent a broad

7
construct, such as reading ability, and provide indications of overall functioning in a particular skill area (Fuchs,
2004). Specific subskill mastery measures often include small domains of test items of equal difficulty that are
matched to a particular learning task and used to indicate mastery of an individual subskill (Hintze et al., 2006). As
such, while certain CBM types may be used as indicators for specific outcomes (i.e., fluency, comprehension), they
are actually conceptualized as multidimensional, integrated measures of a particular construct. Despite this
distinction by experts in the development of CBM, these measures are often categorized by their intervention target
(January & Ardoin, 2012).
Shinn (2002) uses the metaphor of CBM as a thermometer in that it is helpful at identifying the presence
and severity of a problem, can be used to set goals and monitor changes in functioning, and is indicative of return to
normal functioning. Like a thermometer, CBM is not a diagnostic tool, but rather an assessment of overall
functioning and an indicator of a need for further assessment or treatment.
The history of CBM dates back to the early 1980s, when Stanley Deno and a group of graduate students at
the University of Minnesota began to develop tools that could help educators assess special education students’
progress toward goals on their individualized education plan (IEP) and evaluate the effectiveness of special
education programming (Fuchs, 2004; Marston, Mirkin, & Deno, 1984; Parker, Hasbrouk, & Tindal, 1992). In other
words, CBM was originally designed as a progress monitoring tool. CBM is a useful tool for progress monitoring
because it was designed as a dynamic indicator of student performance; therefore, it is sensitive to short-term effects
of instruction (Deno, 2003; Hintze et al., 2006). In addition, CBM meets the National Center for Student Progress
Monitoring’s standards for scientifically based progress monitoring. These standards require that a measure must be:
reliable, valid, contain at least nine alternate but equivalent forms, be sensitive to student improvement over short
periods of time, be linked to benchmarks, specify rates of improvement for various student groups, and show
evidence that their use results in instructional planning and improves student achievement (Shinn, 2010).
In the thirty-plus years since its inception, CBM use has expanded considerably. While progress
monitoring is still a common use of CBM, Deno (2003) identified additional uses, including universal screening,
development of norms, and program evaluation. Stecker, Fuchs, and Fuchs (2005) found that teachers who use CBM
data to inform instructional change effected greater growth in student outcomes than teachers who used their own
methods of progress monitoring and recommendations for instructional change. CBM is used for students from
preschool through high school and for students from diverse backgrounds, including those learning the English

8
language (McMaster, Wayman, & Cao, 2006; Wiley & Deno, 2005). Over time, the content of CBM materials has
expanded to include early literacy, early numeracy, reading, math, and writing skills. Regardless of their use or
content, CBM maintains certain characteristics. According to Deno (2003), CBM is defined by the use of technically
adequate materials, standardized measurement tasks, standardized multiple equivalent samples, and time-efficient
administration and scoring methods.
Curriculum-based measurement in reading. As mentioned above, a variety of CBM measures within the
area of reading are currently available, including those that serve as indicators of early literacy skills (i.e., letter
naming, letter sounds, phonemic awareness, phonics, and decoding), as well as more advanced skills such as fluency
and comprehension. Of all subject areas for which CBM is available, reading has received the most research
attention (Shinn, 2010). The two most common types of reading CBM measures are the read aloud measure and the
Maze task. Another CBM reading measure, retell fluency, is also described.
Read aloud measures. The most commonly used CBM measure for reading is the read aloud measure
(Reschly, Busch, Betts, Deno, & Long, 2009). This measure is also referred to as oral reading fluency (ORF), R-
CBM, or CBM-R. For purposes of this study, this method of measurement will simply be referred to as “read aloud”
unless the read aloud measure comes from a particular publisher.
Standard administration of a read aloud measure involves a student reading out loud from a typed, 150-400-
word passage for one minute. As the student reads, the administrator marks any mispronunciations, word omissions,
word substitutions, and hesitation greater than 3 seconds on any single word (Wayman, Wallace, Wiley, Tichá, &
Espin, 2007). At the end of one minute, the student stops reading and the administrator calculates the number of
words the student read correctly, resulting in a score of words read correctly per minute, or WRCM. Historically,
read aloud passages were taken from curriculum materials such as basal readers (Hintze, Shapiro, Conte, & Basile,
1997). Now, multiple options exist for read aloud passages, including the commercially available AIMSweb (Howe
& Shinn, 2002) and the Dynamic Indicators of Basic Early Literacy Skills (DIBELS; Good & Kaminski, 2002;
2011) series. Appendix A depicts a standard DIBELS read aloud measure.
Read aloud passages are typically administered based on the student’s grade level or instructional level;
however, Wayman et al. (2007) found that it is not necessary for CBM materials to be directly matched to a
student’s instructional level in order to maintain technical adequacy of the measure. In general, their review

9
indicates that reliability and validity remains intact if the CBM passages remain within one grade level above or
below the student’s instructional level.
Wayman, and colleagues (2007) conducted a literature synthesis of CBM in reading and found that, to date,
research efforts have focused overwhelmingly on read aloud techniques compared to other reading measures.
Evidence from the studies included in this synthesis suggests that read aloud is a reliable, valid predictor of student
performance for elementary students in grades 2-5. While the literature supports the use of read aloud measures as a
screening tool, results are mixed regarding its utility as a reliable, valid indicator of student progress. In fact, Ardoin
et al. (2013) indicate that evidence reported in the literature supporting the use of read aloud as a progress
monitoring tool may have been overgeneralized. These concerns will be addressed further in subsequent sections.
Maze measures. A second CBM reading measure is the Maze task. Although Maze has received less
research attention and practical use than read aloud, it has been shown to be a reliable and valid measure of general
reading ability (Fuchs & Fuchs, 1992). The Maze task evolved from cloze tasks (Parker et al., 1992), which consist
of a typed passage that has every nth word deleted throughout the passage. In a cloze task, respondents are required
to write in each missing word such that the sentence is complete and both the sentence and passage make sense. This
task was modified and standardized for use in schools as a general outcome measure of reading, and in doing so
became known as the “Maze” task.
Maze has undergone significant adjustments since its conception in the 1970s. For instance, early Maze
tasks were commonly derived from basal readers and had varied deletion ratios ranging from 1/5 to 1/46. Parker and
colleagues (1992) reviewed the history and use of Maze and made recommendations for development of future
measures. Specifically, they recommended that Maze probes be between 250-400 words in length, only contain
deleted content-related words (i.e., nouns, main verbs, adjectives, and adverbs), include four distractors for each
deleted word, and not place a time limit on Maze passage completion. Individuals familiar with the composition and
administration procedures of most commercially available Maze passages today know that some of these
recommendations have been upheld, while others have not.
The most common Maze tasks currently in use involve a 150-400-word passage that has the first sentence
intact. Starting with the first word of the second sentence, every 7th word is deleted and replaced with three words:
one correct word and two distracter words. Maze administration typically involves a student reading the passage
silently for a specified time limit, usually 1-3 minutes. As the student reads, he or she must choose (i.e., circle) the

10
correct word from the three choices at every 7th word. Like read aloud, standardized Maze passages are available to
consumers through companies like AIMSweb (Howe & Shinn, 2002) and Dynamic Indicators of Basic Early
Literacy Skills (DIBELS; Good & Kaminski, 2002; 2011). Appendix B demonstrates a sample Maze passage.
While Maze has been less frequently researched than read aloud, it does have some perceived benefits
compared to read aloud measures. First, because Maze is a silent reading, time-limited assessment, it can be group-
administered, whereas read aloud must be administered individually (Wayman et al., 2007). In addition, computer-
based administration of Maze is currently available, making it even more efficient to administer and score.
According to Parker and colleagues (1992), teachers may also perceive Maze as having greater face validity as a
measure of reading comprehension compared to read aloud measures, which are commonly perceived as indicators
of reading fluency. This perception is likely due to the test’s construction and outcomes rather than test content;
however, it has resulted in more frequent use of Maze in the upper elementary grades where comprehension
becomes an outcome of interest. In fact, the DIBELS version of Maze, “Daze,” is currently only available for third
grade and beyond.
Just as the use of read aloud measures for progress monitoring is still unresolved by the literature, blanket
recommendations about the use of Maze are hindered by mixed results regarding its utility. These mixed results
have resulted in ongoing controversy regarding the best CBM measure to use for screening and progress monitoring,
particularly when the target outcome is reading comprehension (Ardoin et al., 2004; January & Ardoin, 2012;
Jenkins & Jewell, 1993; Marcotte & Hintze, 2009).
Retell measures. An additional method of assessing reading is retell fluency. This method is usually
administered in conjunction with a read aloud measure (Bellinger & DiPerna, 2011). Standard administration
involves a student reading a passage aloud for one minute, as in read aloud. Then, at the end of the minute, students
are asked to recall as much of the story as they can remember, either orally or by writing it down. The purpose of
retell is to gauge a reader’s understanding of the passage they have just read (i.e., comprehension) and to identify
students who may be reading fluently but are not understanding. In fact, some describe retell methods not as a
general outcome measure but as a skill-specific assessment of reading comprehension (Roberts, Good, & Corcoran,
2005). The oral retell fluency (RTF) procedure is commonly used and recommended in the DIBELS system (Good
& Kaminski, 2002; 2011); however, research regarding the utility of retell is limited and mixed.

11
Reed (2011) reviewed the research on the psychometric properties of retell measures and found high levels
of variability in administration and scoring procedures. Overall, the results of the review indicated that retell
measures on the whole require further validation. Roberts et al. (2005) found modest support for the use of retell
measures in predicting broad reading achievement in a sample of first graders. Bellinger and DiPerna (2011)
assessed whether RTF could reliably predict reading comprehension in fourth grade students. Their results found a
low correlation between RTF measures and reading comprehension criterion measures (r = .33) Further, they found
significant differences between RTF scores based on live versus recorded administrations, indicating reduced levels
of examiner accuracy during live administrations. As such, the authors caution that poor reliability between raters
and scores on RTF could affect its utility as a reliable and valid reading CBM measure. A sample RTF scoring
procedure is depicted in Appendix C.
Evidence for Reading CBM Measures within an RTI Framework
Fuchs (2004) identified three stages of research for substantiating the use of any measure for the purposes
of progress monitoring. The first stage investigates the technical features of a static score (i.e., universal screening).
Stage 2 assesses the technical features of slope, in which changes in student scores over time are associated with
improvement in the domain of interest. Finally, Stage 3 involves the assessment of instructional utility, or whether
practitioners can use the progress monitoring tool in questions to improve instruction and intervention, and thereby
impact student achievement. Subsequent sections present the existing evidence of reading CBM at each stage.
Stage 1 evidence of reading CBM measures as static predictors of achievement. As indicated earlier,
the majority of research on read aloud supports it as a predictor of reading achievement based on a static
measurement. Reschly, et al. (2009) conducted a meta-analytic review of the use of read aloud measures in
predicting student reading achievement and found similar evidence to Wayman et al. (2007). Reschly et al. (2009)
reviewed 41 studies and found that read aloud consistently showed a moderately high correlation with standardized
tests of reading achievement (r = .67). In addition, they investigated a number of variables that could potentially
moderate the relationship between read aloud and reading achievement tests. They found that read aloud shows a
higher correlation with national tests of achievement compared to state tests. Another notable finding from the
Reschly et al. (2009) review was that there were no significant differences between read aloud performance and
student scores on various reading subtests (i.e., comprehension, decoding, and vocabulary). The authors posit that

12
these results speak to the conceptualization of read aloud as a general outcome measure of reading ability rather than
a measure of specific skills such as decoding or comprehension.
Jenkins and Jewell (1993) examined the relationship between reading CBM measures (i.e., read aloud and
Maze) and reading achievement in 335 students in grades 2-6. They administered three R-CBM passages and three
Maze passages to each student. Their results indicated that oral reading was more strongly correlated with reading
achievement for students in grades 2-4 than grades 5 and 6. The authors observed that, as grade level increased,
correlations between oral reading fluency and reading achievement decreased. They found that correlations between
Maze scores and reading achievement remained relatively consistent across grades.
Hosp and Fuchs (2005) conducted a study similar to that of Jenkins and Jewell (1993) in order to evaluate
whether read aloud was differentially predictive across and within grades. They administered reading measures to
310 students in grades 1-4 and found that, across grades, there was no significant change in the relationship between
read aloud measures and comprehension outcome measures. Overall and across grades, CBM had the strongest
relationship with total reading scores, not with any individual skill. Like the findings from Reschly et al. (2009),
these results support reading CBM as a general outcome measure.
Graney, Missall, Martinez, and Bergstrom (2009) evaluated within-year growth for students in grades 3-5
using both read aloud and Maze measures. They collected benchmark CBM data three times per year (i.e., fall,
winter, and spring) over the course of two years. At the end of their study, they found no significant differences in
read aloud growth rates across grade levels. In contrast, they found that growth rates for Maze increased with each
successive grade level. They concluded that Maze may be a more sensitive measure than read aloud for older
elementary students.
Wiley and Deno (2005) used read aloud and Maze measures to predict third-and fifth-graders’ performance
on state standards tests. Their sample included both English learners and non-English learners. Results showed that
both Maze and read aloud showed moderate to moderately strong correlations with a state test in reading. In
addition, the authors found that read aloud was a stronger predictor for both 3rd and 5th grade English learners, and
that Maze added to the predictive abilities of read aloud for both grades of non-English learners, but not for English
learners.
Christ, Silberglitt, Yeo, and Cormier (2010) found even more factors that influence universal screening
scores. They used read aloud benchmark data to investigate growth patterns for students in grades 2-6. In general,

13
they found that students not receiving special education services showed a higher growth rate than students
receiving these services. They also found that students in earlier grades show a higher rate of growth on read aloud
measures compared to older elementary students. Finally, they observed a seasonal effect, in that more growth was
observed from fall-to-winter than winter-to-spring. This seasonal effect was more prominent in younger students
compared to older students.
Together, these findings indicate that the predictive utility of reading CBM measures is dependent on
several factors, including student grade level, the skills being assessed by the criterion measure, season, and student
abilities.
Universal screening with reading CBM. In addition to predicting future achievement, static CBM
measurements can be used to identify students at risk for reading problems. Jenkins, Hudson, and Johnson (2007)
reviewed studies on the classification accuracy of reading screeners for students in grades K-6 and found that;
overall, the CBM reading measures commonly used for universal screening are “good but not great” (p. 598).
Specifically, the review indicated that administering only read aloud screening measures resulted in inadequate
classification accuracy. As such, the authors suggest that a screening battery consisting of more than one type of
reading CBM type may be better at identifying readers who are at risk.
Decker, Hixson, Shaw, and Johnson (2014) investigated the use of a multiple-measure screening battery
with seventh- and eighth-graders and found that administering both Maze and a read aloud resulted in classification
accuracy rates that were either similar to or greater than the rates identified by individual predictors.
In another study of reading CBM as universal screening tools, Graney, Martinez, Missall, and Aricak
(2010) compared the technical adequacy of read aloud and Maze as universal reading screeners in fourth- and fifth-
graders. Results indicated that both read aloud and Maze demonstrated adequate test-retest and alternate-forms
reliability in this sample. In particular, the authors found that read aloud demonstrated a mean short-term (i.e., 2-
week) test-retest reliability of .96, while alternate-forms reliability was .91. For Maze, mean short-term test-retest
reliability was .89. Based on recommendations from Salvia, Ysseldyke, and Bolt (2007), both read aloud and Maze
demonstrate appropriate reliability for use as universal screening procedures in fourth- and fifth-grade students.
Furthermore, Graney et al. (2010) found moderate to strong correlations between reading CBM measures and
reading criterion measures in their study. The authors note that correlations varied significantly depending on the

14
criterion measure, indicating that predictive utility of reading CBM tools depends on the content and construction of
various outcome measures.
Ardoin and colleagues (2004) investigated the incremental benefits of administering additional CBM
measures beyond a single read aloud probe. In particular, they evaluated whether a) administering three versus one
read aloud probes and b) administering a single Maze probe in addition to read aloud contributed to the prediction of
student performance on a standardized achievement test. The authors found that, in their sample of 77 third grade
students, a single read aloud probe was a better predictor of both total reading achievement (r = .70) and reading
comprehension skills (r = .42) compared to Maze (r = .50 for reading achievement and r = .31 for reading
comprehension). Further, adding Maze to a read aloud measure during universal screening did not explain
significant unique variance in broad reading scores. These results contradict those found Decker et al. (2014) and
suggested by Jenkins et al. (2007).
The existing literature on the use of reading CBM measures as universal screeners is promising, but unclear
as to which specific measure to use and for whom. Collective results from the studies above would suggest that
multiple-measure universal screening batteries that include both read aloud and Maze are more appropriate for use
in upper elementary and middle school grades; however, this may be due to fewer studies using Maze for screening
purposes in lower elementary grades, as read aloud is a more common screening tool for these grades.
Specific strategies to use reading CBM to predict comprehension. Munger and Blachman (2013)
examined how well a battery of DIBELS Next (Good & Kaminski, 2011) measures and a vocabulary measure
administered in first grade predicted reading comprehension scores in third grade. Specifically, they used DIBELS
Next early literacy measures (phoneme segmentation fluency, nonsense word fluency, letter naming fluency, word
use fluency, and oral reading fluency) and a standardized measure of receptive vocabulary. They found that first
grade performance on oral reading fluency and the vocabulary measure shared the strongest relationships with third
grade comprehension scores on a standardized test (r = .66 and r = .72, respectively) and explained the most
variance in scores. The authors concluded that DORF is a strong predictor of reading comprehension and should
continue to be used in screening efforts; however, it does not reliably measure oral language skills such as listening
comprehension. As such, supplemental measures are needed in order to effectively predict comprehension
outcomes.

15
In an effort to address concerns about the lack of face validity of read aloud as a measure of reading
comprehension, one study attempted to identify new measures for assessing comprehension efficiently and
effectively.
Marcotte and Hintze (2009) compared four methods for assessing and predicting reading comprehension in
fourth grade students: Maze, retell fluency (RTF), written retell, and sentence verification technique. Maze and retell
fluency methods are described above. The written retell method consisted of students being administered a 750-
word passage, which they read silently for 5 minutes. After 5 minutes of reading, the students were given 5 minutes
to write as much as they could remember from the story. A written retell score was calculated by counting the
number of unique content words (i.e., distinct nouns, verbs, adjectives, and adverbs). Words synonymous with those
contained in the passage were counted as correct. In the sentence verification technique, students were given a
testing packet that contained four passages, each followed by 16 test sentences. During administration, students were
instructed to read each passage and then answer the 16 test items by indicating whether a test sentence had the same
meaning as a sentence in the story (“yes”) or meant something different (“no”). Students were given 30 minutes to
complete their packet.
According to the authors, the purpose of this comparison was to assess the incremental and predictive
utility of each method in combination with read aloud. Results indicated that Maze, written retell, and sentence
verification techniques were all significant predictors of reading achievement in combination with read aloud. The
addition of these measures helped explain an additional 3-8% of observed variance in achievement scores. Overall,
the combination of read aloud and Maze explained 70% of observed variability in the criterion measure of reading
proficiency. Only retell fluency failed to contribute in explaining achievement above and beyond other measures.
Based on these results, the use of multiple types of CBM measures may be warranted for screening and progress
monitoring. Overall, this study suggests that while alternative methods show promise in predicting comprehension,
they do not have standardized methods of administration and typically require more effort by developers and
administrators (Bellinger & DiPerna, 2011).
Another study by Wise et al. (2010) investigated the relationships between different types of oral reading
fluency measures and reading comprehension in at-risk second graders. They compared student performance on
three different methods: a narrative passage similar to a read aloud measure, nonsense word fluency, and “real-
world” oral reading fluency, which included students reading from a word list. Surprisingly, they found that the real-

16
word oral reading fluency measure was the most strongly related to a comprehension outcome measure. The authors
suggest that the real-word method is an efficient way to screen for future comprehension difficulties. Indeed, these
findings agree with those from the Kim et al. (2011) study described above, in which list-reading fluency was a
better predictor of comprehension for average versus skilled readers. In sum, it would seem that early identification
efforts should involve screening for multiple skills related to comprehension in an efficient, reliable way.
Stage 2 evidence of reading CBM measures as progress monitoring tools. While the evidence base for
read aloud and Maze CBM measures supports their use as screening tools, less is known about the utility of these
measures as progress monitoring tools (Wayman et al., 2007). In their review, Busch and Reschly (2007) reported
that CBM measures of reading, including Maze and read aloud, are appropriate for use as progress monitoring tools
in an RTI framework. At Tier 1, CBM measures allow schools to monitor students identified as “at-risk” for reading
problems as identified by universal screening (Deno et al., 2009). At Tier 2, progress monitoring of students
receiving evidence-based intervention provides objective data that can be used to inform whether instructional
changes are necessary and to help determine an individual student’s response to an intervention. Despite the logical
fit between CBM and RTI, empirical evidence regarding the use of read aloud and Maze specifically as progress
monitoring tools is lacking and results are mixed (Shapiro, 2013; Wayman et al., 2007). Emerging research on CBM
reading measures as progress monitoring tools has begun to question previous recommendations about the process
and content of progress monitoring (Shapiro, 2013).
Indeed, Ball and Christ (2012) caution that general outcome measures such as CBM are necessary, but not
sufficient, for evaluating progress within an RTI model. They suggest that CBM be used in combination with
specific subskill mastery measurement (discussed previously), which includes more targeted assessment of
particular skills. Further, they recommend that CBM measures have more utility in evaluating generalized, long-
term effects of an intervention whereas specific subskill mastery measurement is better suited for evaluating the
short-term effects of an intervention.
Olinghouse, Lambert, and Compton (2006) demonstrated use of a specific subskill mastery measurement
tool to monitor progress. In their study, they created an intervention-aligned word list and compared it to a read
aloud measure in its utility in measuring student progress during a reading intervention. They found that the
intervention-aligned word list accounted for unique variance on measures of timed and untimed word reading,
decoding, and timed passage accuracy. The read aloud measure accounted for unique variance on a measure of

17
reading fluency. The authors suggest that, when choosing a progress monitoring tool, it is important that the tool be
highly aligned to student skill level, the skill targeted for remediation, and the goals of the intervention.
Read aloud as a progress monitoring tool. Ardoin and colleagues (2013) conducted a review of the
research on the use of read aloud measures for progress monitoring. Their review included a summary of factors that
influence decision-making, including how many data points are obtained and methods for determining student
progress. The authors reviewed 171 journal articles, book chapters, and instructional manuals related to progress
monitoring with read aloud. Results indicate an overwhelming amount of variability in the literature. Studies
recommend anywhere between 3-20 data points prior to making a decision based on progress monitoring data, with
the modal recommendation being 7 data points. Regarding methods for determining student progress, the review
found that an ordinary least squares (OLS) regression approach was the most commonly recommended procedure
for determining progress. Overall, though, the results of this review indicate significant inconsistencies regarding the
use of read aloud to monitor student progress, both in research and in practice. In fact, the authors go so far as to
state that, “CBM-R progress monitoring is not an evidence-based practice for modeling growth of individual
students’ gains in reading” (p. 12).
Goffreda and DiPerna (2010) came to a similar conclusion when they reviewed 26 studies to arrive at a
synthesis on the psychometric evidence for DIBELS measures. They found that DIBELS read aloud measures
generally exhibit good technical adequacy; however, relative to evidence for these measures as a screening tool,
research is less abundant on their use as a progress monitoring tool.
In sum, these findings calling the use of read aloud as a progress monitoring tool into question are
somewhat paradoxical, given that evaluation of student progress was a primary impetus behind the development of
CBM (Ardoin et al. 2013; Deno, 1985). Additional research regarding the measures and methods by which we
measure reading progress are warranted.
Maze as a progress monitoring tool. Unlike read aloud, no research synthesis on Maze for progress
monitoring is currently available. However, several studies exist that offer similar conclusions about its utility for
this purpose. Fuchs and Fuchs (1992) conducted one of the first studies comparing alternative methods of reading
CBM for measuring elementary students’ growth in reading comprehension. The purpose of this study was to
examine the validity, utility, and acceptability of four measures: question answering tests, recall procedures, cloze
techniques, and maze procedures. These measures were proposed as alternatives to read aloud that could possibly
18
address some of the disadvantages of using a read aloud measure; namely, the time-consuming necessity of
individual administration and the perception of read aloud as simply a measure of fluency and lacking face validity
as a measure of reading comprehension. This multi-year study on progress monitoring revealed Maze as the most
promising reading CBM measure of the four types examined. Namely, Maze was the best at detecting student
growth over time and resulted in the smallest measurement error. It should be noted that Fuchs and Fuchs (1992) did
not find recall measures, similar to RTF, to be reliable detectors of growth.
In recent years, much of the research regarding the use of Maze as a progress monitoring tool has been
conducted with middle school students (Espin, Wallace, Lembke, Campbell, & Long, 2010; Ticha, Espin, &
Wayman, 2009; Tolar, Barth, Fletcher, Francis, & Vaughn, 2014). Espin et al. (2010) analyzed growth curves for
31 eighth-grade students whose progress was monitored using read aloud and Maze. Their results found that Maze
reflected growth over time, with students increasing their scores by an average of 2.88 selections per week. In
contrast, read aloud measures did not indicate significant growth over time. Ticha et al. (2009) replicated the Espin
et al. (2010) study. They administered read aloud and maze passages to a sample of 35 eighth-graders weekly for 10
weeks, then examined how well student growth on each measure predicted performance on reading criterion
measures. Similar to Espin et al.’s (2010) findings, results from Ticha et al (2009) showed that Maze reflected
significant growth over time and was also significantly related to reading criterion measures. Read aloud measures
predicted performance on criterion measures but did not reflect significant growth.
Tolar et al. (2014) compared the utility of static measurement versus slope in predicting student outcomes
on a reading criterion measure. Similar to other studies, the sample in this study included middle school students.
Results indicate low slope reliability across reading CBM measures. Further, the only situation in which slope added
to the prediction of reading outcomes was when the reading CBM measure was highly aligned to the outcome.
These findings concur with those of Olinghouse et al. (2006), who found that measures that are highly aligned to
intervention could account for unique variance in specific skill outcomes.
A study by Shin, Deno, and Espin (2000) examined the technical adequacy (i.e., reliability, sensitivity, and
validity) of the Maze task for measuring reading growth in second graders. They administered computer-based Maze
tasks once per month over the course of a school year to a sample of 43 students. Alternate-forms reliability results
found a mean correlation of r = .81, with a range of reliability from .69 to .91. Sensitivity was assessed using
hierarchical linear modeling (HLM, discussed later in detail). Results showed a significant mean growth rate,

19
indicating a reliable increase in Maze scores. Validity analyses showed a significant positive relationship between
Maze growth and reading scores on a state standards assessment. Further, the authors did not find statistically
significant differences in mean growth rates between general education students and those receiving remedial
education.
Taken together, these findings suggest that Maze is a sensitive predictor of growth in middle school
students and second grade students. Given the diversity of samples in these studies, it is reasonable to expect that
Maze would be sensitive to monitoring progress in other grade levels, as well.
Form Effects and Passage Equivalence in Reading CBM
Passage equivalence is an ongoing concern regarding the use of CBM for progress monitoring purposes
(Deno, Fuchs, Marston, & Shin, 2001). Hintze and Christ (2004) found that CBM passages controlled for difficulty
(i.e., equivalent passages or forms) significantly reduced measurement error compared to uncontrolled passages,
resulting in increased sensitivity and reliability.
The most common method for establishing passage equivalence in CBM measures is through the use of a
readability formula. Readability formulas were designed to give a basic indication of reading difficulty. These
formulas take into account different aspects of written text that theoretically make it more or less difficulty to read,
such as vocabulary and sentence complexity (Begeny & Greene, 2014). As discussed above, reading is a complex
construct which involves the confluence of many different skills. Given that readability formulas seem to take many
of these skills into account, it has been suggested that they may be a better indicator of comprehension difficulty
rather than fluency difficulty (Christ & Ardoin, 2009). If this holds, then the readability formulas used to develop
read aloud passage sets may not be the most appropriate form of establishing passage equivalence. Some researchers
have empirically investigated this question with interesting results.
Ardoin, Suldo, Witt, Aldrich, and McDonald (2005) compared the validity of eight different readability
formulas in predicting student performance on read aloud. The authors found a modest relationship between reading
fluency and read aloud passage difficulty as determined by reading formulas. Interestingly, the readability formulas
most commonly used to categorize read aloud probes were the poorest predictors of reading fluency. Based on these
results, the authors conclude that readability formulas are inadequate for establishing passage equivalence and may
reflect inaccurate estimates of student progress.
20
Betts, Pickart, and Heistad (2009) investigated the equivalence of first-grade read aloud passages and found
that, while readability formulas may be helpful for differentiating reading passages between grade levels, they are
not sensitive enough to establish passage equivalence within a grade level. These results indicate that read aloud
passages within grade levels have different levels of difficulty, which could be problematic when they are used as
progress monitoring tools.
Poncy, Skinner, and Axtell (2005) administered third-grade level DIBELS (Good & Kaminski, 2002) read
aloud probes to a sample of 37 students. Each student was administered 20 passages in a random order over the
course of one school week. While passages had been equated on readability formulas during their development,
Poncy and colleagues investigated whether there was still significant variability among passages. They found that, in
these passages, 81% of variation in scores was attributed to person, while 10% of variation in scores was due to
differences in passage. Through use of generalizability and decision studies, the authors found that if they altered
passages to within 10 WCPM of the mean fluency score across passages, they could attribute 89% of variation in
scores to person and reduce variation in scores due to passage to 2%. These results support the field-testing of
reading CBM passages before use in progress monitoring, and the authors suggest that when identifying passage sets
for this purpose, all measures should fall within 5 WCPM of the mean score for the set in order to reduce
measurement error. This study marked an important effort in identifying ways to establish passage equivalence.
They showed that field-testing passages and comparing mean performance rates was helpful for reducing
measurement error. Others have attempted to identify additional strategies to achieve passage equivalence in read
aloud measures.
Christ and Ardoin (2009) compared four methods of passage equivalence: random sampling, a readability
formula, performance means, and Euclidean Distance. Like Poncy et al.’s (2005) method, the performance means
and Euclidean Distance strategies relied on field-testing a set of existing read aloud passages. Euclidian Distance is a
method of calculating the square root of the sum of squared differences between repeated measurements. By using
this method, the authors were able to form distinct clusters of similar and dissimilar passages in order to reduce
passage variability. Their results indicated that equivalence efforts that used field-testing (i.e., performance means
and Euclidean Distance) resulted in the least measurement error compared to random selection and a readability
formula. During read aloud field-testing with second- and third-graders, Christ and Ardoin (2009) found an average

21
difference of 46 WCPM between the easiest most difficult passages. As such, they concluded that student
performance is dependent on the individual characteristics of passages.
Ardoin and Christ (2009) compared the standard errors associated with various read aloud passage sets,
including DIBELS 6th Edition (Good & Kaminski, 2002), AIMSweb (Howe & Shinn, 2002), and an experimental
passage set designed by the authors (i.e., Formative Assessment Instrumentation and Procedures for Reading; FAIP-
R). DIBELS and AIMSweb passages were taken from the third-grade progress monitoring passages available from
the publishers. The FAIP-R passage set was taken from a collection of passages the authors devised as part of
previous study on passage equivalence (Christ & Ardoin, 2009, described above). Ardoin and Christ (2009) found
that FAIP-R passages had the smallest magnitude of measurement error, including standard error of the slope and
standard error of the estimate. AIMSweb passages had higher error rates than FAIP-R, but lower error rates than
DIBELS passages. Again, the authors of this study concluded that equating read aloud passages through field-testing
methods can help reduce measurement error. Further, they recommend that when schools use read aloud passages
for progress monitoring, it is important to consider the amount of error inherent in growth measurement due to
variability in passage difficulty.
While studies like those described above have shown that field-testing helps reduce measurement in read
aloud scores, it may not always be sufficient to establish passage equivalence. During the development of their latest
reading passage set (i.e., DIBELS Next; Good & Kaminski, 2011), the authors conducted field-testing in an effort to
reduce passage variability. Cummings, Park, and Bauer-Schaper (2013) found significant form effects among
DIBELS Next oral reading fluency probes, indicating that even after field-testing, passage equivalence had not been
reliably established in these measures.
Given the concerns with form effects and passage equivalency stated above, it is evident that efforts to
improve reading CBM are necessary if they continue to be used as progress monitoring tools within an RTI context.
Assessing Growth and Predicting Outcomes with CBM
Some (Deno et al., 2001; Fuchs & Fuchs, 1993) have attempted to identify average growth rates on CBM
measures. While growth rates may be helpful as general indicators of expected progress, Deno et al. (2001) note that
calculation of growth rates is highly dependent on several factors such as sample characteristics and CBM passage
difficulty. They indicate that until passage equivalency can be established for CBM passages, growth rates should be
used with caution.
22
The evaluation of progress monitoring necessitates the use of statistical techniques that are sensitive to
growth, such as multilevel models or latent growth curve modeling (Hoffman, 2015). For purposes of this study,
only multilevel models are described further. Multilevel models are also known as general linear mixed models or
hierarchical linear models (HLM, Bryk & Raudenbush, 2003; Raudenbush & Bryk, 2002). Given that HLM was
used in the current study, this descriptor will be used from here on to describe both the framework and statistical
package used to carry out analyses.
As suggested in its name, hierarchical linear models are those that take the hierarchical structure of data
into consideration (Field, 2009; Woltman, Feldstain, MacKay, & Rocchi, 2012). Hierarchical structures involve
different levels of grouped or “nested” data. These structures are a common occurrence, particularly in education
(i.e., students nested within classrooms nested within schools nested within districts, etc., Woltman et al., 2012). In
longitudinal studies, repeated observations across time are viewed as being nested within individual participants
(Raudenbush & Bryk, 2002). These models are also useful for assessing student growth because they can account
for autocorrelation, or the co-variation of data that results from assessing the same participant over time. In other
words, HLM techniques are not restricted by the assumption of independent data (Field, 2009). Another advantage
of HLM is its ability to handle missing data.
Previous research has demonstrated that HLM is an appropriate method for analyzing students’ academic
growth within an RTI framework (Hampton, Lembke, Lee, Pappas, Chiong, & Ginsburg, 2012; Shin, Espin, Deno,
& McConnell, 2004; Silberglitt & Hintze; 2007; Tichá et al., 2009). Unlike the use of average growth rates, HLM
allows the user to model individual growth rates for students, which helps give a more accurate picture of individual
progress.
Current Study
Given the advantages of field-testing and using mean performance rates for establishing passage
equivalence and reducing measurement error in CBM, these strategies were used to create two equivalent passage
sets: one AIMSweb Maze (R-Maze; Howe & Shinn, 2002) and one DIBELS Next oral reading fluency/retell
(DORF/RTF; Good & Kaminski, 2011). Moreover, these new passage sets were used to monitor reading progress in
a sample of second-grade students over the course of approximately 8 weeks. Finally, students were administered a
standardized reading comprehension measure at the end of the study. These strategies were used to answer two main
research questions:

23
1. After equating passages, which CBM probe type (i.e., R-Maze, DORF, or RTF) is the most
sensitive to reading growth in second graders over eight weeks? Additionally, does growth differ
depending on certain student characteristics (i.e., free/reduced lunch status or special education
services)?
2. Which CBM probe type (i.e., R-Maze, DORF, or RTF) is the best predictor of reading
comprehension?
Despite limited and mixed evidence regarding the use of RTF measures for progress monitoring and
predictive purposes, they were included in the study based on their purported use as an indicator of reading
comprehension, as well as their having a similar construction one particular subset of the reading comprehension
outcome measure used in the current study (i.e, Reading Recall subtest of the Woodcock-Johnson IV (McGrew,
LaForte, & Schrank, 2014)).
In order to answer research question one, HLM will be used to evaluate student growth on each different
CBM probe type. While studies show that read aloud measures are sensitive to growth between benchmarks, less
evidence is available regarding their sensitivity to short-term growth. Also, given that Shin et al. (2000)
demonstrated that Maze measures are sensitive to reading growth in second graders, it was hypothesized that
AIMSweb R-Maze would be most sensitive to changes in participants’ reading scores over the course of the 8-week
study. Based on mixed results regarding the utility of RTF as a progress monitoring tool, these measures were not
expected to show sensitivity to growth. Further, it was hypothesized that students receiving special education
services would show slower growth than peers who do not receive special education services. This hypothesis is
based on findings from Christ et al. (2010) and Shin et al. (2000) who found differences in growth based on SPED
status. Finally, it was hypothesized that growth rates for students who were eligible for free/reduced lunch would
show different growth rates than students who were not, as previous research has shown that student socioeconomic
status is related to student achievement (Raudenbush & Bryk, 2002).
Regarding the second research question, it was hypothesized that DORF measures would be the strongest
predictor of reading comprehension. This hypothesis is the result of a review of a literature base which shows that,
for students in lower elementary grades, read aloud measures have been the strongest predictors of overall reading
achievement.

24
METHOD
Institutional Review Board approval was obtained prior to participant recruitment and data collection. After
gaining school administrator and teacher permission, consent forms were sent home to parents of eligible
participants. In Phase One, all second grade students were eligible to participate. In Phase Two, teachers sent parent
consent forms home to all students whose mid-year reading scores were at or below benchmark for second grade.
Because the schools in the study screened students using DIBELS (Good & Kaminski, 2002; 2011), “benchmark”
refers to a WCPM score of 71 or below. Scores in this range place a student at higher risk for reading difficulties and
indicate a need for supports.
For each phase, students whose parents consented to their participation were given a brief written and
verbal explanation of the study and given the choice to participate. There were no students who declined to
participate in Phase One, and there were four students in Phase Two who declined to participate following
explanation of the study.
Participants
Participants for Phase One included 75 second-grade students recruited from four public elementary
schools in a central Nebraska school district. The sample was comprised of 36 males (48%) and 39 females (52%).
There were 62 Caucasian students (82.7%), nine Hispanic students (12%), three African-American students (4%)
and one Asian student (1.3%) in this phase.
In Phase Two, a total of 32 second-grade students participated. These students were recruited from the
same four schools in the same district in central Nebraska. In this phase, there were 19 males (59.4%) and 13
females (40.6%). Furthermore, there were 26 Caucasian students (81.3%), five Hispanic students (15.6%) and one
Asian student (3.1%). A total of 15 students (46.9%) in this phase of the study were eligible for free or reduced
lunch, while a total of 12 students (37.5%) received some type of special education services.
Measures
Maze. The AIMSweb Reading Maze (R-Maze) passage set for second grade includes a total of 30
passages: three benchmark passages and 27 passages for progress monitoring. The 27 R-Maze progress monitoring
passages are the same stories as those used in administration of the AIMSweb read aloud measure (R-CBM). During
AIMSweb passage development, an original pool of 50 probes was field-tested with elementary students and
passages were evaluated based on difficulty, alternate-form reliability, and readability. Passages more than one

25
standard error of measurement above or below the overall mean difficulty (based on number of words read
correctly), passages whose readability was outside of the intended grade range, and passages whose alternate-form
reliability was less than .70 were eliminated from the pool. Passage length ranges from 150-400 words.
Developers modified each R-CBM passage for use as a Maze task using a procedure described by Fuchs
and Fuchs (1992). The first sentence of each passage remains intact. Starting with the second sentence, every
seventh word has been replaced by a bracketed set of three words. One of these three words is the word from the
original passage (i.e., the correct choice), and the other two are distracter words. One distracter word is a word from
the passage that is of the same part of speech but does not make sense or preserve meaning, while the second
distracter is a word from the passage that is of a different part of speech and does not make sense in context (Howe
& Shinn, 2002). Based on data from a standardization sample, the alternate-form reliability of R-Maze passages
ranges from .68 - .78. Alternate-form reliability for the R-Maze passage set is .74.
Standard administration of the R-Maze involves students being given a standard set of instructions
regarding the task, and, if appropriate, a practice task. Following these instructions, students are asked to read a
passage silently and circle the correct word each time they come to a bracketed set of three words. Students have
three minutes to complete the task. Because students read silently and indicate their answers by circling words, the
R-Maze task can be administered in a large group, small group, or individual format. R-Maze scores are calculated
by counting the total number of correct responses on each passage. Students who happen to complete the R-Maze
task in less than three minutes have their score prorated based on a formula developed by test developers (Howe &
Shinn, 2002).
Read aloud and retell. The Dynamic Indicators of Basic Early Literacy Skills Next (DIBELS Next; Good
& Kaminski, 2011) Oral Reading Fluency (DORF) task is a standard read aloud measure, while DIBELS Retell
Fluency (RTF) is a word recall task. DIBELS Next passages differ from earlier editions of DIBELS passage sets in
that they have been field-tested with elementary students and have been equated empirically. Another new feature of
DIBELS Next involves the combination DORF and retell tasks into a single administration with the goal of
obtaining a more comprehensive measure of reading ability. The technical manual of the DIBELS Next indicates
that DORF has multiple-probe alternate-form reliability of .96 and test-retest reliability of .91 in second-grade
students. For RTF, multiple-probe alternate-form reliability was .68 and test-retest reliability was .27 and non-

26
significant. Measures of criterion validity for DORF and RTF with a standardized reading outcome measure were
.69 and .53, respectively.
Standard administration of DORF/RTF takes place in an individual format. Students are given a standard
set of instructions and then asked to read a written passage aloud to the examiner. Once the student begins reading
aloud, the examiner begins timing for one minute. As the student reads, the examiner marks mispronunciations,
omissions, and any other errors on their copy of the story. At the end of one minute, the examiner tells the student to
stop reading. Immediately after the student stops reading for DORF, the examiner prompts the student to recall as
much as they can from the story he/she just read (i.e., retell). Once the student begins retelling the story, the
administrator starts timing for one minute and begins marking the number of words a student recalls that are relevant
to the story. Scoring for the DORF task involves calculating the total number of words a student read, then
subtracting the number of errors to arrive at the number of words the student read correctly in one minute (WRCM).
Scoring for the RTF task involves counting the total number of words the student recalled that were relevant to the
story.
Reading comprehension. The Woodcock-Johnson IV Tests of Achievement (WJ-IV; McGrew, LaForte,
& Schrank, 2014) Reading Comprehension - Extended cluster consists of three subtests: Passage Comprehension,
Reading Recall, and Reading Vocabulary. The Passage Comprehension subtest involves students reading a sentence
or short passage and identifying a missing word that make sense in context. This subtest has a median reliability of r
= .89. The Reading Recall subtest requires students to read a story silently and then recall as much of the story as
possible. Median reliability of the Reading Recall subtest is r = .92. For the Reading Vocabulary subtest, students
read target words aloud and provide a synonym or antonym as appropriate. This subtest has a median reliability of r
= .88. (McGrew et al., 2014). The Reading Comprehension cluster has a median reliability of r = .96. Unlike CBM
measures, subtests from the WJ-IV are untimed, although students may be prompted for a response following a
period of silence. An online scoring package is available from the publishers, and provides a report that includes
scaled scores, age equivalents, and grade equivalents.
Procedural Integrity and Interobserver Agreement
Because CBM is a standardized procedure, it is important that passages are administered with integrity.
During Phase One, 27.4% of Maze administrations and 27.1% of DORF/RTF administrations were monitored for
procedural integrity. During Phase Two, 26.2% of Maze administrations and 30.4% of DORF/RTF administrations

27
were monitored for procedural integrity. Procedural integrity by phase and probe type is found in Table 1. For all
probe types, integrity was assessed using the administration checklist provided by test developers (See Appendices
D, E, and F).
Table 1. Procedural Integrity by Phase and Probe Type Phase One Phase Two
Probe Type Average Minimum Maximum Average Minimum Maximum R-Maze 98.2% 83.3% 100% 96.5% 83.3% 100% DORF 98.8% 83.3% 100% 98.7% 83.3% 100% RTF 95.4% 66.7% 100% 96.1% 83.3% 100%
To ensure scoring accuracy, a random sample of 25.9% of Maze administrations and 27.1% of DORF/RTF
were re-scored by a separate rater during Phase One. In Phase Two, 36.7% of Maze probes and 30.4% of
DORF/RTF probes were re-scored for accuracy. For R-Maze, the second rater re-scored paper copies of individual
passages. For DORF/RTF, the second rater listened to recorded administrations of the passage once and re-score the
paper copy. Given concerns in the literature regarding low reliability on scoring of retell measures (Bellinger &
DiPerna, 2011), audio recordings helped enable a method of correcting for examiner errors in administration. If
interobserver agreement (IOA) scores were below 80%, the score recorded by the primary rater (i.e., the author or a
graduate assistant) was used for data analysis purposes. For WJ-IV subtests, 25% of administrations were recorded
and re-scored for accuracy. Average IOA for subtests was 97.8% and ranged from 91.2% to 100%. For all measures,
IOA was calculated using the following formula: Agreement = (Number of agreements/Number of agreements +
Disagreements) *100. Additional results of IOA for each phase may be found in Table 2.
Table 2. Interobserver Agreement by Phase and Probe Type Phase One Phase Two
Probe Type Average Minimum Maximum Average Minimum Maximum R-Maze 98.4% 94.1% 100% 99.2% 98.2% 100% DORF 99.2% 92.4% 100% 98.8% 89.1% 100% RTF 91.3% 52.6% 100% 89.1% 33.3% 100% Procedure
Training. Graduate and undergraduate psychology majors assisted with data collection. All research
assistants participated in a 3-hour training session prior to collecting data for the study. The training session was
conducted by the author, and included an overview of reading CBM, including a brief history and its uses. Next,
DIBELS DORF/RTF and AIMSweb R-Maze tasks were introduced, including specific administration and scoring
rules for each. Research assistants then practiced scoring CBM probes using DIBELS training videos and

28
AIMSweb sample probes. During training, research assistants also practiced administering DORF/RTF and R-Maze
tasks to the author using the scripts provided by the publishers. The author scored procedural integrity using
checklists provided by the publishers (See Appendices D-F). After research assistants demonstrated at least 90%
scoring and administration accuracy on training materials, they observed in vivo administrations of the measures and
scored during live administrations. Once they demonstrated 90% scoring accuracy on three consecutive live
administrations for each probe type, they were allowed to aid in data collection. Each research assistant received a
training packet that included copies of administration scripts for each task, as well as an overview of scoring
procedures. Research assistants were asked to use this packet a reference during data collection to increase
procedural integrity, although extra copies were always available from the researcher.
Phase one: Identification of equivalent passage sets. R-Maze probes were selected from the pool of 27
AIMSweb (Howe & Shinn, 2002) progress monitoring passages described above, which were available for
download from the AIMSweb website. Similarly, DORF/RTF passages were selected from a pool of 20 DIBELS
Next (Good & Kaminski, 2011) progress monitoring passages available for download from the DIBELS website.
Administration and scoring procedures were conducted according to the standardized instructions suggested by each
respective publisher as described above. Students across the four participating schools were administered R-Maze
and DORF/RTF passages in a random order until at least 25 passages from each pool were administered, or until the
duration allowed for Phase One expired. At the end of Phase One, each student had completed an average of 9.0 R-
Maze probes and an average of 7.4 DORF/RTF probes. R-Maze administration typically occurred in small-group
formats (i.e., 3-5 students). DORF/RTF administration always occurred in an individual format, and administrations
were voice-recorded for IOA scoring and treatment integrity purposes. The setting for passage administration varied
across schools. Probes were administered at small tables and desks in the hallway in two schools, in the library at
one school, and in an empty classroom at the fourth school.
A total of 14 probes administered during this phase (9 R-Maze; 5 DORF/RTF) were excluded from data
analysis due to spoiled administrations. Spoiled administrations were defined as any occurrence that affected
administration or scoring such that a) a valid score could not be obtained or b) the score obtained was likely to be
inaccurate. Situations in which student effort or motivation resulted in a low score were not judged as spoiled
administrations unless the student refused to participate or purposefully made errors. Spoiled administrations during
this phase were typically the result of examiner error, such as failing to start timing appropriately. Spoiled

29
administrations were also the result of major interruptions or distractions (e.g., fire or tornado drills; announcements
over the loudspeaker). In the event of a spoiled administration, the student was administered an alternate probe.
Phase two: Progress monitoring. Second-grade students who scored below the reading benchmark during
winter universal screenings (i.e., 71 WCPM or lower) but were still capable of reading a second grade-level passage
were recruited for phase two of the study. Teachers at participating schools were asked to identify these students and
distribute parental consent forms to potential participants’ parents. Following recruitment and parental consent, 33
students agreed to participate in this phase of the study. One student moved out-of-state during the study, bringing
the final sample size for this phase to 32 students.
Each student in this phase was administered one R-Maze passage and one DORF/RTF passage per week
for 8 weeks or until 8 occasions of data were collected. Data collection typically occurred once per week; however,
due to various schedule conflicts (i.e, student absences, school holidays, field trips, assemblies, etc.) data collection
occurred twice per week (Tuesday and Friday) for three students. R-Maze administration typically occurred in
small-group formats (i.e., 3-5 students). DORF/RTF administration always occurred in an individual format, and
administrations were voice-recorded for IOA scoring and treatment integrity purposes. Administration order of
passages was randomized and balanced across students and schools to help account for order effects and additional
form effects not accounted for by passage equivalency efforts. A random number generator function was used to
devise the administration order of probes, which was balanced across schools. Following completion of progress
monitoring data collection, each participant was administered the Reading Comprehension – Extended cluster of the
WJ-IV. Individual administrations of WJ-IV subtests were also voice-recorded and reviewed by a second rater for
IOA purposes. Settings of probe and outcome measure administration were identical to those in Phase One.
There were a total of four spoiled administrations during this phase of the study: one for R-Maze (which
resulted in three spoiled participant probes, as there were three students in the group) and three for DORF/RTF. The
spoiled Maze administration occurred when the administrator failed to start her timer at the beginning of probe
administration. The spoiled DORF/RTF administrations were also the result of examiner error, including failing to
administer the RTF task following DORF administration and inaccurate timing procedures. In all four cases,
students were administered alternate probes following the spoiled administration.

30
Data Analyses
Phase one: Identification of equivalent passage sets. Data gathered during Phase One were entered into a
data file in SPSS (IBM Corp., 2015) in order to facilitate calculation of descriptive statistics which resulted in rank-
ordering and identification of new passage sets. A mean score (i.e., number of correct selections for R-Maze, words
read correctly per minute for DORF, and number of content words recalled for RTF) was calculated for each
passage in the pool, followed by calculation of a grand mean for each probe type. Mean scores for each passage
were rank-ordered around the grand mean for R-Maze and DORF. Although mean scores were calculated for RTF,
these passages were ranked around the average WCPM scores rather than the number of relevant words recalled
during the RTF task. Given that DORF has been shown to be a more reliable measure and stronger predictor of
reading performance, it was decided that a passage set formed around WCPM rather than RTF would be appropriate.
The five passages whose means were immediately above and below the grand mean of each probe type were
considered for inclusion in the next phase. For DORF, the WCPM ranges of these 10 passages were calculated and
adjustments were made as needed such that the mean WCPM for all passages in the new set were within 5 WCPM
of the grand mean for DORF.
Although Phase Two only included eight occasions of data collection, 10 passages for both DORF/RTF and
R-Maze were selected for use in Phase Two. The two extra passages identified served as alternate passages to be
used in the event of a spoiled administration, as described above.
Phase two: Progress monitoring. Probes administered during Phase Two were scored in the same way as
those in Phase One with one exception: pro-rating formulas were not employed in situations where students finished
the task in less than three minutes. Based on observations of student performance during live administrations during
the R-Maze task, participants in this phase who finished in less than three minutes had a high likelihood of rushing
through the task, which typically resulted in a high error rate (i.e., greater than 67%). As such, R-Maze probe scores
in this phase consisted of a count of the total number of correct selections. This strategy was adopted given that pro-
rating would result in inflated and inaccurate scores for these participants. Although such administrations may have
been considered a spoiled administration, it was decided that applying a post-hoc scoring correction would be more
time-efficient than re-administering these probes, particularly since some students persisted in rushing through the
task even after being reminded of the task instructions and emphasizing that students should work as quickly as the
can without making mistakes. Potential implications of scoring corrections are addressed in the Discussion section.

31
Data file structuring. Data gathered during Phase Two were entered into data files in SPSS (IBM Corp.,
2015). In the file for growth models, data were structured hierarchically, such that each row of data included a single
student’s CBM scores on a single occasion of data collection. In other words, the original level-1 data file included
256 rows before removing outliers. Furthermore, data were sorted by their student identification number then by the
occasion of data collection. The data file used for predicting comprehension included 32 rows of data, each of which
included a single student’s comprehension score and their CBM scores for the three different probe types on the first
occasion (i.e., their initial status score for each CBM measure). In this file, data were sorted first by their school
identification number then by their student identification number.
Assumptions. HLM holds the assumptions of normality and homogeneity of variance. After evaluating
normality plots for CBM probe types, one clear outlier was observed in both R-Maze and DORF, while several
outliers were identified for RTF. The outlier for R-Maze was a score in which the student completed the task in just
over one minute and had an error rate of 50%. As such, it was determined that the score may not be a valid indicator
of that student’s performance and was thus deleted. For DORF, the outlier score was also determined to be possibly
invalid and was thus deleted. After removing these occasions of data, both normality and homogeneity assumptions
were met for these variables. For RTF, tests for normality indicated kurtosis (>1). This violation also has the
potential to result in significant tests for heterogeneity of variance (Raudenbush & Bryk, 2002). As such, three
extreme scores were removed for RTF (the highest and two lowest). These deleted cases resulted in a total of 255
occasions of R-Maze and DORF data and 253 occasions of RTF data for the final level-1 data set.
Variable coding. Time (occasion, or OCC) was centered on the first measurement occasion by subtracting
each measurement occasion by 1. This aided in model interpretation such that the intercept indicated a particular
student’s score at the beginning of the study. Student eligibility for free or reduced lunch (FRL) and student special
education status (SPED) were dummy coded such that “0” indicated a student who was not eligible for free or
reduced lunch or did not receive special education services, while “1” indicated a student who was eligible for free
or reduced lunch or did receive special education services.
HLM model building. The statistical modeling software HLM 7 (Scientific Software International;
Raudenbush et al., 2011) was used to evaluate all models. For all models used in analysis, parameters were
estimated through restricted maximum likelihood (RML). This is the default likelihood setting for HLM, and
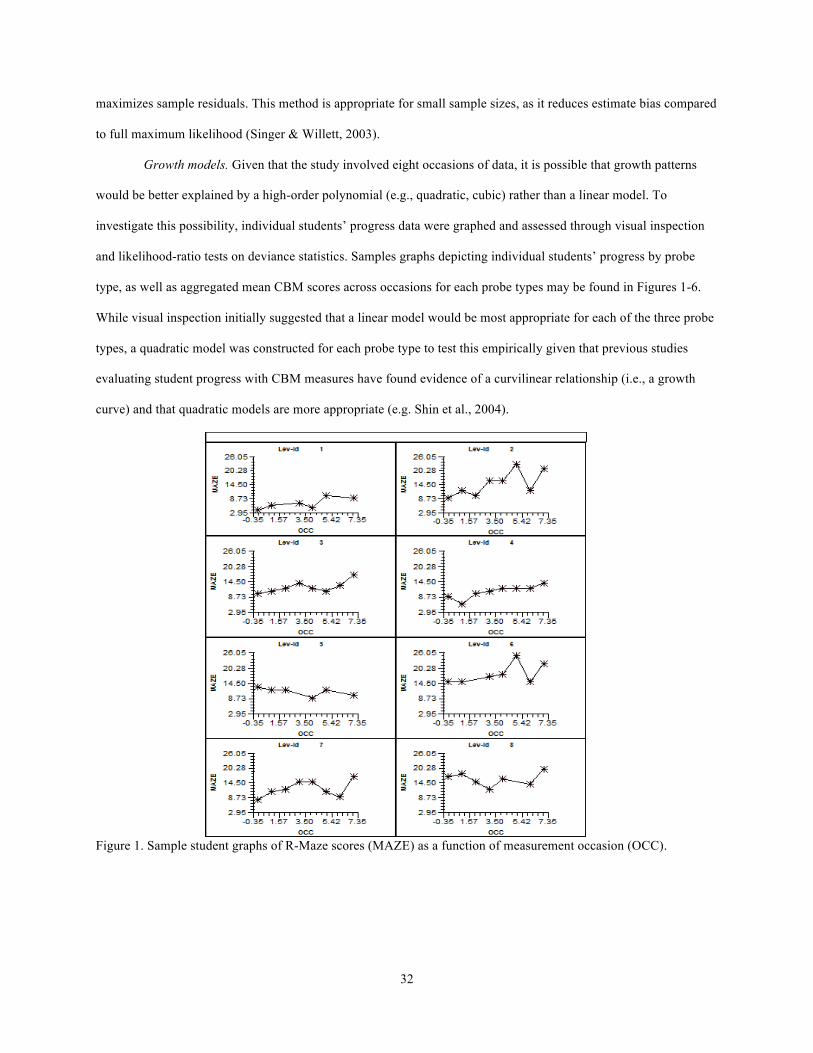
32
maximizes sample residuals. This method is appropriate for small sample sizes, as it reduces estimate bias compared
to full maximum likelihood (Singer & Willett, 2003).
Growth models. Given that the study involved eight occasions of data, it is possible that growth patterns
would be better explained by a high-order polynomial (e.g., quadratic, cubic) rather than a linear model. To
investigate this possibility, individual students’ progress data were graphed and assessed through visual inspection
and likelihood-ratio tests on deviance statistics. Samples graphs depicting individual students’ progress by probe
type, as well as aggregated mean CBM scores across occasions for each probe types may be found in Figures 1-6.
While visual inspection initially suggested that a linear model would be most appropriate for each of the three probe
types, a quadratic model was constructed for each probe type to test this empirically given that previous studies
evaluating student progress with CBM measures have found evidence of a curvilinear relationship (i.e., a growth
curve) and that quadratic models are more appropriate (e.g. Shin et al., 2004).
Figure 1. Sample student graphs of R-Maze scores (MAZE) as a function of measurement occasion (OCC).

33
Figure 2. Aggregated average student R-Maze (Mean Maze) scores as a function of measurement occasion (Occ).
Figure 3. Sample student graphs of DIBELS oral reading fluency scores (ORF) as a function of measurement occasion (OCC).
34
Figure 4. Aggregated average student DIBELS oral reading fluency (Mean ORF) scores as a function of measurement occasion (Occ).
Figure 5. Sample student graphs of DIBELS retell fluency scores (RETELL) as a function of measurement occasion (OCC).

35
Figure 6. Aggregated average student DIBELS retell fluency (Mean Retell) scores as a function of measurement occasion (Occ).
Three separate growth models were built in an effort to answer research question one, one for each CBM
probe type. Each model included two levels, in which measurement occasions (i.e., time) at level-1 were nested
within individual students at level-2. The contributions of student socioeconomic status, as indicated by eligibility
for free or reduced lunch (FRL), and student special education status (SPED) were also evaluated by including these
variables as predictors at level-2. While a 3-level model could also be used given that students in the study were
nested within schools, the variables of interest (i.e., time, student FRL status and student SPED status) were at level-
1 and level-2. Furthermore, the small number of level-3 units (i.e., schools) limits interpretability of effects that
would be found at this level. As such, 2-level models were used for evaluating student growth.
A taxonomical approach was used in building all growth models, such that simpler models were
constructed first and that subsequent, more complicated models were fit as indicated by empirical evidence and
theory (Singer & Willett, 2003). This approach provides a baseline to which future models may be compared
(Raudenbush & Bryk, 2002). Given these recommendations, the first built was an unconditional means model
(Singer & Willett, 2003). The unconditional means model, also known as the null or empty model, does not include
any predictors, only the outcome variable. This model is essentially a one-way analysis of variance, and it allows the
user to test the null hypothesis that the mean initial status is not statistically different from zero. (Raudenbush &
Bryk, 2002). The unconditional means model equations for each probe type may be found in Table 3.

36
Table 3. Taxonomy of multilevel models for change fitted to CBM data
Level-1/Level-2 specification
Model Level-1 Model Level-2 Model Composite Model A Yti = π0i + eti
π0i = β00 + r0i
Yti = β00 + r0i + eti
B Yti = π0i + π1i(OCC)ti + eti
π0i = β00 + r0i,
π1i = β10 + r1i
Yti = β00 + β10(OCC)ti + r0i +
r1i(OCC)i + eti
C Yti = π0i + π1i(OCC)ti + eti
π0i = β00 + β01(FRL)i + β02(SPED)i + r0i,
π1i = β10 + β11(FRL)i + β12(SPED)i + r1i
Yti = β00 + β01(FRL)i +
β02(SPED)i + β10(OCC)ti +
β11(FRL)i(OCC)ti +
β12(SPED)i(OCC)ti + r0i
r1i(OCC)ti + eti
Note: These models predict CBM scores as a function of time (OCC) at level 1 and free/reduced lunch status (FRL) and special education status (SPED) at level 2. Model A represents the unconditional means or “empty” model. Model B represents the unconditional growth model, and Model C represents the conditional model. Three separate model taxonomies were constructed – one for each CBM type.
Next, an unconditional growth model was estimated for each probe type. In this model, time was added to
the unconditional means model as a level-1 predictor. The unconditional growth model allows one to partition and
quantify variation across both people and time (Singer & Willett, 2003). Time was entered as a random effect, which
allowed each student to have his or her own growth rate over the course of the study. Equations for unconditional
growth models may be found in Table 21. For all probe types, measurement occasions were balanced across students
with no missing data. Measurement occasions were adjusted such that 0 represented the first occasion of data
collection.
Finally, student-level predictors (i.e., special education status and free/reduced lunch status) were added to
each model at level 2. Model fit was evaluated at each progression using deviance statistics and a measure of
Pseudo R2. This statistic allows one to calculate how well subsequent models reduce the proportion of residual
variance compared to the previous model (Singer & Willett, 2003). It is important to note that deviance statistics are
only useful in comparing models that are nested within each other (Raudenbush & Bryk, 2002), and, in the use of
RML, only differ in their variance components. As such, these statistics were only used to compare model fit
between the unconditional means and unconditional growth models.
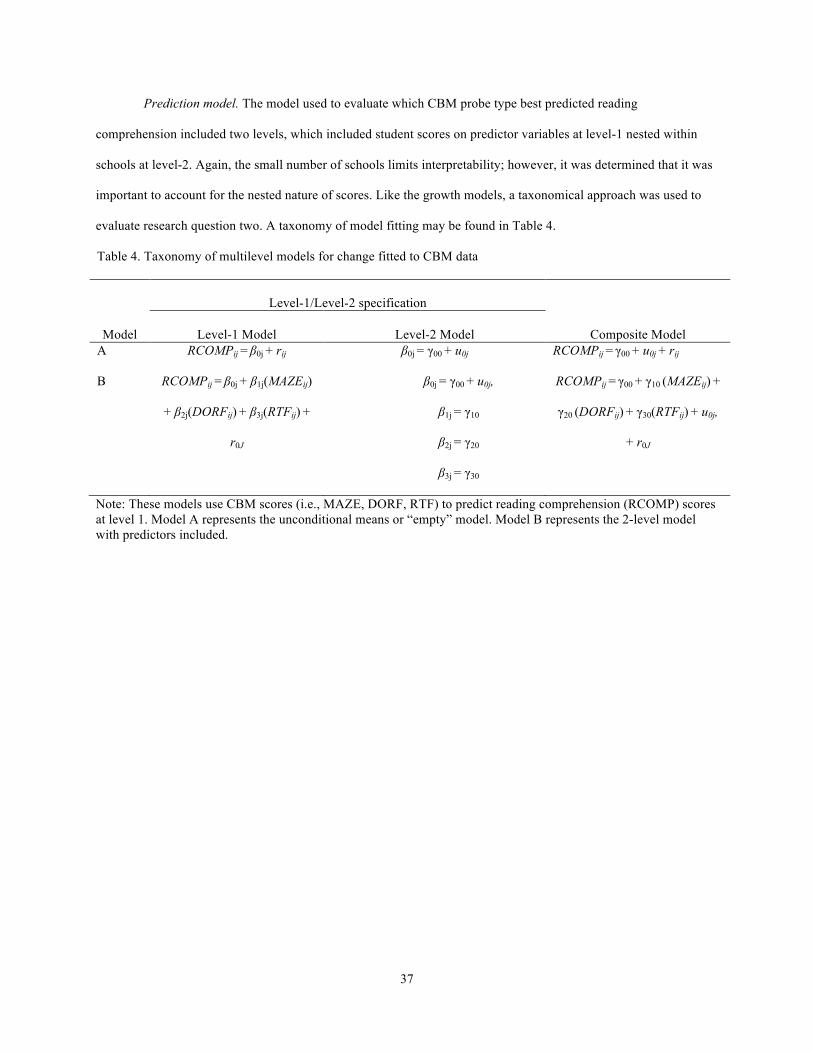
37
Prediction model. The model used to evaluate which CBM probe type best predicted reading
comprehension included two levels, which included student scores on predictor variables at level-1 nested within
schools at level-2. Again, the small number of schools limits interpretability; however, it was determined that it was
important to account for the nested nature of scores. Like the growth models, a taxonomical approach was used to
evaluate research question two. A taxonomy of model fitting may be found in Table 4.
Table 4. Taxonomy of multilevel models for change fitted to CBM data Level-1/Level-2 specification
Model Level-1 Model Level-2 Model Composite Model A RCOMPij = β0j + rij β0j = γ00 + u0j RCOMPij = γ00 + u0j + rij
B RCOMPij = β0j + β1j(MAZEij)
+ β2j(DORFij) + β3j(RTFij) +
r0J
β0j = γ00 + u0j,
β1j = γ10
β2j = γ20
β3j = γ30
RCOMPij = γ00 + γ10 (MAZEij) +
γ20 (DORFij) + γ30(RTFij) + u0j,
+ r0J
Note: These models use CBM scores (i.e., MAZE, DORF, RTF) to predict reading comprehension (RCOMP) scores at level 1. Model A represents the unconditional means or “empty” model. Model B represents the 2-level model with predictors included.

38
RESULTS
Phase One: Identification of Equivalent Passage Sets
Table 5 indicates the means, standard deviations, and final results of rank-ordering R-Maze passages by
their respective grand means. Prior to rank-ordering, the range in mean correct selections between the 27 available
R-Maze progress monitoring probes was 9.74 (13.58 – 23.32). After rank-ordering passages for R-Maze around the
grand mean and selecting the five passages immediately above and below the mean, this range was reduced to 3.55
(16.60 – 20.15). The 10 R-Maze passages identified through rank-ordering around the grand mean were then
retained for use in the next phase of the study.
Table 5. Numerical and Rank Ordering of R-Maze Probes following Passage Equating
Numerical Order Rank Order
R-Maze Probe Number N
Number Correct
Mean (SD)
R-Maze
Probe Number N
Number Correct
Mean (SD) 4P04 At my house 25 20.08 (6.34) 2P14 It all began 22 23.32 (7.02) 2P05 Aunt Pam worked 28 19.25 (5.51) 2P18 Kim was happy 25 22.13 (6.25) 2P06 Cam was a clam 25 15.92 (7.88) 2P32 Tom and his family 22 20.91 (7.98) 2P07 Cole and Meg 26 16.00 (7.78) 2P16 It was the first 23 20.87 (6.27) 2P08 Dad was upset 24 20.42 (5.72) 2P29 A mother held 23 20.48 (5.46) 2P09 Last week Grandpa 25 16.56 (5.50) 2P08 Dad was upset 24 20.42 (5.72) 2P10 I can say many 28 16.25 (5.87) 2P28 The lion was 25 20.28 (6.01) 2P11 I wish I 25 17.64 (5.74) 2P19 Maddie wanted to** 26 20.15 (7.90) 2P12 Not very long ago 24 20.00 (5.40) 4P04 At my house** 25 20.08 (6.34) 2P14 It all began 22 23.32 (7.02) 2P12 Not very long ago** 24 20.00 (5.40) 2P16 It was the first 23 20.87 (6.27) 2P05 Aunt Pam worked** 28 19.25 (5.51) 2P17 Joey liked to 26 13.58 (7.67) 2P31 Today is the animal** 25 19.16 (5.47) 2P18 Kim was happy 25 22.13 (6.25) 2P11 I wish I** 25 17.64 (5.74) 2P19 Maddie wanted to 26 20.15 (7.90) 2P30 This is a tale** 25 17.40 (6.02) 2P20 My dad can fix 25 16.60 (5.87) 2P27 The kids in** 26 17.35 (5.77) 2P21 My little sister Emma 25 13.96 (7.97) 2P25 Pat loved to make** 25 16.68 (5.66) 2P22 My teacher says 25 15.88 (5.88) 2P20 My dad can fix** 25 16.60 (5.87) 2P23 One spring day, Mark 25 16.28 (7.06) 2P09 Last week Grandpa 25 16.56 (5.50) 2P25 Pat loved to make 25 16.68 (5.66) 2P23 One spring day, Mark 25 16.28 (7.06) 2P26 Can animals really 28 14.79 (5.10) 2P10 I can say many 28 16.25 (5.87) 2P27 The kids in 26 17.35 (5.77) 2P33 Where is your fort 25 16.12 (5.85) 2P28 The lion was 25 20.28 (6.01) 2P07 Cole and Meg 26 16.00 (7.78) 2P29 A mother held 23 20.48 (5.46) 2P06 Cam was a clam 25 15.92 (7.88) 2P30 This is a tale 25 17.40 (6.02) 2P22 My teacher says 25 15.88 (5.88) 2P31 Today is the animal 25 19.16 (5.47) 2P26 Can animals really 28 14.79 (5.10) 2P32 Tom and his family 22 20.91 (7.98) 2P21 My little sister Emma 25 13.96 (7.97) 2P33 Where is your fort 25 16.12 (5.85) 2P17 Joey liked to 26 13.58 (7.67) Grand Mean (SD) 676 18.08 (6.74) Grand Mean (SD) 676 18.08 (6.74) Note: ** indicates passages retained for Phase Two.
The means, standard deviations, and final results of rank-ordering DORF passages by their respective
WCPM grand means are found in Table 6.

39
Table 6. Numerical and Rank Ordering of DIBELS Oral Reading Fluency Probes following Passage Equating
Numerical Order Rank Order
DIBELS Probe Number N Mean
WRCM (SD) DIBELS Probe Number N Mean
WRCM (SD) L2PM1 Building Happy Places
27
96.00 (28.82)
L2PM10 Bats Are Not Birds
32
116.16 (26.85)
L2PM2 Luke Makes His Move
27
106.04 (26.97)
L2PM15 Going to School
25
115.48 (24.28)
L2PM3 My Pen Pal
28
107.00 (35.38)
L2PM12 Writing Your Own Book
27
112.67 (25.91)
L2PM4 Life on the River
27
102.78 (25.52)
L2PM8 Dear Diary
26
112.65 (40.96)
L2PM5 A Day for Trees
32
90.44 (30.04)
L2PM11 Cooking School
32
108.75 (28.12)
L2PM6 Making Orange Juice
28
103.89 (37.08)
L2PM16 A Happy House Plant**
26
107.73 (41.05)
L2PM7 Kim Gets Ready
32
106.53 (31.67)
L2PM18 Canoe Fun**
26
107.62 (35.10)
L2PM8 Dear Diary
26
112.65 (40.96)
L2PM3 My Pen Pal**
28
107.00 (35.38)
L2PM9 Circus Tickets
25
100.88 (36.03)
L2PM7 Kim Gets Ready**
32
106.53 (31.67)
L2PM10 Bats Are Not Birds
32
116.16 (26.85)
L2PM19 African Drums**
27
106.38 (36.77)
L2PM11 Cooking School
32
108.75 (28.12)
L2PM2 Luke Makes His Move**
27
106.04 (26.97)
L2PM12 Writing Your Own Book
27
112.67 (25.91)
L2PM6 Making Orange Juice**
28
103.89 (37.08)
L2PM13 In Space for an Hour
26
103.69 (34.72)
L2PM13 In Space for an Hour**
26
103.69 (34.72)
L2PM14 Wind Power
26
98.65 (33.50)
L2PM4 Life on the River**
27
102.78 (25.52)
L2PM15 Going to School
25
115.48 (24.28)
L2PM9 Circus Tickets**
25
100.88 (36.03)
L2PM16 A Happy House Plant
26
107.73 (41.05)
L2PM14
Wind Powera
26
98.65 (33.50) L2PM17 A Gift of Chores
27
94.33 (37.16)
L2PM1 Building Happy Places
27
96.00 (28.82)
L2PM18 Canoe Fun
26
107.62 (35.10)
L2PM17 A Gift of Chores
27
94.33 (37.16)
L2PM19 African Drums
27
106.38 (36.77)
L2PM20 Flower Parts
28
93.33 (30.37)
L2PM20 Flower Parts
28
93.33 (30.37)
L2PM5 A Day for Trees
32
90.44 (30.04)
Grand Mean (SD) 554 104.55 (32.78) Grand Mean (SD) 554 104.55 (32.78) Note: ** indicates passages retained for Phase Two; aindicates a passage that was identified through rank-ordering but was then eliminated from the passage set due to having a WCPM score outside of the recommended range of the mean.
Prior to rank-ordering DORF passages, the range in mean WCPM for the 20 available DIBELS progress
monitoring passages was 25.72 (90.44 – 116.16). After initial rank-ordering and identifying the five passages
immediately above and below the grand mean, the difference in WCPM between passages in the new equivalent set
was 8.97 (98.65 - 107.62). The highest-ranked probe was within 3.07 WCPM of the grand mean, while the lowest-

40
ranked probe was within 5.9 WCPM of the grand mean. Given Poncy et al.’s (2005) recommendation that read
aloud progress monitoring passage fall within 5 WCPM of the mean of the set, the lowest-ranked probe (i.e.,
L2PM14, Wind Power) was replaced with probe L2PM16, A Happy House Plant. This probe was ranked
immediately above the fifth passage above the grand mean. This replacement adjusted the overall range of the new
passage set to 6.85 (100.88 – 107.73). Furthermore, the highest-ranked probe was now within 3.18 WCPM of the
grand mean while the lowest-ranked probe was within 3.67 WCPM of the grand mean. Given these improvements,
the six passages immediately above the grand mean and the four passages immediately below were retained for use
in Phase Two.
Finally, Table 7 shows the means, standard deviations, and rank-ordering results for DIBELS RTF
passages. DIBELS passages were equated based on DORF performance and WCPM means rather than the mean
number of words recalled on RTF tasks. As shown in Table 7, passages that were most alike in terms of WCPM
were not necessarily the most alike in terms of average number of words recalled during RTF. Potential implications
of this discrepancy are discussed in a subsequent chapter.
Table 7. Numerical and Rank Ordering of DIBELS Retell Fluency Probes following Passage Equating
Numerical Order Rank Order
DIBELS Probe Number N Mean Words
Recalled (SD) DIBELS Probe Number N Mean Words
Recalled (SD) L2PM1 Building Happy Places
27 40.30 (22.79)
L2PM11 Cooking School 32 58.19 (26.30)
L2PM2 Luke Makes His Move
27 52.56 (23.47)
L2PM2 Luke Makes His Move** 27 52.56 (23.47)
L2PM3 My Pen Pal
28 32.21 (18.59)
L2PM8 Dear Diary 26 52.46 (25.17)
L2PM4 Life on the River
27 37.85 (18.42)
L2PM9 Circus Tickets** 25 48.00 (21.70)
L2PM5 A Day for Trees
32 34.63 (16.76)
L2PM7 Kim Gets Ready** 32 45.41 (24.84)
L2PM6 Making Orange Juice
28 32.43 (17.59)
L2PM10 Bats Are Not Birds 32 44.72 (21.63)
L2PM7 Kim Gets Ready
32 45.41 (24.84)
L2PM13 In Space for an Hour** 26 43.38 (17.81)
L2PM8 Dear Diary
26 52.46 (25.17)
L2PM18 Canoe Fun** 26 42.54 (21.33)
L2PM9 Circus Tickets
25 48.00 (21.70)
L2PM12 Writing Your Own Book 27 41.96 (23.94)
L2PM10 Bats Are Not Birds
32 44.72 (21.63)
L2PM15 Going to School 25 41.44 (20.06)
L2PM11 Cooking School
32 58.19 (26.30)
L2PM17 A Gift of Chores 27 40.96 (23.53)
L2PM12 Writing Your Own Book
27 41.96 (23.94)
L2PM1 Building Happy Places 27 40.30 (22.79)

41
(Table 7 continued)
Numerical Order Rank Order
DIBELS Probe Number N Mean Words
Recalled (SD) DIBELS Probe Number N Mean Words
Recalled (SD) L2PM13 In Space for an Hour
26 43.38 (17.81)
L2PM16 A Happy House Plant** 26
39.81 (22.23)
L2PM14 Wind Power
26 27.04 (21.89)
L2PM4 Life on the River** 27 37.85 (18.42)
L2PM15 Going to School
25 41.44 (20.06)
L2PM5 A Day for Trees 32 34.63 (16.76)
L2PM16 A Happy House Plant
26 39.81 (22.23)
L2PM20 Flower Parts 28 33.48 (18.08)
L2PM17 A Gift of Chores
27 40.96 (23.53)
L2PM6 Making Orange Juice** 28 32.43 (17.59)
L2PM18 Canoe Fun
26 42.54 (21.33)
L2PM3 My Pen Pal** 28 32.21 (18.59)
L2PM19 African Drums
27 31.85 (18.90)
L2PM19 African Drums** 27 31.85 (18.90)
L2PM20 Flower Parts
28 33.48 (18.08)
L2PM14 Wind Powera 26 27.04 (21.89)
Grand Mean (SD) 554 41.19 (22.50) Grand Mean (SD) 554 41.19 (22.50) Note: ** indicates passages retained for Phase Two; aindicates a passage that was identified through rank-ordering but was then eliminated from the passage set due to having a WCPM score outside of the recommended range of the mean. Phase Two: Progress Monitoring
Descriptive statistics for the student performance on the three different probe types may be found in Table
8. These data reflect the final number of occasions included in analyses for each probe type following removal of
outliers, as well as the minimum and maximum scores achieved on each probe type.
Table 8. Descriptive Statistics for Growth Models Variable N Mean SD Minimum Maximum R-Maze 255 10.96 5.02 1 25 DORF 255 68.03 23.37 15 125 RTF 253 32.22 16.28 0 78 FRL 32 0.47 0.50 0 1 SPED 32 0.38 0.49 0 1 Note: FRL = Free/Reduced Lunch Status; SPED = Special Education Status
Bivariate correlations for predictors included in growth models are found in Table 9. These correlations for
each probe type indicate CBM scores aggregated across all occasions. All CBM probe types were positively
correlated with each other, with DORF and R-Maze showing the strongest relationship (r = .58, p < .01).
Furthermore, all CBM probe types were negatively correlated with both free/reduced lunch status and special
education status, indicating that students who were eligible for free/reduced lunch or received special education

42
services scored lower on these measures compared to their counterparts who were not eligible for free/reduced lunch
or did not receive special education services.
Table 9. Bivariate Correlations Between Predictors for Growth Model R-Maze DORF RTF FRL SPED DORF .58** 1 .35** -.61** -.35** RTF .23** .35** 1 -.25** -.44** FRL -.39** -.61** -.25** 1 .10 SPED -.31** -.35** -.44** .10 1 Note: FRL = Free/Reduced Lunch Status; SPED = Special Education Status ** p < .01
Growth models. In order to evaluate student growth, separate hierarchical linear growth models were built
for each individual CBM probe type. Model building progressed in the sequence described above. Each model
included two levels, in which measurement occasions (i.e., time) at level-1 were nested within individual students at
level-2. The contributions of student socioeconomic status, as indicated by eligibility for free or reduced lunch, and
student special education status were also evaluated by including these variables as predictors at level-2.
R-Maze growth. R-Maze was entered as an outcome variable for the unconditional means model. Results
of this model (Table 10) indicated a significant coefficient of 10.96 (p < .001), indicating that the grand mean of R-
Maze scores across all occasions and all students was different than zero. Furthermore, results for the random effects
portion in this model indicate that R-Maze scores vary significantly across students (χ2 =326.20, df = 31, p < .001).
Finally, this model resulted in an intra-class correlation (ICC) of 0.548, indicating that 54.8% of the variance in R-
Maze scores can be attributed to differences between students.
Table 10. Results of the Unconditional Means Model: AIMSweb R-Maze Fixed Effect Coefficient se t-Ratio Approx. df p-value Mean initial status, β00
10.96 0.70 15.75 31 < .001
Random Effect Variance
Component sd χ2 df p-value Initial status, r0 14.03 3.75 326.20 31 < .001 Level-1 error, e 11.56 3.50
The unconditional growth model (Table 11) was specified next by adding time (i.e., the “occasion”
variable) to the unconditional means model as a random effect. Results of this model estimate an average R-Maze
score of 8.58 correct selections on the first occasion of data collection and that scores increased, on average, 0.68
correct selections at each subsequent measurement occasion during the study (p < .001). Furthermore, results of
random effects show a significant intercept (χ2 = 154.31, df = 31, p < .001) and slope (χ2 = 47.76, df = 31, p < .05),

43
indicating that students vary significantly on their R-Maze scores at the beginning of the study, and that there was
significant variation in their growth rates over the course of the study. These results support the inclusion of time as
a random, rather than fixed, effect in the model. The proportional reduction in residual variance from the
unconditional means model to the unconditional growth model was calculated using the following formula:
Pseudo R2 = σ2 (unconditional means model) – σ2 (unconditional growth model) σ2 (unconditional means model)
Results indicate pseudo R2 = .294, suggesting that 29.4% of the within-person variation in R-Maze scores can be
explained by time. Furthermore, the deviance in this model was reduced by 63.72, which significantly improved
model fit (χ2 = 63.72, df = 2, p < .001).
Table 11. Results of the Unconditional Growth Model: AIMSweb R-Maze Fixed Effect Coefficient se t-Ratio Approx. df p-value
Mean initial status, β00 8.58 0.73 11.80 31 < .001
Mean growth rate, β10 0.68 0.10 7.02 31 < .001
Random Effect Variance
Component sd χ2 df p-value Initial status, r0i 13.53 3.68 154.31 31 < .001 Growth rate, r1i 0.11 0.33 47.76 31 0.03 Level-1 error, eti 8.16 2.86
Finally, student-level variables (i.e., FRL and SPED) were added to the unconditional growth model as
level-2 predictors for the initial status and rate of change of R-Maze scores. Table 12 shows results of this model.
Estimation of the fixed effects of the model indicate that both FRL status and SPED status were significantly related
to R-Maze performance. Specifically, students who were eligible for FRL scored, on average, 4.03 selections lower
on their first R-Maze than students who were not eligible for FRL (p < .001) and students who received SPED
services scored, on average, 4.05 selections lower on their first R-Maze than students who did not receive SPED
services (p < .001). Furthermore, slope estimates for fixed effects indicate that individual students’ growth rates did
not differ significantly based on their FRL (p = 0.63) or SPED (p = 0.08) status. Random effect estimates indicated
that there is still residual level-1 variance that could be explained, although such predictors were not measured in
this study. Further model specification may also help explain remaining variance in students’ initial status. Finally,
the addition of FRL and SPED explained less than 1% more variance than the unconditional growth model.

44
Table 12. Results of the Conditional Model: AIMSweb R-Maze Fixed Effect Coefficient se t-Ratio Approx. df p-value
Model for initial status, π0i
Mean initial status, β00 11.86 0.78 15.19 29 < .001 FRL, β01 -4.03 1.05 -3.82 29 < .001 SPED, β02 -4.05 1.08 -3.76 29 < .001
Model for growth rate, π1i
Mean growth rate, β10 0.51 0.14 3.58 29 .001
FRL, β10 0.09 0.19 0.48 29 .63
SPED, β10 .35 .20 1.79 29 .08
Random Effect
Variance
Component sd χ2 df p-value
Initial status, r0i 5.24 2.29 73.55 29 < .001
Growth rate, r1i 0.09 0.30 42.48 29 .05
Level-1 error, eti 8.16 2.86 Note: FRL = Free/Reduced Lunch Status; SPED = Special Education Status
DORF growth. Model building for DORF proceeded in much the same way as R-Maze. First, DORF was
entered as an outcome variable for the unconditional means model. Results of this model (Table 13) indicated initial
status of DORF performance at 68.03 WCPM. Like R-Maze, the intercept for DORF was significant (p < .001),
indicating that the grand mean of DORF scores across all occasions and all students is different than zero. The
random effects estimates of this model showed that DORF scores varied significantly across students (χ2 = 1238.53,
df = 31, p < .001). Finally, the unconditional means model for DORF resulted in an ICC of 0.832, indicating that
83.2% of the variance in DORF scores can be attributed to differences between students.
Table 13. Results of the Unconditional Means Model: DIBELS Oral Reading Fluency (DORF) Fixed Effect Coefficient se t-Ratio Approx. df p-value Mean initial status, β00
68.03 3.87 17.59 31 < .001
Random Effect Variance
Component sd χ2 df p-value Initial status, r0 467.04 21.61 1238.53 31 < .001 Level-1 error, e 94.09 9.70
The DORF unconditional growth model (Table 14) was specified next and again added time to the
unconditional means model as a random effect. Results of this model revealed a significant intercept and estimate an
initial DORF score of 67.45 WCPM (p < .001); however, fixed effect slope estimates for DORF were non-

45
significant (b = 0.17, p = 0.47) indicating that, on average, DORF scores did not show a significant rate of change
over the course of the study. Results of random effects show a significant intercept (χ2 = 373.52, df = 31, p < .001),
again indicating that individual student DORF scores vary significantly at the first measurement occasion. Random
effects estimates of slope were non-significant (χ2 = 41.25, df = 31, p > .05), indicating that there were not
significant individual differences in students’ growth rates on the DORF probes. The proportional reduction in
residual variance from the unconditional means model to the unconditional growth model showed that just 4.2% of
the within-person variation in DORF scores can be explained by time. Deviance from the unconditional means to
unconditional growth models reduced by just 4.21 after adding time as a random effect and was not a significant
improvement in model fit (χ2 = 4.21, df = 2, p > .05).
Table 14. Results of the Unconditional Growth Model: DIBELS Oral Reading Fluency (DORF) Fixed Effect Coefficient se t-Ratio Approx. df p-value
Mean initial status, β00 67.45 3.77 17.90 31 < .001
Mean growth rate, β10 0.17 0.30 0.56 31 0.58
Random Effect Variance
Component sd χ2 df p-value Initial status, r0i 416.90 20.42 373.52 31 < .001 Growth rate, r1i 0.71 0.84 41.25 31 .10 Level-1 error, eti 90.19 9.50
Again, student-level predictors were entered at level-2 in an attempt to explain additional variance. Given
that the unconditional growth model indicated that slopes for DORF scores did not vary significantly over the course
of the study, the purpose of including student-level variables in this model was to assess whether their relationships
with students’ initial DORF scores. Student eligibility for FRL and student SPED status were entered
simultaneously as fixed effects. Results of this model may be found in Table 15. Estimation of the fixed effects of
the model indicate that students’ FRL status was significantly related to their initial DORF performance.
Specifically, students who qualify for FRL scored an average of 28.53 WCPM below students who do not qualify
for FRL on their first DORF probe (p < .001). Students who received SPED services initially scored an average of
12.46 WCPM below students who did not receive SPED services (p < .05). As expected, slope estimates for all
variables were non-significant. Examination of random effects indicates that, like R-Maze, there is still residual
level-1 variance in DORF scores that could be explained, although additional potential predictors of interest were

46
not measured in this study. Finally, the addition of FRL and SPED explained 4.2% more variance in DORF scores
than the unconditional growth model.
Table 15. Results of the Conditional Model: DIBELS Oral Reading Fluency (DORF) Fixed Effect Coefficient se t-Ratio Approx. df p-value
Model for initial status, π0i
Mean initial status, β00 84.60 3.81 22.18 29 < .001 FRL, β01 -28.53 5.14 -5.55 29 < .001 SPED, β02 -12.46 5.27 -2.36 29 .03
Model for growth rate, π1i
Mean growth rate, β10 0.25 0.46 0.55 29 .58
FRL, β10 0.28 0.62 0.45 29 .66
SPED, β10 -0.55 0.63 -0.87 29 .39
Random Effect
Variance
Component sd χ2 df p-value
Initial status, r0i 168.74 12.99 159.09 29 < .001
Growth rate, r1i 0.80 0.89 40.00 29 .08
Level-1 error, eti 90.25 9.50 Note: FRL = Free/Reduced Lunch Status; SPED = Special Education Status
RTF growth. Like R-Maze and DORF, RTF was entered as an outcome variable for the unconditional
means model. Results of this model (Table 16) showed a significant mean initial status (b = 32.22, p < .001),
allowing us to reject the null hypothesis that the grand mean of RTF scores is not significantly different than zero.
Table 16. Results of the Unconditional Means Model: DIBELS Retell Fluency (RTF) Fixed Effect Coefficient se t-Ratio Approx. df p-value Mean initial status, β00
32.22 2.30 14.02 31 < .001
Random Effect Variance
Component sd χ2 df p-value Initial status, r0 156.12 12.49 401.52 31 < .001 Level-1 error, e 97.03 9.85
Estimates of the variance components for this model suggest that RTF scores vary significantly across
students (χ2 = 401.52, df = 31, p < .001). An ICC of 0.617 was calculated for the model, indicating that 61.7% of the
variance in RTF scores can be attributed to differences between students.
The unconditional growth model (Table 17) for RTF was specified next, again by adding time to the empty
model as a random effect. Fixed effects estimates revealed a similar pattern as those for the unconditional growth

47
model for DORF. Specifically, results showed a significant initial status coefficient of 33.27 words recalled (p <
.001) but did not indicate a significant fixed effect slope estimate for RTF (p = 0.70), indicating that mean RTF
scores did not vary significantly over the course of the study. An examination of the variance components for this
model indicates a significant intercept (χ2 = 129.98, df = 31, p < .001), and a non-significant slope (χ2 = 40.62, df =
31, p > .05). Together, these results suggest that there were individual differences in student RTF performance at the
beginning of the study, but that there were not significant differences in individual growth over time. The
proportional reduction in residual variance from the unconditional means model to the unconditional growth model
was .033, indicating that just 3.3% of the variation in RTF scores in this study can be explained by time; however,
deviance from the unconditional means to unconditional growth models was significantly reduced (χ2 = 18.35, df =
2, p < .001), indicating that adding time as a random effect improved model fit.
Table 17. Results of the Unconditional Growth Model: DIBELS Retell Fluency (RTF) Fixed Effect Coefficient se t-Ratio Approx. df p-value
Mean initial status, β00 33.27 2.31 14.36 31 < .001
Mean growth rate, β10 -0.31 0.31 -1.01 31 .32
Random Effect Variance
Component sd χ2 df p-value Initial status, r0i 130.68 11.43 129.98 31 < .001 Growth rate, r1i 0.67 0.82 40.62 31 .12 Level-1 error, eti 93.81 9.69
Finally, student-level predictors were entered at level-2 in an attempt to explain additional variance. Once
again, student eligibility for FRL and student SPED status were entered simultaneously as fixed effects in an effort
to explain individual differences in initial RTF scores. Results of this model may be found in Table 18. Estimation
of the fixed effects of the model indicate that students who qualify for FRL did not differ significantly from students
who did not qualify for FRL, either in terms of their initial RTF score (p = 0.27) or in terms of their RTF growth
over the course of the study (p = 0.40). Students who received SPED services scored an average of 13.72 recalled
words lower than their non-SPED counterparts on their first RTF probe (p < 0.01), but did not differ significantly
from non-SPED students in their RTF growth rates (p = 0.56). Random effect estimates indicated similar results as
those for other CBM probe types in that there is still residual level-1 variance that could be explained. Lastly, adding
level-2 predictors resulted in less than a 1% reduction in residual variance.

48
Table 18. Results of the Conditional Model: DIBELS Retell Fluency (RTF) Fixed Effect Coefficient se t-Ratio Approx. df p-value
Model for initial status, π0i
Mean initial status, β00 40.34 2.99 13.49 29 < .001 FRL, β01 -4.55 4.00 -1.14 29 .27 SPED, β02 -13.72 4.09 -3.35 29 .002
Model for growth rate, π1i
Mean growth rate, β10 0.10 0.49 0.20 29 .85
FRL, β10 -0.55 0.64 -0.86 29 .40
SPED, β10 -0.39 0.65 -0.60 29 .56
Random Effect
Variance
Component sd χ2 df p-value
Initial status, r0i 84.05 9.17 87.83 29 < .001
Growth rate, r1i 0.84 0.92 39.55 29 .09
Level-1 error, eti 93.55 9.67 Note: FRL = Free/Reduced Lunch Status; SPED = Special Education Status
Predicting comprehension. Descriptive statistics for the prediction model may be found in Table 19.
These data reflect average scores across all 32 students included in the study based on the CBM score obtained
during the first occasion of data collection.
Table 19. Descriptive Statistics for Prediction Model Variable N Mean SD Minimum Maximum RCOMP 32 473.97 9.62 456 492 Initial R-Maze 32 7.88 4.58 2 17 Initial DORF 32 70.63 22.18 32 112 Initial RTF 32 33.59 13.04 5 65 Note: RCOMP = Reading Comprehension Score; “Initial” refers to score at first measurement occasion
Bivariate correlations between variable used to predict reading comprehension are detailed in Table 20.
These correlations indicated the relationship between variables based on CBM scores from the first occasion of data
collection. Like correlations found above in Table 9, R-Maze scores were correlated with both DORF and RTF, and
its relationship with DORF was the strongest (r = .78, p < .01). Unlike the correlations using aggregated scores
across all occasions, initial DORF and RTF scores were not significantly related. Furthermore, only R-Maze showed
significant negative relationships with both free/reduced lunch status and special education status. For R-Maze,

49
students who were eligible for free/reduced lunch or receiving special education services tended to score lower on
these tasks. For DORF, students who were eligible for free/reduced lunch tended to read fewer words correct per
minute, while the relationship between DORF and special education status was non-significant. Finally, students
who received special education services tended to recall fewer words on RTF tasks compared to their counterparts
who did not receive these services. There was not a significant relationship between RTF and free/reduced lunch
status.
Table 20. Bivariate Correlations Between Predictors for Prediction Model R-Maze DORF RTF FRL SPED DORF .78** 1 .10 -.64** -.34 RTF .38* .10 1 -.12 -.51** FRL -.54** -.64** -.12 1 .10 SPED -.54** -.34 -.51** .10 1 Note: FRL = Free/Reduced Lunch Status; SPED = Special Education Status * p < .05; ** p < .01
Finally, Table 21 shows the bivariate correlations between students’ initial scores on the different CBM
probe types and scores on individual WJ-IV reading comprehension subtests, as well as the reading comprehension
composite score. Students’ initial R-Maze and DORF were significantly related to their scores on the Passage
Comprehension and Reading Vocabulary subtests, as well as their composite Reading Comprehension score. Neither
R-Maze nor DORF were significantly related to Reading Recall subtests. Initial RTF scores were significantly
related to Reading Vocabulary and composite Reading Comprehension scores. All significant correlations indicated
positive relationships, suggesting that as students’ scores on the different CBM measures increased, their scores on
the WJ-IV subtests also increased. The only WJ-IV subtest which was not related to any CBM probe type was the
Passage Comprehension subtest.
Table 21. Bivariate Correlations Between CBM Measures and WJ-IV Reading Comprehension Subtests R-Maze DORF RTF PCOMP RECALL VOCAB RCOMP DORF .78** 1 .10 .73** .21 .64** .68** RTF .38* .10 1 .28 .29 .51** .45* PCOMP .83** .73** .28 1 .36** .71** .89** RECALL .34 .21 .29 .36* 1 .06 .65** VOCAB .77** .64** .51** .71** .34 1 .87** RCOMP .83** .68** .45* .89** .65** .87** 1 Note: PCOMP = Passage Comprehension; RECALL = Reading Recall; VOCAB = Reading Vocabulary; RCOMP = Total Reading Comprehension Score * p < .05; ** p < .01
In order to address the second research question as to which CBM type was the best predictor of reading
comprehension, a 2-level unconditional model was constructed using RCOMP, or the total reading comprehension

50
score on the WJ-IV Reading Comprehension – Extended cluster (McGrew et al., 2014) as an outcome variable.
Results of this model (Table 22) showed a significant fixed effect coefficient of 473.52 (p < .001), indicating that the
grand mean of RCOMP scores is significantly different than zero. Estimates of the variance components for this
model suggest were non-significant (χ2 = 38.35, df = 31, p = 0.17). This finding indicates that RCOMP scores did
not vary significantly by school; however, remaining variance at level-1 suggests that the addition of additional
time-varying predictors (i.e., CBM scores) could potentially explain more variance.
Table 22. Results of the Unconditional Model: Predicting Reading Comprehension Fixed Effect Coefficient se t-Ratio Approx. df p-value Mean initial status, γ00
473.52 1.69 279.58 30 < .001
Random Effect Variance
Component sd χ2 df p-value Initial status, u0 17.04 4.13 37.11 30 .17 Level-1 error, r 71.88 8.47
As a result, students’ initial scores for R-Maze, DORF, and RTF were entered simultaneously at level-1 as
fixed predictors. Results of this model can be found in Table 23, and showed that R-Maze was the only significant
predictor of reading comprehension, (b = 1.23, p < .01). Furthermore, comparison of the unconditional and
conditional models resulted in Pseudo R2 = .660, indicating a 66% reduction in level-1 variance after adding CBM
scores as predictors.
Table 23. Results of the Conditional Model: Predicting Reading Comprehension Fixed Effect Coefficient se t-Ratio Approx. df p-value
Mean initial status, γ00 453.48 4.74 95.66 30 < .001 R-Maze, γ10 1.23 0.40 3.09 28 .004 DORF, γ20 0.08 0.08 1.04 28 .31 RTF, γ30 0.15 0.09 1.75 28 .09
Random Effect Variance
Component sd χ2 df p-value
Initial status, u0 5.14 2.27 32.68 30 .34
Level-1 error, ri 24.46 4.95

51
DISCUSSION
The purpose of the current study was to identify two sets of equivalent reading CBM passage sets, and then
compare their utility in monitoring reading growth and predicting reading comprehension in second-grade students.
Field-testing and rank-ordering procedures were used to equate passages in an effort to reduce measurement error.
Hierarchical linear modeling was employed to determine how well each probe type (i.e., DORF, Retell, and R-
Maze) measured growth over the course of the study, as well as determine which probe type best predicted student
performance on the WJ-IV Reading Comprehension – Extended cluster (McGrew et al., 2014). These procedures
were carried out in an effort to answer two primary research questions. A discussion of each research question
follows, as well as discussion of the research and practical implications of the findings from the current study.
1. After equating passages, which CBM probe type (i.e., R-Maze, DORF, or RTF) is the most
sensitive to reading growth in second graders over eight weeks? Additionally, does growth differ
depending on certain student characteristics (i.e., free/reduced lunch status or special education
services)?
Results of HLM analysis showed that R-Maze was the only CBM probe type that indicated significant rates
of change for individual students over the course of the study. These results concur with that of Shin et al. (2000),
who found that Maze is sensitive in measuring reading growth in second-grade students. One possible threat to the
validity of these results is that the students in the study were unfamiliar with Maze tasks prior to participating. As
such, it is possible that the growth estimates found in this study were confounded by students scoring higher on the
task as they became more familiar with the structure of the probes and the requirements of the task. Furthermore,
student FRL or SPED status did not influence growth rates on R-Maze. This finding is somewhat surprising,
particularly for SPED. Previous research (Christ et al., 2010 Shin et al., 2000) has indicated that students receiving
SPED services typically show a slower growth rate on reading CBM measures than their peers who do not receive
SPED services. A potential explanation for this finding is that SPED services were not specified in this study, and
that findings would closer resemble those of other studies if students who had a reading disability and were
receiving reading services were differentiated from those who received other services, such as behavioral
interventions or speech/language services as part of their special education plan.
The finding that DORF was not an indicator of student growth is somewhat surprising, although it agrees
with the Ardoin et al (2013) review indicating that there is not sufficient evidence to promote the use of read aloud

52
as a progress monitoring tool. While DORF has been shown to be indicative of student reading growth over the
course of the year, it is possible that it is less sensitive to short-term changes like those in the current study. It is also
possible that field-testing and rank-ordering efforts did not result in sufficient passage equivalence, and that
measurement error contributed to these results. Indeed, this explanation is plausible given that Cummings et al.
(2014) found that, even after DIBELS Next (Good & Kaminski, 2011) passages were field-tested, significant form
effects were still observed.
Additional factors such as familiarity with passages and timing of data collection could also explain some
of the results found for DORF. Specifically, unlike R-Maze, DORF was a familiar task for all students included in
the study. This may have affected individual students’ motivation to perform on these tasks. Indeed, one student was
observed to say during the study, “I’ve read this story before, it’s boring.” While not an empirical finding, this
anecdotal evidence suggests that there may be other factors contributing to observed DORF/RTF scores. Moreover,
this study was conducted in the spring, and previous studies have found that second-graders’ growth curves in
reading fluency have largely stabilized by the end of the year (Kim, Petscher, Schatschneider, & Foorman, 2010).
Also, lack of growth may be due to a seasonal effect, given Christ et al.’s (2010) finding that student growth rates on
read aloud measures slowed during winter-to-spring compared to fall-to-winter.
Finally, the finding that RTF was not an indicator of growth was expected, and agrees with previous
research that RTF does not seem to be an adequate progress monitoring tool. It seems that, while RTF boasts face
validity as an indicator of student comprehension and bears similarity to standardized comprehension tasks,
variability in both performance and scoring challenge these perceived benefits. Like DORF, it is also possible that
passage equivalency efforts were not sufficient, and that variability in probe difficulty also contributed to the non-
significant growth findings.
2. Which CBM probe type (i.e., R-Maze, DORF, or RTF) is the best predictor of reading
comprehension?
Results of the HLM model used to evaluate the predictive abilities of the different CBM probe types
indicated that students’ initial R-Maze score had the strongest relationship with the reading comprehension outcome
measure. This finding was surprising, and did not support the hypothesis that DORF initial status would be the
strongest predictor. Indeed, the correlation between R-Maze and reading comprehension was much higher than
expected (r = .83). Although DORF still showed a strong relationship with reading comprehension (r = .68), this

53
relationship was not a significant predictor in consideration of R-Maze. Moreover, given the wealth of evidence
showing DORF as a predictor of reading comprehension, this finding becomes more complicated to interpret. One
possible interpretation is that many of the studies showing DORF as a good indicator of reading comprehension used
criterion measures other than the Woodcock Johnson, and, more specifically, the WJ-IV Reading Comprehension –
Extended cluster (McGrew et al., 2014). This possible explanation comes in light of the reported variability between
reading comprehension assessments and which specific skills they measure (Keenan et al., 2008); however, it is
nonetheless surprising. In contrast, the finding that RTF did was not as surprising. Although RTF showed a
moderate correlation (r = .45) with the comprehension measure, it was not shown to be a significant predictor in
consideration of all three probe types used in the study. Combined with findings that RTF was not sensitive to
student reading growth, these results add to the existing literature base that question the utility of RTF measures
within an RTI framework.
Overall, study results indicated that R-Maze was sensitive to reading growth in at-risk second-graders and
was a strong predictor of their performance on a reading comprehension criterion measure. General findings from
this study contradict some previous findings regarding the utility of read aloud measures within an RTI framework.
Based on the results of this study, it appears that R-Maze could be a useful addition to early screening efforts, and
that it may have utility as a progress monitoring tool.
Limitations
Despite the significance of certain findings in this study, there are a number of limitations that are
important to address. In particular, these limitations affect the generalization of the results of this study to other
populations and measures.
Firstly, participants in the study were limited to second-grade students from a single school district in
central Nebraska. The sample also lacked diversity, as the majority of the participants were Caucasian. Other sample
characteristics limit the generalizability of results and warrant a note of caution regarding the interpretation of
certain results; namely, the limited sample sizes during each phase. Despite having 75 students in Phase One, only
22-32 samples of each individual passage of the available progress monitoring pools were gathered. Gathering
additional samples of each probe during field-testing would serve to improve the power of the mean scores for each
probe and should result in better passage equivalence. During Phase Two, only 32 students participated.
Furthermore, these students came from just four schools. When using HLM, sample size at each level is an

54
important consideration, and a small sample size at higher levels affects power at lower levels. Although a specific
power estimate was not calculated for this study, it is likely underpowered, which affects interpretation of the
findings.
In a typical RTI model, progress monitoring is typically employed to track the growth of students receiving
an intervention. The current study did not employ an intervention component, and students who were receiving
interventions or reading resource instruction were doing so independently of the current study. Future studies could
replicate the current study with the addition of an intervention component. Concurrent implementation of an
evidence-based reading intervention could help make comparisons between expected growth for students in
intervention vs. control conditions.
The current study used second-graders as student participants. It is less common for schools to employ the
use of Maze tasks for reading progress monitoring at this grade level, which was evident in participants’ initial
unfamiliarity with the task. Indeed, results of this study indicate that certain design elements of R-Maze seem to
have detracted from its efficient completion. This difficulty was apparent in the study when poorer readers needed
multiple demonstrations of task completion prior to Maze administration, as well as the necessity to use amended
scoring procedures to correct for a concern of pro-rated scores that were the results of a high error rate. It was also
evident in students’ lower scores, which were a combination of lower fluency and higher error rates. These concerns
complicate interpretation of the findings of the study.
Another limitation included a wide range of IOA for RTF measures. Despite training and practice sessions,
IOA on RTF scoring was as low as 33% during Phase Two. A higher rate of passages was evaluated for IOA once
this concern became apparent; however, there is still a possibility that RTF scores reported in the study are less
accurate than scores for other probes.
Future Directions
Given that reading comprehension becomes a critical component in upper elementary grades, it would be
relevant to replicate this study with students at or above fourth grade. Use of an older sample may help reduce some
of the limitations in this study, including students having difficulty understanding the concept of the task. Use of an
older population would also be warranted given that relationships between reading CBM and reading
comprehension seem to shift as students enter upper elementary school.

55
The current study could also be replicated with more sound passage equivalency efforts, including using a
larger sample for establishing mean performance rates and using Euclidean Distance to equate passages. These
procedures would be especially helpful for R-Maze passages, as most efforts have been directed toward read aloud
up to this point. Specifically, ranges for WCPM scores exist for determining equivalent reading passage sets, but no
such criteria exist for R-Maze correct selections.
Furthermore, form effects and measurement error in CBM could be expanded to skills outside of reading,
such as early numeracy and mathematics to see if there is inherent variability in different passages.

56
REFERENCES
Ardoin, S.P. & Christ, T.J. (2009). Curriculum-based measurement of oral reading: Standard errors associated with progress monitoring outcomes from DIBELS, AIMSweb, and an experimental passage set. School Psychology Review, 38, 266-283.
Ardoin, S.P., Christ, T.J., Morena, L.S., Cormier, D.C., & Klingbeil, D.A. (2013). A systematic review and
summarization of the recommendations and research surrounding curriculum-based measurement of oral reading fluency (CBM-R) decision rules. Journal of School Psychology, 51, 1-18. doi: 10.1016/j.jsp.2012.09.004.
Ardoin, S.P., Suldo, S.M., Witt, J., Aldrich, S., & McDonald, E. (2005). Accuracy of readability estimates’
predictions of CBM performance. School Psychology Quarterly, 20, 1-22. doi:10.1521/scpq.20.1.1.64193. Ardoin, S.P., Witt, J.C., Suldo, S.M., Connell, J.E., Koenig, J.L., Resetar, J.L., … & Williams, K.L. (2004).
Examining the incremental benefits of administering a maze and three versus one curriculum-based measurement reading probes when conducting universal screening. School Psychology Review, 33, 218-233.
Arnold, E.M., Goldston, D.B., Walsh, A.K., Reboussin, B.A., Daniel, S.S., Hickman, E., & Wood, F.B. (2005).
Severity of emotional and behavioral problems among poor and typical readers. Journal of Abnormal Child Psychology, 33, 205-217. doi: 10.1007/s10802-005-1828-9.
Ball, C.R. & Christ, T.J. (2012). Supporting valid decision making: Uses and misuse of assessment data within the
context of RTI. Psychology in the Schools, 49, 231-243. doi: 10.1002/pits.21592. Begeny, J.C. & Greene, D.J. (2014). Can readability formulas be used to successfully gauge difficulty of reading
materials? Psychology in the Schools, 51, 198-215. doi: 10.1002/pits.21740. Bellinger, J.M., & DiPerna, J.C. (2011). Is fluency-based story retell a good indicator of reading comprehension?
Psychology in the Schools, 48, 416-426. doi: 10.1002/pits.20563. Berninger, V.W., Abbott, R.D., Vermeulen, K., & Fulton, C.M. (2006). Paths to reading comprehension in at-risk
second-grade readers. Journal of Learning Disabilities, 39, 334-351. Betts, J., Pickart, M., & Heistad, D. (2009). An investigation of the psychometric evidence of CBM-R passage
equivalence: Utility of readability statistics and equating for alternate forms. Journal of School Psychology, 47, 1-17. doi: 10.1016/j.jsp.2008.09.001.
Bryk, A.S. & Raudenbush, S.W. (1987). Application of hierarchical linear models to assessing change.
Psychological Bulletin, 101, 147-158. doi:10.1037/0033-2909.101.1.147. Busch, T.W. & Reschly, A.L. (2007). Progress monitoring in reading. Assessment for Effective Intervention, 32,
223-230. doi:10.1177/15345084070320040401. Cain, K., & Oakhill, J. (2006). Assessment matters: Issues in the measurement of reading comprehension. British
Journal of Educational Psychology, 76, 697-708. Catts, H.W., Herrera, S., Nielsen, D. C., Bridges, M. S. (2015). Early prediction of reading comprehension within
the simple view framework. Reading and Writing, 28, 1407-1425. doi: 10.1007/s11145-015-9756-x. Chall, J.S. & Jacobs, V.A. (2003). The classic study on poor children’s fourth-grade slump. American Educator, 2,
14-15. Christ, T.J. & Ardoin, S.P. (2009). Curriculum-based measurement of oral reading: Passage equivalence and probe-
set development. Journal of School Psychology, 47, 55-75. doi: 10.1016/j.jsp.2008.09.004.
57
Christ, T.J., Silberglitt, B., Yeo, S., & Cormier, D. (2010). Curriculum-based measurement of oral reading: An evaluation of growth rates and seasonal effects among students served in general and special education. School Psychology Review, 39, 447-462.
Cummings, K.D., Park, Y., & Bauer Schaper, H.A. (2013). Form effects on DIBELS next oral reading fluency
progress-monitoring passages. Assessment for Effective Intervention, 38, 91-104. doi: 10.1177/1534508412447010.
Daniel, S.S., Walsh, A.K., Golston, D.B., Arnold, E.M., Reboussin, B.A., & Wood, F.B. (2006). Suicidality, school
dropout, and reading problems among adolescents. Journal of Learning Disabilities, 39, 507-514. doi:10.1177/00222194060390060301.
Decker, D.M., Hixson, M.D., Shaw, A., & Johnson, G. (2014). Classification accuracy of oral reading fluency and
maze in predicting performance on large-scale reading assessments. Psychology in the Schools, 51, 625-635. doi: 10.1002/pits.21773.
Deno, S.L. (1985). Curriculum-based measurement: The emerging alternative. Exceptional Children, 52, 219-232. Deno, S.L. (2003). Developments in curriculum-based measurement. The Journal of Special Education, 37, 184-
192. doi:10.1177/00224669030370030801. Deno, S.L., Fuchs, L.S., Marston, D., & Shin, J. (2001). Using curriculum-based measurement to establish growth
standards for students with learning disabilities. School Psychology Review, 30, 507-524. Deno, S.L., Reschly, A.L., Lembke, E.S., Magnusson, D., Callender, S.A., Windram, H., & Stachel, N. (2009).
Developing a school-wide progress-monitoring system. Psychology in the Schools, 46, 44-55. doi: 10.1002/pits.20353.
Espin, C.A. & Deno, S.L. (1993). Performance in reading from content area text as an indicator of achievement.
Remedial and Special Education, 14, 47-59. doi:10.1177/074193259301400610. Espin, C., Wallace, T., Lembke, E., Campbell, H., & Long, J. (2010). Creating a progress-monitoring system in
reading for middle-school students: Tracking progress toward meeting high-stakes standards. Learning Disabilities Research & Practice, 25, 60-75. doi:10.1111/j.1540-5826.2010.00304.x.
Field, A. (2009). Discovering statistics using SPSS (3rd ed.). Thousand Oaks, CA: SAGE Publications Inc. Fletcher, J.M. & Vaughn, S. (2009). Response to intervention: Preventing and remediating academic difficulties.
Child Development Perspectives, 3, 30-37. doi:10.1111/j.1750-8606.2008.00072.x. Fuchs, L.S. (2004). The past, present, and future of curriculum-based measurement research. School Psychology
Review, 33, 188-192. Fuchs, L.S. & Fuchs D. (1992). Identifying a measure for monitoring student reading progress. School Psychology
Review, 21, 45-58. Fuchs, L.S. & Fuchs, D. (1993). Formative evaluation of academic progress: How much growth can we expect?
School Psychology Review, 22, 27-48. Germann, G. (2010). Thinking of yellow brick roads, emerald cities, and wizards. In M.R. Shinn & H.M. Walker
(Eds.)., Interventions for achievement and behavior problems in a three-tier model including RTI (pp. xiii-xxxv). Bethesda, MD: National Association of School Psychologists.
Glover, T. A., & Albers, C. A. (2007). Considerations for evaluating universal screening assessments. Journal of
School Psychology, 45, 117–135.

58
Goffreda, C.T. & DiPerna, J.C. (2010). An empirical review of psychometric evidence for the dynamic indicators of basic early literacy skills. School Psychology Review, 39, 463-483.
Good, R.H. & Kaminski, R.A. (Eds.). (2002). Dynamic indicators of basic early literacy skills (6th ed.). Eugene, OR:
Institute for the Development of Educational Achievement. Good, R.H. & Kaminski, R.A. (Eds.). (2011). DIBELS Next Assessment Manual. Eugene, OR: Dynamic
Measurement Group. Retrieved from http://dibels.org/next.html. Graney, S.B., Martinez, R.S., Missall, K.N., & Arciak, O.T. (2010). Universal screening of reading in late
elementary school: R-CBM versus CBM Maze. Remedial and Special Education, 31, 368-377. doi: 10.1177/0741932509338371.
Graney, S.B., Missall, K.N., Martinez, R.S., & Bergstrom, M. (2009). A preliminary investigation of within-year
growth patterns in reading and mathematics curriculum-based measures. Journal of School Psychology, 47, 121-142. doi: 10.1016/j.jsp.2008.12.001
Gresham, F., Reschly, D., & Shinn, M.R. (2010). RTI as a driving force in educational improvement: Research,
legal, and practice perspectives. In M.R. Shinn & H.M. Walker (Eds.)., Interventions for achievement and behavior problems in a three-tier model including RTI (pp. 47-78). Bethesda, MD: National Association of School Psychologists.
Hampton, D.D., Lembke, E.S., Lee, Y., Pappas, S., Chiong, C., & Ginsburg, H.P. (2012). Technical adequacy of
early numeracy curriculum-based progress monitoring measures for kindergarten and first-grade students. Assessment for Effective Intervention, 37, 118-126. doi: 10.1177/1534508411414151.
Hintze, J.M., & Christ, T.J. (2004). An examination of variability as a function of passage variance in CBM progress
monitoring. School Psychology Review, 33, 204-217. Hintze, J.M., Christ, T.J., & Methe, S.A. (2006). Curriculum-based assessment. Psychology in the Schools, 43, 45-
56. doi: 10.1002/pits.20128. Hintze, J.M., Shapiro, E.S., Conte, K.L., & Basile, I.M. (1997). Oral reading fluency and authentic reading material:
Criterion validity of the technical features of CBM survey-level assessment. School Psychology Review, 26, 535-553.
Hoffman, L. (2015). Longitudinal analysis: Modeling within-person fluctuation and change. New York, NY: Taylor
& Francis. Hosp, M. K. & Fuchs, L.S. (2005). Using CBM as an indicator of decoding, word reading, and comprehension: Do
the relations change with grade? School Psychology Review, 34, 9-26. Howe, K.B. & Shinn, M.M. (2002). Standard reading assessment passages (RAPs) for use in general outcome
measurement: A manual describing development and technical features. Retrieved from www.aimsweb.com.
IBM Corp. Released 2015. IBM SPSS Statistics for Windows, Version 24.0. Armonk, NY: IBM Corp. Individuals with Disabilities Education Act of 2004, 20 U.S.C. §1400 et seq, and Assistance to States for the
Education of Children with Disabilities and Preschool Grants for Children with Disabilities; Final Rule, 71 Fed. Reg. 46540 (Aug. 14, 2006).
January, S.A. & Ardoin, S.P. (2012). The impact of context and word type on students’ Maze task accuracy. School
Psychology Review, 41, 262-271.
59
Jenkins, J.R., Hudson, R.F., & Johnson, E.S. (2007). Screening for at-risk readers in a response to intervention framework. School Psychology Review, 36, 582-600.
Jenkins, J. R., & Jewell, M. (1993). Examining the validity of two measures for formative teaching: Reading aloud
and maze. Exceptional Children, 59, 421-432. Johnston, A.M., Barnes, M.A., & Desrochers, A. (2008). Reading comprehension: Developmental processes,
individual differences, and interventions. Canadian Psychology, 49, 125-132. doi: 10.1037/0708-5591.49.2.125.
Kavale, K.A., Kauffman, J.M., Bachmeir, R.J., & LeFever, G.B. (2008). Response-to-intervention: Separating the
rhetoric of self-congratulation from the reality of specific learning disability identification. Learning Disability Quarterly, 31, 135-150.
Keenan, J.M., Betjemann, R.S., & Olson, R.K. (2008). Reading comprehension tests vary in the skills they assess:
Differential dependence on decoding and oral comprehension. Scientific Studies of Reading, 12, 281-300. doi: 10.1080/10888430802132279.
Kendeou, P., Van den Broek, P., White, M.J., & Lynch, J.S. (2009). Predicting reading comprehension in early
elementary school: The independent contributions of oral language and decoding skills. Journal of Educational Psychology, 101, 765-778. doi: 10.1037/a0015956.
Kim, Y., Petscher, Y., Schatschneider, C., & Foorman, B. (2010). Does growth rate in oral reading fluency matter in
predicting reading comprehension achievement? Journal of Educational Psychology, 102, 652-667. doi: 10.1037/a0019643.
Kim, Y., Wagner, R.K., & Foster, E. (2011). Relations among oral reading fluency, silent reading fluency, and
reading comprehension: A latent variable study of first-grade readers. Scientific Studies of Reading, 15, 338-362. doi: 10.1080/10888438.2010.493964.
Marcotte, A.M. & Hintze, J.M. (2009). Incremental and predictive utility of formative assessment methods of
reading comprehension. Journal of School Psychology, 74, 315-335. doi: 10.1016/j.jsp.2009.04.003. Marston, D., Mirkin, P., & Deno, S. (1984). Curriculum-based measurement: An alternative to traditional screening,
referral, and identification. The Journal of Special Education, 18, 109-117. doi:10.1177/002246698401800204.
McGrew, K. S., LaForte, E. M., & Schrank, F. A. (2014). Technical Manual. Woodcock- Johnson IV. Rolling
Meadows, IL: Riverside. McMaster, K.L., Wayman, M.M., & Cao, M. (2006). Monitoring the reading progress of secondary-level English
learners: Technical features of oral reading and Maze tasks. Assessment for Effective Intervention, 31, 17-31. doi:10.1177/073724770603100402.
Meneghetti, C., Caretti, B., & De Beni, R. (2006). Components of reading comprehension and scholastic
achievement. Learning and Individual Differences, 16, 291-301. doi: 10.1016/j.lindif.2006.11.001. Munger, K.A. & Blachman, B.A. (2013). Taking a “simple view” of the dynamic indicators of basic early literacy
skills as a predictor of multiple measures of third-grade reading comprehension. Psychology in the Schools, 50, 722-737. doi: 10.1002/pits.21699.
Nation, K., Cocksey, J., Taylor, J.S.H., & Bishop, D.V.M. (2010). A longitudinal investigation of early reading and
language skills in children with poor reading comprehension. Journal of Child Psychology and Psychiatry, 51, 1031-1039. doi: 10.1111/j.1469-7610.2010.02254.

60
National Center for Education Statistics. (2015). The Nation’s Report Car: 2015 Mathematics and Reading. Washington, DC: Institute of Education Sciences, U.S. Department of Education. Retrieved from http://www.nationsreportcard.gov/reading_math_2015/#reading/acl?grade=4.
National Center on Intensive Intervention. (2012). Review of Progress Monitoring Tools. Website of the U.S. Office
of Special Education Programs, Progress Monitoring Technical Review Committee. Retrieved from http://www.intensiveintervention.org/chart/progress-monitoring.
National Institute of Child Health and Human Development. (2000). Report of the National Reading Panel.
Teaching children to read: An evidence-based assessment of the scientific research literature on reading and its implications for reading instruction (NIH Publication No. 00-4769). Washington, DC: U.S. Government Printing Office.
National Governors Association Center for Best Practices, Council of Chief State School Officers (2010). Common
Core State Standards: English Language Arts. National Governors Association Center for Best Practices, Council of Chief State School Officers, Washington D.C.
Olinghouse, N.G., Lambert, W., & Compton, D.L. (2006). Monitoring children with reading disabilities’ response to
phonics intervention: Are there differences between intervention aligned and general skill progress monitoring assessments? Exceptional Children, 73, 90-106.
Parker, R., Hasbrouck, J.E., & Tindal, G. (1992). The Maze as a classroom-based reading measure: Construction
methods, reliability, and validity. The Journal of Special Education, 26, 195-218. doi:10.1177/002246699202600205.
Poncy, B.C., Skinner, C.H., & Axtell, P.K. (2005). An investigation of the reliability and standard error of
measurement of words read correctly per minute using curriculum-based measurement. Journal of Psychoeducational Assessment, 23, 326-338. doi:10.1177/073428290502300403.
Raudenbush, S.W. & Bryk, A.S. (2002). Hierarchical linear models: Applications and data analysis methods (2nd
ed.). Thousand Oaks, CA: Sage. Raudenbush, S. W., Bryk, A. S., Cheong, A. S., Fai, Y. F., Congdon, R. T., & du Toit, M. (2011). HLM 7:
Hierarchical linear and nonlinear modeling. Lincolnwood, IL: Scientific Software International. Reed, D.K. (2011). A review of the psychometric properties of retell instruments. Educational Assessment, 16, 123-
144. doi: 10.1080/10627197.2011.604238. Reschly, A.L., Busch, T.W., Betts, J., Deno, S.L., & Long, J.D. (2009). Curriculum-based measurement oral reading
as an indicator of reading achievement: A meta-analysis of the correlational evidence. Journal of School Psychology, 47, 427-469. doi: 10.1016/j.jsp.2009.07.001.
Roberts, G., Good, R., Corcoran, S. (2005). Story retell: A fluency-based indicator of reading comprehension.
School Psychology Quarterly, 20, 304-317. doi:10.1521/scpq.2005.20.3.304. Salvia, J., Ysseldyke, J. E., & Bolt, S. (2007). Assessment in special and inclusive education (10th ed.). Boston,
MA: Houghton Mifflin. Shapiro, E.S. (2013). Commentary on progress-monitoring with CBM-R and decision making: Problems found and
looking for solutions. Journal of School Psychology, 51, 59-66. doi: 10.1016/j.jsp.2012.11.003. Shapiro, E.S., Hilt-Panahon, A., & Gischlar, K.L. (2010). Implementing proven research in school-based practices:
Progress monitoring within a response-to-intervention model. In M.R. Shinn & H.M. Walker (Eds.)., Interventions for achievement and behavior problems in a three-tier model including RTI (pp. 175-192). Bethesda, MD: National Association of School Psychologists.

61
Shin, J., Deno, S.L., & Espin, C. (2000). Technical adequacy of the Maze task for curriculum-based measurement of reading growth. The Journal of Special Education, 34, 164-172. doi:10.1177/002246690003400305.
Shin, J., Espin, C.A., Deno, S.L., & McConnell, S. (2004). Use of hierarchical linear modeling and curriculum-
based measurement for assessing academic growth and instructional factors for students with learning difficulties. Asia Pacific Education Review, 5, 136-148.
Shinn, M.R. (2002). Best practices in using curriculum-based measurement in a problem-solving model. In A.
Thomas & J. Grimes (Eds.). Best practices in school psychology (pp. 671-698). Bethesda, MD: National Association of School Psychologists.
Shinn, M.R. (2010). Building a scientifically based data system for progress monitoring and universal screening
across three tiers, including RTI using curriculum-based measurement. In M.R. Shinn & H.M. Walker (Eds.)., Interventions for achievement and behavior problems in a three-tier model including RTI (pp. 259-292). Bethesda, MD: National Association of School Psychologists.
Singer, J.D. & Willett, J.B. (2003). Applied longitudinal data analysis: Modeling change and event occurrence.
New York, NY: Oxford University Press. Stanovich, K.E. (1986). Matthew effects in reading: Some consequences of individual differences in the acquisition
of literacy. Reading Research Quarterly, 21, 360-407. doi:10.1598/RRQ.21.4.1. Stecker, P.M., Fuchs, L.S., & Fuchs, D. (2005). Using curriculum-based measurement to improve student
achievement: review of research. Psychology in the Schools, 42, 795-819. doi: 10.1002/pits.20113. Sugai, G., Horner, R.H., & Gresham, F. (2002). Behaviorally effective school environments. In M.R. Shinn, H.M.
Walker, & G. Stoner (Eds.). Interventions for academic and behavior problems II: Preventive and remedial approaches, (pp. 315-350). Bethesda, MD: National Association of School Psychologists.
Tilstra, J., McMaster, K., Van den Broek, P., Kendeou, P., & Rapp, D. (2009). Simple but complex: Components of
the simple view of reading across grade levels. Journal of Research in Reading, 32, 383-401. doi: 10.1111/j.1467-9817.2009.01401.x.
Tichá, R., Espin, C.E., & Wayman, M.M. (2009). Reading progress monitoring for secondary-school students:
Reliability, validity, and sensitivity to growth of reading-aloud and Maze-selection measures. Learning Disabilities Research & Practice, 24, 132-142. doi:10.1111/j.1540-5826.2009.00287.x.
Tolar, T.D., Barth, A.E., Fletcher, J.M., Francis, D.J., & Vaughn, S. (2014). Predicting reading outcomes with
progress monitoring slopes among middle grade students. Learning and Individual Differences, 30, 46-57. doi: 10.1016/j.lindif.2013.11.001.
Wanzek, J., Wexler, J., Vaughn, S., & Ciullo, S. (2010). Reading interventions for struggling readers in the upper
elementary grades: A synthesis of 20 years of research. Reading and Writing: An Interdisciplinary Journal, 23, 889-912. doi:10.1007/s11145-009-9179-5.
Wayman, M.M., Wallace, T., Wiley, H.I., Ticha, R., & Espin, C.A. (2007). Literature synthesis on curriculum-based
measurement in reading. The Journal of Special Education, 41, 85-120. doi:10.1177/00224669070410020401.
Wiley, H.I. & Deno, S.L. (2005). Oral reading and maze measures as predictors of success for English language
learners on a state standards assessment. Remedial and Special Education, 26, 207-214. doi:10.1177/07419325050260040301.
Wise, J.C., Sevcik, R.A., Morris, R.D., Lovett, M.W., Wolf, M., Kuhn, M., … & Schwanenflugel, P. (2010). The
relationship between different measures of oral reading fluency and reading comprehension in second-

62
grade students who evidence different oral reading fluency difficulties. Language, Speech, and Hearing Services in Schools, 41, 340-348.
Woltman, H., Feldstain, A., MacKay, J.C., & Rocchi, M. (2012). An introduction to hierarchical linear modeling.
Tutorials in Quantitative Methods for Psychology, 8, 52-69.

63
APPENDICES
Appendix A: A standard DIBELS Oral Reading Fluency (DORF) passage

64
Appendix B: A standard AIMSweb R-Maze passage

65
Appendix C: A standard DIBELS Retell Fluency (RTF) scoring procedure

66
Appendix D: Procedural integrity checklist for DIBELS Oral Reading Fluency (DORF)

67
Appendix E: Procedural integrity checklist for DIBELS Retell Fluency (RTF)

68
Appendix F: Procedural integrity checklist for AIMSweb R-Maze

69
Appendix G: Institutional Review Board Approval

70
VITA
Haley York is a native of rural southwest Kansas. She completed her undergraduate education at Texas
Tech University, earning her Bachelor of Arts in Psychology in December 2009. She began her graduate career at
Louisiana State University in August 2010 and received her Master of Arts in Psychology in May 2013. Haley
completed her predoctoral internship in central Nebraska as part of the Munroe-Meyer Institute’s Rural Integrated
Care program. She is currently working as a postdoctoral research associate at the University of Louisville.