AN EVALUATION OF THE HEARTBEAT AWARD … · AN EVALUATION OF THE HEARTBEAT AWARD SCHEME IN...
260
AN EVALUATION OF THE HEARTBEAT AWARD SCHEME IN LEICESTERSHIRE Thesis submitted for the degree of Doctor of Philosophy at the University of Leicester by Michelle Holdsworth BSc (Hons), SRD Department of Epidemiology and Public Health University of Leicester October 1998
Transcript of AN EVALUATION OF THE HEARTBEAT AWARD … · AN EVALUATION OF THE HEARTBEAT AWARD SCHEME IN...

AN EVALUATION OF THE HEARTBEAT AWARD SCHEME INLEICESTERSHIRE
Thesis submitted for the degree of
Doctor of Philosophy
at the University of Leicester
by
Michelle Holdsworth BSc (Hons), SRD
Department of Epidemiology and Public Health
University of Leicester
October 1998

UMI Number: U117964
All rights reserved
INFORMATION TO ALL USERS The quality of this reproduction is dependent upon the quality of the copy submitted.
In the unlikely event that the author did not send a complete manuscript and there are missing pages, these will be noted. Also, if material had to be removed,
a note will indicate the deletion.
Dissertation Publishing
UMI U117964Published by ProQuest LLC 2013. Copyright in the Dissertation held by the Author.
Microform Edition © ProQuest LLC.All rights reserved. This work is protected against
unauthorized copying under Title 17, United States Code.
ProQuest LLC 789 East Eisenhower Parkway
P.O. Box 1346 Ann Arbor, Ml 48106-1346

“Food habits, food dislikes and likes-
these are the most difficult things in the world to counteractchange”
M. Leake-Martin (1948), Everyday Dietetics, London. Pitman & Sons Ltd.

LIST OF CONTENTS
PageACKNOWLEDGEMENTS...........................................................................vn-vm
PUBLISHED MATERIAL.......................................................................... ix
LIST OF ABBREVIATIONS...................................................................... x
ABSTRACT.................................................................................................. 1
CHAPTER Is INTRODUCTION.............................................................. 21.1 The potential of caterers in improving diet............................................. 21.2 The Heartbeat Award Scheme nationally................................................ 2
1.2.1 Evolution of the scheme.............................................................. 21.2.2 Objectives of the scheme............................................................. 31.2.3 Organisation of the scheme........................................................ 41.2.4 Changes in the national organisation of the award..................... 41.2.5 New award criteria...................................................................... 4
1.3 The Heartbeat Award Scheme locally..................................................... 51.3.1 Local food and nutrition policy.................................................... 51.3.2 The organisation of the scheme................................................... 51.3.3 Changes to the scheme locally................................................... 6
1.4 The need for evaluation of the scheme.................................................... 61.5 Evaluation in health education................................................................. 7
1.5.1 Definitions of health education.................................................. 71.5.2 Definitions/purpose of evaluation.............................................. 81.5.3 Process, impact and outcome evaluation................................... 91.5.4 Qualitative and quantitative methods......................................... 10
1.6 Purpose of this study................................................................................ 11
CHAPTER 2: REVIEW OF THE LITERATURE.................................. 12Review of nutrition labelling schemes at the point-of-choice....................... 122.1 Introduction............................................................................................. 122.2 Selection of studies.................................................................................. 122.3 Health promotion goal............................................................................. 132.4 Target audience........................................................................................ 132.5 Nutrition goals......................................................................................... 132.6 Professional input.................................................................................... 152.7 Characteristics of labelling schemes........................................................ 15
2.7.1 Schemes labelling healthy food choices..................................... 152.7.2 Schemes labelling calories only ................................................. 172.7.3 Schemes labelling calories and other nutrients.......................... 17
2.8 Marketing of labelling schemes............................................................... 212.9 Monitoring of labelling schemes............................................................. 212.10 Evaluation of schemes............................................................................ 22
2.10.1 Studies measuring food uptake/purchasing patterns................ 22Schemes labelling healthy food choices....................................... 22Schemes labelling calories only.................................................... 22Schemes labelling calories and other nutrients............................. 23
2.10.2 Studies assessing changes in food availability......................... 242.10.3 Studies assessing customer response........................................ 25
II

2 .10.4 Studies assessing practitioner response ............................................. 25
Review of literature used to develop the questionnaire for the longitudinal workplace survey............................................................................................ 26
2.11 Background considerations in assessing dietary behaviour 262.12 Background to developing dietary indices................................... 282.13 Background to developing attitudinal questions......................... 292.14 Summary comments..................................................................... 30
CHAPTER 3: METHODOLOGY............................................................ 313.1 Introduction............................................................................................... 313.2 Longitudinal survey of employees.......................................................... 32
3.2.1 The dietary assessment technique chosen for this study............ 323.2.2 Developing the questionnaire..................................................... 33
First pilot........................................................................................ 33Second pilot.................................................................................. 34
3.2.3 Final questionnaire.................................................................... 363.2.4 Stage 2 questionnaire................................................................. 433.2.5 Selecting workplaces to be involved in the study....................... 443.2.6 Administering the questionnaire for the actual study................. 443.2.7 The comparison group................................................................. 453.2.8 Validity issues.............................................................................. 45
Face validity and Content validity................................................ 45Construct validity........................................................................... 45Criterion validity............................................................................ 45Reproducibility.............................................................................. 46
3.2.9 Independence o f evaluator.......................................................... 463.2.10 Data processing........................................................................ 463.2.11 Analysis o f the questionnaire.................................................... 473.2.12 Developing dietary indices....................................................... 48
Change variables............................................................................ 493.3 Audit of food provision........................................................................... 513.4 Caterers interviews................................................................................... 513.5 Survey of customers’ views in public eating places................................ 523.6 Community dietitians views of the HBA scheme................................... 54
CHAPTER 4: RESULTS OF LONGITUDINAL SURVEY OF EMPLOYEES.............................................................................................. 554.1 Response rates.......................................................................................... 55
4.1.1 Workplaces with the HBA........................................................... 554.1.2 Comparison workplaces............................................................. 564.1.3 Non-responders.......................................................................... 56
4.2 Socio-demographic characteristics.......................................................... 564.3 Patterns of canteen use ............................................................................ 58
4.3.1 Purchase of meals from the staff canteen................................... 584.3.2 Main meal consumption............................................................. 594.3.3 Packed lunches........................................................................... 594.3.4 Incentives to use canteen more................................................... 59
4.4 Food Consumption.................................................................................. 604.4.1 Special diets................................................................................. 604.4.2 Food eaten by type at home and at work.................................... 60
Milk consumption......................................................................... 60Bread consumption....................................................................... 62

Spreading fat use............................................................................ 62The addition of sugar to drinks..................................................... 63
4.4.3 Dietary indices to summarise food intake 63Socio-demographic variation in mean dietary indices.................. 67
4.4.4 Frequency of consumption o f food items 704.5 Personal perceptions of diet and health................................................... 73
4.5.1 Predisposing factors................................................................... 73Belief in the diet-disease connection............................................ 73Perceived benefits of a healthy diet.............................................. 74The availability of healthy food at work....................................... 75The taste of food............................................................................ 77Knowledge of healthier eating...................................................... 78
4.5.2 Enabling factors.......................................................................... 79Ability to understand information on healthy eating.................... 79Conflicting information concerning a healthy diet....................... 80Cost of food................................................................................... 81Presentation of food...................................................................... 82The effect of mood........................................................................ 82Needing something quick to eat at work....................................... 83Habitual food choices at work...................................................... 83Social support................................................................................ 84
4.5.3 Change related factors............................................................... 85Self rated diet................................................................................. 85Self efficacy for changing diet...................................................... 86Reported eating habit changes: attempts and successes................ 87Perceived changes in overall consumption of key food item s 87Socio-demographic variation in reported change........................... 89
4.6 Employee response to the introduction of the HBA scheme................... 904.6.1 Awareness of the scheme............................................................. 904.6.2 Employee perceptions o f the influence o f the scheme on foodchoice................................................................................................... 914.6.3 Interest in other nutrition education programmes in theworkplace............................................................................................. 91
CHAPTER 5: RESULTS OF THE EVALUATION FROM THECATERERS PERSPECTIVE..................................................................... 935.1 Introduction............................................................................................. 935.2 Audit of catering establishments............................................................. 93
5.2.1 Length of time premises had held the award.............................. 935.2.2 Customer numbers...................................................................... 945.2.3 Compliance with HBA criteria................................................... 945.2.4 Marketing of the healthier food choices..................................... 975.2.5 Trends in uptake of food items.................................................... 97
5.3 Caterers interviews.................................................................................. 985.3.1 Organisation o f the scheme........................................................ 99
The Dietitian’s role....................................................................... 99Adequacy of resources.................................................................. 99Timescale of the award process.................................................... 100
5.3.2 Implementing the nutrition changes........................................... 101Easiest changes.............................................................................. 101Hardest changes............................................................................. 101The level of nutrition criteria........................................................ 102
5.3.3 Support from within the organisation........................................ 102IV

5.3.4 Facilitating the health promotion role of caterers...................... 103Knowledge of healthier cooking practice............................................ 103Need for healthy eating training.......................................................... 1035.3.5 Responsibility o f caterers in promoting health.......................... 1045.3.6 Value of the award to caterers................................................... 1045.3.7 Effect on food purchasing costs................................................. 1045.3.8 Caterers views of the effect o f the HBA on customers................. 105Customer response................................................................................ 105Effect on customer numbers................................................................ 106Influences on customer food choice ................................................... 106Success in changing eating habits....................................................... 107
CHAPTER 6: RESULTS OF THE EVALUATION OF THE CUSTOMERS PERSPECTIVE IN PUBLIC EATING PLACES 1096.1 Introduction............................................................................................. 1096.2 Socio-demographic characteristics.......................................................... 1096.3 Awareness of the HBA scheme................................................................ 1096.4 Influences on eating place........................................................................ 1106.5 Knowledge of HBA criteria...................................................................... 1116.6 Customers’ perceptions of their diets...................................................... 1126.7 Attitudes to healthier eating...................................................................... 1146.8 Knowledge of healthier eating.................................................................. 115
CHAPTER 7: RESULTS OF THE EVALUATION FROM THE DIETITIANS PERSPECTIVE.................................................................... 1177.1 Introduction.............................................................................................. 1177.2 Organisation of the scheme...................................................................... 118
7.2.1 The dietitian's role....................................................................... 1187.2.2 Adequacy of resources................................................................. 1187.2.3 Time scale o f the award process................................................ 119
7.3 Implementing the nutrition changes........................................................ 1207.3.1 The level of nutrition criteria..................................................... 1207.3.2 Assessing menus.......................................................................... 1217.3.3 Easiest changes........................................................................... 1227.3.4 Hardest changes.......................................................................... 122
7.4 Compliance with nutrition criteria........................................................... 1237.4.1 Need for monitoring ................................................................... 1237.4.2 Developing a monitoring system ................................................ 1237.4.3 Marketing within premises/Labelling healthy food choices 124
7.5 Factors influencing success for caterer.................................................... 1257.5.1 Motivation o f caterer................................................................... 1257.5.2 Support within the organisation................................................. 1267.5.3 Value of the award to caterers................................................... 1267.5.4 Anticipated customer response................................................... 126
7.6 Facilitating the health promotion role of dietitians ................................ 1277.6.1 Value of the award for dietitians................................................ 1277.6.2 Effective use of time..................................................................... 1277.6.3 Targeting key settings................................................................. 1287.6.4 Involving customers..................................................................... 1287.6.5 Partial/staged award................................................................... 128
7.7 Facilitating the health promotion role of caterers.................................... 1297.7.1 Need for healthy eating training............................................... 129
V

7.7.2 Responsibility of the caterer..................................................... 1297.8 Improving the award nationally............................................................. 130
7.8.1 Lack of national training of caterers.......................................... 1307.8.2 Multi-cultural information......................................................... 1307.8.3 Working with national food chains............................................. 130
CHAPTER 8: DISCUSSION...................................................................... 1318.1 Discussion of main findings..................................................................... 131
8.1.1 Process Measures....................................................................... 131Implementing the nutrition criteria............................................... 131The dietitian’s role *.............................................................. 132Compliance with nutrition criteria................................................ 133Marketing and labelling of healthy food choices.......................... 134Monitoring of the scheme............................................................. 137The role of caterers....................................................................... 137
8.1.2 Impact measures......................................................................... 138Who the scheme reaches............................................................... 138Customer response to the scheme................................................. 139Effect on dietary behaviour........................................................... 141Changes in self rated diet............................................................... 142Influence of health on food choice................................................ 143Potential of the scheme in changing behaviour............................ 143
8.2 Methodological limitations...................................................................... 1458.2.1 Limitations o f using a questionnaire in the workplace.............. 1458.2.2 Information bias from the food frequency questionnaire 1468.2.3 Limitations o f dietary indices developed.................................... 1478.2.4 Selection/sampling bias............................................................... 1478.2.5 Attributing change to the HBA scheme in the workplace 1498.2.6 Difficulties o f working with employers....................................... 1498.2.7 Limitations o f cross-sectional study in public eating places 1508.2.8 Limitations o f interviews and focus group with the community 150dietitians...............................................................................................8.2.9 Limitations o f caterers interviews and audit of food provision... 151
CHAPTER 9: CONCLUSION/THE WAY FORWARD9.1 Conclusion................................................................................................ 1529.2 Recommendations to improve the award locally.................................... 1539.3 Recommendations to improve the award nationally............................... 155
APPENDICES............................................................................................... 156
BIBLIOGRAPHY......................................................................................... 157
VI

ACKNOWLEDGEMENTS
So many individuals have helped me through the last 5 years, that it’s hard to know where to
start. The order isn’t important, large or small, the support I’ve received has made all the
difference to keeping my head above water and finishing my thesis. I will start by thanking Dr
Cheryl Haslam for trusting me to take on this study and for all her loyalty and support, both
professional and personal, through the PhD process. I have appreciated her pragmatic, down-
to-earth approach to research and her straight talking style in giving feedback.
My thanks go to ‘my boss’, Diane Spalding, for giving me the opportunity to study for a PhD
alongside my post in the Leicestershire Nutrition and Dietetic Service. I am also grateful to
Leicestershire Health for providing funding for the implementation and evaluation of the
Leicestershire Food & Nutrition Policy, of which this study forms an integral part.
I certainly couldn’t have finished this study without the help of Neil Raymond in the
Department of Epidemiology and Public Health. From constantly challenging my approach
and encouraging me to look at problems from a different perspective, to being a calm support
through good and bad days. I also appreciate the help of Martin Perkins, who always gave his
time to help with computing hiccups and cheered me up at difficult times. Many other
members of the department also supported me, including Dr Adam Lowy, who agreed to take
on some of the responsibilities of supervisor when Dr Haslam changed universities.
I appreciate the support of all my colleagues/friends in the Leicestershire Nutrition and
Dietetic Service: thanks go to Mary Allard and Ann Greig for all their secretarial support and
hard work, most of all for typing the lengthy interview transcripts so patiently. To two special
friends and colleagues over several years go my thanks: Helen Storer has been an immense
practical help, I am grateful for her enthusiasm for the study, her support and loyalty and for
giving me constructive criticism on what I write. Thanks also go to Lisa Sinfield for having a
questioning approach to the study that helped clarify my thinking, and also for the time she
gave to relieve some of the hands on workload of the study, including sticking hundreds of
address labels on envelopes on wet Sunday afternoons.
I am also grateful to the community dietitians who participated in the study, and of course, the
time of busy caterers, many of whom conducted the interviews in their own time, and the
VII

employees and customers who took the time to complete the questionnaires. Without their
interest there wouldn’t be a project.
Other colleagues have helped widen my research knowledge, particularly Len Almond and
Barbara Dobson from Loughborough University, whose friendship, expertise and advice
helped keep ‘doing a PhD’ in perspective.
Doing research is hard work, and has taken away a lot of time from my personal life. When I
would rather be spending time with my partner, Didier and our son, Milo, I would be in the
bedroom ‘working on my thesis again’. A special loving thanks go to Didier, who has been so
patient and reassuring through many strops and panics, and for keeping Milo entertained
whilst I spent weekends working. I also appreciate his professional help- it’s very useful
having a sounding board at home! ‘Pour tout ce que tu as fait, Didier, je te dis merci. Enfin
c’estfini!’
VIII

PUBLISHED MATERIAL
Part of this thesis has been included in the following papers:
Holdsworth, M., Haslam, C., Raymond, N.T. and Leibovici, D. (1997) An evaluation of the Heartbeat Award Scheme in public eating places: the customer's perspective. Journal o f Nutrition Education. 29,231-236.
Holdsworth, M. and Spalding, D. (1997) The development, implementation, monitoring and evaluation of a food and nutrition policy within a local health plan. Journal of Human Nutrition and Dietetics. 10,209-217.
Holdsworth, M. and Haslam, C. (1998) A review of point-of-choice nutrition labelling schemes in the workplace, public eating places and universities. Journal of Human Nutrition and Dietetics. (In press).
Holdsworth, M., Haslam, C. and Raymond, N.T. (1998) The Heartbeat Award Scheme: an evaluation of the caterers’ perspective. Submitted to Health Education Journal (July 1998).
Holdsworth, M., Haslam, C. and Raymond, N.T. (1998) An assessment of compliance with nutrition criteria and food purchasing trends in Heartbeat Award premises. Submitted to Journal of Human Nutrition and Dietetics. (July 1998).
IX

LIST OF ABBREVIATIONS USED
BMI -Body Mass Index
CHD -Coronary Heart Disease
EHO -Environmental Health Officer
FFQ -Food Frequency Questionnaire
HBA -Heartbeat Award
HEA -Health Education Authority
HPO -Health Promotion Officer
NHS -National Health Service
x

ABSTRACT
Michelle Holdsworth. An Evaluation of the Heartbeat Award Scheme in Leicestershire.
The Heartbeat Award (HBA) is a national scheme which attempts to modify the environment of public eating places (cafes, restaurants and public houses) and workplace canteens. The Award is given to premises if one-third of its trading area is non-smoking, if there are high standards of food hygiene and one-third of food provided is ‘healthy’, i.e. low in fat and sugar and high in fibre. The scheme was implemented locally in 1990 and is an alliance between the Nutrition and Dietetic Service, the Health Promotion Service and Environmental Health Officers of the 9 local councils.
This thesis evaluates the scheme as it operated in Leicestershire using both qualitative (interviews and focus groups) and quantitative (surveys) methods, obtaining data from both staff and customers of the premises and the Community Dietitians involved in its implementation. Twenty-three premises were investigated, 6 of which participated in the longitudinal survey in the workplace, 2 of these became controls as they had failed to reach the standard of the HBA. Employees were investigated before the scheme was implemented and 6 months after implementation. Employees acknowledged that it was easier to eat a healthy diet at work after the scheme had been implemented. Even so, there were no differences between the attitudes, knowledge and dietary behaviour of employees in HBA holding canteens and the controls, that could not be attributed to chance or other exogenous factors. The sole exception was an increase in fruit consumption at work in HBA premises.
There was considerable room for improving the operation of the scheme, particularly with regard to consistency and compliance with HBA criteria. The thesis concludes that the scheme is not worth continuing locally in its current form unless radical improvements are made, many of which have resource implications.
1

CHAPTER 1: INTRODUCTION
1.1 The potential of caterers in improving diet
The vital role of caterers in influencing eating habits was recognised in the Health o f the
Nation document (Department of Health, 1992) and by the Nutrition Task Force (Department
of Health, 1994a; 1996). The Health o f the Nation report stated that caterers should use their
opportunities for promoting healthy eating by “offering menus which enable and encourage
people to choose healthy diets”.
Food eaten outside the home is making an increasingly important contribution to many
people’s food intake. Forty-three percent of the population eat out socially at least once a
month. There are currently around 21 million people in employment, who spend on average
60% of their waking life in their place of work (Department of Health, 1995). An estimated 11
million people regularly eat a meal at work (Maryon-Davies et al., 1991), illustrating the
potential role of caterers in influencing dietary change.
In 1992 the National Food Survey was extended to include a survey of eating out (Ministry of
Agriculture, Fisheries and Food, 1994). It found that on average 28% of total household food
and drink expenditure is spent outside the home representing 12% of total energy intake
(Hughes, 1996). Men spent more on food than women, spending more on most foods except
salads, cakes and desserts. Forty-four percent of energy from food was consumed at
restaurants and public houses and 17% at the workplace.
1.2 The Heartbeat Award Scheme nationally
1.2.1 Evolution of the scheme
The Heartbeat Award (HBA) scheme was launched in 1990 by the Health Education
Authority (HEA) as part of the ‘Look After Your Heart’(LAYH) campaign (Department of
Health and Social Security/Health Education Council, 1986). This was a joint initiative with
the Department of Health and Social Security/Health Education Council of that time and the
Institute of Environmental Health Officers. Aimed at the whole of England, with its 47
million inhabitants, the LAYH programme was believed to be the largest coronary heart
disease (CHD) prevention programme in the world (Mock, 1989). The HBA scheme evolved
from the Heartbeat Wales project, initiated in 1985 (Parish et al., 1987). Heartbeat New
Zealand also modelled itself on the Heartbeat Wales project (Peach et al., 1996).
2

1.2,2 Objectives of the scheme
The HEA state that the overall aim of the HBA scheme is:
‘to encourage all types o f caterers/restaurant owners to take an active role in
reducing levels o f coronary heart disease’ (Seymour, 1990, p2).
CHD is one of the main causes of death in England, accounting for around a quarter of
mortality (Department of Health, 1994b). Although the LAYH messages are aimed at
everyone, a report describing the background to the LAYH campaign (Department of Health
and Social Security/Health Education Council, 1986) stated that they would be particularly
aimed at lower socio-economic groups, i.e. HI manual, IV and V, which it states are harder to
reach with health messages and advice. An important issue is whether the HBA scheme is
reaching its target audience.
The criteria for the HBA scheme are set nationally by the HEA. During the period of data
collection in this study, the HBA was awarded to catering establishments fulfilling the
following criteria: at least one-third of the dishes on the menu were ‘healthy choices’; at least
one-third of the eating area was non-smoking; at least 30% of food handling staff had received
training on hygiene; and the premises complied with food hygiene regulations (HEA, 1992).
The HBA scheme is unique among nutrition labelling schemes in combining these areas of
health together.
The nutrition goals of the HBA scheme are to reduce total fat, sugar and salt* and increase the
availability of fibre-rich, starchy foods. To be considered a ‘healthy choice’, a meed must
already be low in fat or a traditional recipe must have been modified to be lower in fat (HEA,
1992). The main emphasis is therefore to reduce total fat and promote healthy food choices to
customers.
The HBA scheme uses ‘prescriptive labels’ , i.e. healthier food choices are labelled but
customers are not informed why a choice is healthier. A ‘descriptive’ label provides more
information on the nutrient content of foods available (Mayer et al., 1989). The scheme is
marketed in establishments using posters, leaflets and symbols next to healthier food options.
* The nutrition goal of reducing salt was not incorporated into the local HBA scheme, as it was not accepted by
the Local Medical Committee when the first local food and nutrition policy was developed (Leicestershire Health
Authority, 1987).
3

1.2.3 Organisation of the scheme
The scheme involves a range of agencies, with all local management groups containing an
environmental health officer (EHO), 85% have a health promotion officer (HPO) and 86% a
community/district dietitian (Baxter, 1993). It is therefore an example of a ‘healthy alliance’ as
encouraged in the Health of the Nation White paper (Department of Health, 1992). The
responsibility for awarding the HBA certificate lies with EHOs from local authority health
departments.
Nationally, the HBA is promoted in a range of settings, including the workplace (28% of
awards), public restaurants (17% of awards) and NHS hospitals (10% of awards) (Baxter,
1993). Other settings include schools and colleges (6% of awards), pubs, take-aways, hotels,
cafes and sandwich bars (23% of awards). Over half of local authorities and health authorities
are involved in the scheme and by 1993, at least 3,752 certificates had been awarded in
England since the HBA was launched (Baxter, 1993).
1.2.4 Changes in the national organisation of the award
In 1992, following extensive consultation the HEA decided that the HBA should become a local
project, with all management and operational elements carried out at a local level. The HEA
monitoring report published after devolvement to local control (Baxter, 1993) stated that the
change to local management of the award had been a success. A later report summarising
interviews with 175 health professionals (Ellis, 1995) suggested that there had been some
confusion over the HEA’s role during the transition period. The resource materials required to
promote and implement the award were free of charge until the award was devolved. Ellis
(1995) reported concern about the provision of support material and the extent of autonomy
that health professionals had in producing their own resources. He also found there was still
confusion over the role of the HEA, with many authorities believing that the HEA should be
more active in the national promotion of the scheme.
1.2.5 New award criteria
Since this study was completed the HEA have modified the minimum criteria for the award
(HEA, 1996a). The new nutrition criteria no longer require a third of all sections of the menu
to be healthier choices, but relate to The Balance o f Good Health (HEA, 1995) and include 10
main criteria with 10 alternative criteria encouraging healthier cooking techniques and food
provision.
4

1.3 The Heartbeat Award Scheme locally
1.3.1 Local food and nutrition policy
A food and health policy was first initiated in Leicestershire in 1987 following publication of
2 key reports on the role of diet in the prevention of disease (National Advisory Committee on
Nutrition Education, 1983; Department of Health and Social Security, 1984). Food and health
policies have been widely adopted in the NHS (Gibson and Kallevik, 1990) and 91% of health
authorities either had or were in the process of developing a policy in 1986 (Gibson and
Champion, 1989).
The production of the Dietary Reference Values report (Department of Health, 1991) and the
Health of the Nation document prompted a revision of the Leicestershire Food Policy
(Leicestershire Health Authority, 1987; Holdsworth, 1994; 1995). The Health o f the Nation
report included targets to reduce total fat and saturated fat in the diet and the incidence of
obesity by the year 2005. The updated food policy shifted emphasis from ‘reducing fat and
sugar, increasing fibre’ messages, towards nutritional adequacy for all population groups by
incorporating The Balance of Good Health (HEA, 1995), which promotes a balanced diet in
food terms rather than focusing on nutrients.
The main change in focus of the new policy was to move away from implementation solely in
the NHS, towards integrating the policy into community based nutrition education activity
(Holdsworth and Spalding, 1997). The overall objectives were to target people at increased
risk of poor nutrition, i.e. lower income groups, minority ethnic groups and increase public
awareness of healthier eating (Leicestershire Health Plan Steering Group, 1993).
1.3.2 The organisation of the scheme
After the award was devolved to local control, a HBA working group was established in
Leicestershire to co-ordinate the scheme. The group consists of EHOs of the 9 local councils,
2 community dietetic representatives and a HPO for heart health. Nationally 72% of local
management groups contain an EHO, community dietitian and HPO (Baxter, 1993).
The group set up a local database of HBA premises and chose to accept the same criteria as
those used for the national award, so that resources produced by the HEA could still be used.
Figure 1.1 illustrates how the award process operates:
5

Figure 1.1: Process for HBA applications in Leicestershire
Routine inspection of catering establishments by EHOs
(as part of their statutory duties)
i
HBA scheme suggested to suitable establishments
i
EHO advises those applying for the award
on hygiene standards and no smoking criteria
4When the hygiene and smoking criteria are met,
the community dietitian is contacted
iCommunity dietitian visits establishment to advise on menu modification
iWhen the criteria are met the EHO is contacted,
who arranges an award ceremony
4Two years later establishments are invited to renew their award,
by going through the same process as above
1.3.3 Changes to the scheme locally
Since this study was completed the modified national criteria for the scheme described above
(section 1.2.5) were introduced into Leicestershire in January 1998.
1.4 The need for evaluation of the scheme
The political changes within the NHS have led to increasing requests from purchasers to
demonstrate the validity of health promotion programmes (Catford, 1993). Locally the
evaluation of the HBA Scheme was prioritised because of the scale of resources invested by the
purchasing health authority and the high profile it was given within the county (Holdsworth and
Spalding, 1997).
6

The effectiveness of the HBA scheme in changing eating habits has never been evaluated,
although the need for an evaluation of the scheme in changing behaviour has been highlighted
previously (Pope et al., 1994; Pope and Cooney, 1995; Warm etal., 1997). Other evaluations
have assessed the views of EHOs (Murphy et al., 1993a) and caterers (Murphy et al., 1993a;
MacAuslan, 1995a; 1995b) about the scheme, and investigated the impact of the scheme on
catering practices (Warm et al., 1997). One study investigated whether the owners of 16 eat-
in sandwich bars would be interested in the scheme (MacAuslan, 1995a; 1995b), which found
that respondents were suspicious of the scheme and doubtful that it would improve business.
An evaluation examining the experiences of EHOs and catering establishments in Wales was
conducted (Murphy et al., 1993a), which indicated that the scheme was valued by both
groups, with EHOs feeling that it increased the profile of local authorities, whilst promoting
the health of the public. Caterers on the other hand thought that the scheme promoted good
relationships with EHOs and demonstrated that they cared for customers.
Monitoring reports have been published about the organisation of the award in Wales and
England (Baxter, 1993; Murphy et al., 1993a; Pope et al., 1994; Pope and Cooney, 1995).
Local authorities have reported monitoring the scheme to assess if standards were being
maintained, with 43% of authorities in Wales (Murphy et al., 1993a) and less than 40% of
health authorities in England (Pope and Cooney, 1995) stating they were monitoring the
scheme.
1.5 Evaluation in health education
1.5.1 Definitions of health education
Health promotion is almost always concerned with change and was summarised as a process
enabling people to increase control over and improve their health (World Health Organisation,
1987). This definition was extended in 1991 to include reference to the process and
conditions in which people live, recognising that the shaping of a healthy environment also
contributes to the process of empowerment:
“Health education is the combination of planned social actions and learning
experiences designed to enable people to gain control over the determinants o f health
and health behaviours, and the conditions that affect their health status and the health
status o f others. ” (World Health Organisation, 1991, pi)
7

The Department of Health (1993) put more emphasis on individual responsibility for health,
stating that the aim of health promotion is to:
“encourage and support individuals and communities to help themselves to improve
health and prevent illness by changing to healthier lifestyles. ” (p33)
Downie (1990) describe the cardinal principle of health promotion as empowerment, defining
health promotion as comprising the overlapping spheres of health education, prevention and
health protection. Three approaches to health education are described:
• Traditional- based on the knowledge-attitudes-behaviour model which is aimed at
prevention rather than positive health, with the main emphasis on physical aspects of
disease/ill health.
• Transitional- uses shock/scare tactics and is therefore very limited if used in isolation.
• Modern- aimed at the promotion of positive health involving an education process which
helps people to acquire life skills to increase self esteem.
1.5.2 Definitions/purpose of evaluation
An evaluation is described as a process which judges the value of an activity in achieving
predetermined objectives (Green et al., 1980; Candeias, 1991; Kemm and Booth, 1992; Hawe
et al., 1994). They clarify the fact that both the processes and outcomes of health promotion
should be measured. The purpose of evaluation is therefore that it should demonstrate
whether an activity has been successful or to what degree it has failed to achieve some stated
aims. Ewles and Simnett (1992) state that appropriate evaluation should be an essential
component of all health promotion activity and recognition should be given to the validity and
importance of negative as well as positive results. Evaluation is also necessary to optimise
use of resources and to assess the quality of programmes. When conducting an evaluation one
has to consider what action would be taken if programmes are found to be inadequate
(Herman, 1987; Israel etal., 1995).
The stated objectives of the HBA scheme on a national level are described in section 1.2.2,
aiming in the long term to reduce CHD. The nutrition objectives are to reduce total fat and
particularly saturated fat consumption, increase consumption of dietary fibre and reduce
consumption of sugar (HEA, 1992). The objectives for any nutrition education programme
8

are always based on the assumption that there is room for improvement in the diets of
participants (Oshaug, 1995).
1.5.3 Process, impact and outcome evaluation
The evaluation conducted of the HBA scheme in this study incorporates methodologies from
health education research. Evaluation in health education has been described as
understanding the process of change and determining the outcome (Nutbeam et al, 1990).
Nutbeam et al., argue that too much dominance is placed on outcome evaluation, which aims
to determine whether or not desired end points are achieved. They argue that evaluations are
not:
“simply to assess if an intervention works, but to understand why it works so that it
can be repeated and/or refined. ”
Therefore they stress the importance of process measures, which help with assessing the
effectiveness of an intervention in terms of the penetration of programmes within target
populations. This approach is supported by others (Candeias, 1991; Ewles and Simnett,
1992; Hawe et al., 1994; Contento et al., 1995; Fraser et al., 1995, Israel et al., 1995) who
suggest that evaluation in health education should comprise process, impact and outcome
evaluation.
Process measures have been described as controlling and assuring quality in practice,
allowing feedback on programme implementation, participant and practitioner response.
Impact evaluation assesses the overall effectiveness of a programme in producing
significant changes in knowledge, attitudes and health behaviour in the target population,
therefore assessing if the programme meets its objectives. This definition of impact
evaluation equates with that of outcome evaluation defined by Nutbeam above. Outcome
evaluation is defined as assessing morbidity changes or other health status indicators for a
specific group of people, i.e. the long term goals of a programme.
Impact or outcome evaluations are therefore conducted when the purpose is to assess the
effects of an intervention. Rather than comparing the effects of an intervention to what would
have happened if there had been no intervention, the impact of a programme can be compared
to a standard to measure success (Hawe et al., 1994; Israel et al, 1995). Quantifying a
standard to measure success can be difficult, suggestions for doing so have included using
9

comparisons with similar programmes in the past, comparisons with contemporary activities
elsewhere or consensus amongst professionals (Hawe et al, 1994).
1.5.4 Qualitative and quantitative methods
The basic experimental design, and particularly a randomised control design is well
established as the ideal method for evaluation. It is difficult in health education evaluation to
meet the basic criteria for such an experimental design (Nutbeam et al, 1990; Israel et al,
1995), and doing so can reduce programmes to unreal ‘sterile’ interventions that are not
appropriate to real life situations.
The evaluation in this thesis was designed to assess prospectively both the process and impact
of the HBA scheme using a combination of qualitative and quantitative research techniques.
The range of methodologies were chosen to allow a comparison of results derived from a range
of methods, this is sometimes termed triangulation (Boonekamp et al, 1995; Pope and Mayes,
1995). The value of using multiple methods in health promotion evaluation has been
supported by several authors as a means to improve the power of the evaluation and the
validity of the conclusions (Mullen and Iverson, 1982; Edwards et al., 1986; Fraser et al.,
1995; Israel etal., 1995; Oshaug, 1995).
A distinction is often made between qualitative and quantitative approaches to evaluation.
The purpose of quantitative research has been described as examining patterns of behaviour or
attitude by aggregating information to ascertain how certain factors influence the expression
of these patterns (Fraser et al, 1995). On the other hand, qualitative methods attempt to
determine the meaning and experience of the programme for those involved and to interpret
the effects that may have been observed (Hawe et al, 1994). Qualitative approaches have
been proposed as being particularly useful for measuring the process and quantitative
approaches are more appropriate to estimate net effects of programmes, e.g. whether dietary
changes are caused by the intervention (Rossi and Freeman, 1993).
10

1.6 Purpose of this study
This study evaluates the role of the HBA scheme from a nutrition education perspective and
therefore does not attempt to assess the impact of the smoking or food hygiene elements of the
award. The overall purpose was therefore to answer the following evaluation questions:
• To what extent have the original aims and objectives of the scheme been achieved?
• What impact has the scheme had on participants?
• What factors influence success?
• How is the scheme implemented and how can this be improved?
The specific objectives of the study were:
i) To conduct a review of other similar point-of-choice nutrition labelling schemes, enabling
characteristics of effective programmes to be outlined (outcome measures).
ii) To investigate whether change can be observed in workplaces with the HBA in eating
habits (at work and at home), attitudes to healthier eating and knowledge about food, and if
any observed change could be attributed to the HBA scheme (impact measures).
iii)To establish the extent to which premises comply with HBA nutrition criteria and
marketing of healthy choices after receipt of the award in public eating places and
workplaces (process measures).
iv)To assess the views of the caterer on the HBA scheme in public eating places and
workplaces (process and impact measures).
v) To gain an insight into the views of the customer into the HBA scheme in public eating
places and workplaces (process and impact measures).
vi)To examine the opinions of community dietitians on the efficacy of the HBA scheme
(process measures).
vii)To assess if the scheme has succeeded in reaching its target group (impact measure).
11

CHAPTER 2: REVIEW OF LITERATURE
This chapter summarises the review of the literature conducted of nutrition labelling schemes
at the point-of-choice and the review carried out to develop the questionnaire for the
workplace longitudinal survey.
Review of nutrition labelling schemes at the point-of-choice2.1 Introduction
Nutrition labelling schemes at the point-of-choice are environmental strategies that increase
opportunities for behaviour change. They provide customers with information, reminders and
reinforcement to guide them towards healthier food choices. The majority of schemes are
from the USA, some of which have been reviewed previously (Glanz and Seewald-Klein,
1986; Mayer et al., 1989; Glanz et al, 1996). Dietary interventions at the point-of-choice can
reach many individuals at minimal cost. The workplace is a particularly good opportunity to
expose individuals to healthier food choices. Customer demand for nutrition labelling in the
workplace setting has been demonstrated (Cole-Hamilton, 1986; Williams and Poulter, 1991).
The overall long term goals of such schemes are that they aim to achieve a change to healthier
eating behaviour; and in the workplace, an improvement in physical and psychological health
and improved work performance. Glanz and Seewald-Klein (1986) suggest that it may be
unrealistic to expect such outcomes from short term or low intensity programmes.
2.2 Selection of studies
Point-of-choice nutrition labelling schemes similar to the HBA scheme are reviewed in this
chapter to describe the variety of schemes and determine the characteristics of effective
interventions. These include those using descriptive and prescriptive labelling. Schemes
were selected because their main component involved the provision of healthier food at the
point-of-choice; they contained original data; schemes were adequately described; an
evaluation of the process or impact of the scheme was carried out and the methodology
reported. A search of the following databases was conducted: MEDLINE, BIDS (Bath
information and data services), EMBASE (Excerpta Medica base), ASSIA (Applied Social
Sciences Index and Abstracts), CISDOC (International Centre for information on Health and
Safety at work) and HSELINE (Great Britain Health and Safety Executive). Previous review
articles were also examined and backward searches were conducted of articles cited.
12

Point-of-choice schemes in workplace canteens; public eating places and universities are
included. Schemes were categorised in terms of the following criteria: programme strategy;
health promotion goal; target audience; nutrition goals; professional input; characteristics;
marketing; monitoring; evaluation methodology; evaluation and impact.
2.3 Health promotion goal
Prevention of CHD was the most common stated health promotion goal. Some schemes
targeted obesity prevention/treatment and cancer prevention. Besides the HBA scheme, only
the Heart Smart restaurant programme in Canada (Green et al, 1993) incorporated other
lifestyle issues at the point-of-choice (Table 2.1), which provided smoke free seating. Some
projects did not specify health promotion goals but stated that they wanted to promote a
healthy diet for the prevention of disease generally. The HBA scheme is unique in including
food hygiene criteria.
2.4 Target audience
In the workplace studies, employee size varied from 130-12000. Programmes other than those
in the workplace were mainly in public restaurants or university cafeterias. All employees
were equally targeted with no programmes aimed at specific sections of the workforce. None
of the studies identified their target audience.
2.5 Nutrition goals
As is the case with the HBA scheme, programmes were often aimed at attaining nutrition
goals relating to CHD prevention by focusing on reducing total fat. Some also emphasised a
reduction in saturated fat and cholesterol. Other nutrition goals included reducing sugar, salt,
calories and increasing fibre. One project (Hoerr and Louden, 1993; Table 2.5) targeted more
specific nutrients by developing an index of nutritional quality to assess vended food items for
some vitamins and minerals.
13

Table 2.1: Schemes labelling healthy food choices
Authors HB A scheme (1990) Green et al (1993) Albright et al (1990)
Healthpromotion goal
CHD prevention CHD and stroke prevention CHD prevention
Targetaudience
Workplace and public setting. Aims to reach lower socioeconomic groups.
12 restaurants participating, represents 68% and 56% of restaurants in two cities.
Customers in a family style restaurant (national chain). 4 restaurants were piloted.
Nutrition goals iFat, sugar and salt; Tstarchy carbohydrates.
-iFat; Tfibre and uptake of healthy choices.
^Fat and cholesterol.
Professionalinput
In Leicestershire, the dietitian advises on modification of menus. EHO on food hygiene/smoking aspects. HPO provides programme motivation.
Recipes analysed by Heart and Stroke Foundation (HSF).
Menus were evaluated by a nutritionist.
Characteristics of Labelling scheme
HBA given if l/3rd of dishes are healthy choices. Highlight/promote healthy choices. Includes food hygiene standards and a no smoking area.
Heart Smart programme developed by HSF. Menu items of 'acceptable nutritional value' were indicated with a heart symbol on menu, this was withdrawn after objections from restaurateurs. Heart health logo displayed to say that choices were available on request. All meal categories modified including desserts.
Menu labelling programme as part of Stanford five city project. Healthy choices (defined as low fat/ cholesterol) were highlighted with a heart symbol. Main courses analysed and those containing <15g fat and <125mg of cholesterol labelled.
Marketing of scheme
Variable, but may include: labelling healthy choices with a symbol; providing tastings; positioning of healthy options; menu boards to promote choices; healthy eating launch; some booklets for caterers and customers.
Endorsed by 39 agencies (media, health agencies, tourism and business groups, restaurant and hotel associations). Customers identify participating schemes by a logo and/or a directory of participating establishments.
Menus displayed at the entrance. A sign stated that main courses with a heart next to them were low in fat and cholesterol and 'good for health’. Nutrition advice leaflet was displayed next to cashier.
Monitoring of scheme
No monitoring. Every 2 years caterers re-apply, otherwise caterer to contact if menus change.
By restaurateurs. Not described.
Evaluationmethodology
Study 1: The impact of the HBA scheme on catering practices (Warm et al., 1997) was investigated by assessing the differences between 380 catering establishments with and 306 without the award. Study 2: Murphy et al., (1993a) analysed data from 117 catering establishments for their opinions of the scheme.
Interviews with 999 individuals in randomly selected households to assess knowledge of scheme and if it affects choice of restaurant. Evaluation did not include whether there were more requests for healthy alternatives. Programmes were running for 6-12 months before evaluation.
Sales of labelled items were measured before and after the program was introduced (4-8 weeks pre and post). Computerised sales records were used, but accuracy is uncertain.
Evaluation and impact
Study 1: Differences in food provision were found between award and non-award holders, mainly for provision of brown rice and lower fat milk, available healthy options and commitment to healthy eating. Study 2: caterers valued the scheme because it demonstrated that they cared for customers and promoted good relationships with EHOs.
Choice of restaurant not influenced by whether it is Heart Smart. Scheme is misunderstood as the majority of respondents (who had heard of the scheme) thought healthy choices were highlighted on the menu. Low professional input therefore cheap in time.
Two restaurants had significant increases in the sales of healthy options. Inconclusive because of lack of consistent change across sites. Restaurants that reported increased sales had a younger and more male clientele. A short term intervention.
14

2.6 Professional input
In most cases a dietitian or nutritionist analysed menu items for specific nutrients, which is
clearly labour intensive. In some cases training was offered to catering staff on basic nutrition
(Cole-Hamilton, 1986), recipe modification (Richmond, 1986) and scheme implementation
(Cole-Hamilton, 1986; Richmond, 1986; Williams and Poulter, 1991). Professional input is
an important issue as any recommendations on modifying the HBA scheme need to be
achievable within current resources. The importance of involving nutritionists in developing
workplace nutrition programmes has been emphasised before (Murray et al, 1986).
2.7 Characteristics of Labelling Schemes
Schemes were classified into 3 groups: those labelling healthy food choices (Tables 2.1 and
2.2), those labelling calories only (Table 2.3) and those labelling calories and other nutrients
(Tables 2.4 and 2.5).
2.7.1 Schemes labelling healthy food choices (Tables 2.1 and 2.2)
In the HBA scheme (Table 2.1) only healthy food choices are labelled. The majority of
schemes in public eating places labelled healthy food choices (Mayer et al., 1986; Albright et
al, 1990; Green et al, 1993; Almanza et al, 1995). One study (Albright et al., 1990; Table
2.1) was part of a long term community based CHD project, after recipe analysis, healthy food
choices were highlighted with a heart symbol. This project is unusual because specific criteria
for labelling a healthy choice were defined. The Heart Smart programme in Canada (Green et
al, 1993; Table 2.1) initially ran a scheme very similar to the HBA, as recipes were assessed
and menu items of ‘acceptable nutritional value’ were indicated with a heart symbol. This
was abandoned due to its unpopularity with restaurateurs. Therefore a scheme was developed
where customers had to request healthier choices, which were promoted by logos stating that
the restaurant was participating in the programme. In another scheme (Williams and Poulter,
1991; Table 2.2), only positive choices were highlighted using stars to differentiate between
fat and fibre content.
Other schemes had additional nutrition education activities. The Pawtucket Heart Health
programme (Peterson et a l, 1986; Table 2.2) highlighted low fat and sodium foods, and
provided slimming groups, cholesterol screening and other educational activities. The
Treatwell programme (Sorenson et al, 1992) combined a labelling scheme with direct
education of employees.
15

Table 2.2: Schemes labelling healthy food choices
Authors Mayer et al (1986) Sorenson et al (1992)
Williams and Poulter (1991)
Peterson et al (1986) Wagner and Winett (1988)
Healthpromotion goal
CHD prevention Cancerprevention
CHD prevention CHD prevention Not described
Target audience Public cafeteria. Employees at 8 workplaces. 300- 1400 employees.
Hospital Staff restaurant (400 customers) and a national Grid site (650 customers)
1400 employees in a 306 bedded community hospital.
2 fast food restaurants in Virginia. 20-35% of customers were university related.
Nutrition goals 4-Fat 4-Fat and tfibre 4-Fat, sugar and salt; Tfibre.
4-Fat and salt. TFibre and 4-fat
ProfessionalInput
Nutrient analysis by a dietitian.
Not described. Caterers received training from dietitian/ nutritionist.
Dietitian and Nutritionist
Unnecessary as salads were not analysed.
Characteristics of Labelling scheme
Individual items were promoted as 'low fat main dishes'.
Labelling scheme and direct education (Food demonstrations and classes).
Foods were labelled: 1 yellow star =med. fat; 2 yellow stars=low fat; 1 green star=med. fibre; 2 green stars= high fibre.
Labelling scheme with slimming groups, educational activities and cholesterol screening. One low fat hot main meal offered at each mealtime.
Aims to promote saladconsumption with a simple visual message. All salads promoted, regardless of 'healthiness'.
Marketing of scheme
A large poster at beginning of food line. Low fat choices in the main meal section of menu. Fliers on each table with same messages.
Not described. Coloured stars on menu boards and written menus, plus cards with star symbol. Leaflets/table tent cards explain the rating. Posters explain labels.
Logo used to highlight foods low in fat and sodium. Nutrition messages indicate healthy choices. Recipes from cook book on menu. Leaflet on calorie/fat content of foods.
Posters promoting salads. Table tent cards, banners and streamers with same message as posters.
Monitoring of scheme
Not described. Not described. Caterers mark the menu using a manual with a list of star ratings of basic food items and ingredients.
Intended to be monitored by a dietitian, but unable to maintain due to time constraints.
Not described
Evaluationmethodology
Main course selections on food trays were monitored throughout the study by observers. Intervention-baseline- intervention-baseline design for 9 weeks.24 observation sessions.
Randomised control study. Assessment pre and post intervention. 12 month FFQ questionnaire used to assess eating habits. 3076 employees at stage 1; 2258 employees at stage 2.
Questionnaires to assess response of user group used in 4th week of pilot (response rate of 39%). Changes in eating behaviour not assessed.
6 week pilot menu labelling scheme, part of overall programme of 3- 4 years.
Baseline (3 wks) >Promoting salads (3 wks >Baseline (1 wk) >Promoting salads (1 wk). Sales data from computerised cash registers (collected daily). Control site.
Evaluation and Impact
Significant increases in sales of low fat main dishes (from 20- 35%). Weakness- short term intervention.
A reduction in mean dietary fat was 1.1% of total calories more in intervention than control sites. No differences in changes in fibre between control and intervention site.
90% of respondents were positive about the scheme; 65% said the scheme was useful; 70% said the scheme did not influence their food choice; 90% said they did not learn anything new.
Blood cholesterol reductions of 26mg/dl. Menu labelling scheme meant that the 'house diet1 fell from 40 to 35% energy from fat. Grilled fish sales increased.
Increased sales of salads. Side salads affected most. Hamburger sales remained constant,indicating that the effects of the intervention were specific to salads.
16

2.7.2 Schemes labelling calories only (Table 2.3)
Only 2 schemes in public eating places used calorie labelling (Scott et al., 1979; Dubbert et
al., 1984). One scheme (Dubbert et al, 1984) labelled the lowest calorie items within the
categories of salads, vegetables and main courses, whereas another introduced a separate
menu which listed the calorie content of foods in this section only. One scheme (King and
Vanhorn, 1983) listed the calorie content of more than 100 food items served, but these were
not labelled. One scheme used incentives as part of a game (Zifferblatt et al, 1980), which
comprised of 52 cards with a nutrition message or comparison of the calorie content of food.
Customers took a card each time they went through the cashier and prizes were won. Some of
these schemes were unpopular with some caterers as highlighting foods high in calories
resulted in reduced sales of these items.
2.7.3 Schemes labelling calories and other nutrients (Tables 2.4 and 2.5)
Descriptive labels indicating the calorie content of all foods were used by 3 workplace
schemes (Wilbur etal., 1981; Cole-Hamilton, 1986; Mayer etal., 1987). Other workplace
schemes labelled only key foods, for example, Schmitz and Fielding (1986) used comparison
cards indicating calorie, fat and sodium content of 2 key foods (Table 2.4). The star rating
scheme (Cole-Hamilton, 1986; Table 2.4) labelled all items with calorie content and also
assigned star ratings using a classification of ‘high’, ‘medium’ and ‘low’ for fat, saturated fat,
sugar, fibre and salt.
Two schemes (Larson-Brown, 1978 and Hoerr and Louden, 1993; Table 2.5) labelled food
items in vending machines with calories and other nutrients. In one study, (Cincirpini, 1984;
Table 2.5) 3 different schemes in a university cafeteria were tried: large signs at the entrance
of the cafeteria listed the calorie content of all menu items; specific foods were labelled with
‘high nutritional value’ (defined as low in fat and calories) as green triangle foods; an
incentive system was also developed which involved a monetary rebate if green triangle foods
were purchased.
17

Table 2.3: Schemes labelling calories only
Authors Scott et al (1979) Zifferblatt et al (1980) Dubbert et al (1984) King and Vanhorn (1983)
Health promotion goal
Obesity, CHD prevention General healthier diet Obesity prevention General healthier diet
Target audience Customers in 2 steak restaurants.
Institute of health employees, approx. 400 per day for lunch.
Public cafeteria. Mainly middle class/business customers.
12000 bank employees in Chicago at 6 dining facilities.
Nutrition goals Low saturated fat/low cholesterol choices on menu.
iCalories. iCalories iCalories, fat and sodium.
Professional Input General instructions were given on saturated fat and cholesterol by dietitians.
Calorie content of food items were calculated, it does not state by whom.
A dietitian calculated the calorie content per serving for all desserts, main courses, vegetables and salads on menu.
Dietitian assessed menus.
Characteristics of Labelling scheme
Calorie content of food items on 'Help your Heart’ menu were listed.
A 'Food for thought’ nutrition game to encourage employees to select lower calorie food. Items were not labelled, the 'game' had 52 cards which had a specific nutritional message.
Labelled the 3 lowest calorie items within the categories of salads, vegetables and main courses.
Not a labelling of key items, but a list of calorie content of over 100 food items.
Marketing of scheme
A separate 'Help your Heart’ menu was printed and placed on the tables. Minimal nutrition information on menu.
Posters were displayed to promote the game in the dining room area.
Labels were bright green with ‘lower calorie selection’, plus a bright red dot on comer. A large poster near cate entrance.
Publicised in bi-monthly publication for employees. Leaflets on calorie content and healthy eating.
Monitoring of scheme
Changes were reported by restaurant manager.
Not described. Not described. Food service staff monitor changes to maintain quality control.
Evaluationmethodology
12 months pilot. At the end of each month of the test period, the number of orders from the special menu was added up for 14 randomly selected days. Data only available for 1 steak restaurant.
No baseline data, therefore did not assess if habits changed
Cash register system for recording food items in a specific category. Time series analysis to detect any shift in levels that occur with introduction of game. 8 months of data of food purchases used.
Monitored via till-roll records for 14,300 main courses, vegetables and salads. A quasi-multiple- baseline design was used to test the additive effect of labelling the 3 types of food. Also, a sub-section of customers were approached after purchasing their meal and interviewed about their selection. 15 evening observations for 18 weeks; 6,970 customers served.
Not described.
Evaluation and Impact
After 6 months, decided to print the 'Help your Heart’ menu on the first page of the main menu. Mean monthly sales from the special menu was 3.4%. No significant change of total sales from the special menu..
For 8 week intervention period:- TSkimmed milk purchases; 4- desserts and bread purchases; 4 calories. Some evidence of maintenance effect after 10 week follow up period.
Labelling increased sales of low calorie salads and vegetables, but not for lower calorie main courses.
No increase in food costs. Measured changes in food availability, but not the influence this had on eating habits.
18

Table 2.4: Schemes labelling calories and other nutrients
Authors Cole-Hamilton(1986).
Wilbur eta l (1981) Schmitz and Fielding (1986)
Richmond (1986) Mayer et al (1987)
Healthpromotiongoal
CHD prevention General healthier diet.
General healthier diet
CHD prevention Obesityprevention.
Targetaudience
Staff at County Hall
3000 employees at National Institute for health.
Mattel toy company approx. 2,000 employees.
150 employees in a small company.
Approximately130employees/day for lunch.
Nutritiongoals
iCalories, fat, saturated fat, salt, sugar and tfibre.
iCalories iCalories, fat and sodium.
iCalories, fat and sodium.
iCalories
Profession -al input
Recipes analysed by a dietitian for 16 nutrients. Initial training from dietitian
Not described. Nutritionist developed comparison cards.
Nutritionist taught courses to caterers on modifying recipes/marketing.
All food items analysed by a dietitian for calorie content.
Characteristics of Labelling scheme
Calories and star ratings on all menu items. High/ medium or low for fat, saturated fat, sugar, fibre and salt Information folder with breakdown of 14 vitamins/minerals
Two schemes: 1) nutrition information materials for 9 low calorie and standard calorie items, or 2) only low calorie snacks.
Comparison cards were used for 2 key items, indicating fat and calories. Cards placed at 15 places throughout cafe each day.
Favourite recipes were modified by canteen staff after training courses. Working group of employee, company nurse, nutritionist, and caterers adapted existing recipes.
Nutrition awareness game with incentive raffles.
Marketing of scheme
Exhibition near restaurant entrance, staffed by dietitians. Leaflets, posters, folders of nutrition information.
Signs behind vending machine display panel promoting lower calorie items. Sign behind each item listing its calorie content.
Cards displayed in 15 places. Food service staff placed cards daily.
Flyer sent out. Staff could attend courses run by Dietitian. Nutrition day to promote cafeteria/ calorie labelling.
Labels on all food items with calorie information.
Monitoringofscheme
Scheme adapted to be less labour intensive.
Not described Supervised by nutritionist.
Not described. Not described
Evaluationmethodology
167 questionnaires returned. Assessed opinions of the scheme.
Baseline data of snack items collected for 8 months.
Pre test 6 days before scheme introduction and post test 6 months after. Food intake of every 10th employee was recorded. Same people not followed up.
80 questionnaires returned.Investigated health status, meal habits, cafe use and food preferences.
The daily % of meals containing salads, low fat milk and fruit were monitored. 3993observations altogether. 4 week study.
Evaluationandimpact
94% of employees want information about food at work; 46% felt that the scheme had altered their food choice; 51% learned something new.
The presence of nutrition education materials did not influence sales of lower calorie items. Lower calorie items sold competitively.
Significant reductions in calories and sodium per tray. Nearly significant reductions in fat per tray.
An innovative project in that it involved an employee representative and had a team approach.
Not effective in lowering overall calorie intake. Incentives on certain food selections increased sales of these items.
19

Table 2.5: Schemes labelling calories and other nutrients
Authors Cincirpini (1984) Hoe i t and Louden (1993)
Davis-Chervyn et al (1985) Larson-Brown(1978)
Healthpromotion goal
General healthier diet. Not described. General healthier diet. Not described.
Targetaudience
Undergraduate students aged 18-23 years in University cafeteria.
Students in a university using vending machines.
Students in 2 dormitory cafeterias in a university.
Students in a college campus using vending machines.
Nutrition goals iFat and calories. TSpecific vitamins, minerals and fibre
4 Fat, cholesterol and calories. Promotion based on 4 main food groups.
Professionalinput
Not described. Assessed nutritional density of 133 sweet and savoury items and evaluated for 8 nutrients.
Nutritionist assessed menus, analysed by computer.
Recipes verified by cooks and food service manager.
Not described.
Characteristics of Labelling scheme
3 schemes tried: 1. Calorie information- listing all menu items and their calorie content. 2. Labelling scheme targeting specific foods with 'high nutritional value', low fat, less calories. Labelled as green triangle foods. 3. Token system- based on above labelling system with cash refund if green triangle foods were bought.
An index of nutritional quality used to assess items for fibre, vitamins A, C, B2 and B3; iron, calcium. Each item was labelled with calories, and the % of the USA nutrition guidelines for selected nutrients. Displayed in bar chart form.
A combination of 1) display cards on main courses, milk and other products stating calories, mg of cholesterol and % energy from fat and 2) nutrition signs with general information and recommendations for food choice.
Nutritive value graphs on vending machines, illustrating the % of the USA nutrition guidelines a nutrient meets, i.e. for protein, calcium, vitamin C, thiamine, iron, calories for all foods in machines.
Marketing of scheme
Signs at entrance to caf£. Labels with nutrition information.
Display cards and nutrition signs.
Graphs onvendingmachines.
Monitoring of scheme
Scheme for study purposes only.
Not described. Not described. Not described.
Evaluationmethodology
Observed 35-50 subjects per session (3-5 x week). An observer recorded food items chosen and categorised people as ‘lean, obese or normal’.
3 schemes tried: baseline before and after implementation of each; 8-9 weeks each phase over 16 month period.
12 snacks were selected (4 of low, high or moderate index of nutritional quality).
Sales data was collected for a total of 12 weeks.
2 dormitories with 2 different interventions; 1 year study; quasi experimental design: Dormitory 1: Nutrition information for changing food choices and nutrient display cards. 15 week intervention. Dormitory 2: Nutrient display cards only after a baseline no intervention period. 5 week intervention.
Volume of sales for each of 8 categories of foods were recorded for 2 months (1 month baseline and 1 monthintervention).
Evaluation and impact
Calorie informationcaused a fall in sales of carbohydrate, red meat and diary products. Labelling had isolated effects on obese subjects. Female obese most sensitive to change. Token system most successful in changing behaviour. Soup, vegetable and fruit sales increased, fall in high fat items and desserts.
Increasing availability of nutrient-dense snacks reduced sales. Displaying nutrition information on machines increased sales, but not back to original level. Study didn't assess if specific promotion of nutritious snacks would improve sales.
There were increased sales of targeted items in dormitory 1.
Food selection behaviour was not influenced in dormitory 2.
Total sales increased of milk, fruit, sandwiches, yogurt, soft drinks. Long term effect not monitored.
20

2.8 Marketing of labelling schemes
Marketing of schemes was predominately via posters, leaflets, symbols or nutrition
information. None of the papers reviewed described trained serving staff having a role in
marketing healthier food choices. In Canada, the Heart Smart programme (Table 2.1)
targeting public restaurants (Green et al, 1993) was endorsed by 39 agencies, e.g. tourism and
business groups, media, restaurant and hotel associations, which they believed helped with the
promotion and credibility of the award. Active marketing of healthy food choices was
discouraged by restaurateurs. Nutrition labelling schemes tended to be less readily promoted
in the public setting, where more subtle approaches were used. This may be because health is
a lower priority for caterers in the public setting as they are in a more competitive market and
are concerned about deterring customers.
Two studies investigated the most effective labelling format to use (Colby et al, 1987;
Almanza, 1995). Colby etal., created 3 luncheon menu specials, which were low in sodium,
fat and cholesterol and were promoted with equal frequency by 3 different messages designed
to counterbalance one another. Messages varied in emphasis relating to taste and healthiness.
Healthy options were more likely to be chosen when the message noted that the choice was
healthy, but emphasised taste than if the message stressed healthiness alone. Almanza tried 3
different labelling formats to assess consumer preference, this included a scheme similar to
the HBA, where an apple symbol indicated that a main course met at least 3 of 5 nutrition
criteria. In the second format, coloured dots indicated which of the guidelines a main course
met. The third format listed numeric values for nutrient content in a separate leaflet. On
evaluation the apple format was the most popular, being rated the easiest and quickest to use.
2.9 Monitoring of labelling schemes
Many schemes did not describe who was responsible for monitoring them on a daily basis.
Some schemes were the responsibility of the caterer to monitor with a nutritionist supervising
(King and Vanhorn, 1983 (Table 2.3); Schmitz and Fielding, 1986 (Table 2.4)). Williams and
Poulter (1991) express concern that many schemes are unsustainable and require too much
specialist on going support. In their Starstruck scheme (Table 2.3), catering staff were trained
to mark the menu using a comprehensive manual. This guarantees the accuracy of nutrition
labelling, but would be difficult to extrapolate to the HBA scheme as preparing a manual for
each establishment would be time consuming. Two schemes described having difficulties in
sustaining monitoring at the original intended level (Cole-Hamilton, 1986; Peterson et al.,
1986). The nutrition criteria of schemes need to be realistic and measurable to facilitate
21

accurate monitoring, as complex criteria clearly necessitate a more involved and time
consuming monitoring process.
2.10 Evaluation of the schemes
In 10 of the 20 studies, impact was assessed by measuring food uptake/purchasing patterns,
usually by recording sales data pre and post intervention. Other studies used questionnaires to
assess eating habits, establishment use, customer response to the scheme and food
preferences. One study assessed meal uptake by observing food choice in the restaurant.
Many of the interventions were of short duration and few had a control group. None of the
workplace studies collected data on the effect of schemes on eating patterns at home as well
as at work. Few studies measured the process, such as compliance with scheme criteria,
participant and practitioner response. Follow up studies are needed to assess if there is a
sustained effect at least six months after intervention for both process and impact measures.
2.10.1 Studies measuring food uptake/purchasing patterns
Schemes labelling healthy food choices (Tables 2.1 and 2.2)
In Albright et al.'s study, sales of labelled items were monitored before and after the scheme
was introduced using sales records for 8 weeks. In 2 of the 4 restaurants, there were
significant increases in the sales of targeted foods following labelling, but the authors could
not explain the reasons for the differences between sites. Although these findings are
somewhat positive, a longer time period for follow up is necessary.
Two studies used a similar design: Mayer et al.,(1986) in the promotion of main courses, and
Wagner and Winett (1988) for promoting salads. The studies included 4 consecutive phases
of: baseline (no prompts)- intervention (promoting salads/main courses)- baseline (no
prompts)-intervention (promoting salads/main courses). Mayer et al., found significant
increases in sales of low fat main dishes and suggested that focusing solely on main dishes
influenced their selection most effectively. Wagner and Winett concluded that labelling could
increase sales of salads, particularly side salads and a low fat/high fibre menu selection.
Schemes labelling calories only (Table 2.3)
Dubbert etal., (1984) labelled the 3 lowest calorie items within salad, vegetable and main
course categories. They found that the probability of purchasing low calorie salads and
vegetables increased when labels targeted these items but sales of labelled lower calorie main
dishes did not increase.
22

Workplace studies which compared changes in eating behaviour by measuring food uptake
(Zifferblatt, 1980; Wilbur, 1981; Schmitz and Fielding, 1986; Mayer etal., 1987) indicated
mixed results. One study (Mayer et al., 1987) combined calorie labelling and a nutrition
awareness game for a 4 week period. The daily percentages of trays containing salads, low fat
milk and fruit were monitored by observers to assess if less calories were purchased as a result
of the intervention. The authors found that the combination of calorie labelling and a game
was not effective in significantly lowering overall calorie intake. They reported that incentives
on certain food selections increased sales of these items. Interestingly, this game was piloted
by other authors (Zifferblatt et al., 1980) for 8 weeks and a cash register system was used for
recording food items. The authors concluded that the intervention resulted in increased sales
of skimmed milk and decreased sales of desserts and bread. Current nutrition educators
would consider the reduction of bread sales to be undesirable, and possibly resulting from a
programme focusing on calorie reduction. This study did show a reduction in calories
consumed and some evidence of a maintenance effect over a 10 week follow up period.
Schemes labelling calories and other nutrients (Tables 2.4 and 2.5)
One scheme (Wilbur et al, 1981; Table 2.4) aimed to increase sales of lower calorie snacks in
vending machines. The authors found that sales of lower calorie items was influenced more
by their availability than the presence of nutrition education materials. They concluded that
lower calorie items can sell competitively with other items. This study involved employees at
the US National Institute for Health, but this working population may already be sensitive to
health issues. A comparison card scheme introduced by Schmitz and Fielding (1986; Table
2.4) was evaluated by observing food purchases pre/post intervention, they found significant
reductions in calories and sodium per tray, and near significant reductions in fat per tray. The
post test was at 6 months after the scheme was introduced which seems to indicate a longer
term effect. An evaluation of the combined effect of a labelling scheme and food
demonstrations (Sorenson et al., 1992; Table 2.4) recorded a reduction in mean dietary fat of
1.1% of total energy more in the intervention than control sites. No differences in changes in
fibre were found between control and intervention sites.
One evaluation (Hoerr and Louden, 1993; Table 2.5) investigated whether nutrition
information could increase sales of healthy vended snacks by labelling selected items with
nutrition information. When snack proportion was changed to increase availability of healthy
snacks, total sales dropped, as the healthy snacks were unpopular. Overall sales of snacks
23

increased when nutrition information was displayed on the vending machine, but primarily for
the less healthy snacks, so this scheme was unsuccessful in changing snacking habits. Foods
in a vending machine were labelled (Larson-Brown, 1978; Table 2.5) with calories and other
nutrients, and the volume of sales of each of 8 categories of foods were recorded for 2 months.
Although long term effects were not monitored, sales of milk, fruit, soft drinks and
sandwiches increased. With the exception of soft drinks, these foods were considered the
more nutritious foods.
One study (Davis-Chervyn etal., 1985; Table 2.5) evaluated 2 different interventions in 2
dormitories. One dormitory had a nutrition sign with general information and display cards
on main courses (with information about calories, fat and cholesterol); the second dormitory
just had nutrient display cards. Food selection behaviour was positively influenced in the
former only. Cincirpini (1984; Table 2.5) evaluated 3 schemes in a university cafeteria:
calorie information before food selection, which caused a reduction in carbohydrate, red meat
and dairy product purchases; secondly, targeting healthy food choices, which had isolated
effects on obese subjects and the consumption of vegetables, soup and fruit; lastly, a token
system with a cash rebate on the purchase of appropriate foods, which was the most
successful in changing eating behaviour with increases in healthier options and decreases in
uptake of high fat items.
2.10.2 Studies assessing changes in food availability
Only 2 studies besides the HBA scheme reported making process measures to assess if meal
provision had changed (King and Vanhorn, 1983; Peterson et al., 1986). King and Vanhorn
(1983; Table 2.3) assessed changes in food availability as a result of their intervention. They
were successful in making healthier food choices available in the canteen and they noted that
these changes did not result in an increase in food or staffing costs and that ‘appreciation was
shown by employees’. In the Pawtucket Heart Health programme (Peterson et al., 1986;
Table 2.2), the fat content of menus fell from 40% to 35% energy after a 6 week pilot menu
labelling scheme and was ‘deemed a success’ by the authors. Neither of these programmes
measured changes in eating habits.
One study investigated the impact of the HBA scheme on catering practices (Warm et al.,
1997; Table 2.1) by assessing the differences between catering establishments with and
without the award. Differences in food provision were found between award and non-award
24

holders, particularly with regard to provision of healthy food, including brown rice and lower
fat milk, available healthy options and commitment to healthy eating.
2.10.3 Studies assessing customer response
One study (Williams and Poulter, 1991; Table 2.2) used questionnaires to assess the response
to their labelling scheme. The researchers found that 90% of respondents were positive about
menu labelling schemes at work, although 90% also said that they had not learnt anything new
from the scheme. They did not assess changes in eating behaviour, but 70% of respondents
said that the scheme had not influenced their food choice. Cole-Hamilton (1986; Table 2.4)
echoed some of these findings, with 94% of employees wanting information about food at
work, but 41% of employees reported that the scheme had altered their food choice, and 51%
felt they had learnt something from the scheme. The differences between these 2 studies
could be due to varying effectiveness, the target audience, and changes in awareness of the
UK population about nutrition since the mid 1980s as the studies were carried out 5 years
apart. These studies imply that employees want a menu labelling scheme but that this does
not influence their choice. In another study (Green et al, 1993; Table 2.1) telephone
interviews were carried out to ask what the public thought of the Heart Smart scheme. They
concluded that people were not influenced by whether a restaurant was Heart Smart when
choosing to eat out. There was some indication that some customers were more likely to
choose healthy food choices in a Heart Smart restaurant than in others.
2.10.4 Studies assessing practitioner response
Besides the HBA scheme, none of the schemes reviewed reported evaluating practitioner
response to the scheme. Evaluations of the HBA scheme have involved assessing views of
EHOs (Murphy eta l, 1993a) and caterers (Murphy et al, 1993a; MacAuslan, 1995a/1995b)
about the HBA scheme. Murphy et al, (1993a) analysed data from a self completion
questionnaire completed by 117 catering establishments, caterers reported valuing the scheme
because it demonstrated that they cared for customers and it promoted good relationships with
Environmental Health departments.
25

Review of literature used to develop the questionnaire for the longitudinal
workplace survey
2.11 Background considerations in assessing dietary behaviour
Since no dietary assessment method can exactly measure usual intake, no method can be
truly validated (Cameron and Van Staveren, 1988; Beaton, 1994; Cole, 1997). There are
several methods available for assessing dietary intakes (Anderson, 1995). Each method has
its strengths and limitations, but it is generally considered that the weighed inventory method
is likely to yield results closest to actual intake (Marr, 1971). This is however impractical
and invasive for a large survey, and it is time consuming to carry out and analyse. Before
choosing a dietary assessment technique, the level of information required about dietary
behaviour needs to be decided, and whether it will be used to measure foods or nutrients.
A food frequency method was chosen for this study. Food frequency instruments are usually
pre-coded forms consisting of selected core foods which are grouped into food groups of
similar nutrient composition for a few selected key nutrients. Three main types of FFQs
have been described (Horwarth, 1990; Sempos, 1992):- Qualitative FFQs which do not
include portion size information; Semi-quantitative FFQs where a standard portion size is
stated on the form or assumed by the investigator; Quantitative FFQs which ask
respondents to record data on portion size.
A FFQ is most suited to assessing dietary intake in large populations and has been described
as the most appropriate dietary assessment technique for use in the workplace (Hunt et al.,
1993; Glasgow et al., 1996). Advantages of FFQs described in the literature are the
convenience to the investigator and respondent compared to other dietary assessment
techniques, and the low potential effect on habitual dietary intake (Levine and Morgan,
1991). The estimation of food type results in a lower error as foods are already pre-selected.
Although reporting errors are potentially large, this is true for all dietary assessment methods
compared by Levine and Morgan.
The assertion that for any population group a relatively small number of foods are frequently
eaten and that they serve as the basic diet, which is the assumption of semi-quantified FFQs,
is questionable (Sempos, 1992). Using semi-quantified FFQs to derive the nutrient content
of the diet has been described as particularly inaccurate as grouping key foods together can
26

result in errors in estimation of nutrient intake (Lockie et al., 1988; Flegal and Larkin, 1990;
Levine and Morgan, 1991; Sempos, 1992). Another reservation is the way dietary
information is recorded, as the foods listed in semi-quantitative FFQs are generally
composed of single foods, or groups of single foods, rather than mixed dishes (Sempos,
1992; Haraldstdottir, 1993; Kohlmeier, 1994). An individual therefore has to separate mixed
dishes into their component foods which inevitably leads to error. Another criticism of semi-
quantative FFQs is that they give equal weight to foods that may not be selected at equal
frequencies or in equal amounts by the respondent population. Additionally they ignore
foods that are consumed by respondents that have not been considered in the research design.
On the other hand, some authors have illustrated the reproducibility and validity of semi-
quantitative FFQs in measuring nutrient intake (Willett et al., 1985; Eck, et al., 1991).
If there is a great deal of cultural diversity in the population being surveyed, it may be
impossible to develop a food list that is reasonably short while including all of the essential
core foods eaten by different ethnic groups (Cassidy, 1994). The latter point is pertinent to
Leicestershire, where an estimated 28% of the city population are of South Asian origin
(Leicester City Council Census data, 1990). The increased frequency of eating out also
makes it more difficult for the respondent to characterise usual food preparation methods.
Additionally in the workplace, employees may not know how food is prepared.
Dietary assessment methods such as quantified FFQs produce very detailed information,
whereas studies on the effectiveness of nutrition interventions in the community, like the
HBA scheme, do not always require nutrient intake to be measured precisely. When
attempting to evaluate the direct impact of health promotion activities, it may be more
appropriate to express consumption in food terms (Kemm and Booth, 1992). Ranking
individuals according to their intake of a specific nutrient or food product may be all that is
required (Van Assema et al., 1992). FFQs appear to be better suited to rank individuals
according to food or nutrient intake rather than estimate actual intake (Bergman et al., 1990;
Van Assema et al., 1992; Kohlmeier, 1994). Several workers have shown that information on
quantities is not needed as food frequency data alone can explain much of the variation in
dietary consumption (Shepherd and Stockley, 1985; Hammond et al., 1993) and can be
responsive to changes in food intake over time (Kristal et al., 1994; Osier and Heitmann,
1996).
2 7

2.12 Background to developing dietary indices
Examples of indices developed in the literature to assess food intake have been reviewed
recently (Kant, 1996). Some of the studies reviewed focused on producing indices for
individual foods, food groups or food categories and did not attempt to develop a single
measure of overall diet quality (Heady, 1961; Stefanik and Trulson, 1962). Other studies have
developed indices based on variety of the diet, often in relation to recommended servings of
various food groups and several authors found indices to be generally correlated with nutrient
intake. Indices developed from food frequency data based on intake of foods or ranking
individuals by fat intake were considered in this study in the development of dietary indices.
A composite dietary index based on the frequency of consumption of 14 food items was
developed in 1 study (Davenport et al, 1995). Foods recommended by current dietary
guidelines were scored from 0 to 5, and others not recommended were scored from -5 to 0.
The dietary index was calculated by adding together the individual food category indices, so
that a healthy eating pattern had a higher index. Type of milk and spreading fat were scored
to reflect their saturated fat content. The dietary index was significantly associated with
socio-demographic variables as a measure of validity. A score based on similar principles
was developed from a FFQ (Smith and Smith, 1994), which gave 3 points for the most healthy
choices of wholemeal bread and skimmed milk; 2 points for the ‘somewhat healthy’ food
choices of brown bread and polyunsaturated margarine; and 1 point for neither healthy or
unhealthy choices, e.g. white bread and eating no bread.
Dowler and Calvert (1995) developed a healthy diet index from food frequency data they had
collected in their investigation of diet in lone parent families in London. They scored each
food as +1, -1 or 0 in terms of whether current nutrition guidelines recommended eating more,
less or the same of it. Hence recommended foods eaten more often contributed more to their
index. Other workers (Griffiths et al, 1994) developed 6 qualitative dietary indicators from 2
sets of food frequency questions to attribute index ratings for intakes of saturated fat, positive
fat choices, high fibre starchy foods, fruit and vegetables, sugar and finally an index of healthy
dietary practice.
In one study (Van Assema et al, 1992) responses were ranked for 12 food items, so that each
respondent was given an index for fat intake, so that the higher the index, the higher their fat
intake. Such an approach was described as quick, simple and inexpensive. An individual fat
index was calculated by adding up the fat indices for each food for each subject. The scoring
28

system was determined by applying 2 global starting points: within a food product the indices
should be higher in proportion to the increasing intake of grams of fat and between food
products a corresponding index should refer as far as possible to corresponding amounts of
fat. This method could not be extrapolated into the HBA study because foods were grouped,
and food products need to be separate to attempt to quantify nutrient intake accurately.
Another study (Kinlay et al., 1991) also used a 12 item questionnaire to effectively measure
group changes in dietary intake of fat.
In another example, (Hammond et al, 1993) the authors developed scores by grouping the
major sources of intake for fat and fibre and calculating a score for each group based on how
frequently the foods in that group were eaten. Those whose consumption was in the lowest
quartile of frequency for the group scored ‘O’, in the second quartile ‘ 1’, in the third quartile
‘2’ and in the highest quartile ‘3’. The scores were then summed for nutrient group to create a
score for high fat, low fat, high fibre and low fibre. A similar approach was considered for
this study but this would have resulted in 4 scores for each nutrient, e.g. low fat at home and
at work, high fat for home and at work. In addition some of the foods in the FFQ can not
clearly be described as low or high fat, and doing so would have meant quantifying the data.
2.13 Background to developing attitudinal questions
Attitudes are one of the many influences on an individual’s eating behaviour. Measuring
attitudes involves an assessment of beliefs and values. An attitude is defined as a regularity in
an individual’s practical thoughts indicating something that is fairly consistent over time
(Kemm and Booth, 1992). Knowledge may also be a determinant of dietary behaviour, so
measuring knowledge as well as attitudes can help demonstrate if an intervention has led to
dietary change. There are many immediate influences on an individual’s eating choices
including the following described by Kemm and Booth (1992):
• Food availability - convenience, cost.
• Sensory influences- appearance of food, taste, smell, texture.
• Personal influences- feeling hungry, emotional eating/craving, expectation to eat.
• Social contexts- interpersonal factors, cultural norms.
• Rational considerations- improving fitness, helping concentration/improving mood, long
term health/prevention of disease.
29

It is therefore unrealistic to expect to measure fully these complex mental processes with
single statements in a questionnaire, information can however be provided which is useful for
assessing outcomes of health promotion activity. Kemm and Booth (1992) state that it is
usually enough to ‘identify the general nature, direction and frequency of relevant attitudes
without attempting detailed measurement’ (p 143) when attitudes are used for planning,
monitoring and evaluating purposes in health promotion.
2.14 Summary comments
Most of the studies reviewed demonstrate some positive short term benefits of point-of-choice
nutrition labelling schemes. It is not possible to conclude that there are long term behaviour
changes because of a lack of follow up studies. It is unclear which is the most effective
labelling format, and if it is best to label positive food choices only. Calorie labelling can
have detrimental effects by causing a reduction in sales of starchy carbohydrates. Factors
identified as important in consumer preference were attractiveness, ease of use and clear
presentation of nutritional information. It may be more effective to target one meal
component rather than the entire menu, as is the case with the HBA scheme. The use of
incentives to increase uptake of healthier food choices appears to be effective in the short
term, but more research is needed to assess if this is sustainable.
The review of labelling schemes contributed to the decisions made on choice of
methodologies used. The need to assess the process was evident, as well as the impact of the
scheme at least 6 months after intervention. FFQs were the most appropriate way to assess
changes in dietary behaviour. A simple indices can be developed to summarise dietary
behaviour and assess if there has been any overall change. Attitudes and knowledge are
important determinants of food choice and are useful for assessing the impact of the HBA
scheme, but the depth of measurement is limited by using a questionnaire. The questions
chosen need to be sensitive indicators of exposure to the scheme and simple enough to be
used in a self administered questionnaire.
30

CHAPTER 3: METHODOLOGY
3.1 Introduction
Approval for the study from the Leicestershire Medical Ethics Committee was granted in
March 1994. The effectiveness of the Leicestershire HBA scheme was assessed in a range of
workplace and public eating places: manufacturing industry, retailers, hospitals, public houses,
leisure centres, restaurants and cafes. The methodologies used to answer the study objectives
described in section 1.6 will be discussed in this chapter.
• A longitudinal survey of employees was carried out using a semi-structured questionnaire
pre and post HBA intervention. The survey investigated whether change could be observed
in eating habits and attitudes to healthier eating at home and work, and knowledge about
food in workplaces, and if any observed change could be attributed to the HBA scheme.
The questionnaire assessed the use of the staff restaurant; eating patterns of employees
while at work and at home, both before and after implementation of the award; employees’
satisfaction with food choices; their attitudes towards the scheme and to healthier eating;
and their knowledge of healthy food choices and current nutritional guidelines (Objective
ii). The survey also assessed if the scheme was successful in reaching its target group
(Objective vii).
• An audit of food provision and assessment of food purchasing trends was conducted to
establish the extent to which premises complied with the HBA nutrition criteria and
marketing of healthy choices, after receipt of the award in public eating places and
workplaces (Objective iii).
• Tape recorded interviews were conducted with caterers to obtain the views of catering
managers who had implemented the scheme in their workplace or public eating place. The
interviews were conducted on the same occasion as the audit described above (Objective
iv).
• A semi-structured questionnaire was used post HBA intervention to gain an insight into
customer views of the scheme in public eating places (Objective v). The survey also
assessed if the scheme succeeded in reaching its target group (Objective vii).
31

• A focus group and individual interviews were conducted with the team of 5 community
dietitians implementing the HBA scheme in Leicestershire to explore their views on the
efficacy of the HBA scheme. (Objective vi)
Each of these areas of the investigation will be discussed in turn:
3.2 Longitudinal survey of employees
A self administered questionnaire was chosen as the most practical way to assess food
behaviour, food attitudes and knowledge about nutrition in the workplace (appendix 3.1). As
respondents completed the questionnaire in their own time over lunch or in work time, it was
essential that the research tool used was not time consuming.
3.2.1 The dietary assessment technique chosen for this study
Questions on food frequency were used to generate data on the frequency of consumption of
key food items to allow an assessment over time of the intake. A description of consumption
of food intake rather than nutrient intake was deemed more appropriate to assess dietary risk
with regard to CHD, as prevention of CHD is the long term aim of the HBA scheme. A FFQ
was thought to be the most appropriate way of achieving this, a discussion of the
considerations contributing to this decision is in section 2.11.
The purpose of the food frequency method was to assess if there was a difference in food
consumption before and after introduction of the HBA. Foods were listed which contributed
the major sources of fat, dietary fibre and sugar using data from the National Food Survey
(Ministry of Agriculture, Fisheries and Food, 1992) and choosing those of interest to the HBA
scheme. The FFQ needed to be modified for the local population (Eck and Willett, 1991;
Margetts and Nelson, 1997), hence Asian foods were incorporated to reflect the cultural
diversity of the survey population (Cassidy, 1994; Kohlmeier, 1994). Food types/groupings
were listed and respondents were asked to record how often they ate the foods at home and
work. The scale evolved as a result of piloting. Care was taken to group foods together with
comparable nutrient content and groupings were avoided that combined foods eaten in
different circumstances. These considerations were identified as crucial by Kemm and Booth
(1992). Portion size was not recorded, mainly because of the decision not to measure nutrient
intake but also because of the short time available for employees to complete the
questionnaire. The FFQ developed was thus ‘qualitative’ according to the definition in
section 2.11.
32

3.2.2 Developing the questionnaire
First pilot
The questionnaire (appendix 3.2) was administered to the employees of a computer
manufacturing company over lunchtime. They were asked to return the questionnaires to a
sealed box that was in the canteen or by post with a pre-paid envelope. Thirty-four completed
questionnaires were returned out of 40 distributed, a response rate of 85%. There were 150
employees based at the site with an estimated 45 using the canteen facilities regularly.
Initially the questionnaire was entitled ‘Heartbeat questionnaire’ but it was decided to change
this to ‘Food survey’. The use of the term ‘heartbeat’ implied that the study had a health
component and could have prejudiced responses. Personal information to elicit demographic
data was listed first, but it was decided to move this to the end of the questionnaire as
respondents may be more honest about their eating habits if they are unaware until the end
that they will be asked for personal data (Kemm and Booth, 1992). The food frequency
method was extended to include a means of differentiating between eating habits at home and
work.
A question asking for customer views of food choice in the canteen was included as an open
question, aiming to yield information on healthy food choices but instead respondents made
comments about the foods they wanted to see on the menu, usually their favourite foods, and
made general complaints about the quality of the food provided.
To assess food knowledge, a list of 12 statements about food relating to fat, fibre and sugar
was included, asking respondents to state if they believed the statements to be true or false.
This led to some difficulties as the questions were not as clear cut as was originally thought.
These questions were omitted from the subsequent questionnaire to focus more on assessing
knowledge that one would expect to gain from exposure to the HBA scheme in the workplace.
This evolved to measure the respondent’s ability to differentiate between healthy and less
healthy options with respect to fat, dietary fibre and sugar.
In addition, it was decided that assessing attitudes to healthier eating and potential obstacles to
change was important, as several studies indicate that most individuals have an appreciation
of what a healthy diet is (e.g. Goode et al., 1995). Hence it was also important to understand
employee reasons for making food choices in the workplace canteen environment. As a
33

result, a new section was introduced to assess attitudes to food and health at work and in
general.
Second pilot
The questionnaire (see appendix 3.3) contained 5 parts which assessed: -
Part 1: meal type eaten at work, special dietary restrictions and eating behaviour using a FFQ.
Part 2: attitudes to dietary change and self perception of the diet.
Part 3: influences on food choice and general attitudes to healthier eating.
Part 4: knowledge about healthier eating.
Part 5: socio-demographic data.
The questionnaire was piloted at a community hospital which had expressed an interest in
working towards the HBA scheme. Both the hospital and catering manager were receptive to
being involved in the pilot study. The hospital is a small community hospital with
approximately 250 staff, with an estimated 50 employees using the canteen on a daily basis.
The researcher attended the site over a 2 hour lunchtime period and all canteen users were
asked to complete the questionnaire. One person refused, 48 questionnaires were distributed
and 36 were returned (a response rate of 75%). The researcher was available to respond to
any queries. Employees were also asked to answer a short list of questions asking for their
views on the clarity of the questionnaire (see appendix 3.4), the length of time it took them to
complete and how they thought it could be improved. The median time recorded to complete
the questionnaire was 10 minutes.
Changes resulting from the pilot included rephrasing one question to make it less ambiguous
to state: ‘which meals do you usually buy from the staff canteen?’ as some respondents who
brought in a packed lunch and ate it in the canteen had reported that they ate in the canteen,
even though they did not eat canteen food. The frequency of responses was also modified so
that a ‘every day I work’ category could be added to allow part-time staff who were working
only 1-2 days a week but choosing to eat in the canteen on all days worked could be
identified, this had been commented on by employees. It was decided to add in a category for
snacks/breaktimes.
A further question was added to evaluate what would have to change, if anything, to
encourage the respondent to eat more often in the canteen. This was added for two reasons,
34

firstly for respondents to ‘let off steam’ about their frustrations (if any) with the catering
service, as the pilot study had shown that employees wanted to do so. Secondly, the question
identified which factors influenced their reasons for choosing to eat in the canteen.
It was decided to change the question format of the question on special diets to allow easier
data collection with pre-coded responses. The information elicited would be the same but
respondents would not have to answer a question unnecessarily.
Twenty six food items were then listed and respondents were asked how often they ate the
foods with a response scale o f : ‘never’, ‘less than once a week’, ‘2-3 times a week’, ‘4-6
times a week’ and ‘more than once a day’ for foods consumed at home and at work. Almost
all respondents (35/36) filled in both the ‘at home’ and ‘at work’ columns without any
problems. As a result of the pilot some questions were modified, to ask about the type of food
chosen rather than frequency of consumption, for milk, bread, breakfast choice, spreading fat
and adding sugar to tea/coffee. This reduced the total number of questions with the remaining
frequency questions being asked as before, with an additional response of ‘daily’. Therefore
the response scale used in the final questionnaire had 6 categories ranging from ‘never’ to
‘more than once a day’.
Most respondents answered the questions assessing self reported fat, dietary fibre and sugar
intake properly and understood the response method. One ambiguity was that individuals
recorded that they had followed a ‘low fat diet’ for a ‘very long time’, which meant that they
could not be classified. It was decided to modify this for the actual study so that subjects had
to quantify their response in weeks, months or years. Changes in response after introduction
of the HBA scheme could then be identified. The next question in this section investigated
whether an individual had made any changes to their diet over the last 3 months, this was
modified as a result of the pilot to include a description of responses 2, 3 and 4, i.e. (2=quite
successful, 3=no change, 4=partly successful).
As a result of the pilot several of the attitudinal statements in part 3 of the questionnaire were
reworded for clarity and all were given the same 5 point Likert response scale (Likert, 1932)
as used in the final questionnaire. Three of the knowledge items were modified after the pilot:
macaroni cheese was replaced with the less ambiguous higher fat option of cheese flan; cheese
and coleslaw was replaced by coleslaw for the lower fibre option, as cheese did not contribute
35

to the fibre content of the meal; banana was replaced by pear for one of the lower sugar
options, due to the common stigma associated with bananas, as being a ‘high calorie’ food.
3.2.3 Final questionnaire
The final questionnaire (appendix 3.1) consisted of 5 parts: Part 1: meal type eaten at work,
special dietary restrictions and eating behaviour using a FFQ; part 2: attitudes to dietary
change and self perception of the diet; part 3: influences on food choice and general attitudes
to healthier eating; part 4: knowledge about healthier eating; part 5: Socio-demographic data.
All questions were closed except for 1 open question in part 1. Leading questions were
avoided and questions kept as simple and jargon-free as possible. There were opportunities in
some closed questions for respondents to answer in an ‘other’ category, where it was not
possible to include, or think of, every response. The pilot studies had identified where
category responses were missing. An introduction with explanatory notes was included on the
front cover, plus details of how to contact the researcher. A coding guide was constructed
providing a guide to the meaning of numerical responses as questions were pre-coded to aid
data entry.
The parts of the questionnaire will be discussed in turn:
Meal type eaten at work, use of the canteen and special dietary restrictions (Part 1)
Respondents were asked how often they used the canteen and which meals they usually ate
(responding on a 4 point scale of ‘never/rarely’, ‘ 1-2 days/week’, ‘3-4 days/week’, ‘5 or more
days/week’). Employees were also asked how often they had their ‘main meal’ of the day at
work and how often they brought a packed lunch to work (responding on the same 4 point
scale described above).
An open question was included asking if there were any factors that would encourage them to
eat canteen food more often. Responses were categorised into 18 different possibilities with
the most frequent responses recorded of ‘nothing/no reason’, ‘more variety/choice’, ‘lower
price’, ‘more fresh food/improved quality’, ‘if worked different hours’, ‘location of canteen’,
‘opening times of canteen’, ‘if had more time’, ‘more healthy food’ and the other responses
were grouped together as ‘miscellaneous reasons’.
Lastly respondents were asked if they followed a ‘special’ diet at all as this could influence
their food choice (with 6 possible responses of ‘vegetarian’, ‘diabetic’, ‘cholesterol lowering’,
36

‘vegan’, ‘weight reducing’, ‘pregnant/lactating’, plus space to record if their special diet was
in an ‘other’ category).
For cross tabulation purposes respondents were regrouped into ‘those who ate lunch at least
one day per week’ and ‘those who never ate lunch in the canteen’. Main meal consumption
was reclassified into ‘those that ate their main meal at least one day per week’ and ‘those who
never ate their main meal at work’. Packed lunches were regrouped into ‘those who brought a
packed lunch at least one day per week’ and ‘those who never brought a packed lunch’.
Assessing eating behaviour using a FFQ (Part 1 continued)
Sixteen food items/groupings were listed and respondents were asked to record how often
they ate the foods on a scale of: ‘never’, ‘less than once a week’, ‘1-3 times a week’, ‘4-6
times a week’, ‘once a day’ and ‘more than once a day’ for foods consumed at home and
work.
In addition, 5 questions were included to ask about the ‘type’ of food chosen at home and
work. The first asked about type of milk with 6 different responses of ‘semi-skimmed’,
‘skimmed’, ‘whole’ (included condensed or evaporated milk), ‘milk substitute’, ‘Soya milk’
and ‘do not drink milk’. These were regrouped into ‘semi-skimmed’, ‘skimmed’, ‘whole’ and
‘miscellaneous milk group’, the latter included respondents that consumed a mixture of types
of milk, milk substitute, Soya milk and those who did not use milk. The miscellaneous milk
group was excluded from cross-tabulation with socio-demographic variables to investigate the
distribution of responses in the 3 main types of milk consumed. The 3 main types of milk
consumed were also classified as ordinal data to assess if there had been any change in a
negative/positive direction.
Respondents were asked about the usual type of bread/chapattis they ate with 5 possible
responses of ‘hardly ever eat bread/chapattis’, ‘white bread/number 1 chapatti flour’, ‘a
mixture of types’, ‘brown/high fibre white bread/number 2 chapatti flour’ and
‘wholemeal/granary bread/number 3 chapatti flour’ (the latter 2 groupings were deemed
appropriate due to similar dietary fibre content). To increase power for cross-tabulation
purposes, ‘a mixture of types of bread’ and ‘brown/high fibre white bread’ were grouped
together with the assumption that the mean dietary fibre content of each category was
comparable.
37

Choice of spreading fat on bread/chapattis was investigated, with 6 groups listed, i.e. ‘low fat
spread’, ‘butter/butter based spreads’, ‘polyunsaturated margarine’, ‘other type of margarine’
(not polyunsaturated), ‘do not use any’ and ‘don’t know’. Employees sometimes indicated
that they regularly consumed more than one type of product, therefore a new category of a
‘mixture of types’ was created for coding purposes. Those who recorded a ‘mixture of types
of spreading fat’ and ‘other types of margarine’ were merged to form a ‘miscellaneous
spreading fat’ group. For cross-tabulation with socio-demographic factors, the 4 categories of
‘other type of margarine’, ‘do not use any’, ‘don’t know’ a ‘mixture of types’ were excluded
from analysis to investigate the distribution of responses in the 3 main types of spreading fat
consumed.
Lastly respondents were asked whether they added sugar, honey or gur (a type of sugar often
used in the Asian community in Leicester) to tea/coffee. There were 6 response categories of
‘do not add any sugar’, ‘1 teaspoon’, ‘2-3 teaspoons’, ‘more than 3 teaspoons’, ‘use an
artificial sweetener’ and ‘never drink’. These were reclassified into 4 groups of ‘do not add
any sugar’, ‘1 teaspoon sugar’, ‘> 1 teaspoon sugar’ and ‘use an artificial sweetener’. The 2
groupings of ‘ 1 teaspoon sugar’ and ‘> 1 teaspoon sugar’ were merged for cross-tabulation
purposes to form a new category of ‘add sugar >1 teaspoon’. Those who ‘never drank
tea/coffee’ (ranged from 0.9-1.9% of the study population) were excluded from further
analysis and were coded as not applicable.
Assessing attitudes to dietary change, self perception of the diet and influences on food
choice (Parts 2 and 3)
All questions in part 2 of the questionnaire and 10 of the 21 statements in part 3 were
measures used in the Working Well project (Glanz et al., 1993) to assess psycho-social factors
relating to eating patterns in the workplace. Glanz et al. classified the statements using 3
domains of psycho-social factors influencing dietary behaviour: predisposing, enabling and
change related factors. Table 3.1 illustrates the items chosen for measuring these factors,
highlighting those statements previously used by Glanz et al. The further 11 statements were
developed using the same framework for classifying and describing the data and were
included in part 3 of the questionnaire. Considerations made in developing the additional
attitudinal questions are discussed in section 2.13.
38

Table 3.1: Items for measuring psycho-social factors influencing dietary behaviour Predisposing Belief in diet-disease connectionfactors Eating a lot of fruit and vegetables decreases my chances of developing heart disease**
Eating a lot of fried foods increases my chances of developing heart disease**Perceived benefits of a healthy dietWhat I eat is one of the most important things for my health*Eating a healthy diet is very important to me*It’s important that healthy food choices are available at work*Healthy food tastes good*KnowledgeIdentification of low fat, low sugar and high fibre foods from a choice of pairs provided** Awareness of the content of current general nutrition guidelines***
Enabling factors Perceived barriers to healthy eatingThe available information on healthy eating is easy to understand*I find that there are a lot of conflicting messages around concerning a healthy diet*There is a lot of information on healthy eating where I work*At my workplace it’s easy to eat a healthy diet*At work, the cost of food influences what I eat***For me, the way in which food is presented at work influences my food choice***At work I choose foods to improve my mood***At home, the cost of food influences what I eat***I need something quick to eat at work***At work, I tend to eat similar foods most days***Social supportI get a lot of encouragement for eating a healthy diet from my co-workers**I get a lot of encouragement for eating a healthy diet from my close friends and family**
Change related Self-rated dietfactors I tend to have a healthy diet at work***
I tend to have a healthy diet at home***How high in fat/ fibre /sugar is your diet?*How long have you followed a diet low in fat/sugar? *How long have you followed a diet high in fibre?*Behavioural intentions to change dietOver next 3 months do you plan to cut down on fat/ sugar?*Over next 3 months do you plan to eat more fibre?*Self-efficacy for changing dietI feel confident that I know what foods I should be eating to have a healthy diet*** Reported eating habit changes- attempts and successes.Have you tried to lower fat/sugar intake in last 3 months?*How successful were you in making changes?*Have you tried to increase fibre intake in last 3 months?*How successful were you in making changes?*I am currently trying to lose weight***
Changes resulting from the introduction of the HBA scheme (stage 2 only)What are respondents perceived changes in overall consumption of 16 key food items***
__________________Has your diet changed as a result of the introduction of the HBA at home or work?**** Questions used the same as those by Glanz et al., 1993; ** Questions used similar to those proposed by Glanz et al., 1993; *** Questions developed for this study.
Assessing attitudes to dietary change and self perception of the diet (Part 2)
This section considered how respondents evaluated their own diets for fat, fibre and sugar
content. These were chosen to focus on the HBA scheme objectives to reduce CHD. From a
nutrition education perspective it is important to know how individuals perceive their diets.
39

The aim of these questions was to identify employees who were influenced by the HBA and
who intended to change over the next 3 months.
The same questions were asked for fat, fibre and sugar, for example for fat, employees were
asked ‘How high in fat is your overall diet?’ (with 5 possible responses of ‘very high’, ‘high’,
‘average’, ‘low’ and ‘very low’). If respondents answered ‘very high’, ‘high’ or ‘average’ for
fat/sugar or ‘low’ and ‘very low’ for dietary fibre, employees were asked if they had tried to
change their dietary behaviour. If they answered ‘low’ and ‘very low’ for fat/sugar, or ‘very
high’, ‘high’ or ‘average’ for dietary fibre they were asked to state how long they had followed
such a diet (in weeks/months/years) so that if a person changed after introduction of the HBA
scheme, this could be identified.
The next question in this section investigated whether an individual had made any changes to
their diet over the last 3 months and was answered only by respondents who had answered
that their diet was in need of change as identified above. If employees responded that they
had tried to change their diets, they were asked how successful they had been in making these
changes, with possible responses of: l=extremely successful, 2=quite successful, 3=no
change, 4=partly successful, 5=not successful. They were then asked if ‘Over the next 3
months do you plan to cut down on fat?’ (responses were: l=definately yes, 2=possibly,
3=don’t know, 4=probably not, 5=definately not). Additionally the length of time that
individuals had recorded that they had ‘followed’ a diet either low in fat or sugar, or high in
fibre was grouped in months, to simplify analysis.
Assessing influences on food choice (Part 3)
Additional items to those used by Glanz et al., (1993) were created to investigate the influence
of the cost of food, the importance of mood, presentation of food at work and the need to eat
something quick at work. Questions were also added relating to influences on food choice at
home, as it was decided to measure any changes in attitudes at home. The 21 statements
required responses on a 5 point Likert scale from ‘strongly agree’ to ‘strongly disagree’
(Likert, 1932). The statements used were selected because they were consistent with the goals
of the HBA and were amenable to change by the scheme.
Assessing knowledge of healthier eating (Part 4)
This part of the questionnaire investigated knowledge of healthier eating to assess if it
changed over the period of investigation. It measured whether the HBA scheme improved
40

knowledge in relation to understanding of the healthier food choices available; and of general
healthy eating guidance. The questions developed were directly related to what one would
expect users of the canteen to learn: could the individual as a result of the HBA scheme be
able to go into another catering premises and choose a healthy choice if it was unlabelled?
Questions assessing ability to select healthier food options were based on the same principle
as those used by Glanz et al., (1993), but pairs of foods were used that complied with the
goals of the HBA scheme and were culturally appropriate to the UK.
Respondents were tested about their understanding of which foods were the lowest in fat and
sugar and those highest in dietary fibre from a pair of foods chosen. The food items were
chosen from those currently recommended as healthier alternatives by the team of community
dietitians operating the HBA scheme. Food items were preceded by ‘if you were trying to
choose more low fat/low sugar/high fibre foods, which would you select in the following
pairs?’ Table 3.2 summarises the pairs chosen. Responses were recorded as either ‘correct’,
‘incorrect’ or ‘don’t know’. Justification of the correct responses is included in table 3.2, the
amount of each nutrient was calculated using standard portion sizes (Crawley, 1988) and by
consulting food composition tables (Holland et al, 1997).
A further question was added after the pilot to assess awareness of current recommendations
(Department of Health, 1991) on consumption of fat, sweets and chocolate, sugar, starchy
foods; fruit and vegetables and fried food. It was decided to add this question to elucidate
information on respondents general knowledge on nutrition guidelines, which was thought to
be important as well as specific knowledge of food choices. Although the question was not
piloted in a workplace setting, it had been used successfully in another study carried out in
Leicestershire (Goode et al., 1995) with 421 respondents. Use of the same question also
allowed comparison of results with this previous study.
41

Table 3.2: Pairs of foods chosen to assess respondents’ knowledge of healthier food choices
‘If you were trying to choose more low shepherds pie and
Standard g of nutrient portion size (g)120 11
fat foods, which would you select from peas 25 0the following pairs because it was lower in fat?’
orCornish pasty and 170 40.5roast potatoes 120 5.8
cheese flan and 120 33.7salad* 87 0ortuna, 120 1.6bread roll and 40 2.6salad* 87 0
stewed apple and 150 6.6custard 150 6.6orapple pie and 120 15.7custard 150 6.6
‘If you were trying to choose more chilli con came and 280 6.6high fibre* foods, which would you rice 180 0.1select from the following pairs because it was higher in fibre?’
ormince beef pie and 200 4.5chips 150 16.4
baked beans and 150 9.5jacket potato 150 2.7orcoleslaw and 60 5.3jacket potato 150 2.7
rhubarb crumble and 170 7.8custard 150 25.2orjam tart and 80 1.3custard 150 25.2
‘If you were trying to choose more low pear 150 0#sugar** foods, which would you select from the following pairs because it was
ormuesli bar 33.3 7.2
lowest in sugar?’diet coke 330 0ormilkshake 300 4.2
* Salad assumes 30g of lettuce, 23g of cucumber and 34g of tomato. Figures for dietary fibre were calculated according to those produced
from the Englyst method of analysis (Holland et al., 1997).
** Data used for sucrose content, as data for non-milk extrinsic sugars are unavailable.
# unknown nutrient value, therefore treated as a zero.
42

Assessing socio-demographic data (Part 5)
Demographic variables were measured: age, gender, ethnicity, Body Mass Index (BMI),
whether employees were currently trying to lose weight and whether they worked full
time/part time. Age was reclassified into 2 age groups of <45’s and >45 and social class was
arranged into 2 social class groups comprised of group 1(1 professional, II managerial and HI
Non manual) and group 2 (HI Manual, IV Non skilled and V Voluntary). Social class was
coded from respondents self report occupation using Standard Occupation Classification
(OPSC, 1991). The groups were arranged so that the latter group consisted of the target socio
economic group (section 1.2.2).
BMI was assessed from self reported weight/height and data was classified into 5 groups
based on the Garrow scale (Garrow, 1983) of: Group 0= BMI <19 (underweight), Group
1=BMI 20-25 (ideal weight), Group 2= BMI 26-30 (overweight), Group 3= BMI 31-35
(obese), Group 4= BMI >36 (severely obese). Three groups were defined for cross-tabulation
purposes o f : Group 0= BMI <19 (underweight), Group 1=BMI 20-25 (ideal weight), Group
2= BMI >25 (overweight/obese). There were however so few respondents in group 0 that they
were coded as missing in this situation and only results for groups 1 and 2 are presented.
3.2.4 Stage 2 questionnaire
Stage 1 and 2 questionnaires were almost identical to facilitate statistical comparison. There
were however additional questions used at stage 2 (appendix 3.5) Employees were asked if
they were eating ‘more’, ‘less’ or the ‘same’ number of times a list of 16 food items/groups as
they did 12 months ago, which was before their workplace had received the HBA. These
questions were added at the end of the food frequency questions. The list of foods used were
the same as those used in the food frequency questions, allowing verification of the responses
recorded for food frequency at the 2 stages.
At the end of the questionnaire a section was also added specifically about the HBA, asking if
respondents were aware of the award in their workplace and if they had noticed different
means to promote the scheme in the canteen, from a list provided (symbols highlighting
healthy food choices, posters, leaflets, cards on tables and drink mats). Employees were asked
how often they chose the highlighted healthy meal (with 4 possible responses of
‘never/rarely’, ‘1-2 days/week’, ‘3-4 days/week’ and ‘5 days or more/week’) and if they found
the highlighting of healthy food choices to be ‘very useful’, ‘useful’ or ‘not useful’.
Customers were also asked if the introduction of the HBA scheme at work had changed their
43

diet at home or at work, with 6 possible responses of: ‘yes my diet is a lot healthier’; ‘my diet is
slightly healthier’; ‘ I do not think my diet has changed because I already follow a healthy diet’;
‘I do not think my diet has changed because I am not concerned about healthy eating’; ‘I think
my diet is less healthy now’; and finally there was an open space for ‘any other reason’. Lastly
employees were asked if they would find a diet and exercise group; labelling of the calorie
content of foods in canteen; and/or a slimming group at work useful.
3.2.5 Selecting workplaces to be involved in the study
Workplaces in Leicestershire applying for the HBA for the first time between October 1994
and December 1995 were identified by the appropriate community dietitian and asked to
participate in the study by letter (see appendix 3.6).
3.2.6 Administering the questionnaire for the actual study
The first stage questionnaire was administered in the workplace as soon as could be
practically arranged after the community dietitian responsible knew that the premises was
applying for the HBA. The questionnaire was administered before the workplace had made
any changes to meal provision. It was administered to all users of the canteen (including
catering staff) who worked at the site on the day(s) attended by the researcher. Employees
were asked to return completed questionnaires to a sealed box that was held in the canteen or
by post with a pre-paid envelope. The researcher attended the day(s) that were most
convenient to the workplace.
As respondents were asked to give their names, those staff who were not present or who did
not return a completed questionnaire were identified using a list of all employees provided
from personnel departments. A copy of the questionnaire was sent on to them, with a signed
letter (see appendix 3.7) explaining the purpose of the study with a pre-paid envelope. If they
had not replied to the questionnaire within 6 weeks of receiving it, a reminder letter (appendix
3.8) and another copy of the questionnaire were sent. Employees either completed the
questionnaire in work time or over lunch time.
Six months after the workplace had received the HBA, a second stage questionnaire was sent
with an explanatory letter (see appendix 3.9) to all staff who had completed the first one.
Those who had remained anonymous at the first stage were unable to be followed up. Again,
a pre-paid envelope was provided. Each of the first stage completed questionnaires were
allocated a serial number and the second stage questionnaires were given a corresponding
44

number to allow respondents to be identified without relying on them giving their name a
second time. Reminder letters and a second copy of the questionnaire were sent if employees
had not responded within 6 weeks.
3.2.7 The comparison group
Some of the premises applying for the HBA were unsuccessful in receiving the award. They
became a comparison group for the study. Questionnaires were administered at 2 stages, the
first stage questionnaire was administered in the workplace as described above (section 3.2.6);
the second stage questionnaire was administered 6 months after the workplace withdrew its
HBA application.
3.2.8 Validity issues
Traditional criteria forjudging confidence and applicability of findings of research are
difficult to measure from a health promotion perspective (Boonekamp et al., 1995). The main
purpose of the longitudinal survey in this study was to be able to make valid inferences about
whether the study has had any significant net effects.
Face validity and Content validity
The questionnaire items were deemed to have face validity and content validity by the team of
State Registered Dietitians implementing the HBA scheme. Additionally the questionnaire
was pre-tested and piloted twice in a population similar to the main sample to ensure that
questions were properly understood. Ambiguous questions were therefore identified as
described earlier in section 3.2.2.
Construct validity
Analysis of the food frequency data by socio-demographic variation produced results one
would expect from previous studies. In addition, the responses for knowledge of current
nutrition guidelines were almost identical to those reported in a study of dietary practice in the
1990’s (Goode et al, 1995). Both these findings indicate a measure of construct validity.
Criterion validity
Unfortunately there was no gold standard to compare the FFQ with, making it impossible to
validate the questions by comparing it with another method. This has been described as a
major problem for validation of dietary studies (Koepsell et al., 1992). Validity with a
quantitative dietary assessment technique was not necessary as the data was not being used to
45

estimate nutrient intake (Kemm and Booth, 1992) and internal validity was ensured as
comparative individual change was restricted to within the study. If estimates of nutrient
intake are derived from food frequency data it is essential that the methods of estimation
should be validated on the populations in which they are to be used (Margetts and Nelson,
1997).
Reproducibility
As individual diets vary daily, weekly and seasonally the concept of being able to produce the
same result on 2 different occasions does not really exist with respect to dietary behaviour.
However in retrospect it could have been possible to perform a test-retest on a workplace
sample to assess if the questionnaire produced the same result on the 2 different occasions for
eating behaviour, as well as attitudes and knowledge.
3.2.9 Independence of evaluatorAlthough the author was employed by the Leicestershire Nutrition and Dietetic Service, she
did not have any operational input to the HBA scheme during the period of the study. The
evaluation was carried out under the auspices of the University of Leicester. The importance
of evaluations being conducted externally, i.e. the evaluator not being directly involved or
employed in the programme evaluated has been highlighted before (Rossi and Freeman, 1993;
Oshaug, 1994).
3.2.10 Data processing
The data from the questionnaires were coded, inputted and verified by 2 different operators
using Statistical Package for the Social Sciences Data Entry programme. Cases were put in
order and all missing data was defined, which was particularly important for the questions
which composed the dietary indices (see section 3.2.12). Respondents with missing data in
any of the variables that constitute the indices were not assigned a score but re-scored as
missing data, as any missing part of their index would have skewed the data. Syntax was
developed as above for stage 1 and stage 2 questionnaires so that both files could be merged
into 1 data set, so the variable names were almost identical but with one integer different in all
cases to differentiate stage 1 and 2 data. The syntax described above was run for stage 1 and
stage 2 surveys (with change variables run only at stage 2).
46

3.2.11 Analysis o f the questionnaire
The data generated by the surveys were analysed through the use of cross-tabulations and
descriptive statistics using the Statistical Package for the Social Sciences (Norusis, 1993).
Baseline data (first stage) were compared to data at the second stage to assess the impact of the
HBA on eating habits, attitudes and dietary knowledge. Differences were considered
statistically significant at the p<0.05 level.
Data were analysed for employees in successful HBA sites who replied at both stages only,
using paired analyses. As the principal research question was to investigate change in the
HBA sites, data were only analysed in the unsuccessful sites (the comparison group) when a
change in response was detected in the HBA sites, to assess if this could be attributed to the
intervention. In addition, differences in response by socio-demographic groups were only
reported when a change in sub-groups was observed. Cross-tabulations with socio-
demographic variables were performed to investigate differences in behaviour, specifically
where this could answer research questions in relation to change.
The questionnaire collected mostly ordinal data, e.g. ‘at my workplace it is easy to eat a
healthy diet’ with responses from ‘strongly agree to strongly disagree’. The Wilcoxon Signed
Rank test was used to assess change in all the food frequency questions and all the statements
relating to attitudes. The use of non-parametric statistical tests is necessary as the attitudes
statements and food items were not normally distributed, which is often the case with food
frequency data (Oshaug et al., 1995).
The McNemar test was used with nominal data to compare change/differences in variables,
although they had to be dichotomous (Bland, 1996). When this non-parametric test was used,
variables were transformed to be dichotomous to study change, e.g. comparison of skimmed
milk consumption with consumption of all other types of milk in one group, hence it was used
to assess change in consumption of food types.
The chi squared test for association/cross-tabulations was also used to test the null hypothesis
that there was no relationship or association between 2 independent variables. The chi-
squared test is not an index of the strength of the association. In some of the study data there
were more than the required number of empty cells, (i.e. test is valid if at least 80% of the
expected frequencies exceed 5 and all the expected frequencies exceed 1- rule (Bland, 1996).
47

When the criterion were not satisfied, i.e. the sample was too small, rows and columns were
combined or deleted to give bigger expected values.
3.2.12 Developing dietary indices to assess general changes in eating behaviour
In addition to describing dietary behaviour in terms of food type and frequency of
consumption, indices were developed to facilitate a description of eating behaviour in broader
terms. The purpose of the indices was to summarise the data more succinctly and to compare
the findings with other variables in the workplace survey. As it is overall diet that is
important to health, rather than the intake of specific foods, a composite indicator of diet was
thought to be useful in distinguishing more clearly between changes in eating patterns in line
with current guidelines.
After considering previous scoring systems used (refer to section 2.12), indices were
developed incorporating similar principles to those used previously (Smith and Smith, 1994;
Davenport et al, 1995; Dowler and Calvert, 1995). Indices were developed for fat, dietary
fibre and sugar, plus an overall healthy diet index. These were chosen to measure the
nutrition goals of the HBA Scheme. A full list of foods contributing to the indices can be
found in Table 3.3.
Table 3.3: Food items used to construct dietary indices* at home and work
Fat index (Maximum index=18; derived from 9 items)
Type of milk
Type of spreading fat
Frequency of consumption of processed meats, hard full fat cheese, sweets/chocolates, sweet
biscuits/cakes, crisps, fried food, puddings, e.g. fruit pies.
Fibre index (Maximum index=10; derived from 5 items)
Type of bread
Frequency of consumption of baked beans/pulses, fruit, vegetables, bread/rice/pasta/potatoes
Sugar index (Maximum index=10; derived from 5 items)
Amount of sugar in drinks, frequency of consumption of sweets/chocolates, puddings, sweet
biscuits/cakes, sugary drinks.
Healthy diet index
The fat, fibre and sugar indices were scaled out of 100, summed together and divided by 3.
*A higher score indicates eating in line with current guidelines.
48

A maximum of 2 points was given for a response that met the nutrition guidelines based on
recommendations in the Leicestershire Food and Nutrition Policy (Holdsworth, 1994). For
example, 2 points were given if fruit was eaten more than once a day, (meeting the guideline);
1 point was given when a response indicated a shift towards healthier eating but not reaching
the guidelines, (e.g. eating fruit between 1-6 times a week) and no points were given if the
response indicated that the individual had a long way to go before meeting the guideline, (e.g.
eating fruit never or less than once a week). The 4 questions on food type rather than
frequency of consumption (bread, spreading fat, milk and addition of sugar to tea/coffee) were
also given a score range of 0, 1 or 2 using the same assumptions of meeting the nutrition
targets as above. If the respondent did not consume milk, spreading fat, bread or drink
tea/coffee, they were given the mean score of 1, so as to avoid distorting the results (Table
3.4). For ease of presentation and interpretation, the scales were adjusted so that a higher
score indicates eating in line with current guidelines.
Differences in indices were investigated before and after implementation of the HBA and
within socio-demographic groups. Indices were transformed into continuous variables by
scaling them up to 100, thereby standardising scales. It was essential that the indices were
scaled up to 100%, so that they could be compared with each other. Scaling also meant the
healthy diet index was equally composed of sugar, fat and fibre indices, as fat had contributed
18 points, compared to 10 points from both fibre and sugar.
Change variables
To further investigate the observed changes in the study sample, change variables were
created. The new change variable equalled the difference between the index at stage 2 and at
stage 1. The change variables were used to assess the overall distribution of any observed
change for indices and for food items. Socio-demographic differences in relation to change
were also investigated.
49

Table 3.4: Scores contributing to developing dietary indices
Never <l/wk
Food frequency
1-3 times/wk 4-6 times/wk 1/day >l/day
Fat index
Processed 2 2 1 1 0 0
meats
Full fat cheese 2 2 2 1 0 0
Confectionery 2 2 ' 1 1 0 0
Sweet biscuits/ 2 2 1 1 0 0
cakes
Crisps 2 2 1 2 0 0
Fried food 2 2 1 1 0 0
Puddings 2 2 1 1 0 0
Fibre index
Baked 0 0 2 2 2 2
beans/pulses
Fruit 0 0 1 1 2 2
Vegetables 0 0 1 1 2 2
Starchy foods 0 0 1 1 2 2
Sugar index
Confectionery 2 2 1 1 0 0
Sweet biscuits/ 2 2 1 1 0 0
cakes
Puddings 2 2 1 1 0 0
Sugary drinks 2 2 1 1 0 0
Milk* Skimmed Semi skimmed
Food types
Whole milk Milk substitute Soya milk Do not use
2 2 0 0 1 1
Spreading fat* Low fat Polyunsaturated Butter Mixture of Margarine Do not use
spread
2
margarine
1 0
types
1
(other types)
0 1
Bread** Wholemeal Brown/ high White Mixture of Rarely eat
Addition of
/granary
2
Do not add
fibre white
2
1 teaspoon
1
> 1 teaspoon
types
2
Artificial
1
Never drink
sugar to
tea/coffee***
any
2 1 0
sweetener
2
tea/coffee
1
* Contributes to fat index; ** Contributes to fibre index; ***Contributes to sugar index Starchy foods group consists of bread, pasta, rice, potatoes and chapattis.
50

3.3 Audit of food provision
Besides the 4 workplaces in the main study where the employee survey above was carried out,
a further 19 premises were identified for the audit of food provision and the caterers
interviews (section 3.4). Details of premises were extracted from the Leicestershire HBA
database (Health Promotion Centre) as having received the HBA either for the first time or on
a renewal basis within the previous 12 months, and had held the award for at least 6 months.
The designated period for data collection was November 1995- February 1996 inclusive.
Caterers responsible for implementing the HBA scheme were asked during a face-to-face
interview for the information included in the background questionnaire (appendix 3.10) and
the HBA checklist (appendix 3.11). Data were collected by interviewing the caterers and
verifying the data by observing food provided.
The background questionnaire asked about: the length of time the establishment had held the
award; the average number of meals served daily; the length of the menu cycle; whether there
had been any changes in uptake of meals/foods; the methods used to market healthy food
choices; and the approximate percentage of total sales of healthy food choices. The questions
on methods of marketing nutrition and the percentage of total sales of healthy choices were
the same as those used in an earlier study (Sneed and Burkhalter, 1991).
The HBA Checklist was developed by the Leicestershire Nutrition and Dietetic Service and is
used by community dietitians to assess if menus of HBA applicants meet nutrition criteria.
This was developed after the award was devolved to local level. Criteria were quantified
firstly to allow premises to be audited against award criteria, and secondly to introduce a
uniform standard amongst dietitians when advising HBA applicants. The nutrition criteria are
therefore specific to Leicestershire. The checklist firstly assesses the meal service provided,
followed by canteen provision of the following foods: milk, fat, bread, sauce, cheese, meat,
fish, eggs, vegetable dishes, potatoes, rice/pasta/chapattis, flour in baking, pulses, jacket
potato fillings, sandwich fillings, puddings, drinks and snack items. There are 34 nutrition
criteria in total. Food provision was assessed in order to check if all nutrition criteria were
being met.
3.4 Caterers interviews
In addition to the above food audit, caterers were also interviewed to explore their views on
the HBA scheme. Data collection was by face-to face tape-recorded interviews lasting 40-60
minutes, guided by an interview schedule (appendix 3.12) with catering managers who were
51

responsible for implementing the HBA scheme. The interviews were conducted by 3 different
researchers, none of whom had an operational input to the HBA scheme during the period of
the study. In depth interviews are useful to carry out with key informants (Israel et al, 1995),
in this study they were used with community dietitians and caterers. Their insights can be
useful to illuminate any problems and develop hypotheses for further investigations.
All interviews were tape recorded, fully transcribed onto a word processor and analysed by
sorting the verbatim material into emergent thematic categories. During this process a
thematic framework was constructed, drawing upon the interview schedule, emergent issues
raised by respondents, and analytical themes arising from the recurrence of particular
views/experiences. All the data were read and annotated according to the thematic
framework. This process of analysing qualitative data has been described by several authors
(e.g. Dey, 1993; Ritchie and Spencer, 1994; Breakwell et al., 1995).
3.5 Survey of customers’ views in public eating places
Premises in Leicestershire open to the public receiving the HBA between 1990-1994 were
invited to participate in the study. A self-completion, structured questionnaire (appendix
3.13) was administered to customers who used the catering facilities during the day the
researcher visited the establishment. It was considered important to assess as many customers
as possible to give an indication of who the scheme reaches in public establishments. The
target respondents were all customers who used the establishment on the day attended by the
researcher. Completed questionnaires were either returned to a sealed box in the
establishment or by post in a pre-paid envelope. The researcher attended the day that was
most convenient to the proprietor and was present for the whole opening hours period during
the day time. The data were collected in Autumn 1995.
The questionnaire had been piloted previously in a public eating place for acceptability and
clarity with 23 customers, and was revised in the light of their comments. Reliability of the
questionnaire was not formally tested as an index/scale was not developed for future use.
However, questionnaire items were determined to have face validity by the team of dietitians
and HPO implementing the scheme.
The questionnaire assessed the following: customer response to the HBA scheme; their
knowledge of the scheme criteria (correct and bogus criteria were listed and the respondents
were asked to tick those which applied), whether they knew the establishment had the HBA
52

(yes/no response) and what influenced their choice of eating place (a list of responses was
provided for them to choose). The list, which was selected by reviewing the literature
comprised: quality of food, affordable prices, location, availability of healthy choices, good
service and variety of choice.
Customers’ perceptions of their diet in terms of fat, fibre and sugar content was self rated on a
five point scale of ‘very high’, ‘high’, ‘average’, ‘low’ and ‘very low’. For the purpose of this
study these were reclassified into 3 categories of ‘very high/high’, ‘average’ and ‘low/very
low’. Customer attitudes to healthier eating were assessed using attitude statements
developed as part of the workplace survey. The statements had a 5 point Likert scale (Likert,
1932) format ranging from ‘strongly agree’ to ‘strongly disagree’, these were also reclassified
into 3 categories, i.e. ‘strongly agree/agree’, ‘neither agree/disagree’ and ‘strongly
disagree/disagree’. Respondents were asked how they thought healthy food choices compared
to other choices in terms of price and were asked to respond as either ‘more expensive’, ‘less
expensive’, ‘about the same’ or ‘don't know’. They were also asked if, in their opinion, the
eating place allowed them to choose healthy meals and snacks with a yes, no or don't know
response.
Customer knowledge of current nutrition guidelines relating to the recommended intake of
starchy foods, fruit and vegetables, fried foods, sweets and chocolates, fat and sugar was
assessed using questions developed as part of the workplace study. Customers were asked to
indicate whether people should generally eat more, less or the same of those food items.
Demographic variables were measured: age (reclassified into 2 age groups of <45’s and >45);
gender; living situation (live alone/with partner/other); ethnicity; and social class was coded
from respondents self report occupation using Standard Occupation Classification (OPSC,
1991), this was arranged into 4 social class groups comprised: group 1-1 Professional and n
Managerial, group 2- HI Non-Manual, group 3- III Manual, group 4- not working (combines
retired/unemployed) as sample size was not large enough to facilitate analysis with 6
groupings). Exposure to educational material used to promote the HBA was not assessed.
Data were analysed using the Statistical Package for the Social Sciences (Norusis, 1993) using
uni-variate statistics and the chi-square test of independence to assess differences between
groups. The purpose of the analysis was to describe the overall response to the HBA and
53

assess differences in groups, i.e. age group, gender and social class group. Differences were
considered statistically significant at the p<0.05 level.
3.6 Community dietitians views of the HBA scheme
A focus group was conducted in February 1996 with the team of 5 community dietitians
implementing the HBA scheme in Leicestershire to explore their views and reservations about
the scheme. Focus groups can provide further information to interviews as the group
processes allow for interaction between participants, enriching the data. Focus groups have
been referred to as an excellent method for process evaluation (Israel et al, 1995). The
discussion guide is included in Appendix 3.14. The focus group was followed up with
individual interviews between September and November 1996, with the 5 community
dietitians above. The purpose of the individual interviews was to investigate dietitian’s views
of the HBA they had implemented in the workplace (from those in the longitudinal study) and
to explore in more detail individual views, using an interview schedule as a guide (appendix
3.15). The focus group discussion and individual interviews were tape recorded and fully
transcribed, for sorting into emergent thematic categories, as described above in section 3.4.
54

CHAPTER 4: RESULTS OF LONGITUDINAL SURVEY OF
EMPLOYEES
4.1 Response rates
Of the 8 eligible workplaces, 6 agreed and 2 refused to be involved. Those participating
comprised 1 psychiatric hospital, 1 community hospital, 1 shoe manufacturer, 1 retailer/
department store, 1 head office of a crisp manufacturer and 1 service industry. Data were
analysed for the 4 establishments which were successful in achieving the HBA (1 service
industry, 1 psychiatric hospital, 1 community hospital and 1 head office of a crisp
manufacturer), and 2 which were unsuccessful (1 shoe manufacturer and 1 retailer/department
store). The unsuccessful sites were combined to form a comparison group. Table 4.1
illustrates the variation in size of workplace and response rates.
Table 4.1: Response rates for all workplaces
Excluded from stage 2Number of employees
Stage 1 response rate
Anonymousresponders
No longer employed
Stage 2 response rate**
N % N % N %* N %HBA premisesService industry 459 258 56.2 6 2.3 86 33.3 60 36.1
Head office of crisp 102 84 82.3 3 3.6 23 27.3 33 56.9manufacturer
Psychiatric hospital 605 358 59.2 31 8.7 23 6.4 237 77.7
Community hospital 252 188 74.6 15 8.0 27 14.4 123 84.3
Total 1418 888 62.6 55 6.2 159 17.9 453 73.2
Comparison premises Retailer/department store 163 98 60.1 7 7.1 18 18.4 36 49.3
Shoe manufacturer 364 167 45.8 6 3.6 36 21.5 88 70.4
Total 527 265 50.3 13 4.9 54 20.4 124 62.6*As a percentage of those who responded at stage 1.
**Response rate at stage 2=(number of respondents at stage 2)/(number of respondents at stage l)-(anonymous responders + those who were
no longer employed).
4.1.1 Workplaces with the HBA
Overall a total of 1418 employees were sent questionnaires (Table 4.1), of which 888
employees returned questionnaires at stage 1 (overall response rate of 62.6%). Of these
employees, 453 responded at stage 2 (overall response rate of 73.2% of 619 possible
55

employees). Some respondents (n=159) were no longer employed at the second stage, and 55
of those who had responded at stage 1 had done so anonymously, so it was not possible to
follow up these 214 employees, reducing the sampling frame from 833 to 619.
4.1.2 Comparison workplaces
Overall a total of 527 employees were sent questionnaires (Table 4.1), of which 265
responded at stage 1 (overall response rate of 50.3%). Of these employees, 124 questionnaires
were returned at stage 2 (overall response rate of 62.6%) of 265 possible employees. Fifty-
four members of staff were no longer working at the establishments at the second stage, and
13 of those who had responded at stage 1 had done so anonymously, reducing the sampling
frame by 67 to 198.
4.1.3 Non-responders
The distribution of non responders at stage 2 had a profile similar to the final study population
for age group (<45’s: 63.5%, n=224; >45’s: 36.5%, n=129), BMI group (ideal weight group:
60.9%, n=273; overweight/obese group: 39.1%, n=140), ethnicity (white: 89.4%, n=320; other
ethnic groups: 11.6%, n=140), and hours worked (Full-time: 74.2%, n=267; part-time: 25.8%,
n=93) (see Table 4.2). The non-responders at the second stage did however include
substantially more men (46.3%, n=167) and slightly more individuals in social class groups III
manual, IV and V (16.9%, n=59) than in the sample of employees who had responded at both
stages.
4.2 Socio-demographic characteristics
Data are presented for the sub-group of employees in successful HBA sites who responded to
the questionnaire at both stages. Demographic information are presented for this sub-group
rather than the total population, because the sub-group of respondents at both times is used to
examine change and will be used in the matched paired analysis. As the principal research
question was to investigate change in the HBA sites, data were only analysed and reported in
the comparison group when a change in response is detected, to assess if this could be
attributed to the intervention. In addition, differences in response by socio-demographic
groups are only reported when a change is observed.
Tables 4.2a/b show the socio-demographic characteristics of the sample which responded at
both stages. The study sample (workplaces with the HBA) comprised 453 adults. Two-thirds
of which were aged under 45, nearly three-quarters were female and the vast majority were
56

white. Social class distribution indicated that 62.4% of the sample were from social classes I
and II, with only 11.2% in the HBA target group 2. More employees worked full-time than
part-time.
Table 4.2a: Socio-demographic data for successful and unsuccessful HBA sitesSuccessful HBA sites Unsuccessful sites
(n=453) (comparison group)_____________________________(n=124)
N % N %
Gender Women 318 70.5 44 33.5Men 133 29.5 80 64.5
Age group < 29 years 87 19.6 38 31.430-39 years 116 26.1 29 24.040-49 years 141 31.7 27 22.3> 50 years 101 22.7 27 22.3
Modified age group <45 years 277 62.2 77 63.6>45 years 168 37.8 44 36.4
Ethnicity White 416 92.9 112 90.3Indian 12 2.7 11 8.9Black (Caribbean and other) 9 3.1 0 -
Chinese 4 0.9 0 -
Other 10 1.6 1 0.8
Social class group I professional 27 6.1 26 21.1II managerial 251 56.3 33 26.8III Non manual 118 26.5 37 30.1III Manual 31 7.0 14 11.4IV Non skilled 9 2.0 13 10.6V Voluntary 10 2.2 0
Modified social class Group 1= I, II & III non-manual 396 88.8 96 78.0group
Group 2= III manual, IV & V 50 11.2 27 22.0
Working pattern Full time (stage 1) 319 71.4 109 87.9Part time (stage 1) 128 28.6 15 12.1
Full time (stage 2) 313 70.7 111 89.5Part time (stage 2) 130 29.3 13 10.5
Missing data:-Successful sites: Stage 1: gender:2, age group:8; ethnicity:5; social class group:7; working pattem:6;. Stage 2: working
pattern: 10 at stage 2; Unsuccessful sites: Stage 1: age group:3; social class group: 1.
Due to the profile of the sample it was felt inappropriate to do cross-tabulations for ethnicity.
The 124 employees in the comparison group contained significantly more men, ‘Indian’
respondents and social class group in manual, IV and V employees. Around two-thirds of the
sample were in the ideal BMI range of 20-25 at both stages (Table 4.2b), the number of
employees who were overweight/obese increased at stage 2 from 33.1% (n=140) to 36.0%
(n=163), which almost reached significance (p=0.056).
57

Table 4.2b: Weight related data for modified BMI groupSuccessful HBA sites
(n=453)Comparison/
Unsuccessful sites (n=124)Modified BMI group N % N %
Stage 1 Group 0 (underweight) 10 2.4 5 4.4Group 1 (ideal weight) 273 64.5 67 59.3Group 2 (overweight/obese) 140 33.1 41 36.3
Stage 2 Group 0 (underweight) 11 2.4 5 4.1Group 1 (ideal weight) 279 61.6 71 58.2Group 2 (overweight/obese) 163 36.0 46 37.7
Missing data:-Successful sites: Stage 1: BMI group:30; Unsuccessful sites: Stage 1: BMI group: 11. Stage 2:BMI group:2.
Where :Group 0 (underweight)=BMl<20; Group 1 (ideal weight)=BMI 20-25; Group 2 (overweight/obese) =BM1>26.
4.3 Patterns of canteen use
4.3.1 Purchase of meals from the staff canteen
Table 4.3 illustrates the pattern of consumption of different meals from the staff canteen. Most
food was eaten at lunchtime, with just over one-third of staff using the canteen for lunch at
both stages. There was no change in canteen use for any of the meal times between the two
stages.
Table 4.3: Purchase of meals from the staff canteenNever/rarely At least
1/week*N % N %
Breakfast Stage 1 373 87.4 54 12.6Stage 2 406 89.6 47 10.4
Lunch Stage 1 273 62.3 165 37.7Stage 2 284 62.7 169 37.3
Evening Stage 1 410 96.3 16 3.7Stage 2 436 96.3 17 3.7
Breaktime Stage 1 413 91.2 40 8.8Stage 2 384 90.1 42 9.8
Missing data: breakfast:26, lunch: 15, evening 27, breaktime:27 * sum of employees eating in the canteen for 1-2, 3-4, >5 days a week
The <45 year olds were more likely to eat lunch in the canteen than the >45’s, reaching
significance at both stage 1 (42.5%; n=l 14 of <45’s compared to 30.3% (n=50) of >45’s;
X2=6.50 df=i; p=0.011) and stage 2(41.2%; n=l 14 of <45’s compared to 31.5%; n=53 of >45’s;
X2=4.12 df=i;p=0.043). More men (45.5%, n=60) ate their lunch in the canteen than women
(34.3%, n=105) at stage 1 (x2=4.88 df=i;P=0-027), but at stage 2 there was no measurable
gender difference as women had increased use (37.1%, n=l 18) whereas men were using the
canteen less for lunch (37.6%, n=50). Social class group 2 (22.4%; n=l 1) used the canteen

less for lunch at both stages than those in social class group 1 (39.8%; n=153) at stage 1
(%2=5.59 df=i;P=0 018), which did not change at stage 2.
4.3.2 Main meal consumption
Three-quarters of the sample stated that they never or rarely ate their main meal at work at
both stages (stage 1: 77.0%, n=341; stage 2: 79.9%, n=353). The <45’s and men were more
likely to eat their main meal at work, which was significant at both stages for gender (stage
1:%2=7.85 df=i;p=0-05; stage 2:%2=4.62 df=1;p=0.032) and at stage 1 for age group (%2=3.95
df=i; p=0.047). As expected, full-time workers ate their main meal at work a lot more often at
both stages than part-time workers (stage 1-%2=18.96 df=i;p=0.000; stage 2- %2=14.41 df=i;
p=0.000).
4.3.3 Packed lunches
At both stages, around 55% of respondents (stage 1: n=245, stage 2: n=247) brought a packed
lunch to work at least once a week. Of these, around a third (stage 1: 37.1%; n=91; stage 2:
34.0%; n=84) brought a packed lunch every day. Women (stage 1: 57.1%, n=179; stage 2:
58.8%, n=181) were more likely to bring a packed lunch to work than men (stage 1 and 2:
49.6%, n=66) at both stages, but this did not reach significance.
4.3.4 Incentives to use canteen more
At the first stage approximately two-thirds of the sample said that nothing could persuade
them to eat canteen food more often, this number fell slightly at stage 2 (Table 4.4). Of those
that expressed an interest in eating more often in the canteen, the most common reasons at
both stages were: variety, lower price, food quality, hours worked and opening times of the
canteen. The availability of healthy food did not feature highly. The location of the canteen
increased 4 fold as a factor influencing use of the canteen.
59

Table 4.4: Reasons given which would encourage employees to eat canteen food more often
Stage 1 Stage 2N % N %
Nothing/no reason 298 64.9 266 58.7
More variety/choice 38 8.4 26 5.7
Lower price 36 8.0 25 5.5
More fresh food/improved quality 18 4.0 16 3.5
If worked different hours 17 3.8 27 6.0
Location of canteen 12 2.7 48 10.6
Opening times of canteen 11 2.4 12 2.6
Miscellaneous reasons 10 2.2 11 2.4
If had more time 8 1.8 14 3.1
More healthy food 8 1.8 8 1.8
4.4 Food Consumption
4.4.1 Special diets
At both stages, less than 40% of the sample described themselves as ‘following a special diet’
(stage 1:38.5%; stage 2: 32.9%). The most common types of diet mentioned were: weight
reducing (stage 1: 14.7%, n=57; stage 2: 9.3%, n=42), cholesterol lowering/low fat (stage 1:
10.3%, n=40; stage 2: 10.2%, n=46) and vegetarian (stage 1: 8.3%, n =32; stage 2: 7.3%,
n=33). Hence there was a reduction in employees reporting they were following a weight
reducing diet. This was not the case in the comparison group, where the number of employees
reporting that they were trying to lose weight remained constant (stage 1: 14.5%, n=18; stage
2: 13.7%, n=17).
4.4.2 Food eaten by type at home and at work
Milk consumption
Differences in type of milk taken were compared (Table 4.5). Intake of semi-skimmed milk
increased slightly at home over the 2 stages, although this did not reach significance. No
other changes were detected.
60

Table 4.5: Changes in type of milk usedAt home At work
Stage 1 Stage 2N % N % N % N %
Skimmed milk 81 18.1 90 20.0 38 9.2 42 10.1
Semi skimmed milk 274 60.5 285 63.5 278 67.1 281 67.9
Whole milk 60 13.2 49 10.9 27 6.0 21 5.1
Miscellaneous milk group*
33 7.3 25 5.6 71 17.1 70 16.9
* Miscellaneous milk group includes those that consume a mixture of types of milk, milk substitute, soya milk and those who do not drink
milk
When the data was classified as ordinal for the 3 main types of milk, paired analysis
illustrated that there was more positive than negative change in type of milk used (Table 4.6),
which reached significance at home. However, this was also the trend in the comparison
group at home (positive change: 12.2%; negative change: 7.3%) and work (positive change:
28.6%; negative change: 16.0%).
Table 4.6: Summary of distribution of change of type of milk, bread, spreading fat
and addition of sugar to drinksPositive Negative No change
change1 change2
N % N % N % Total P(z)
Type of milk At home 53 11.9 32 7.2 359 80.9 444 0.028**
At work 43 11.1 31 8.0 313 80.9 387 0.087
Type of bread At home 40 9.1 39 8.9 361 82.0 440 0.910
At work 42 12.1 48 13.9 256 74.0 346 0.527
Type of spreading At home 82 18.6 62 14.1 297 67.3 441 0.057
fat
At work 43 11.1 31 8.0 313 80.9 387 0.087
Addition of sugar At home 27 6.0 19 4.2 403 89.8 449 0.084
to
drinks At work 29 7.2_ ____3 I T . .
22 5.4 353 87.4 404 0.232
**p<0.05
61

Bread consumption
At work, there was no change in type of bread chosen (Table 4.7). At home, there was a
reduction in wholemeal bread consumption over the 2 stages (x2=5.32 df=i,P=0.021) and an
increase in those consuming a mixture of bread types at the second stage. These changes were
not reflected in the comparison group. Paired analysis suggested that an equal number of
employees reported that they had changed their type of bread in a healthier and less healthy
direction (Table 4.6).
Table 4.7: Changes in bread consumption over the 2 stages
At home At workStage 1____________Stage 2_________ Stage 1___________ Stage 2
N % N % N % N %Type of breadHardly ever eat it 16 3.6 12 2.7 52 13.4 49 12.5
Brown/high fibre white bread
62 13.8 65 14.6 54 13.9 60 15.3
White bread 86 19.2 88 19.8 93 24.0 101 25.7
Wholemeal/granarybread
147 32.8 126 28.3 94 24.2 88 22.4
A mixture of types of bread
137 30.6 154 34.6 95 24.5 95 24.2
Spreading fat use
At work, there was an increase in the number of respondents using low fat spread and
butter/butter based spreads (Table 4.8), although these changes did not reach significance.
There was also an increase in respondents using butter/butter based spreads in the comparison
group (stage 1: 15.5%, n=16; stage 2: 21.9%; n=23). At home, butter/butter based spread
consumption also increased (n=441, %2=5.31 df=i, p=0.021), whereas low fat spread
consumption fell, although this did not reach significance.
Women (stage 1: 44.8%, n=78; stage 2: 49.2%; n=93) and the younger age group (stage 1:
39.4%, n=65; stage 2: 43.8%; n=77) increased their consumption of low fat spread at work.
The increase in butter consumption at work in our sample appears to be a result of men
choosing butter more often at work (stage 1: 19.5%, n=15; stage 2: 24.7%; n=20).
Paired analysis of change indicated that there was more positive than negative change for type
of spreading fat used (Table 4.6).
62

Table 4.8: Changes in type of spreading fat used over the 2 stagesAt home At work
Stage 1____________Stage 2________ Stage 1___________ Stage 2N % N % N % N %
Type of fat on breadLow fat spread 206 46.1 196 43.8 113 24.9 129 33.9
Butter/butter based 81 18.1 102 22.8 64 14.1 72 18.9spreadsPolyunsaturated 102 22.8 95 21.3 74 16.3 71 18.7margarineMiscellaneous types ** 29 6.5 25 5.6 14 3.8 13 3.4
Do not use any 29 6.5 25 5.6 54 14.6 49 12.9
Don’t know 0 0 1 0.9 50 13.6 46 12.1"""Miscellaneous spreading fat group includes those who recorded a ‘mixture of types of spreading fat’ and ‘other types of margarine’
The addition of sugar to drinks
Around two-thirds of the sample reported not adding sugar to drinks, a quarter stated they
added at least 1 teaspoon of sugar and the remainder used an artificial sweetener (Table 4.9).
There was no overall change in the addition of sugar to drinks over the 2 stages. Paired
analysis however suggested that there was more positive than negative change for addition of
sugar to drinks (Table 4.6), which almost reached significance at home. These trends were
also apparent in the comparison group at home (positive change: 8.9%; negative change:
5.7%) and work (positive change: 11.3%; negative change: 7.3%).
Table 4.9: Changes in addition of sugar to drinks over the 2 stagesAt home
Stage 1 Stage 2 Stage 1
At work
Stage 2N % N % N % N %
Do not add any sugar 287 64.6 291 65.0 273 65.6 282 67.1
1 teaspoon 83 18.7 87 19.4 81 19.5 80 19.0
> 1 teaspoon 44 9.9 38 8.5 39 9.4 36 8.6
Use an artificial sweetener
30 6.8 32 7.1 23 5.5 22 5.2
4.4.3 Dietary indices to summarise food intake
Figures 4.1a-4.4b illustrate that there was little change in the distribution of scores at stage 2.
As the scores did not conform to a normal distribution, the Wilcoxon sign rank test was used
to assess change in mean ranks of employees who responded at both stages (Table 4.10).
63

Figure 4.1a: Changes in fat
indices at work60 ---------------------------------------------------------------------
Figure 4.2a: Changes in fibre
indices at work301-------------------------------------------------------------------------
Score
STAGE
■ 1H 2
64
Perc
ent
Perc
ent
Figure 4.1b: Changes in fat
indices at home
30 40 50 60 70 80 100
Score
Figure 4.2b: Changes in fibre
indices at home501-------------------------------------------------------------------------
20 30 40 50 60 70 80 100
Score

Figure 4.3a: Changes in sugar
indices at work40 1----------------------------------------------------------------------------
Score
Figure 4.4a: Changes in healthy diet
indices at work50
40
30
20
STAGE10
010 20 30 40 50 60 70 80 100
Score
65
Figure 4.3b: Changes in sugar
indices at home
20 30 40 50 60 70 80 100
Score
Figure 4.4b: Changes in healthy diet
indices at home
40 50 60 70 80 100
Score

The distribution of the sample that changed their response in either a positive direction
(healthier), negative direction (less healthy) or did not change are summarised. Although
there were some positive shifts for fat and sugar index at home, and sugar and healthy diet
index at work, none of these reached significance in our sample.
Table 4.10 Distribution of change
HBA premises
N Mean rank
P(z)
Comparison group
N Mean rank
P(z)
Fat index at home 1 Positive change 167 167.32 0.203 48 47.11 0.7682 Negative change 154 154.15 45 46.88No change 102 24Total 423 117
Fat index at work Positive change 100 114.06 0.915 50 41.48 0.495Negative change 114 101.75 37 47.41No change 71 19Total 285 106
Fibre index at home Positive change 155 147.01 0.187 50 41.46 0.660Negative change 160 168.65 43 53.44No change 120 27Total 435 120
Fibre index at work Positive change 124 131.37 0.647 43 43.76 0.398Negative change 135 128.74 39 39.01No change 66 27Total 325 109
Sugar index at home Positive change 151 136.78 0.277 45 43.34 0.236Negative change 126 141.66 37 39.26No change 151 38Total 384 120
Sugar index at work Positive change 119 119.55 0.554 38 36.82 0.785Negative change 114 114.33 35 37.20No change 151 45Total 384 118
Healthy diet index at Positive change 196 199.11 0.819 49 55.14 0.937home Negative change 196 193.89 54 49.14
No change 25 11Total 417 114
Healthy diet index at Positive change 127 120.02 0.875 49 46.16 0.205work Negative change 118 126.21 39 42.41
No change 21 16
___ ._____Total 266 104
Positive ranks are when the score at stage 2 was higher than that at stage 1, i.e. indicates a favourable behaviour change.2 Negative ranks are when the score at stage 2 was lower than that at stage 1, i.e. indicates an unfavourable behaviour change.
Mean and median scores for fat, dietary fibre, sugar and healthy diet are shown (see Table
4.11). There were remarkably small differences in mean and median scores, however there
66

was a slight increase in the median fat index at home, indicating a slight positive shift in fat
consumption.
Table 4.11 Description of dietary indices before and after implementation of the HBA scheme
N M ean Std.E rro r
Std.Deviation
Median Missing
Fat IndicesAt home stage 1 428 73.53 .66 13.60 72.22 25
stage 2 447 74.14 .66 14.04 77.78 6
At work stage 1 334 76.31 .96 17.63 77.78 119stage 2 368 76.16 .93 17.78 77.78 85
Fibre IndicesAt home stage 1 442 72.85 .86 18.07 70.00 11
stage 2 445 71.80 .93 19.66 70.00 8
At work stage 1 363 42.15 1.17 22.34 40.00 90stage 2 393 41.17 1.12 22.12 40.00 60
Sugar IndicesAt home stage 1 436 77.82 .83 17.28 80.00 17
stage 2 452 78.56 .82 17.41 80.00 1
At work stage 1 403 82.21 1.06 21.32 90.00 50stage 2 426 82.09 1.04 21.42 90.00 27
Healthy eating IndicesAt home stage 1 425 74.76 .56 11.51 74.44 28
stage 2 443 74.76 .58 12.18 75.56 10
At work stage 1 323 67.42 .80 14.37 69.26 130stage 2 352 67.54 .77 14.39 69.26 101
Socio-demographic variation in mean dietary indices
Age group
At the first stage, the >45 year olds scored significantly higher for fat (p=0.000), sugar
(p=0.000) and healthy diet (p=0.000) indices at home, and for fibre index at work (p=0.006)
(Table 4.12). In addition the older age group scored higher for fat and sugar indices at work
and fibre index at home, although these did not reach significance in the study sample. These
trends were almost identical at the second stage. The <45’s slightly increased their mean fat
index at home and slightly reduced their mean fibre index at work. On the other hand, the >45
year olds increased their mean fibre and healthy diet indices at work.
67

Table 4.12 : Changes in mean scores for dietary indices by age group
Stage 1< 45 years
Stage 2 Stage 1^ 45 years
Stage 2Mean (S.E) N Mean (S.E) N Mean (S.E) N Mean (S.E) N
Fat index at home 70.77 (0.86) 264 72.04 (0.86) 275 78.20 (0.93) 159 77.68(1.01) 164Fat index at work 75.56(1.04) 223 75.55 (1.04) 234 77.88 (2.08) 108 77.17 (1.88) 127
Fibre index at home 71.96(1.10) 271 70.44(1.20) 272 74.10(1.40) 166 74.30(1.49) 165Fibre index at work 44.38 (1.40) 235 42.20(1.39) 250 37.68 (2.07) 125 39.56(1.93) 136
Sugar index at home 75.07(1.10) 268 76.12(1.08) 276 82.64(1.19) 163 83.04(1.19) 168Sugar index at work 81.46(1.20) 253 81.62(1.22) 266 83.84 (2.03) 146 83.14(1.94) 153
Healthy diet index at home
72.72 (0.07) 263 72.83 (0.76) 271 78.23 (0.83) 157 78.21 (0.86) 164
Healthy diet index at work
67.73 (0.83) 217 67.23 (0.89) 226 66.83 (1.79) 103 68.36(1.50) 119
Gender
Women had consistently higher mean scores for all dietary indices compared to men (Table
4.13), which reached significance at stage 1 for fat (p=0.000), sugar (p=0.020) and healthy
diet indices (p=0.000) at home, and for healthy diet index at work (p=0.039). At stage 2 the
trend was similar, with differences reaching significance for all dietary indices at home, and
for sugar at work. There was a 3.12% increase in the mean fibre index at work for men over
the 2 stages, with no other detectable shifts. Analysis with change variables suggested that
women changed their sugar scores at work most positively, with 36.8% (n=71) of women
compared to 28.6% of men (n=26), although this did not reach significance (%2=1.86 df=i;
p=0.173).
Table 4.13 : Changes in mean scores for dietary indices by gender_________Men Women
Stage 1 Stage 2 Stage 1 Stage 2
Mean (S.E) N Mean (S.E) N Mean (S.E) N Mean (S.E) NFat index at home 69.36(1.19) 128 69.78(1.10) 132 75.31 (0.77) 300 76.02 (0.80) 313Fat index at work 73.95(1.77) 103 74.80(1.32) 112 77.37(1.15) 231 76.73(1.21) 254
Fibre index at home 70.83(1.48) 132 68.56(1.62) 132 73.71 (1.05) 310 73.12(1.13) 311Fibre index at work 40.98 (2.02) 112 44.10(1.88) 118 42.67 (1.44) 251 41.21 (1.38) 273
Sugar index at home 73.85 (1.63) 130 73.68(1.58) 133 79.51 (0.94) 306 80.73 (0.92) 317Sugar index at work 79.67(1.94) 121 78.64(1.82) 125 83.30(1.27) 282 83.58(1.25) 299
Healthy diet index at home
71.09 (0.97) 127 70.63(1.01) 132 76.32 (0.66) 298 76.56 (0.68) 309
Healthy diet index at work
64.98(1.42) 101 65.42(1.14) 106 68.53 (0.96) 222 68.48 (0.99) 244
68

BMI group
There was no difference at stage 1 in fat scores between the overweight/obese group and the
ideal weight group. However, at stage 2 (at work) the overweight/obese had a higher mean
score for fat (79.03; n=133) compared to the ideal weight group (74.67; n=227) (p=0.025).
There were no differences in fibre and sugar indices between the 2 groups. Mean dietary
indices for the overweight/obese group increased in all situations by between 2-3%, except for
fibre index at work.
Changes in fat and sugar were not supported by analysis of change scores for BMI, which
showed that the overweight/obese group were more likely to improve their fibre score at home
than the ideal weight group, i.e. 58.2% (n=53) of overweight/obese group compared to 45.1%
(n=87) of those in ideal weight employees, (%2=4.29 df=i; p=0.038). The healthy diet score at
home also changed more positively in overweight/obese respondents, with 56.0% (n=65) of
the overweight/obese reporting change compared to 48.1% (n=l 17) of ideal weight
employees, however this did not reach significance (%2= 1.95 df=i;P=0.162).
Social class
Social class group 1 scored consistently higher for all dietary indices at stage 1, which reached
significance for dietary fibre (p=0.001), sugar (p=0.023) and healthy diet (p=0.001) indices at
home (Table 4.14).
Table 4.14 : Changes in mean scores for dietary indices by modified social class group*Social class group 1 Social class group 2
Stage 1 Mean (S.E) N
Stage 2 Mean (S.E) N
Stage 1 Mean (S.E) N
Stage 2 Mean (S.E) N
Fat index at home 73.78 (0.70) 374 74.22 (0.72) 390 71.09(2.00) 49 74.44(1.75) 50Fat index at work 76.35 (1.00) 299 75.97(1.00) 328 75.17(3.77) 32 77.14 (2.68) 35
Fibre index at home 73.98 (0.92) 387 72.96 (0.99) 388 64.80 (2.31) 50 62.20 (2.68) 50Fibre index at work 42.84(1.24) 321 41.75(1.18) 348 37.63 (3.74) 33 36.84 (3.84) 38
Sugar index at home 78.48 (0.87) 381 78.96 (0.86) 395 72.60 (2.52) 50 76.80 (0.87) 395Sugar index at work 82.41 (1.12) 357 82.36(1.11) 377 80.73 (3.43) 41 81.90 (2.73) 42
Healthy diet index at home
75.44 (0.59) 371 75.30 (0.62) 386 69.55(1.64) 49 71.15(1.69) 50
Healthy diet index at work
67.79 (0.85) 288 67.51 (0.84) 314 64.12(2.60) 32 67.78 (1.87) 33
♦Group 1= I, II & III non-manual; Group 2= III manual, IV & V.
At stage 2, the mean indices for social class group 2 had increased for fat and sugar indices at
home with the result that there was a smaller difference between the mean scores of the 2
groups. Social class group 1 still had significantly higher mean scores for dietary fibre
69

(p=0.000) and healthy diet (p=0.023) indices at home. Although the mean score for dietary
fibre index at work remained roughly the same over the 2 stages for both groups, analysis of
change variables illustrated that more respondents in social class group 2 changed positively,
with 57.2% (n=12) compared to 47.2% (n=l 11) of respondents in social class group 1,
although this did not reach significance (%2=0.76 df=i; p=0.384). Additionally those in social
class group 2 changed most positively for healthy diet scores at home and work, which
reached significance at work, i.e. 61.7% (n=29) of social class group 2 respondents compared
to 48.5% (n=165) of those in social class group 1 (%2=2.87 df=i;P=0.09).
4.4.4 Frequency of consumption of food itemsAs well as investigating changes in dietary indices, the distribution of change in frequency of
consumption of food items was compared to identify any underlying changes (Tables 4.15a/b).
At work, there was more positive than negative change for consumption of: sugary drinks,
hard cheese, fried food, fruit, vegetables, chicken and fish, red meat and low fat cheese, which
reached significance for fruit and red meat. This was reflected in the comparison group for
sugary drinks (positive change: 24.4%; negative change: 19.3%), fried food (positive change:
23.5%; negative change: 17.7%), fruit (positive change: 37.2%; negative change: 19.8%),
chicken and fish (positive change: 33.3%; negative change: 17.5%), and red meat (positive
change: 23.1%; negative change: 18.8%), which reached significance for fruit (p=0.023) and
chicken and fish (p=0.030). On the other hand, there was more negative than positive change
at work for crisps, biscuits and cake consumption. This was the same in the comparison
group for biscuits and cakes (positive change: 23.8%; negative change: 31.2%).
At home, there was more positive than negative change for consumption of: biscuits and
cakes, confectionery, sugary drinks, processed meats, crisps, fried food, starchy carbohydrates
and red meat, which reached significance for processed meat and red meat. These trends were
reflected in the comparison group for confectionery (positive change: 33.3%; negative change:
23.6%), processed meats (positive change: 18.9%; negative change: 14.8%) and crisps
(positive change: 32.5%; negative change: 23.6%). However there was more negative than
positive change for beans and pulses at home, which reached significance.
70
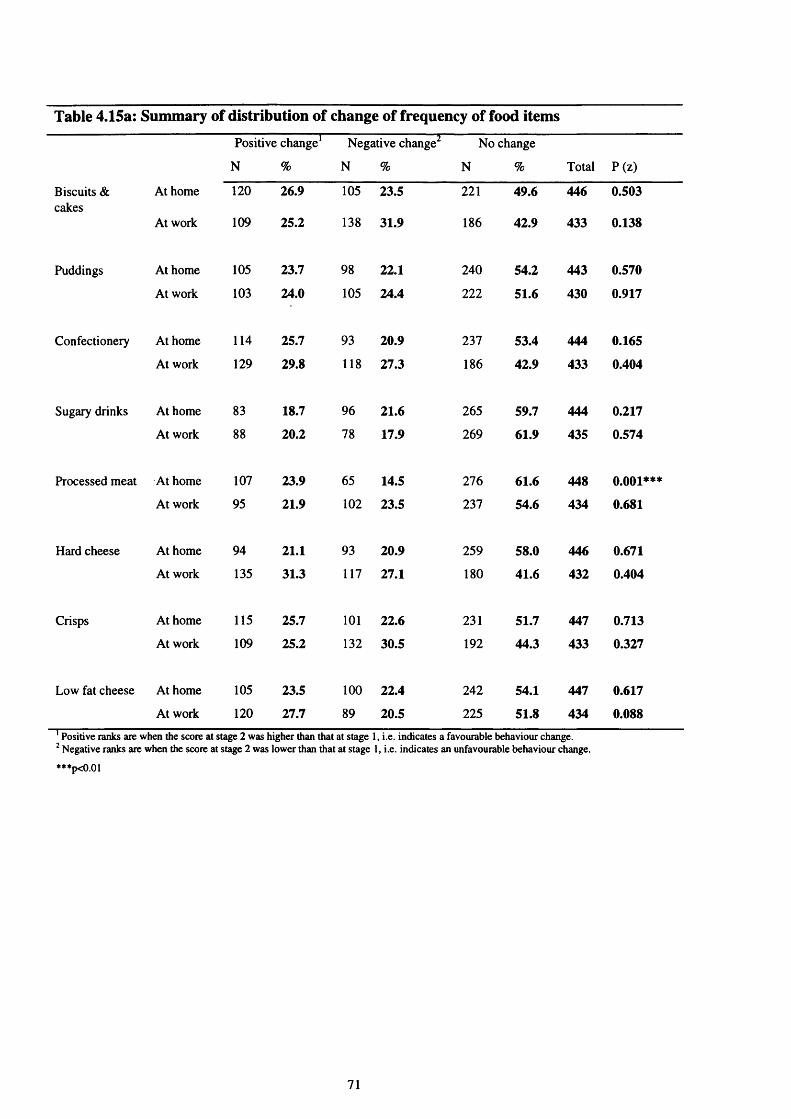
Table 4.15a: Summary of distribution of change of frequency of food itemsPositive change1
N %
Negative change
N %
No change
N % Total P(z)
Biscuits & cakes
At home 120 26.9 105 23.5 221 49.6 446 0.503
At work 109 25.2 138 31.9 186 42.9 433 0.138
Puddings At home 105 23.7 98 22.1 240 54.2 443 0.570
At work 103 24.0 105 24.4 222 51.6 430 0.917
Confectionery At home 114 25.7 93 20.9 237 53.4 444 0.165
At work 129 29.8 118 27.3 186 42.9 433 0.404
Sugary drinks At home 83 18.7 96 21.6 265 59.7 444 0.217
At work 88 20.2 78 17.9 269 61.9 435 0.574
Processed meat At home 107 23.9 65 14.5 276 61.6 448 0.001***
At work 95 21.9 102 23.5 237 54.6 434 0.681
Hard cheese At home 94 21.1 93 20.9 259 58.0 446 0.671
At work 135 31.3 117 27.1 180 41.6 432 0.404
Crisps At home 115 25.7 101 22.6 231 51.7 447 0.713
At work 109 25.2 132 30.5 192 44.3 433 0.327
Low fat cheese At home 105 23.5 100 22.4 242 54.1 447 0.617
At work 120 27.7 89 20.5 225 51.8 434 0.0881 Positive ranks are when the score at stage 2 was higher than that at stage 1, i.e. indicates a favourable behaviour change.2 Negative ranks are when the score at stage 2 was lower than that at stage 1, i.e. indicates an unfavourable behaviour change.
***p<0.01
71

Table 4.15b: Summary of distribution of change of frequency of food itemsPositive change1 Negative change No change
N % N % N % Total P(z)
Fried food At home 100 22.5 74 16.6 271 60.9 445 0.082
At work 107 24.8 92 21.3 233 53.9 432 0.248
Beans and pulses At home 72 16.0 95 21.2 282 62.8 449 0.039**
At work 114 25.5 103 24.1 212 49.4 429 0.593
Fruit At home 123 27.5 128 28.6 196 43.9 447 0.766
At work 155 35.7 122 28.1 157 36.2 434 0.046**
Vegetables At home 120 26.9 111 24.9 215 48.2 446 0.662
At work 136 31.9 117 27.4 174 40.7 427 0.557
Starchy foods At home 138 30.9 122 27.3 187 41.8 447 0.944
At work 143 33.2 146 33.9 142 32.9 431 0.946
Chicken & fish At home 70 15.6 72 16.0 307 68.4 449 0.947
At work 117 27.3 100 23.3 212 49.4 429 0.307
Red meat At home 87 19.5 57 12.8 303 67.8 447 0.011**
At work 100 27.2 55 14.9 213 57.9 368 0.000***
Low calorie drinks At home 126 28.3 109 24.4 211 47.3 446 0.131
At work 122 27.9 103 26.6 212 48.5 437 0.365
Positive ranks are when the score at stage 2 was higher than that at stage 1, i.e. indicates a favourable behaviour change.2 Negative ranks are when the score at stage 2 was lower than that at stage 1, i.e. indicates an unfavourable behaviour change.
**p<0.05; ***p<0.01.
72

4.5 P ersonal percep tions o f d iet an d h ea lth
The categories into which data have been organised are illustrated in Table 4.16.
Table 4.16: Items for measuring psycho-social factors influencing dietary behaviourPredisposing factors Belief in diet-disease connection
Perceived benefits of a healthy diet The availability of healthy food at work The taste of food Knowledge of healthier eating
Enabling factors Ability to understand information on healthy eating Conflicting information concerning a healthy diet Cost of food Presentation of food The effect of moodNeeding something quick to eat at work Habitual food choices at work
Change related factors Self-rated dietBehavioural intentions to change diet Self-efficacy for changing dietReported eating habit changes- attempts and successes.Changes resulting from the introduction of the HBA scheme
4.5.1 Predisposing factors
Belief in diet-disease connection
The majority of employees ‘agreed/strongly agreed’ that eating a lot of fruit and vegetables
contributes to reducing risk of CHD at both stages (Figure 4.5). There was a slight increase in
employees convinced of the role of fruit and vegetables (stage 1: 79.8%; n=355; stage 2:
82.2%; n=365). This can be attributed to men (stage 1: 77.1%; n=101; stage 2: 86.2%;
n=l 12) and overweight/obese employees (stage 1: 77.5%; n=107; stage 2: 85.5%; n=136),
who increased agreement at stage 2.
Figure 4.5
"Eating a lot of fruit and vegetables decreases
my chances of developing heart disease"50 -------------------------------------------------------------------------------------------------
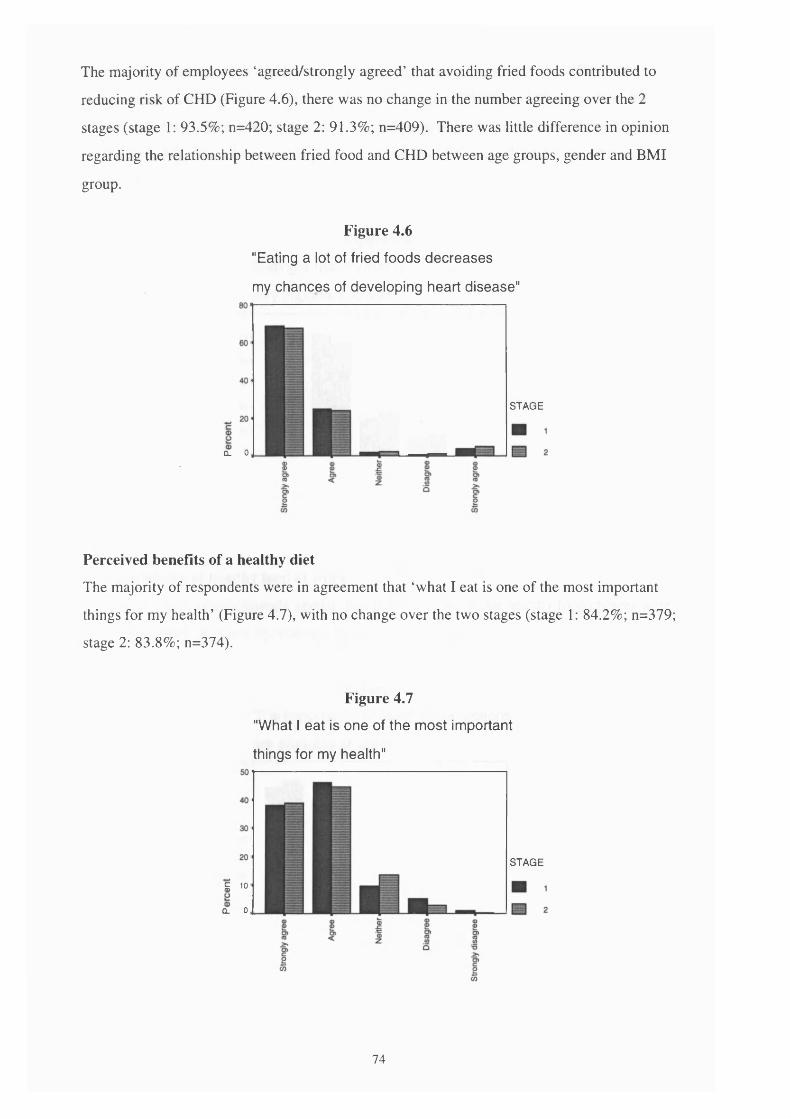
The majority of employees ‘agreed/strongly agreed’ that avoiding fried foods contributed to
reducing risk of CHD (Figure 4.6), there was no change in the number agreeing over the 2
stages (stage 1: 93.5%; n=420; stage 2: 91.3%; n=409). There was little difference in opinion
regarding the relationship between fried food and CHD between age groups, gender and BMI
group.
Figure 4.6
"Eating a lot of fried foods decreases
my chances of developing heart disease"
STAGE
CL 0
Perceived benefits of a healthy diet
The majority of respondents were in agreement that ‘what I eat is one of the most important
things for my health’ (Figure 4.7), with no change over the two stages (stage 1: 84.2%; n=379;
stage 2: 83.8%; n=374).
Figure 4.7
"What I eat is one of the most important
things for my health"
i 10
CL 0
STAGE
74

Slightly less employees felt that ‘eating a healthy diet is very important to me’(Figure 4.8),
with a reduction in respondents agreeing at stage 2 (stage 1: 76.6%; n=340; stage 2: 71.8%;
n=319; p=0.024). There was no change in the comparison group (stage 1:66.7%, n=82; stage
2: 69.4%, n=86). The <45 year olds (stage 1: 72.4%; n=199 ; stage 2: 66.1%; n=181) reduced
agreement.
Figure 4.8
"Eating a healthy diet is
very important to me"
The availability of healthy food at work
Most employees ‘agreed/strongly agreed’ that it was important that healthy food choices were
available at work (Figure 4.9), with no change over the 2 stages.
Figure 4.9
"It is important that healthy food options
are available at work"
75

There was an increase in employees agreeing that ‘there is a lot of information on healthy
eating where I work’ (stage 1: 40.9%, n=182; stage 2: 51.1%, n=228; p=0.000) (Figure 4.10),
and with ‘at my workplace it’s easy to eat a healthy diet’ (stage 1: 36.4%, n=158; stage 2:
48.2%, n=213; p=0.000) (Figure 4.11). These changes were not reflected in the comparison
group.
Figure 4.10
"There is a lot of information on healthy
eating where I work"
76

Figure 4.11
"At my workplace it's easy to
eat a healthy diet"
In particular, women (stage 1: 43.3%, n=135; stage 2: 56.2%, n=177), the overweight/obese
group (stage 1: 33.1% , n=46; stage 2: 46.3%, n=74) and the <45 year olds (stage 1: 35.3% ,
n=97; stage 2: 47.1%, n=130) increased agreement.
The taste of food
Around two-thirds of the sample ‘agreed/strongly agreed’ that ‘healthy food tastes good’
(Figure 4.12). This did not change overall over the 2 stages, however the overweight/obese
group increased agreement at stage 2 (stage 1: 53.2%; n=74; stage 2: 60.2%; n=97).
Figure 4.12
"Healthy food tastes good"601------------------------------------------------------------------------------------------------

Knowledge of healthier eating
Table 4.17 illustrates that more than 90% of respondents correctly answered questions
concerning current general nutrition guidelines for reducing fat, fried food, sugar, sweets and
chocolates and increasing fruit and vegetables, this did not change over the 2 stages.
There was still confusion at stage 2 whether starchy food consumption should be increased,
with a slight increase in employees responding correctly (stage 1: n=274; 61.2%; stage 2:
n=284; 64.0%). There was a slight increase in social class group 1 employees answering
correctly at stage 2 (group 1: stage 1: 61.9%; n=244; stage 2: 65.6%; n=257).
Table 4.17: ‘ According to the latest guidelines to improve the nation's health, should people generally eat more or less of the following?’
Correct response
Stage 1 Stage 2
Starchy foods N 274 284
% 61.2 64.0
Fried foods N 434 435
% 96.9 97.3
Fat N 439 431
% 98.0 96.4
Fruit & vegetables N 440 436
% 98.2 97.5
Sugar N 421 418
% 94.2 94.6
Sweets & chocolates N 441 440
% 98.4 98.4
Almost all respondents answered correctly for pairs of foods identifying lower fat and higher
fibre options (Table 4.18), but there was slightly less awareness of the lower sugar food items.
There were no significant changes in response after implementation of the HBA scheme.
78

Table 4.18: Correct responses for pairs of foods chosen to assess employee knowledge of healthier food choices
Stage 1N %
Stage 2N %
‘If you were trying to choose more low fat foods, which would you select from the following pairs because it was lower in fat?’
shepherds pie & peas orcomish pasty & roast potatoes
415 93.9 418 94.6
cheese flan & salad ortuna, bread roll & salad
422 94.8 420 94.8
stewed apple & custard orapple pie & custard
415 93.7 408 93.2
‘If you were trying to choose more high fibre foods, which would you select from the following pairs because it was higher in fibre?’
chilli con came & rice ormince beef pie & chips
414 94.1 418 94.4
baked beans & jacket potato orcoleslaw & jacket potato
399 89.5 407 91.5
rhubarb crumble & custard orjam tart & custard
403 91.2 411 93.4
‘If you were trying to choose more low sugar foods, which would you select from the following pairs because it was lowest in sugar?’
pearormuesli bar
327 73.5 323 72.7
diet coke ormilkshake
361 81.3 336 76.2
4.5.2 Enabling factors
Ability to understand information on healthy eating
Around two-thirds of respondents (stage 1: 64.0%, n=284; stage 2: 67.1%, n=298) were in
agreement that ‘information on healthy eating is easy to understand’ (Figure 4.13), which
increased slightly over the 2 stages. Women (stage 1: 69.0%; n=216; stage 2: 73.8%; n=231),
social class group 2 (stage 1: 51.0%, n=25; stage 2: 62.5%, n=30) and overweight/obese
employees (stage 1: 58.0%; n=80; stage 2: 62.3%; n=99) all increased agreement with the
statement, although this did not reach significance.
79

Figure 4.13
"The available information on healthy
eating is easy to understand"
05
Conflicting information concerning a healthy diet
Three-quarters of the sample (stage 1: 74.6%, n=334; stage 2: 73.0%, n=327) thought there
were a lot of conflicting messages around concerning a healthy diet (see Figure 4.14) at both
stages. Those in social class group 2 reduced agreement over the 2 stages (stage 1: 83.3%,
n=40; stage 2: 79.2%, n=30).
Figure 4.14
"I find there are a lot of conflicting messages
around concerning a healthy diet"50 -------------------------------------------------------------------------------------------------

Cost of food
Less than half of the sample ‘agreed/strongly agreed’ that the cost of food influenced what
they ate at work (Figure 4.15) and home (Figure 4.16). This did not change at work (stage 1:
40.6%, n=174; stage 2: 41.3%, n=175), or at home overall (stage 1: 41.4%, n=185; stage 2:
43.6%, n=193), although women increased agreement (stage 1: 43.5%, n=137; stage 2: 47.4%,
n=147).
Figure 4.15
"At work, the cost of food influences
what I eat"
co
Figure 4.16
"At home, the cost of food influences
what I eat"

Presentation of food
The way in which food was presented at work influenced food choice in approximately two-
thirds of employees (Figure 4.17), which did not change over the 2 stages (stage 1: 67.7%,
n=285; stage 2: 65.6%, n=273).
Figure 4.17
"For me, the way in which food is presented
at work influences my food choice"
o5
The effect of mood
Less than a quarter of the sample ‘agreed/strongly agreed’ that they chose foods to improve
their mood at work at both stages (stage 1: 24.3%, n=102; stage 2: 21.8%, n=87) (Figure
4.18).
Figure 4.18
"At work, I choose foods to improve my mood"
82

Needing something quick to eat at work
Around three-quarters of the sample ‘agreed/strongly agreed’ that they need something quick
to eat at work (Figure 4.19), which increased at the second stage (stage 1: 73.6%, n=315; stage
2: 77.8%, n=339; p=0.003). However, there was also an increase in respondents needing
something quick to eat at work in the comparison group (stage 1: 72.3%, n=86; stage 2:
79.2%, n=95; p=0.035). Men (stage 1: 61.7%, n=79; stage 2: 72.3%, n=94) and the younger
age group (stage 1: 75.6%, n=205; stage 2: 81.5%, n=220) increased agreement at the second
stage, but this did not reach significance.
Figure 4.19
"I need something quick to eat at work"
A9ree NeitherDisagree
Strongly agreeStrongly disagree
Habitual food choices at work
There was no change in the number of employees reporting that they tended to eat similar
foods most days at work (stage 1: 78.7%, n=336; stage 2: 78.6%, n=337) (Figure 4.20).
Figure 4.20
"At work, I tend to eat similar foods
most days"
83

Social support
Less than half the sample (stage 1: 44.3%, n=197; stage 2: 39.1%, n=177) ‘agreed/strongly
agreed’ that they had a lot of encouragement for eating a healthy diet from close friends and
family (Figure 4.21). The fall in employees agreeing almost reached significance (p=0.078),
which appears to be mainly from men (stage 1: 56.8%; n=75; stage 2: 50.8%; n=66), this
change was not mirrored in the comparison group.
Figure 4.21
"I get a lot of encouragement for eating a
healthy diet from my close friends and family'1
w oco
Only a small number of employees (stage 1: 14.5%, n=62 stage 2: 14.1%, n=60) agreed that
they got a lot of encouragement for eating a healthy diet from their co-workers (Figure 4.22),
with no change over the 2 stages.
Figure 4.22
"I get a lot of encouragement for eating a
healthy diet from my co-workers"
84

4.5.3 Change related factors
Self rated diet
Employees perceptions of the healthiness of their diets, in terms of fat, fibre and sugar did not
change over the 2 stages (Table 4.19). Approximately one-third of employees reported
following a very low/low fat and high/very high fibre diet. Whereas around half the sample
described themselves as following a low/very low sugar diet.
Table 4.19: Changes in employees' perceptions of their fat, fibre and sugar intake
V. high/high Average V. low/low
Stage 1 N 60 223 157In your opinion how % 13.6 50.7 35.5high in fat is your diet? Stage 2 N 49 229 161
% 11.2 52.2 36.7
Stage 1 N 140 254 52In your opinion how % 31.4 57.0 11.7high in fibre is your diet? Stage 2 N 140 254 49
% 31.6 57.3 11.1
Stage 1 N 48 174 227In your opinion how % 10.7 38.8 50.6high in sugar is your diet? Stage 2 N 42 170 234
% 9.4 38.1 52.5
Around three-quarters of the sample that reported meeting current dietary guidelines
(following a low sugar, low fat or high fibre diet) stated they had been doing so for at least 5
years for sugar (stage 1: 78.5%, n=175; stage 2: 80.2%, n=195) and fibre (stage 1: 77.9%,
n=311; stage 2: 73.4%, n=295). Around half of respondents also reported following a low fat
diet (stage 1: 48.7%, n=75; stage 2: 53.3%, n=96) for at least 5 years. The number of
employees stating that they had changed their diets since the introduction of the HB A scheme,
i.e. 6 months or less, was therefore considerably fewer, with 21.1% (n=38) for fat, 7.8%
(n=19) for sugar and 10.4% (n=42) for dietary fibre.
Overall, there was no change in the number of employees ‘agreeing/strongly agreeing’ that
they ate a healthy diet at work or home. Less than half of the sample were in agreement at
work (stage 1: 48.3%; n=204; stage 2: 49.9%; n=209) (Figure 4.23).
85

Figure 4.23
"I tend to have a healthy diet at work"
STAGE
Whereas around three-quarters of respondents believed that they ate a healthy diet at home
(stage 1: 77.0%; n=345; stage 2: 76.2%; n=339) (Figure 4.24).
Figure 4.24
"I tend to have a healthy diet at home"
$ $ I s $S’ I* ! 8* §>I; q %
Self efficacy for changing dietThe vast majority of the sample (stage 1: 86.7%, n=386; stage 2: 88.4%, n=395) said they felt
confident in choosing a healthy diet (Figure 4.25), which did not change at stage 2.
86

Figure 4.25
"I feel confident that I know what foods
I should be eating to have a healthy diet"
Reported eating habit changes: attempts and successes
Employees who reported that they were not following current nutritional guidelines for fat,
sugar or fibre were asked if they had tried to change their intake in the last 3 months. Of the 3
nutrients, respondents tried to change their fat intake the most, although this declined at stage
2 (stage 1: 46.3%, n=130; stage 2: 41.9%, n=l 12), followed by sugar intake (stage 1: 32.7%,
n=73; stage 2: 33.5%, n=67), and lastly dietary fibre (stage 1: 30.2%, n=16; stage 2: 30.2%,
n=16), neither sugar or fibre changed over the 2 stages. Employees were then asked how
successful they had been in making their intended changes, over half of workers said they had
been ‘extremely successful/fairly successful’ in reducing fat intake at both stages, which
reduced at the second stage (stage 1: 60.0%, n=78; stage 2: 53.0%, n=62). Nearly two-thirds
of those responding reported being ‘extremely successful/fairly successful’ in reducing sugar
intake at stage 1 (67.1%, n=47), although this declined at stage 2 (46.4%, n=32). There were
no trends in the sample in relation to socio-demographic factors.
Perceived changes in overall consumption of key food items
Employees self perceived changes in their intake of 16 key food items/groups over the
previous 6 months are summarised in Table 4.20. In terms of cutting down ‘less healthy’
items, around 40% of the sample reported eating less red meat, processed meats, sweets and
chocolates, puddings and crisps/fried snacks. This was similar in the comparison group with
41.0% (n=50) of the sample reporting eating less red meat, 43.3% (n=52) reporting that they
ate less processed meats, 43.1% (n=53) less sweets and chocolates, 46.3% (n=57) reported
eating less puddings and 34.2% (n=41) eating less crisps/fried snacks. Approximately 35% of
employees reported consuming less fried food, biscuits and cakes and sugary drinks. This was
87

similar in the comparison group with 43.9% (n=54) of the sample reporting eating less fried
food, 36.9% (n=45) biscuits and cakes and 39.8% (n=49) less sugary drinks. In addition,
approximately 25% of employees indicated they were eating less hard cheese, with 25.6%
(n=31) in the comparison group.
In terms of eating more ‘healthy’ items, almost a third of respondents reported eating more
fruit, chicken and fish. A quarter of employees indicated they were eating more vegetables,
with slightly less reporting that they were eating more baked beans/pulses and starchy foods.
These changes were all mirrored in the comparison group, with 37.9% (n=47) of respondents
reporting eating more fruit, 45.1% (n=46) eating more chicken and fish, 34.4% (n=42)
indicated they were eating more vegetables, 21.1% reporting that they were eating more baked
beans/pulses and 27.6% eating more starchy foods.
Table 4.20: Employees’ perceived changes in consumption of key food items
More Less Same
N % N % N %
Chicken and fish (not fried) 122 30.2# 18 4.5 264 65.3
Red meat 18 4.1 181 41.1# 241 54.8
Processed meats 8 1.9 194 44.9# 230 53.2
Baked beans or pulses 87 19.3# 34 7.6 329 73.1
Hard cheese 33 7.5 113 25.6# 295 66.9
Reduced fat cheese 64 14.7 53 12.2 318 73.1
Starchy foods 76 17.0# 21 4.7 351 78.3
Fruit 143 31.8# 26 5.8 281 62.4
Vegetables 115 25.5# 17 3.8 319 70.7
Sweets or chocolate 22 4.9 184 41.2# 241 53.9
Puddings 7 1.6 173 38.5# 269 59.9
Sweet biscuits and/or cakes 17 3.8 164 36.8# 265 59.4
Crisps or other fried snack 24 5.5 171 39.1# 242 55.4
Any fried food 11 2.5 155 34.9# 278 62.6
Low calorie/sugar free drinks 66 14.8 62 13.9 318 71.3
Sugary drinks 7 1.6 154 35.0# 279 63.4
# indicates a favourable dietary change in line with current guidelines.
88

Socio-demographic variation in reported change Age group
In relation to changes in a healthier direction, the younger age group reported increasing
consumption of chicken and fish, beans and pulses, starchy foods, low calorie drinks, fruit and
vegetables more often than the >45’s, compared to 12 months ago (Table 4.21). On the other
hand, the older age group reported reducing hard cheese, fried food and fried snack consumption
more often than the younger age group. This reached significance for chicken and fish, beans or
pulses, hard cheese, starchy foods, fruit, vegetables, fried snacks and low calorie/sugar free
drinks.
Table 4.21: Perceived favourable changes in consumption of key food items by age group
<45 years >45 years
N % N % X2df=2 p value
Chicken and fish (not fried) 84 35.0 36 23.1 10.01 0.007***
Baked beans or pulses 68 24.0 19 11.4 11.47 0.003***
Hard cheese 59 21.7 50 31.1 8.78 0.012**
Starchy foods 64 23.3 11 6.7 21.59 0.000***
Fruit 98 35.5 43 25.9 7.71 0.021**
Vegetables 83 30.1 29 17.4 10.04 0.007***
Crisps or other fried snack 68 42.0 100 37.5 12.27 0.002***
Low calorie/sugar free drinks 49 18.4 17 10.2 7.88 0.020**
**p<0.05; ***p<0.01.
Gender
Women indicated they had reduced intake of processed meats, hard cheese, biscuits, puddings
and fried food more than men. This only reached significance for processed meats (48.2%,
n=146 of women compared to 36.2%, n=46 of men: %2=6.20df=2; p=0.045). Women also
recorded increased consumption of fruit and low fat cheese more than men.
Social class
Social class group 1 reported increasing chicken and fish and starchy foods more often than
social class group 2. Whereas social class group 2 recorded reducing consumption of sweets and
chocolate, biscuits and cakes, puddings, fried foods, and sugary drinks more often than social
class group 1 respondents. This did not reach significance for any of the food items.
89

BMI group
The overweight/obese group reported reducing processed meats, hard cheese, sweets and
chocolates, biscuits, puddings, fried snacks, fried food and sugary drinks more often than the
ideal weight group (Table 4.22). The overweight/obese also indicated they had increased
consumption of beans and pulses, low fat cheese, fruit, vegetables and low calorie drinks more
than ideal weight employees. This reached significance for hard cheese, fruit, fried snacks,
biscuits and cakes and puddings.
Table 4.22: Perceived favourable changes in consumption of key food items by weight status
Ideal weight group Overweight/obese group
N % N % %2df=2 p value
Hard cheese 60 22.3 51 31.7 5.99 0.050
Fruit 72 25.9 69 42.9 13.94 0.001***
Crisps or other fried snack 92 34.6 79 49.4 9.30 0.010**
Biscuits and cakes 87 31.8 75 46.6 9.70 0.008***
Puddings 94 33.9 75 46.6 7.73 0.021**
**p<0.05; ***p<0.01.
Weight related behaviour
Around half the sample (stage 1: 46.4%, n=208; stage 2: 47.3%, n=207) stated they were
trying to lose weight, with no change at the second stage.
4.6 Employee response to the introduction of the HB A scheme4.6.1 Awareness of the scheme
Around half of the sample (51.9%, n=228) were aware that their workplace had received the
HBA. A similar number (54.3%, n=244) had noticed symbols highlighting healthy food choices
on the menu. Over a third (39.6%, n=178) of the sample had noticed posters promoting
healthier eating, and around a fifth of employees had seen leaflets (22.3%, n=100) and cards on
tables (19.2%, n=86). A small number (5.1%, n=23) had seen drink mats in the canteen.
Women (57.2%, n=175) were more likely to know that the workplace had received the award
than men (39.7%, n=52) (%2=11.25df=i;p=0.001). Fifty-three percent (n=204) of social class
group 1 respondents knew their workplace had the HBA compared to just over 40% (42.6%,
n=20) of those in social class group 2, however this difference did not reach significance.
90

Women (49.1%, n=155) were more likely to notice symbols highlighting healthier food
choices than men (37.4%, n=49 men) (x2=5.06df=i;p=0.024). Women (41.1%, n=130) also
noticed healthy eating posters more than men (36.6%, n=48), although the latter did not reach
significance. More older respondents (82.1%, n=87) found the highlighting of healthier food
choices useful than those in the younger age group (72.3%, n=133) (x2=3.52df=i;p=0.06).
4.6.2 Employee perceptions of the influence of the scheme on food choice
Two-thirds of employees (68.3%; n=250) stated they rarely/never chose the highlighted healthy
food choice. A fifth (20.5%; n=75) of employees chose the highlighted healthy choices 1-2 days
a week and 11.2% (n=41) of the sample chose highlighted healthy choices 3 or more days a
week. Seventy six percent (n=224) of the sample found the highlighting of healthy food choices
to be ‘very useful/useful’, with a quarter of employees reporting they were ‘not useful’ (24.1%,
n=71).
Approximately a quarter of respondents reported that their diets were ‘a lot healthier/slightly
healthier’ at home (23.8%, n=66) and work (26.1%, n=71) since the award was introduced.
Almost two-thirds of respondents said that they did not think their diets had changed because
they already followed a healthy diet at home (65.7%, n=182) and work (62.9%, n=171). A
minority (at work: 7.4%, n=20; at home: 6.5%, n=18) felt their diets had not changed because
they were not concerned about healthy eating. Even fewer believed their diet to be less healthy
now (at work: 2.9%, n=8; at home: 2.5%, n=7). More men (30.7%, n=23) than women (24.0%,
n=47) and more older (29.4%, n=50) than younger respondents (20.4%, n=20) said their diets
had changed positively at work as a result of the HBA scheme. But none of these differences
reached significance.
4.6.3 Interest in other nutrition education programmes in the workplace
Nearly 40% of employees (38.6%, n=174) said they would find a diet and exercise group useful
at work, with less (28.1%, n=126) indicating an interest in labelling of the calorie content of
foods in the canteen, and even less (13.7%, n=62) of the sample saying a slimming group would
be useful.
More women (41.3%, n=131) said they would like a diet and exercise group than men (31.8%,
n=42) (x2=3.56df=i;p=0.059); and more women (17.7%, n=56) would like a slimming group
compared to men (4.5%, n=4) (x2=13.48df=i; p=0.000). More overweight/obese respondents
(48.1%, n=78) said they would like a diet and exercise group than ideal weight respondents
91

(33.8%, n=94) (%2=8.83<if=i;p=0003); and a slimming group compared to the ideal weight
group (22.8%, n=37) (%2= 18.44df= i; p=0.000).
92

CHAPTER 5: RESULTS OF THE EVALUATION FROM THE CATERERS PERSPECTIVE
5.1 Introduction
All workplaces receiving and still holding the HBA between 1990-1995 and all public eating
premises receiving and still holding the HBA between 1990-1994 in Leicestershire were
invited to participate in the study (details of methodology are in section 3.3 and 3.4). All of
the 23 eligible agreed to participate. The audit and interviews were carried out with 12
caterers in workplaces: 6 catering managers (community hospital, mental health services
hospital, building society head office, service industry research centre, local authority and a
building equipment manufacturer) and 6 cooks/catering managers (pharmaceutical company,
shoe manufacturers, 2 industrial machinery manufacturers, head office of a food manufacturer
and a service industry). In the public setting the caterers comprised 11 caterers: 4 cafe
owners, 2 catering managers of leisure centres, 1 hotel owner, 2 pub landlords and 2 catering
managers of restaurants.
The results are presented in this chapter for the 2 components of the study with caterers: the
audit and caterers interviews.
5.2 Audit of catering establishments
5.2.1 Length of time premises had held the award
The length of time premises had held the award is illustrated in Table 5.1.
Table 5.1: Length of time premises had held the award
>4 years
Workplaces
n=12
0
Public eating places
n=l 1
3
3 years 5 4
2 years 0 2
1 year 1 3
<1 year* 5 0
* < 1 year but more that 6 months.
93

5.2.2 Customer numbers
Eleven premises estimated that they served less than 100 customers daily, 9 served between
100-200 customers a day and the remaining 3 workplaces served more than 200 customers a
day (Table 5.2).
Table 5.2: Estimated daily customer numbers
Workplaces Public eating places
n=12 n=l 1
<100 customers daily 4 7
100-200 customers daily 5 4
>200 customers daily 3 0
5.2.3 Compliance with HBA criteria
Compliance of premises with HBA nutrition criteria are illustrated in Tables 5.3a/b. All
premises complied with 11 of the 34 criteria: type of milk (criteria 2); tinned fish (criteria 4);
type of bread (criteria 5); potatoes (criteria 7); jacket potato fillings (criteria 8); low sugar
drinks (criteria 18); type of meat (criteria 25-27); yogurts (criteria 32) and sauces (criteria 34).
All public eating establishments complied with an additional 11 criteria: low fat milk in
cartons (criteria 3); egg dishes (criteria 9); vegetarian dishes (criteria 10); rice, pasta and
chapattis (criteria 11 and 12); salads (criteria 13); spreading fat (criteria 16); healthy snack
items (criteria 20); vegetables (criteria 21); gravy (criteria 24); and sandwich fillings (criteria
28).
However, several areas were revealed where the criteria for the HBA were not being met.
Approximately half of premises did not meet the criteria for: type of fat in cooking (criteria
14); type of spreading fat (criteria 15); low fat cheese (criteria 29); fruit (criteria 30); and
healthier puddings (criteria 31). One-third of premises did use wholemeal in baked products
(criteria 6). These findings were evenly distributed between workplaces and public eating
places. Approximately a quarter of caterers reported not meeting criteria for sauces (criteria
33), which was more common in workplaces, and providing one-third of menu sections as
healthy choices (criteria 1). Half of workplaces were not meeting the snack criteria (criteria
20). A third of workplaces did not meet the criteria for egg dishes (criteria 9) and higher fibre
varieties of starchy foods (criteria 11). A small number of premises did not meet the criteria
for pulses (criteria 19); low fat milk (criteria 3); type of spreading fat (criteria 16 and 17);
salads (criteria 13); or sandwiches (criteria 28).
94

Table 5.3a: Compliance of HBA premises with nutrition criteriaWorkplaces
n=12Public eating places
n = llHBA criteria Meeting
criteriaNot
meetingcriteria
Meetingcriteria
Notmeetingcriteria
Menu sectionsmeetingcriteria
1. There are one-third healthy choices available in each section of the menu
9 3 8 3
Type of milk 2. Low fat milk is available for drinks 12 0 11 0
3. Low fat milk is sold in cartons to customers 11 1 11 0
Type of tinned fish
4. Tinned fish is always in brine, tomato sauce/water
12 0 11 0
Type of bread 5. Wholemeal/granary bread is always available for sandwiches/rolls
12 0 11 0
Flour in baking
6. At least 25% of wholemeal flour is used in baked products (highlighted healthy choices)
7 5 8 3
Potatoes 7. Potatoes without added fat were available every day
12 0 11 0
8. At least one-third of fillings were low in fat 12 0 11 0
Egg dishes 9. Egg dishes are made with a minimum of fat and a maximum of 2 eggs per portion (highlighted healthy choices)
8 4 11 0
Vegetariandishes
10. At least one-third of vegetarian dishes are healthy choices, i.e. no more than loz hard cheese, 2oz half fat cheese or loz nuts per serving
10 1* 11 0
Rice, pasta, chapatti
11. Mixture of white/wholemeal varieties are available
8 4 11 0
12. They are served without added fat 12 0 11 0
Salads 13. At least l/3rd of salads are mayonnaise/oil dressing free
11 1 11 0
Type of fat 14. Polyunsaturated fat is used in all cooking 6 6 5 6
15. A choice of butter/ polyunsaturated margarine and low fat spread are available in portions
7 5 5 6
16. Polyunsaturated/low fat spread is used for spreading
10 2 11 0
17. Fat is spread thinly 10 2 11 0
* Missing data: vegetarian dishes=l.
95

Table 5.3b: Compliance of HBA premises with nutrition criteriaWorkplaces
n=12Public eating places
n=l 1HBA criteria Meeting Not Meeting Not
criteria meeting criteria meetingcriteria criteria
Drinks 18. Un-sweetened fruit juice, sugar free squashes or mineral water were always available
Use of pulses 19. Pulses used in a variety of dishes, > once aweek
Snack items 20. Healthy alternatives are available for atleast one-third of healthy food choices
Vegetables 21. Fat is never added to cooked vegetables
Type of meat for healthier dishes
22. There are clear specifications for meat suppliers about the fat content of meat
23. Skin is removed from poultry
24. Gravy is made without meat fat
25. Mince/stewing steak is dry fried
12
10
10
11
10
10
12
0
1*
1
2
2
0
11
10
11
11
9
9
11
11
0
26. Meat is trimmed of visible fat before
cooking
12 11
27. Lean meat portion sizes were no more than 6-8oz raw weight
Sandwiches 28. At least one-third of fillings are low in fat
Type of cheese
Availability ofhealthierpuddings
Type of sauces (roux)
29. A reduced fat hard cheese is used in all highlighted healthy dishes, or a maximum of loz of hard cheese per portion
30. Fresh fruit is always available
31. At least one-third of puddings are healthy choices
32. Low fat/sugar yogurts are always available
33. Healthier food choices are made with a low fat cornflour sauce
34. Sauces are made with low fat milk
12
10
7
8
8
12
8
12
11
11
5
6
6
11
10
11
* Missing data: vegetables=l.
96

5.2.4 Marketing of the healthier food choices
The use of a symbol to denote healthy food choices on the menu was the only form of
promotion in most cases, with 15 establishments using this method (9 workplaces and 6
public eating places). Eight premises (3 workplace and 5 public eating places) had a
statement on the menu encouraging special requests for healthier food choices and 3 premises
(1 workplace and 2 public eating places) stated that the food server informed the customer of
healthier choices. One public eating place had a separate healthier section on the menu and 1
highlighted vegetarian choices only. Three workplaces did not highlight or promote the
healthier food choices at all.
5.2.5 Trends in uptake of food items
An increase in the uptake of several healthier food items was reported since receiving the
HBA (Table 5.4). Approximately half of caterers reported an increase in sales of higher fibre
bread/higher fibre bread sandwiches. Over one-third of premises reported an increase in sales
of healthy food choices and polyunsaturated margarine portions. Workplace caterers reported
more changes in uptake, with just under half reporting an increase in sales of low fat spread
portions and low sugar drinks. Approximately a third of workplace caterers reported
increased sales of healthy snacks, semi-skimmed milk in cartons and healthier salads. Despite
these reported positive changes in purchasing patterns, the uptake of less healthy choices of
whole milk, butter, chips, sugary drinks, chocolate and sweets remained the same in the
majority of premises.
Table 5.4: Premises reporting increased sales of healthier food items*
Labelled healthy food choices
Workplaces (n=12)
3
Public eating places (n=l 1)
6
High fibre bread 7 5
High fibre bread sandwiches 6 5
Polyunsaturated margarine portions 3 5
Low fat spread portions 5 0
Low sugar drinks 5 0
Healthy snack alternatives 4 0
Semi-skimmed milk cartons 3 0
Salads 3 0
* food items are only listed where at least 3 premises reported an increase in sales.
97

When caterers were asked to estimate the proportion of their sales that were of healthier food
choices, a quarter of premises estimated that between 11-30% of sales were of healthier food
items (Table 5.5). Half of caterers estimated that between 31-40% of their total sales were of
healthier food choices. Less than a quarter of premises estimated over 40% of sales were of
healthier food choices.
Table 5.5: Estimated sales of healthier food choices
% of sales Workplaces (n=12) Public eating places (n=l 1)
11-20% 3 0
21-30% 0 3
31-40% 5 7
41-50% 2 0
51-60% 0 1Missing data: 2 workplaces were unable to estimate sales of healthier food choices.
5.3 Caterers interviews
The interviews were carried out at the 23 establishments described in section 5.1. The
qualitative data obtained from the tape recorded catering interviews offered a valuable insight
into the views of the caterer. The themes which emerged from the transcribed data are
summarised in table 5.6.
Table 5.6: Emergent themes from interviews with caterersOrganisation of The dietitian’s rolethe scheme Adequacy of resources
Time scale of the award process
Implementing the Easiest changesnutrition changes Hardest changes
The level of nutrition criteriaSupport within the organisation
Facilitating the Knowledge of healthier cooking practicehealth promotion Need for healthy eating trainingrole of caterers Responsibility of caterers in promoting health
Value of the award to caterers Effect on food purchasing costs
Caterers views on Customer responsethe effect of the Effect on customer numbersHBA on Influences on customer food choicecustomers Success in changing eating habits
98

5.3,1 Organisation of the scheme
The Dietitian’s role
Thirteen interviewees (8 workplaces and 5 public eating places) thought that the award was
well organised with good support from the dietitian. The dietitian was described as helpful,
thorough and able to spend time with caterers initially in modifying their menus, suggesting
healthier recipes and setting goals to meet the HBA criteria. The catering manager of a
building society head office received 4 visits to advise on modifying menus, summarises this
process:
“She looked at our menu and then went through it with me... she would go away then
write to us saying what we'd spoken about that day and then she'd come in again and
reassess my menus, and then there'd be things there that would have to change again
and all the time she would call the head chef in as well and we'd go through the head
chefs procedures. ”
One workplace was less enthusiastic about the role of the dietitian, commenting that there
seemed to be a lack of communication between the dietitian and EHO in his area, which
resulted in a delay in receiving the award. Two workplace caterers mentioned that they felt
valued and trusted by those implementing the scheme, giving them an incentive to continue to
comply with the criteria. Two caterers mentioned that they felt isolated and would have liked
to have further contact after receiving the award, possibly every 6 months to keep them
motivated and to offer further suggestions to improve their meal provision.
Adequacy of resources
Caterers mentioned a range of resources they received after meeting the award criteria: tent
cards, balloons, posters, heart stickers to promote healthy choices, healthy eating leaflets and
photocopies of recipes. Just over half (12) of the interviewees were satisfied with the
resources they had received. Two workplaces had created their own displays and they would
have liked help with this, including the presence of the dietitian, HPO or EHO to answer
customers’ questions. One catering manager (Mental health services hospital) noted that there
were insufficient resources available when an establishment was working towards the award:
“Before we got the award, I thought it was a bit limited... the only thing we got was a
poster saying ‘We are working towards a Heartbeat Award'... so we had to create a
lot for ourselves. ”
99

One catering manager highlighted the need for literature to involve other catering staff. Two
managers mentioned that they would have liked more information on what was expected of
them in implementing the award and a set of standard menus with highlighted healthy food
choices for reference. Four caterers would have liked more help with resources to promote
the healthy food choices on the menu and in the eating area, and more information for
customers:
"It should have a higher profile, I don't think you know, one little certificate and a few
tent cards are enough. I think there has to be something else. I wouldn't mind putting
up a couple of posters as long as they were tastefully done." (hotel owner)
Some caterers mentioned that although resources were provided for the launch of the award,
there was no help with promotion throughout the year. There was also a feeling that the HBA
needed promoting more within Leicestershire, and that local publicity was waning and
restricted to national healthy eating campaigns:
" I think the first couple of years were really good because the [local newspaper] were
doing a lot towards it, and it was on the radio quite a lot, but you don't hear a lot
about it that way now." (cafe owner 2)
Time scale of the award process
Just over half of the catering managers (13) thought that the award process was too slow,
several interviewees mentioned how the slow pace dampened their enthusiasm and other
catering staff lost interest, as the catering manager of a community hospital explained:
‘7 think it took a long time to get, [it took] nearly 2 years...and when we went to
collect the award that’s what the others were saying as well. It took so long to get you
lost interest. There’s sort of a lot to start with, everybody’s geared up for it, you sort
of train your staff and things, then there’s a great lull... You know it seemed to go off
the boil... ’’
The reasons given for the slow pace were waiting for: new menus to be produced (2
premises); the dietitian to analyse the nutritional content of delivered/pre-prepared meals (3
100

workplaces); structural changes to comply with food hygiene criteria (1 workplace); and lack
of time to implement the recommended changes (6 premises).
Three workplaces noted that they waited around 6 months to receive the award after they had
been officially told that they had reached the HBA criteria. In addition, 3 caterers had
experienced problems with the renewal of the HBA being slow.
5.3.2 Implementing the nutrition changes
Easiest changes
Caterers found changing provision of basic food items to be the easiest changes to make,
particularly type of fat, milk, spreading fat, bread, low sugar/sugar free soft drinks and
providing low fat yoghurts. In addition changing cooking methods to grill, poach and steam
food more often were described as easy. The cook/catering manager of a service industry
mentioned that the easiest changes were the ones the customer did not notice:
“...things that the customers wouldn’t pick up really. Not that it’s deluding them or
anything, but you can have halfAow fa t spread on and nobody said a word. ”
Hardest changes
Changing the attitude of the chef was described as the main challenge to implementing the
nutrition criteria by 6 catering managers (3 workplaces and 3 public eating places). The
difficulties focused on the need for re-education to use lower fat cooking methods, as chefs
did not want to compromise taste, as a catering manager (service industry research centre)
said:
“...the Head Chef who's I'll say from a hotel background and used to putting just
about everything into a dish to make it taste wonderful, it was almost against his
religion really to stop cutting fa t now. [His] opinion was [that]... I'm not going to
compromise on flavour. But it’s the hardest thing... re-educating somebody who's
trained in the French culinary art, to stop putting so much cream into things... ”
Four premises experienced difficulties in conforming to the HBA criteria as most menu items
were purchased frozen, which meant a further delay waiting for the menus to be analysed by
the dietitian, or the nutritional composition being made available. These sites also had less
flexibility in planning menus.
101

The most difficult nutritional changes to achieve the award included: modifying traditional
puddings, adding wholemeal flour to baked products, using low fat cheese, providing healthier
snacks and imaginative healthy food choices. Providing one third of the menu as healthy food
choices every day was problematic for 3 caterers due to the limited number of choices they
had on the menu. Preparing a sauce using the lower fat cornflour method rather than a roux
sauce was seen as sacrilege by 3 chefs/cooks, as one catering manager explained (building
equipment manufacturer):
“When I first started catering, the old fashioned way of thickening a sauce was with
flour and water, that tended to be frowned on as being a cowboy sort of thing and so
the roux was the proper think to do, so we had to take an about turn, and go back to
basics. ”
The level of nutrition criteria
Most (18) premises described the standard of nutrition criteria as realistic, as the catering
manager of a community hospital explained:
“I think one-third is realistic because you can still give the staff the unhealthy choice
if they want. I think if they’d have said half and half we’d have struggled. ”
Even though most caterers thought the criteria realistic, 3 of these catering managers said it
had been a lot of work, however 4 caterers imagined that the nutrition criteria would have
been harder than they were:
“It could have been a lot worse. They could have come in and audited the recipes and
things like that, which would have made it a lot stricter, so I thought it was quite fair. ”
(catering manager, building equipment manufacturer)
Marketing the healthier food choices was described as difficult by 3 workplace caterers,
because of changing menus, a new chef, lack of organisation, lack of resources and guidance
on how to promote healthier food choices. Five premises also mentioned that they did not
always provide healthy food choices:
102

“You do forget don’t you. You learn everything initially and there are parts that you
do forget. I sort of have to nag my staff because they don *t always put out the healthy
sweets ...which they need to do. So I have to keep reminding them. ” (catering
manager, community hospital)
5.3.3 Support from within the organisation
(This theme was only appropriate for workplaces)
The majority of workplaces (10) said they had received support from site management for
their HBA application. For 3 of the contract caterers, they had a lot more encouragement from
their catering companies than from the workplace where they operated. The motivation to
achieve the HBA appeared to be to enhance the image of the contract catering company with
their clients. Five caterers mentioned that management had been interested in the scheme
because of its association with improving health and reducing staff sick time. Two of the
caterers reported that management became interested after receiving publicity in the local
press.
Seven of the workplaces had occupational health departments, but all of the catering managers
at these sites reported that they had not been involved either in assisting with getting the
award or promoting it afterwards.
5.3.4 Facilitating the health promotion role of caterers
Knowledge of healthier cooking practice
Fourteen of the caterers felt they were up-to-date on healthier cooking methods, 4 of these
reported that this was as a result of the input they had received from the dietitian, describing it
as an educational process. Three caterers doubted that their catering assistants were informed.
In 1 workplace, the serving assistants only came in to serve lunch, so they had not had much
exposure to the reasoning behind the award and the healthy food choices. The catering
manager of the community hospital did not feel well informed as they provided all delivered
meals and it was therefore difficult to know how the meals had been prepared.
Need for healthy eating training
All establishments thought they would have liked a training session, several mentioned that it
needed to involve all catering staff, and would be a way to motivate and involve them.
Caterers suggested that training should be around the time of application including: menu
planning, healthier cooking methods, award procedure, labelling and marketing of healthier
103

dishes. Several also proposed on-going training and networking with other HBA
establishments, to share ideas, keep motivated and up-to-date. Allocating time for training
was a concern for 1 public establishment. One catering manager (service industry research
centre) suggested that some chefs may be reluctant to attend a training session, describing
their possible reaction:
"[you] have to be very careful how you handle them, they might feel that it's insulting
to go to something like that and told how to cook healthy. ...There are some who've
been to the best colleges you know... and if you turn around and say well we're going
to send you on a healthy eating course!... "
5.3.5 Responsibility of caterers in promoting health
The majority (18) of caterers mentioned that it was their responsibility to offer customers a
choice, but not to try and influence their choice, except for making information available to
the customer. Cafe owner 3 summed up this view:
“7 think everybody’s responsible for what they eat - 1 don't think we can tell customers
‘you're not having egg and bacon and fried bread'... we have the menu on the table
and I think it's their choice. I don't think we're responsible for them."
Some workplace catering managers were reluctant to ask their staff to promote healthy
choices to customers for fear they would react negatively, as one catering manager (service
industry research centre) explained:
“/ think if the staff started telling them ‘well you should have this', then they'll feel we
were ramming it down their throats. ”
5.3.6 Value of the award to caterers
All catering managers said they valued the award for a variety of reasons, most frequently (10
caterers) for promoting health and preventing CHD. Caterers also felt the award was valuable
in improving their nutritional knowledge; making customers more aware of healthy eating;
showing that they had achieved a certain standard in catering; potentially influencing food
choice and lastly as an achievement after a lot of hard work, as the catering manager of a
community hospital explained:
104

“/ think it makes all the staff proud o f where we work to think they've got something,
worked hard for it and achieved it. ”
For some caterers in the public setting, there were perceived benefits from a business point of
view, including enhanced trade resulting from the initial publicity and improved image
resulting from holding the award:
“When we won the award and you advertise the fact in so many papers, our business
really rocketed and since that week o f all the advertising we've never looked back. So
as regards financially, it's been marvellous for us. ” (cafe owner 1)
5.3.7 Effect on food purchasing costs
The majority (18) of establishments did not think the HBA had effected their food costs. Five
premises thought it had increased costs marginally, mentioning the higher costs of some
products: polyunsaturated margarine and oil compared to hard margarine and lard, and low fat
cheese compared to full fat cheese. One catering manager noted the extra expenditure for re
typing and printing new menus.
5.3.8 Caterers views of the effect of the HBA on customers
Customer response
Five caterers had not had any customer reaction, some workplace caterers were relieved that
customers had not noticed the changes, sometimes deliberately keeping the award low profile:
“I like to think that they are eating healthier without knowing it... I have implemented
these changes without causing disruption, without them being upset... they’ve not
noticed. They are eating healthier, but I ’m not ramming it down their throats. ”
(catering manager, building equipment manufacturer)
Customers had reacted negatively in 3 workplaces, particularly the ‘works’ staff. Complaints
were based on the view that the HBA meant that there would be less choice and the food
would not be as tasty. One cook/catering manager (pharmaceutical company) described this
response:
“... 'Do we have to eat healthy now ’ one of them said, I said ‘No you eat what you
like’, ‘so can we have chips with it?’ they said... ”
105

Two workplaces described how the award had stimulated discussion about healthy eating and
therefore educated customers. Customers had reacted positively in 4 workplaces and 3 small
cafes, by being impressed that the premises had received the award, or by being positive about
the new menu, particularly from women, office staff and those trying to lose weight.
Effect on customer numbers
Two thirds of establishments (11 workplaces and 4 public eating places) thought customer
numbers had not changed since receiving the award. Workplace caterers believed this was
because they had a captive clientele and the same staff used the canteen as before. Those in
the public setting stated that they were already busy. Seven premises (1 workplace and 6
public eating places) thought customer numbers had increased since receiving the award
because they had succeeded in attracting and keeping new customers who were trying to lose
weight. They also reported that the publicity and association with the HBA had improved
their reputation, and had therefore attracted more customers.
Influences on customer food choice
Seven workplace caterers felt value for money was the most important influence on food
choice, as the catering manager of a building equipment manufacturer reported:
"Value for money, what looks biggest for less, that’s all their interested in... they don’t
like to pay for their meal, it’s subsidised and it’s really cheap. They think the
company owe it to them, to have a cheap or free meal... ”
Workplace caterers also felt appearance, quality of food (defined as home cooked meals),
satiety value, the weather and taste were important. The availability of healthy food choices
was mentioned as an influence by 1 catering manager. Peer pressure and the influence of
what others had eaten for their lunch were also highlighted as important:
‘7 think it depends who they're with... perhaps peer pressure might be something that’s
in there. ... when like o f group o f young lads come in, it's how many chips they can
pile on their plate you know, who can get the most. ” (catering manager, service
industry research centre)
106

The appearance of food was seen as the most important influence in public settings. Caterers
in public eating places also highlighted: freshness, weight control, price, the weather and
novelty. The availability of healthy food choices was not mentioned at all. Cafe owner 4
believed that many customers already had a preconceived idea of what they wanted to eat
before they go out:
“People have got an idea o f what they are gonna have before they even walk in.
...when you go out for a meal you sort o f have this perception of what your gonna have
- or what you'd expect from the place and that's why you sort of decide to come here
or you decide to go across the road... ”
Success in changing eating habits
Nine caterers (4 workplaces and 5 public eating places) thought the introduction of the award
had positively effected eating patterns, particularly for items that were normally high in fat
and sugar, as cafe owner 2 described:
“I think it helps steer people in the right direction... and when they see the cake they
think ‘Ooh I can have a bit o f cake ‘cos its got no fat in it' and it gets them more
interested in it, but because I've given them the choice... it works quite well. ”
Four workplace caterers felt that the HBA had enhanced customer awareness of healthier
eating, saying it made them think before choosing:
“...it makes them think ‘Oh, this is the healthy eating dish, I really ought to be having
this today’. ” (catering manager, mental health services hospital)
Four workplace caterers felt that although more customers were eating healthily, they were not
sure whether this was due to the HBA scheme or general public interest in healthy eating.
Two workplace caterers reported that customers changed when the scheme was first, this is
summed up by the catering manager of a service industry research centre:
“The healthy options seemed to sell a lot more [when the HBA was first introduced]...
the minute we put on a healthy option, ... and we're selling out o f that... and that
seems to suggest people are eating more healthier. ”
107

Five workplace caterers noticed changes in customer purchasing of certain foods, where
healthier foods were purchased instead of less healthy ones, this was mentioned for type of
yoghurt, milk and spreading fat portion. When asked if they had noticed whether these
changes were restricted to certain parts of the workforce, several caterers stated that women (3
caterers), older staff (3 caterers) and non-manual employees (4 caterers) tended to eat more
healthily anyway. As one catering manager described the food choices made by her
customers:
*7 would argue that sedentary people will eat sort of less fat, not so obviously so many
chips and starchy foods whereas a manual worker here will have steak and kidney pie,
chips and you know stodgy food and a nice big fat sponge pudding. ” (catering
manager, local authority)
Some caterers in the workplace thought after initial resistance, there had been an increased
acceptance of the award by men and manual workers, describing how these groups were
choosing more healthy options than before. One cook/catering manager (industrial machinery
manufacturers 1) described what happened in his site:
‘7 think the biggest thing that I've noticed is that the works have caught up now what I
would say with the staff, whereas the staff accepted it to start with, the works were
rather suspicious... ”
Six caterers (3 workplace and 3 public eating places) had not noticed any changes in food
uptake. Others noticed a change in eating habits of a small minority of customers who were
already interested in change, which is illustrated by this comment from a caterer at a
pharmaceutical company:
"...People that were careful what they ate, sort o f the girls that were faddy... they sort
of carry on doing it.... I don't think many people pay much attention to it... I suppose a
few people's ideas changed about what was healthy. ...They still come in and want
their chips and want their cake and chocolate unfortunately. ”
108

CHAPTER 6: RESULTS OF THE EVALUATION OF THE CUSTOMERS PERSPECTIVE: IN THE PUBLIC SETTING
6.1 Introduction
All 11 establishments in Leicestershire open to the public receiving and still holding the HBA
between 1990-1994 agreed to participate in the study, having all held the HBA for at least one
year (methodology is described in section 3.5). These comprised 1 hotel, 2 leisure centres, 2
public houses, 2 restaurants and 4 cafes, all were located in Leicestershire county (a rural area)
and were outside Leicester city boundaries, as there were no public eating establishments with
the HBA in the City. The results of the customer survey are presented in this chapter. A total
of 377 customers were approached, of whom 271 returned completed questionnaires. The
average response rate of 72.3% varied from 47.5% to 100% between the 11 establishments.
6.2 Socio-demographic characteristics
Table 6.1 shows the socio-demographic characteristics of the sample, which comprised adults
whose age ranged from 16 to 80, two-thirds were aged under 45 and the majority were white,
female and lived with their partner. Social class distribution indicated that around half of
respondents were from social class groups I, n, HI non-manual, with only 13.2% (n=35) in
social class groups ID manual, IV and V (the HBA target group).
6.3 Awareness of the HBA scheme
Fifty three percent of the sample (n=143) were unaware that the establishment had received
the HBA. Those aged >45 years (n=48, 57.1%) were more likely to know that an
establishment had a HBA compared to those under 45 years (n=68, 39.8%), (%2=6.86df=1;
p=0.009). Although women were more aware of the HBA than men, with 105 (49.5%)
women versus 22 (37.9%) men, the difference was not significant (%2 =2.59df=1; p=0.116).
Additionally, there was no significant difference in awareness of the award between social
class groups. Of the 127 customers (47.6%) who knew about the award, the vast majority
(n=l 17; 92.3%) said that they did not choose the establishment because it had a HBA.
109

The majority of respondents (n=209; 78.0%) believed that the establishment offered healthy
meals and snacks. Those aged 45 years or more were more likely to believe this with 91.7%
saying yes (n=77) compared to 69.8% (n=l 18) of under 45's (X2=15.48df=2; p=0.000).
Table 6.1: Socio-demographic characteristics of the sample
N %
Gender: Women 212 78.5Men 58 21.5Total 270
Age: <45 years 171 67.1>45 years 84 32.9Total 255
Ethnicity: White 264 97.4Not indicated 7 2.6Total 271
Living situation: Live alone 39 14.7With partner 187 70.3Other 40 15Total 266
Social class group: I professional & 89 33.5II Managerial
HI Non manual 50 18.8
El Manual & 35 13.2TV Non skilled
Not Working 92 34.6Total 266
Missing data:- gender:!; age: 16; living situation:5; social class group:5.
6.4 Influences on eating place
The main influences on choice of eating place were quality of food, price, service, variety and
location (summarised in Table 6.2). The availability of healthy food choices was least often
selected, but nearly twice as many women (n=72; 34.0%) as men (n=10; 17.2%) said this
influenced their choice of eating place (%2 =6.02 df=1; p=0.014). Availability of healthy food
choices was more important to those aged 45 or over, with 40.5% (n=34) stating that this
influenced their choice of eating place compared with 25.7% (n=44) of under 45's
(X2=5.77df=1; p=0.016). Women (n=160; 75.5%) were more influenced than men (n=35;
60.3%) by the quality of food (%2 =5.19df=1; p=0.023). Women (n=123; 58.0%) were also
n o

more concerned about good service than men (n=21; 36.2%) (%2=8.71df=1; p=0.003). There
were no differences in social class groupings for any of these influences.
Table 6.2: Influences on food choice in public eating places
N %
Quality of food 195 72.2
Affordable price 162 60.0
Good service 144 53.3
Variety of choice 131 48.5
Location 114 42.0
Availability of healthy food 82 30.4
choices
Seventy two respondents (27.2%) thought that healthy food choices were more expensive than
other food choices. Those aged under 45 reported this more often, although the difference
was not significant: 51 (30.2%) of under 45’s compared to 17 (21.3%) of those aged 45 and
over 0c2=4.51df=3; p=0.211). There was no difference between social class group. Many
customers (n=152; 58.2%) thought that the price of healthy food choices was about the same
as for other choices. The majority of respondents (n=205; 78.9%) either ‘agreed’ or ‘strongly
agreed’ that healthy food choices should be available when eating out, even though this was
least often selected as an influence on choice of eating place.
6.5 Knowledge of HBA criteria
Customers were asked about the criteria for the HBA (Table 6.3). Just over two-thirds of
respondents (n=183; 67.5%) were unaware of all 3 main criteria of the HBA, whilst 88
(32.5%) understood correctly. Women were significantly more informed than men for all
criteria. Although age group differences were not significant for criteria 1 and 2, those aged
45 and over were significantly more informed about criteria 3 than the under 45's (%2=8.89df=1;
p = 0 .028).
i n

T able 6.3: C orrect resp on ses fo r H ea rtb ea t aw ard criteria by gender
Correct Response
Men Women Total X2 df=l P-value
Criteria 1
l/3rd of seating is N 16 108 124 10.00 0.002***
non- smoking % 27.6 50.9 45.9
Criteria 2 i
l/3rd of food choices N 16 110 126 10.81 0.001***
are healthy choices % 27.6 51.9 46.7
Criteria 3
Good standards of N 16 106 122 9.24 0.002***
food hygiene % 27.6 50.0 45.2
***significant at p<0.01 level.
Most customers (n=224; 82.7%) were unaware that menus had been assessed by a dietitian.
Thirty nine respondents (14.4%) incorrectly believed that the HBA implied that all food
choices were healthy choices.
6.6 Customers’ perceptions of their diets
Customers were asked for their perceptions of their own diet in terms of fat, fibre and sugar
(Figures 6.1-6.3).
Figure 6.1: Customers' perception
of fat intake
Very high/high
10.0%
Low/very tow
Average
57.4%
112

Figure 6.2: Customers' perceptions
of fibre intake
Low/very low
Very high/high
30.0%
Average
61 .5%
Figure 6.3: Customers' perceptions
of sugar intake
Low/very low
51 .9%
More women reported healthier diets than men, although none of these differences were
statistically significant (Table 6.4).
Very high/high
Average
35.9%
113

Table 6.4: Gender and age differences for nutrition goals of the HBA scheme in self perceived diet
Gender Age
Men Women 2X df=l P-value <45 >45 2
X df=l P-valueyears years
Very low/ N 13 75 3.56 0.059 39 40 15.98 0.0006
low fat % 22.4 35.5 22.9 47.6
Very high/ N 13 68 2.08 0.149 45 30 2.31 0.128
high fibre % 22.4 32.2 26.5 35.7
Very low/ N 41.4 116 3.37 0.066 75 57 12.69 0.0003
low sugar % 24 55.0 44.1 67.9
Comparisons were made between those achieving/not achieving nutrition goals.
The older age group were more likely to say that their diets were ‘low/very low sugar’,
‘low/very low fat’, compared with under 45 year olds. More of those aged >45 years said
their diets were ‘high/very high fibre’ than under 45 year olds but this difference was not
statistically significant. There were no significant differences for social class groupings in the
sample.
6.7 Attitudes to healthier eating
Table 6.5 summarises responses to questions concerning attitudes towards a healthier diet in
general. More women (n=142; 69.6%) than men (n=32; 58.2%) ‘agreed/strongly agreed’ that
‘healthy food tastes good’. More women (n=177; 85.5%) ‘agreed/strongly agreed’ than men
(n=42; 76.4%) with the statement ‘I know what I should be eating to have a healthy diet’.
More women (n=133; 64.3%) than men (n=26; 47.3%) ‘agreed/strongly agreed’ that they ‘eat
healthily at home’. But none of these differences were significant at the 5% level.
114

Table 6.5: Attitudes to healthier eatingStrongly agree/ Neither agree/ Strongly disagree/ Total
agree disagree disagree
Eating a healthy diet N 172 69 22 263
is very important to me. % 65.4 26.2 8.4
It is important that healthy N 206 50 5 261
food choices are available % . 78.9 18.5 1.9
when eating out.
I eat healthily at home. N 159 86 18 263
% 58.7 32.7 6.8
I know what I should be N 220 36 7 263
eating to have a healthy diet. % 83.7 13.3 2.2
Healthy food tastes good. N 174 74 12 260
% 66.9 28.5 4.6
With regard to age, those aged >45 years were more likely (n=60; 77.9%) to ‘agree/strongly
agree’ that they ate healthily at home compared to 51.2% (n=87) of under 45's (X2=15.91 df=2;
p=0.003). The older age group was also more likely (n=61; 79.2%) to ‘agree/strongly agree’
that ‘eating a healthy diet is very important to me’ compared to 58.2% (n=99) of under 45's
(X2=10.76df=2; p=0.001).
6.8 Knowledge of healthier eating
Table 6.6 illustrates that more than 90% of respondents correctly answered questions
concerning current nutrition guidelines for reducing fat, fried food, sugar, sweets and
chocolates and increasing fruit and vegetables, although there was still confusion over
whether starchy food consumption should be increased, with just over half of respondents
(n=136; 52.5%) answering correctly. There were no significant age, gender or social class
differences for starchy foods.
115

Table 6.6: ‘According to the latest guidelines to improve the nation's health, should people generally eat more or less of the following?'___________________________
More Less Same Not sure
Starchy foods N 136 37 76 10
% 52.5 14.3 29.3 3.9
Fried foods N 1 250 7 4
% 0.4 95.4 2.7 1.5
Fat N 0 253 9 2
% 0 95.8 3.3 0.7
Fruit & vegetables N 258 4 3 1
% 97.0 1.5 1.1 0.4
Sugar N 1 249 10 1
% 0.4 95.4 3.8 0.4
Sweets & chocolates
N 2 251 8 1
% 0.8 95.8 3.1 0.4
Bold indicates the desired response
116

CHAPTER 7: RESULTS OF THE EVALUATION FROM THE
DIETITIANS PERSPECTIVE
7.1 Introduction
All community dietitians involved in the HBA scheme at an operational level were invited to
participate in the focus group discussion and individual interviews (see section 3.6). Five
individual interviews and 1 focus group with all of the 5 eligible dietitians were conducted. A
summary of the themes which emerged are summarised in Table 7.1.
Table 7.1: Emergent themes from focus group/individual interviews with dietitians
Organisation of the scheme The dietitian's role Adequacy of resources Time scale of the award process
Implementing the nutrition changes The level of nutrition criteria Assessing menus Easiest changes Hardest changes
Compliance with nutrition criteria Need for monitoring Developing a monitoring system Marketing within premises Labelling healthy food choices
Factors influencing success for the Motivation of the caterercaterer Support within the organisation
Value of the award to caterers Anticipated customer response Availability of healthier products
Facilitating the health promotion role of Value of the award for dietitiansdietitians Targeting key settings
Involving customers Partial/staged award
Facilitating the health promotion role of Need for healthy eating trainingcaterers Responsibility of caterers
Improving the award nationally Promotion/increased publicity of the award Producing multi-cultural information Working with national food chains
117

7.2 Organisation of the scheme
7.2.1 The dietitian's role
Dietitians felt their input was crucial for assessing composite dishes and making suggestions
on modifying recipes. Dietitians also saw their role as ensuring the balance of meals and
looking beyond the HB A nutrition criteria. Dietetic input was thought to be essential in
maintaining the standard of nutrition criteria, and carrying out the final assessment:
"...I do think if the HBA is going to mean anything it needs to have dietetic input
somewhere along the line. ...if you're going to do it properly and look in detail at
what you're offering. I think you probably need dietetic expertise just towards the end
of the process..." (community dietitian 5)
Some activities were identified which did not require dietetic expertise: giving advice on
making general changes in food provision, such as providing wholemeal bread and lower fat
milk; and for looking through lists of delivered meals items, which was described as a
mechanical process.
7.2.2 Adequacy of resources
A general lack of resources for caterers was identified, particularly recipe and menu ideas,
which was seen as an opportunity to save time in writing letters and photocopying recipes, and
resources when premises were working towards the award:
"...there are no resources when an establishment is trying to achieve the award
because the HEA doesn't allow you to use any of the logos or symbols until you've got
it." (community dietitian 2)
The lack of time that dietitians had to give to the HBA scheme was identified as limiting the
quality of the award:
“/ think that there's lots that we could do if we had the resources to do it and the
whole problem [is] that we've had to really contain our resources to do what we do
now, and I think we all know that if we could do more, we'd feel it was more
successful. ” (community dietitian 1)
118

There was a feeling that the opportunity to promote healthier eating was not maximised within
the premises:
“You see, you've got an ideal opportunity for nutrition education of the customers as
well not only in saying ‘We've got a HBA ', but you know, having some back up healthy
eating information to go with it. ” (community dietitian 1)
7.2.3 Time scale of the award process
Of the 6 HBA premises discussed directly, a mean time of 14 hours was spent per award by
the dietitian and the successful premises took between 11 and 24 months to be approved. It
was perceived as important to work with the pace of the caterer, allowing them time to try out
new recipes with customers and make gradual progress, especially if there were a lot of
changes to make:
"I think it has to run a lot more slowly if an establishment has got so many changes to
make that it almost seems impossible..." (community dietitian 1)
The possible negative reaction of customers was seen as one reason for allowing caterers to
make gradual changes, as community dietitian 2 described:
"...there will be some establishments whose customers will take on the changes easily,
so they could easily get their award in a short time, but there will be other
establishments that need to, or want to, do the changes slowly and because they don't
think their customers will like everything that they want to do, and so they want to do
it in a stepwise way."
Other reasons given for the slow progress made were that some premises were: undergoing
organisational change; waiting for nutritional information about delivered meals; waiting for
premises to have structural changes to the dining area; getting new menus typed; inability to
find suppliers of healthier food products; and some premises were short staffed.
Dietitians reported that even after they had approved the premises for the award, there could
be a delay of several months whilst the local council arranged the award ceremony.
Community dietitian 3 described the experience of the community hospital she had approved
for the award:
119

"...[the local council] haven't had many HBA's and they were waiting for 2 or 3 to be
awarded together. The EHO wanted to have a publicity splash about it so he wanted
to have them together. So that's why he waited 4 months."
Most dietitians felt the premises needed visiting more often than every 2 years for renewal,
although there was concern that they could not allocate extra time to the scheme. Some
dietitians carried out renewals by phone if they had confidence in the caterer involved, to save
time.
7.3 Implementing the nutrition changes
7.3.1 The level of nutrition criteria
Most of the dietitians thought the nutrition criteria were at an appropriate level, but there was
a feeling that they were too stringent in some workplaces, reducing compliance:
"1 think probably as a group o f community dietitians in retrospect, we were very
thorough and very detailed... how realistic is it that people will continue to that level
and maybe it’s too much to do all at once." (community dietitian 3)
One dietitian wanted premises to make as many improvements as possible, pushing them to
reach an ‘ideal’ standard before approving premises for the award. There was also some
evidence of stringency and inflexibility on the part of the dietitian, for a premises that waited 2
years to receive the HBA:
"...she was fulfilling the criteria almost from the beginning and what I was trying to do
was to encourage her to try new things and have more variety." (community dietitian
3, referring to a community hospital)
The level of criteria relating to puddings, roux sauces, spreading fat and low fat cheese were
thought to be impractical in some cases, leading to food wastage:
"...the caterer was going to do butter portions, low fat spread and flora type portions,
but because the uptake was so low and the use by date was so short that they decided
just to go for butter and flora because o f the practicalities of all 3." (community
dietitian 2, referring to the psychiatric hospital)
120

Although some puddings did meet the nutrition criteria, sometimes they were not allowed to
be highlighted as healthy choices as dietitians felt that this may give misleading messages:
"We also decided we wouldn't allow some of the puddings because although they were
low in the [delivered meals recipes], they wouldn't be low in other recipes, so it would
be the wrong message...and we don't want pastry, and people eating pastry, which as
a rule is high in fat, we didn't class those as healthy." (community dietitian 2,
psychiatric hospital)
There was however evidence of some flexibility and the need for criteria to be applied
realistically in each premises:
"...I would have been willing to compromise down to the exact HBA criteria, then as
long as I thought they were still working towards it, I would have still recommended
them for the award. I think there would have had to be some compromise. ”
(community dietitian 1, referring to the shoe manufacturer)
7.3.2 Assessing menus
Some dietitians used quantified criteria for fat to define a healthy choice. Advice was focused
on modifying the fat content of the menu, rather than that of sugar or fibre. During this
process the dietitian discussed how every dish was made, which was time consuming, as
community dietitian 3 described in her work with a crisp manufacturer head office:
"The discussions were very detailed and the meetings I had were an hour and a half
each, and you go into the nitty gritty, very detailed information , so if you're going
through detail for 1 item, you've got to for all the aspects..."
It was acknowledged that quantifying criteria encouraged dependence of the caterer:
‘7 was doing lots o f calculations which may have made her feel less confident about
being able to decide for herself whether it was a healthy option or not so that probably
perpetuated her need to consult me for every detail... ” (community dietitian 3, crisp
manufacturer head office)
121

Whereas other dietitians in the team used broader criteria to decide that a dish was a healthy
food choice:
"I didn’t put them through a computer or any thing...I just did a quick rough working
out o f ...how much margarine there was per portion...I didn’t give myself an upper
limit but looked at the content and decided what I thought a normal dish ought to
supply if it was lower in fat. I didn't set a maximum number of grams of fat...just for
making a guess at it really, not scientific I know...." (community dietitian 5, referring
to the service industry)
Delivered/pre-prepared meals posed particular difficulties, as it was time consuming analysing
the nutritional breakdown of products from manufacturers:
“/ suppose it involved a lot o f detailed work looking at the nutritional breakdown of
the products... I think snacks were a little bit o f a problem in the break times, we had
to write off to the manufacturers for those... ” (community dietitian 2, psychiatric
hospital)
7.3.3 Easiest changes
Dietitians observed that changing provision of basic food items were the easiest changes to
make, particularly: type of spreading fat, milk, bread, low sugar soft drinks and providing fish
in brine, fruit, low fat yoghurts, salads without dressing, including more jacket potatoes and
ordering leaner cuts of meat. Changing cooking methods by taking fat off meat, preparing
potatoes and vegetables without added fat and making cornflour sauces were also described as
easy.
7.3.4 Hardest changes
Finding suppliers of various healthier alternatives recommended by the dietitian was
sometimes difficult particularly for: catering size packs of sugar free squashes; semi-skimmed
milk jiggers; semi-skimmed milk in half pint cartons; healthier snack items; and lower fat
cheese.
Providing healthier hot puddings held back some workplaces from receiving the award. There
was also a problem with delivered meals sandwiches for 2 hospital applicants, as they were
122

provided for patient consumption and were designed to be high in calories, and were therefore
also high in fat.
7.4 Compliance with nutrition criteria
7.4.1 Need for monitoring
Monitoring was thought to be essential to ensure premises were still complying with award
criteria and to offer support to keep caterers motivated. Dietitians did not have further contact
with the premises until the award was due for renewal, hence there was concern over the lack
of monitoring and their lack of knowledge about whether HBA premises were complying with
nutrition criteria:
“...After I'd approved the award from my point of view with workload and so on I'd
have nothing more to do with it, which is not ideal from my point of view because
that's all that work and I don't know if its made a difference and probably not ideal
from [the catering manager’s] point o f view because I've offered her all this support
and...she might find she's got more problems that she'd like to speak to me, but
workload means they're approved and I have no more contact” (community dietitian,
referring to crisp manufacturer head office)
7.4.2 Developing a monitoring system
There was a feeling that the nutrition criteria were too detailed to facilitate a simple
monitoring system, as monitoring would involve looking at new recipes and checking they
were still fulfilling the criteria. Flexibility was perceived as important depending on the
amount of confidence that the dietitian had in individual caterers.
There was also concern over the length of time needed for extra monitoring. Dietitians did
not feel it would be an effective use of their time to carry out monitoring, and suggested that
someone trained in the process, such as the EHO or HPO could take on this role. There was
also a feeling that caterers should take on more responsibility for monitoring, but that they
needed training to be able to do so:
“We need to give them the power or ability to make those changes, so that they can
continue with the award. We need to help them to monitor that. ” (community dietitian
2)
123

Another suggestion was to monitor a percentage of premises rather than all. There was
concern that monitoring could create difficulties with the relationship of the EHO and the
caterer:
it's quite a big thing for establishments to be inspected if they are low risk and
suddenly perceive what's more inspections then it wouldn't seem fair on the
establishment. Most o f the establishments get the award because they are low risk
hygiene wise anyway so they might suddenly think why does the EHO keep coming
in... ” (community dietitian 1)
7.4.3 Marketing within premises/Labelling healthy food choices
Dietitians spent a lot of time discussing marketing strategies with caterers, including: labelling
of healthy food choices; presentation of food in the serving area; placing healthier food
options in prominent positions; and suggesting serving staff promote healthier choices.
Dietitians suggested that marketing should focus on the positive promotion of tasty, healthier
food, and that premises should solicit opinion about healthier food choices so that there is a
dialogue between caterer and customer. Suggestions included: tasting sessions; special offers;
themed days; making the healthier options cheaper; and including a free portion of side salad
in the price. The need to train all catering staff was discussed, particularly those with a role in
serving food:
“.../ always compare it to how frustrated I'd feel if I go to a restaurant... and say,
‘What's the soup ?' and they say they don't know and have to check, and the same
thing if anyone went up and said what's the healthy choice today and they didn't know,
it's not really a very effective method of health promotion and even if it's sort of
flagged up the caterer's got to support the scheme and they've got to have the
knowledge o f what the healthy choices are." (community dietitian 1)
Although highlighting of healthy options was one of the nutrition criteria, there was flexibility
depending on the type of establishment, as community dietitian 1 explained about a shoe
manufacturers:
“I would have considered ways around it, like they could have put up a poster saying
‘we have healthier choices on offer’, so maybe they didn't need to mark each
individual item, but they did need to make the workforce aware that there were healthy
124

options available across all sections o f the menu. So I would have been willing to
compromise... ”
The need to be sensitive to concerns over customer response in the workplace and making
subtle changes was mentioned:
“Maybe it would have been beneficial to that workforce if they could have made
permanent, behind the scenes changes that weren't necessarily displayed on the menu
board and they were choosing those products, a healthier version, without even
knowing it. ” (community dietitian 1, shoe manufacturers)
Some of the dietitians were aware that premises were no longer labelling their healthy food
choices even though they had spent a lot of time discussing how to. Concern over the lack of
marketing was expressed by all dietitians.
Concerns were also expressed that inappropriate labelling of healthy food choices could cause
problems with trading standards over false claims.
7.5 Factors influencing success for caterer
7.5.1 Motivation of caterer
An interest in healthier food and motivation of the catering manager were thought to be
crucial in achieving the award, and continuing to comply with award criteria, due to the
amount of work involved:
“...[there was] a lot of hard work from the catering manager in actively seeking out
catering information. He just went out and got whatever you asked for as soon as he
could, and I think that helped. Some catering managers wait for you to keep
contacting them all the time. ” (community dietitian 2)
There was a feeling that some premises were persuaded to apply by the EHO. Some premises
were only thought to be interested in the publicity they would receive, and were not
necessarily positive about healthier eating:
“...if you get someone that sort o f wants an award for prestige or to be in the paper or
someone that views healthy food as rabbit food. You do go into places and they've got
125

that kind of attitude and I don't think they've actually looked into what the HBA
actually means. ” (community dietitian 1)
7.5.2 Support within the organisation
Some workplaces were undergoing organisational change, which affected their ability to
implement the required nutrition changes:
“The fact that they were in receivership and being bought out by someone else, the
fact that they were probably going to end up with fewer catering staff... then that
would certainly have an impact on perhaps the range of healthier options and their
ability to be able to modify recipes. ” (community dietitian 3, crisp manufacturer head
office)
Support from higher management appeared to speed up HBA applications, although in some
cases the drive to receive the award had come from management rather than the catering
manager, for example to fulfil NHS policy for healthy hospitals, or a national drive from some
contract catering companies to enhance their image.
7.5.3 Value of the award to caterers
Dietitians thought that some caterers valued the award because of the high standard set
locally. There seemed to be some misunderstanding between caterers and dietitians, with
some caterers believing that the award meant all food had to be healthier, therefore restricting
choice:
“I don't know whether always one profession understands the other, and you know
there's something to be said for increasing our links much more with caterers and
giving a greater understanding of dietitians, and not let them feel that we're coming
round in order to tell everyone to eat salad all the time... ” (community dietitian 1)
7.5.4 Anticipated customer response
Some caterers were reluctant to introduce and actively promote healthy food choices because
they felt that it might be unacceptable for the workforce, especially where employees were
predominantly male, preferring to make behind the scene changes gradually:
126

“There was one establishment that I went to which does have mainly male employees
and the catering staff there felt that it would be positively anti if they tried to do
anything with healthy eating. They wanted to do it gradually...but not tell the
workforce about it at all. ” (community dietitian 2)
7.6 Facilitating the health promotion role of dietitians
7.6.1 Value of the award for dietitians
There was a sense of personal satisfaction when dealing with motivated caterers:
“But the caterers that you come across that are enthusiastic and have put all the effort
in I feel it's really rewarding. I come away from some places really feeling
encouraged that there's people out there that are putting all this effort in and really
want to make a difference and have got the customers interest at heart. " (community
dietitian 1)
Dietitians valued the award for promoting the role of the dietitian in the public domain,
linking in with local caterers, and as an opportunity to promote healthy food as tasty:
“ ...healthy food is always seen as boring, so if you can show people that healthy food
isn't boring, it could influence health in the long run, influence what they do at home. ”
(community dietitian 2)
Some dietitians were disappointed with lack of compliance and did not think the award was
worth their input in some premises without monitoring:
“...there's been a lot of times in the past where my concerns have been that you spend
a long time with the caterer and you think they've understood the messages and then
they go and label something that you haven't approved. It's a bit frustrating 'cos you
sort of think, ‘well are we getting anywhere?'... ” (community dietitian 3)
7.6.2 Effective use of time
There was mixed feeling about whether the award was an effective use of time. It was
thought to be worthwhile if premises: made an effort to meet the criteria relatively quickly;
promoted healthy food choices; marketed the award in the premises; and continued to comply
with the majority of nutrition criteria:
127

"I think it's more successful in the establishments that have been more successful in
getting the award, the ones that are enthusiastic and motivated who promote it better
and also have the client group that are receptive to that kind of information. ”
(community dietitian 1)
Some dietitians thought the award was only worthy of the time invested if it could be shown
to change behaviour:
"...If the award doesn't actually make a difference to what people eat, then it isn't an
effective use o f my time, but I feel that it took a long time to get what I felt were
relatively simple changes. ” (community dietitian 3)
7.6.3 Targeting key settings
There was a feeling that workplaces should be targeted more, due to the potential for
influencing food choice regularly, and that public eating places may not be the best
opportunity for health promotion:
"It's that issue that if people want to go out for a slap up meal then they actually want
a treat. It [the HBA] may be more valuable in workplaces, where people might be
eating every day than in a la carte type establishments... ” (community dietitian 1)
7.6.4 Involving customers
There was agreement that customers needed to be involved, especially in the workplace,
particularly as some were undergoing reorganisation and some employees felt threatened by
any changes, including those in the canteen.
7.6.5 Partial/staged award
Dietitians acknowledged that meeting the full nutrition criteria was difficult for some
premises and that one solution may be to introduce an award of a lower standard, which
premises worked towards initially with the intention of improving the following year,
therefore rewarding the progress they had already made. Community dietitian 1 suggested
that this would have been useful at a shoe manufacturers that failed to meet the HBA nutrition
criteria, allowing changes to be made slowly giving customers time to adapt:
128

“I think a kind of staged award would have been useful to them, where they could
have introduced changes that were acceptable to the workforce quite slowly. But then
achieved recognition for that by having some kind of intermediate award... So that a
staged award would hopefully of raised awareness in the workforce, but also
encouraged the catering department to continue and at that stage they could have got
recognition for that... ”
There were concerns that with an award of a lower standard, healthy food choices could not be
marketed and that the premises could still provide main courses which were high in fat,
resulting in the value of the award falling:
“The difficulty is if you've got an award then you want it to mean something. At the
same time, you don’t want to end up with people feeling they don't want to bother and
dropping out, which I know some o f them have... ” (community dietitian 3)
7.7 Facilitating the health promotion role of caterers
7.7.1 Need for healthy eating training
Dietitians felt that the training needs of caterers depended on individual level of knowledge
and confidence of the caterer and the complexity of meal service. Ongoing workshops were
one suggestion to increase confidence in trying new ideas for caterers at all stages of the
award process. It was suggested that these could include information on healthy eating, a
balanced diet, modifying recipes, tasting sessions and menu planning. Inviting caterers to
local training sessions for national campaigns on healthy eating, and involving local catering
colleges were other opportunities suggested. It was also proposed that caterers who had
already received the HBA could be involved in delivering training.
7.7.2 Responsibility of the caterer
There was a feeling that some caterers were not making enough effort, thereby slowing down
the award process, and that they needed to take some responsibility for getting the award.
This was highlighted by community dietitian 3, when referring to a crisp manufacturer head
office:
‘7 can make suggestions and offer alternatives to the things they've got, but at the end
of the day I have to wait for their final menus.... I find that difficult because I think
[the catering manager] still has to make some decisions because she has to
129

understand why things have been approved and has to make some final choices
because she's ultimately responsible for it continuing. ”
7.8 Improving the award nationally
7.8.1 Lack of national training of caterers
Concern was expressed over the lack of training in nutrition that caterers received. Linking in
with national catering organisations was suggested to get their support for the scheme, which
they could then promote and publicise to their members:
“It's going right back to the level o f the colleges and I'm really concerned that there's
no nutrition component in some catering courses. I think something radical has got
to happen in the catering colleges for us to have any chance... you set the seed there.
You could find that good catering practice gets disseminated. ” (community dietitian
1)
7.8.2 Multi-cultural information
There was a feeling that the resources provided were not adequate for different ethnic groups,
and this needed addressing nationally:
“We could do with a lot more help in encouraging the multi-cultural element of the
HBA like encouraging Indian restaurants or Chinese restaurants to apply and there's
no real help with that... ” (community dietitian 1)
7.8.3 Working with national food chains
It was proposed that the HEA should work more with national food chains, and contract
caterers who set menus nationally, which would overcome some of the frustrations of a lack
of flexibility locally:
i(... if they wanted to make any changes to dishes they were offering... they had to
change the whole o f the national menu... ” (community dietitian 5, retailers)
130

CHAPTER 8: DISCUSSION
8.1 Discussion of main findings
The purpose of this study was to provide feedback on implementation of the HBA scheme,
participant and practitioner response (process measures) and the overall effectiveness of the
scheme in producing significant changes in knowledge, attitudes and behaviour (impact
measures), and finally to suggest what action could be taken to improve the scheme. One of
the strengths of this study was the use of a combination of qualitative and quantitative
research techniques. This allowed a comparison of results derived from the range of methods
used, improving the power of the evaluation and the validity of the conclusions.
8.1.1 Process Measures
Implementing the nutrition criteria
Most caterers and dietitians thought the nutrition criteria were at an appropriate level, but
dietitians felt that they were too stringent in some workplaces, reducing compliance. There
was some evidence of inflexibility on the part of the dietitian, however most dietitians
acknowledged that meeting the full nutrition criteria was difficult for some premises. One
solution maybe to introduce an award of different levels, so that premises can meet basic
criteria initially, with the intention of improving the following year, therefore rewarding the
progress they had already made. There needs to be more flexibility with nutrition criteria that
are difficult to achieve, as this can hold up the award process for a long time. Caterers with a
limited number of choices on the menu should have more lenience in the number of healthy
food choices they provide. The new nutrition criteria (HEA, 1996b) will help in this situation
as they do not require caterers to provide one-third of the menu as healthy food choices. This
approach could respond to the need to be sensitive to concerns over customer response in the
workplace and make subtle changes, which has been highlighted before (Poulter, 1994).
There were however concerns from dietitians that healthy food choices could not be marketed
with a basic award and that the premises could still provide all main courses which were high
in fat, resulting in the value of the award falling.
Analysing menus so that the nutrition criteria are specified in quantities encouraged
dependence of the caterer, which is undesirable when there are limited resources. Using
broader criteria to decide whether a dish is a healthy food choice is recommended as this
allows the caterer more independence, and acknowledges the fact that very few chefs weigh
their ingredients (Pawan, 1991). The variability in the level of change in food provision
131

acceptable to individual dietitians needs to be addressed so that there is a uniform standard
and approach. In all the nutrition labelling schemes reviewed in chapter 2, a
dietitian/nutritionist analysed the nutritional content of menus, which is clearly labour
intensive and could not be provided within current NHS resources.
Changing provision of basic food items and cooking methods were described as the easiest
changes to make by both dietitians and caterers. There were difficulties in obtaining catering
size quantities of some healthier options, which have been identified as a problem before
(Jones et al, 1991). Changing the attitude of the chef was described as the main obstacle to
implementing the nutrition criteria by caterers, with concerns about compromising taste.
Most caterers did not think the HBA had effected catering food costs, although a small
number reported a marginal rise in costs, mentioning the higher costs of some lower fat
products. Cost is a major constraint to workplace caterers (Eves et al, 1996), so any increase
in food costs could affect their ability to attain and comply with HBA nutrition criteria. Two
of the labelling schemes reviewed in chapter 2 also reported that their schemes had not
changed catering food costs (King and Vanhorn, 1983; Poulter and Torrance, 1993).
Dietitians thought that an interest in healthier food and motivation of the catering manager
were crucial in achieving the HBA and complying with award criteria. Support from higher
management appeared to speed up HBA applications and has been shown to improve the
success of workplace programmes in general (Dhillon and Tolsma, 1991; Thomas, 1993;
Poulter 1994; Simnett, 1995). None of the workplaces had received input from occupational
health departments. Workplaces need to be encouraged to involve occupational health, if it
exists, to widen the promotion of the scheme. However occupational health services are
sparse as only 15% of all UK workplaces having an occupational health service (Tones et al,
1990).
The dietitian’s role
Around half of caterers thought that the award was well organised with good support from the
dietitian. Some caterers would have liked further contact after receiving the award to keep
them motivated. Ways to maintain regular contact with HBA premises need to be developed,
these could include: a regular newsletter for HBA holders; regular contact with the health
promotion officer/dietitian; and a local network for HBA holders. Although dietitians valued
132

the award for promoting the role of the dietitian in the public domain, the vast majority of
customers in public eating places were unaware that menus had been assessed by a dietitian.
The lack of time that dietitians had to give to the HBA scheme was a key factor in limiting the
number of awards given and the speed of the process, which was identified by about half of
caterers. The reasons given for the slow pace locally need to be addressed and help given if
possible. A partial award could speed up the process. Communication channels between the
agencies involved need to be clearer to prevent delays in renewing the award and arranging
the award ceremony for approved premises.
There was mixed feeling from dietitians about whether the award was an effective use of time.
It was thought to be worthwhile if premises: made an effort to meet the criteria relatively
quickly; promoted healthy food choices and marketed the award in premises; and continued to
comply with the majority of nutrition criteria. Some dietitians thought the award was only
worthy of the time invested if it could be shown to change behaviour, whereas others felt that
although the scheme had many flaws, it was better than having no input at all. This
evaluation suggests that a dietitian is needed to assess composite dishes, whereas advice on
making general changes in food provision could be carried out by another professional. The
importance of involving qualified nutritionists in the development of the nutrition component
of employee health promotion programmes has been emphasised before (Murray et al., 1986).
Compliance with nutrition criteria
All workplaces complied with approximately one-third of nutrition criteria, whereas public
eating establishments complied with around two-thirds of nutrition criteria. The finding that
public premises were more likely to comply with award criteria could be due to a range of
factors. Workplaces are more likely to have menus which run over a 2-6 week cycle, which
may also vary seasonally, therefore there is more scope for non-compliance, for example they
usually do not contact the dietitian when introducing the new season’s menus. On the other
hand, in public eating places, menus are often fixed and do not change frequently, therefore
there is less room for error. Public eating places are by their nature ‘open to the public’ and
perhaps caterers are more motivated to comply with nutrition criteria for fear of spot checks
from the health professionals operating the scheme.
Premises were least likely to comply with the criteria for type of cheese; desserts, including
providing fruit; some of the fat criteria; adding wholemeal flour to highlighted baked
133

products; using cornflour blended sauces for healthier dishes; and providing one-third of all
menu sections as healthy choices. There was no difference between workplaces and public
eating places for these criteria except workplaces were less likely to use cornflour blended
sauces. The data did not confirm the findings of a previous study (Warm et al., 1997) that
public eating places were less likely to provide fruit and more likely to skin chicken and
provide a healthy potato alternative compared to workplaces.
The lack of compliance is a major concern. If premises reduce compliance because the award
criteria are too stringent, then the agencies involved need to decide whether to simplify the
criteria. However caterers did report that the level of nutrition criteria was realistic. There is
currently no legal requirement for premises to comply with HBA nutrition criteria, such a
requirement would provide a greater incentive for compliance.
Marketing and labelling of healthy food choices
Three-quarters of establishments used a symbol to highlight healthy food choices on the
menu, being the only form of promotion in most cases. This figure was similar to that in a
previous study evaluating catering practice in HBA premises (Warm et al., 1997), which
found that 73% of HBA premises highlighted their menus. A quarter of premises did not
highlight healthy food choices, although some of these had a statement on the menu
encouraging special requests for healthier food choices or they reported that the food server
verbally informed customers of healthier choices. There were no reported differences
between workplaces and public eating places, although a previous study found that public
eating places were less likely to market healthy choices than workplaces (Warm et al., 1997).
Dietitians spent a lot of time discussing marketing strategies with caterers. Although
highlighting healthy food choices is one of the nutrition criteria, there was flexibility
depending on the type of establishment. Developing an appropriate menu labelling system
has several difficulties. Almanza et al., (1997) investigated the major obstacles which
caterers had to menu labelling, these included: too much variation in the menu; limited space
on the menu; loss of flexibility in changing menu; difficulty in training catering assistants to
implement labelling; and not enough time for catering assistants to implement labelling.
It is unclear which is the most effective labelling format. Verbal banding of low, medium and
high developed by the Coronary Prevention Group (1990) was shown to be particularly
accessible. The 3 different nutrition labelling formats tried by Almanza et al, (1995) to
assess consumer preference identified 3 factors which were important in consumer preference:
134

attractiveness, ease of use and clear presentation of nutritional information. The need for a
menu labelling system to be simple and focus on the most relevant nutrients has been
described (Earless et al., 1996), although it may be more appropriate to develop practical
messages which focus on foods rather than nutrients. Positive labelling may be more effective
(Murphy et al., 1993b), for example, only labelling healthy choices, which is the approach
used in the HBA scheme. It may be more effective to target 1 meal component, such as main
courses rather than the entire menu, as is the case with the HBA scheme. Incentives could be
used to promote the uptake of healthier food choices, which has been shown to be effective in
the short term (Zifferblatt etal., 1980; Cincirpini, 1984; Glanz and Seewald-Klein, 1986;
Mayer et al., 1987; HEA, 1997), but more research is needed to assess if this is sustainable.
Cost, appearance, taste and ‘quickness’ were identified as important influences on food choice
by caterers and employees. There was a perception by almost a third of customers in public
settings that healthier food is more expensive; a previous study reported that almost half of
customers reported that healthy food was more expensive (Sheiham et al., 1990). Making
healthier choices cheaper by having positive pricing policies (Low Income Project Team,
1996) may enhance their uptake as around half of customers were influenced by cost in the
workplace study. Income has been shown to be a key influence in food choice (National
Childrens Home, 1991; Dobson et al., 1994). The presentation of food at work influenced
food choice in approximately two-thirds of employees at both stages. The influence of the
appearance of food when eating out has been reported before (HEA, 1996b). Around two-
thirds of the sample in the workplace and public eating places were in agreement that healthy
food tastes good. Although this did not change overall at work between the 2 stages, the
number of overweight/obese respondents who thought that healthy food tasted good
increased. Taste has been described as paramount in influencing food choice by several
studies (Poulter 1994; Palmer and Leontos, 1995; Silverstone, 1995; HEA, 1996b). Taste has
been shown to be more important to those in socio-economic groups IV and V (Sheiham et
al, 1990) and younger age groups (Sheiham et al., 1990; Stewart and Tinsley, 1995). Taste
could be promoted by providing food samples and cooking demonstrations to customers.
Silverstone (1995) evaluated taste changes in traditional recipes that were modified to be
lower in fat and higher in fibre, finding that substantial improvements can be made to the
healthiness of a dish without compromising taste. This needs to be communicated to caterers
via training sessions. Needing something quick to eat at work was important to three-quarters
of employees, which increased at the second stage, particularly men and the younger age
group increased agreement, which could be due to a change in working practices at the service
135

industry site, which meant the lunch break was shorter. This emphasises the importance of
having healthy ‘quick’ meals and snacks available. Cost, visual appearance, taste and ‘speed’
should therefore be paramount when promoting healthy food choices.
Customer demand for healthy food choices at work and when eating out was evident, which
has been demonstrated before in the workplace (Cole-Hamilton, 1986; Williams and Poulter,
1991) and public eating places (HEA, 1996b). It seems that customers want healthy food
choices to be available but they do not necessarily choose them, as two-thirds of employees
stated they did not choose highlighted healthy choices. Three-quarters of employees found
highlighting of healthy food choices useful, with older respondents particularly finding
highlighting useful.
The new HBA nutrition criteria have moved away from labelling healthy choices. Such a
shift may be less time consuming for the dietitian and caterer, and may address some of the
difficulties around inadequate monitoring that have been encountered in Leicestershire.
However, if the HBA scheme is not adequately promoted within the premises and healthy
food choices are not marketed, it is questionable whether the scheme is worth the input if
customers are not aware that healthy food choices are available. Greater promotion of the
scheme could provide ‘awareness’ knowledge (Rogers, 1995), which may be more motivating
for individuals.
The need to raise the profile of the award was evident from all aspects of the study. The
surveys demonstrated a lack of awareness and understanding about the HBA from customers,
particularly from men, younger employees and lower socio-economic groups. The scheme
needs further promotion on 3 levels. Firstly within the eating place, with improved written
resources for premises to promote the award and market healthy food choices and healthier
eating, and more information for customers to take away. A nutrition pack for caterers was
introduced in Leicestershire since this study was completed, which meets some of the
resource needs identified. Written resources also need to be developed to work with different
ethnic groups. The ideas and resources developed for the National Catering Initiative
(Department of Health, 1994; HEA, 1996b) need adapting for local use. Secondly, there
needs to be more local publicity from the agencies involved (Leicestershire Nutrition and
Dietetic Service, Health Promotion Centre and local councils). Local organisations could be
encouraged to endorse the scheme, as in the Heart Smart restaurant programme in Canada
(Green et al, 1993), which was supported by 39 local agencies, including tourism and
136

business groups, media, restaurant and hotel associations. Such support for the HBA scheme
could help increase its profile. Lastly, more national publicity from the HEA is recommended
to raise public understanding, enhance the award’s association with health and improve its
credibility.
Monitoring of the scheme
A system of monitoring premises once they have received the award needs to be introduced.
The need for continual monitoring of the award has been described previously (Ellis, 1995).
Maintaining regular contact with HBA premises and offering training to caterers may help
motivate and support them in complying with nutrition criteria. Who is best placed to carry
out this role needs to be considered, whether this needs to be a dietitian is unclear. A trained
dietetic helper/HPO could take on a monitoring role. Clearly this is a resource issue for the
agencies involved.
Williams and Poulter (1991) express concern that many schemes are not sustainable and
require too much specialist on going support. Two schemes reviewed in chapter 2 described
having difficulties in sustaining monitoring at the original intended level (Cole-Hamilton,
1986; Peterson et al, 1986). The nutrition criteria of schemes need to be realistic and
measurable to facilitate accurate monitoring, as complex criteria clearly necessitate a more
involved and time consuming monitoring process.
The role of caterers
Most of the caterers interviewed mentioned that it was their responsibility to offer customers a
choice but not to try and influence them, except for making information available. The view
that most caterers do not feel they are responsible for improving customers’ health has been
reported previously (Jones et al, 1991; Glanz et al, 1992), this may be because caterers are
working in a highly competitive market and their primary concern has to be sales and profits.
Caterers valued the award for promoting health, improving their nutritional knowledge and
demonstrating that they had achieved a certain standard in catering. A previous study
(Murphy et al, 1993) also found that caterers valued the award for recognising good catering
standards and promoting health. Dietitians felt that some caterers did not make enough effort
to meet the nutrition criteria and that they needed to take some responsibility for getting the
award, without continual reminding.
137

The need for caterers to be updated on healthier catering practice was identified by both
caterers and dietitians, and has been reported before (Carlson and Kipps, 1988; James et al.,
1991; Department of Health, 1994a; Rice, 1994; Benson, 1995). In one study (Carlson and
Kipps, 1988) the authors found that over 25% of catering colleges allocated less than 5 hours
during a 4 year course to nutrition and they recommended that catering lecturers need to be
updated on their nutritional knowledge. Rice (1994) echoes this view and suggests that
caterers must adapt traditional practice to healthier practice. She suggests that in setting
nutritional standards, priority must be attached to those aspects of food service having the
largest influence on the customer's ability to make better meal choices. Training of caterers is
essential to encourage both the provision of tasty, healthy dishes and the marketing and
monitoring of schemes. Three of the studies reviewed in chapter 2 offered nutrition training
to catering staff on basic nutrition (Cole-Hamilton, 1986), recipe modification (Richmond,
1986) and how to implement the scheme (Cole-Hamilton, 1986; Richmond, 1986; Williams
and Poulter, 1991). The way such training is promoted to chefs is important so that it is not
seen as patronising. Involving award holding chefs in delivering part of the training may help
overcome this and give it credence. Training of caterers appears to be effective in persuading
caterers that customers want healthy food choices and encouraging them to provide more
healthy food choices (Eves et al, 1996).
8.1.2 Impact measures
Who the scheme reaches
Customers in public eating places and workplaces with the HBA were mainly white, female,
in paid employement and from social class groups I, II and III non-manual. The structure of
the sample is not representative of the general population. If the HBA scheme is only
reaching these groups it is failing to facilitate maximum change. The HBA scheme is less
likely to reach its target audience of lower socio-economic groups in public eating places as
unsurprisingly these groups eat out less often (Martens and Warde, 1995; Ministry of
Agriculture, Fisheries and Food, 1994, 1996). There was however an indication that the HBA
scheme in the workplace could reach younger employees, lower socio-economic groups and
men. Younger employees and lower social class groups were more likely to eat lunch in the
canteen, and younger employees and men were more likely to have their main meal in the
canteen. The fact that men can be reached through catering outlets has been highlighted in the
National Food Survey (Ministry of Agriculture, Fisheries and Food, 1994), which has shown
that men spend more money than women on food away from home. A survey of 2,141
consumers in public houses and fast food outlets (HEA, 1996b) found that younger age groups
138

and men were most likely to eat out. They did not find any difference in frequency of eating
out and social class group, this could be a reflection of the clientele in these facilities,
although they did note that older age groups ate out more often in public houses.
The reasoning behind the HBA scheme assumes that a homogeneous message reaches all
customers, with all being equally targeted. As customer profile is heterogeneous, health
promotion messages should be modified to target those most in need of dietary change.
Concern has been expressed (Teufel, 1992) that workplace health promotion programmes
address the needs of the average employee and that the needs of men and women may be
different. Ignoring these differences may reduce the effectiveness of these programmes.
Messages and images more likely to appeal to men, younger age groups and lower socio
economic groups need to be developed and evaluated as these are the groups most in need of
dietary change. In addition, the overweight/obese and Asian community need targeting, due
to the increased incidence of CHD in both these groups. The HBA scheme therefore needs to
be adaptable enough to meet the needs of its audience.
Customer response to the scheme
There was a general lack of awareness of the scheme and understanding of the award criteria,
especially from men, younger respondents and lower socio-economic groups. There was
however a significant increase in employees agreeing that there was a lot of information on
healthy eating in the workplace and that it was easy to eat a healthy diet at work, as this
change was not reflected in the comparison group, it indicates that employees had noticed the
changes in the canteen, particularly women, overweight/obese employees and the younger age
group. Three-quarters of the sample thought there were a lot of conflicting messages around
concerning a healthy diet, with social class group 2 employees reducing agreement over the 2
stages, indicating enhanced understanding of a healthy diet. Other surveys also indicate that
there is widespread confusion over nutrition advice (Sheiham et a/., 1990; National Dairy
Council, 1992; Hamack etal., 1997).
The finding that the vast majority of customers did not choose the premises because it had a
HBA and provided healthier food choices is congruent with that of the Heart Smart
programme (Green et al., 1993) which concluded that people were not influenced by whether
a restaurant was Heart Smart when choosing to eat out. The availability of healthy food did
not feature highly as a reason to encourage respondents to eat more often in the canteen.
139

Two-thirds of caterers thought there had been no change in customer numbers since receiving
the award. This is supported by data in the workplace survey, which indicated that there was
no change in canteen use. The remaining premises (mainly public eating places) reported an
increase since receiving the award. This is comparable with the findings of another study
(Warm et al, 1997), which found that 35% of HBA premises had reported an increase in
customer numbers, particularly in public eating places. However another study (Murphy et
al, 1993a) reported that caterers were cautious about the success of the scheme in attracting
new customers. Women, office staff and those trying to lose weight were seen as more
responsive to the scheme by caterers. Women (Sloan and Gruman, 1988) and higher paid
employees (Wong et al, 1996) are in general more likely to participate in workplace health
promotion programmes than men and lower paid employees.
In some workplaces, customers had reacted negatively, particularly manual workers, who saw
the scheme as restricting choice by providing totally healthy menus, with less taste. Some
workplace caterers were reluctant to promote healthy food choices, fearing customers would
react negatively. The expectation that customers will reject healthier food has been described
before (James et al, 1991). Highlighting menu items has been reported before as potentially
antagonising to certain customers who believe that caterers are interfering with their freedom
of choice (Pawan, 1993). These reactions emphasise the importance of communicating and
consulting with customers. Gaining support in workplaces by convening a group of interested
parties, other catering staff and an employee (Dhillon and Tolsma, 1991; Poulter 1994) and
occupational health representative appears crucial for acceptance of the scheme (Thomas,
1993; Simnett, 1995). This is especially important in workplaces which are undergoing
reorganisation as employees may feel threatened by any changes, including those in the
canteen.
Knowledge about healthier eating does not seem to be a barrier to change as the vast majority
of respondents in both settings were familiar with current, general nutrition guidelines and in
the workplace correctly identified lower fat and higher fibre meal options, although there was
slightly less awareness of lower sugar items. There was still confusion over whether starchy
food consumption should be increased, with a slight increase in employees responding
correctly at stage 2, mainly from social class group 1 employees. The perception that starchy
foods are ‘fattening’ has been reported before (Nichols et al, 1988; National Dairy Council,
1992) and appears to be a legacy of low carbohydrate diets in the I960’s. The responses for
knowledge of current nutrition guidelines were almost identical to those reported in a study of
140

dietary practice in the 1990’s (Goode et al, 1995). Although there was a high level of general
nutrition knowledge, it needs to be acknowledged that this does not necessarily lead to a
modification of attitudes or behaviour (Shepherd and Stockley, 1987; Anderson et al., 1993;
Stockley, 1993).
Effect on dietary behaviour
An important issue is whether the HBA scheme has met its nutrition objectives of reducing
fat, sugar and increasing consumption of fibre-rich starchy foods by customers. In terms of
overall diet there was remarkably small change in the study population for dietary indices over
the 2 stages, there was however a slight increase in the median fat index at home, indicating a
slight positive shift in fat consumption. When assessing individual change, there were more
positive than negative shifts in behaviour for fat and sugar indices at home, and sugar and
healthy diet indices at work. However none of these changes were significant. Women
(Contento and Maksymowicz-Murphy, 1990; Barker et al., 1995) and older age groups
(Contento and Maksymowicz-Murphy, 1990) have been reported as being particularly open to
dietary change. Indeed older respondents improved their fibre and healthy diet indices at
work and women changed their sugar scores at work most positively. There was however
some evidence of change in the target groups for fat index at home (younger age group), fat
and sugar indices at home (social class groups III manual, IV and V), fibre index at work
(men) and all dietary indices, except fibre index at work (overweight/obese). These changes
were not detected in the comparison group. One of the schemes reviewed in chapter 2
(Albright et al., 1990) also found that men and younger customers were more responsive to
their intervention in a public restaurant. However, the recorded improvements for the
overweight/obese group may be due to over-reporting of healthy eating behaviour by this
group, which has been reported before (Keen et al., 1979), especially when they became
aware of the purpose of the study.
All dietary indices were significantly associated with socio-demographic factors of age,
gender and social class group, indicating a measure of validity. It has been shown that various
socio-demographic groups have different diets, with women (Gregory et al., 1990; Hunt et al,
1997) and those in higher socio-economic groups (Gregory et al, 1990; Bolton-Smith et al.,
1991; Marmot, 1992; Smith and Baghurst, 1992) and older age groups (Hunt et al, 1997)
tending to eat more foods associated with a healthier diet.
141

Based on food frequency data, there was more positive than negative change solely in HBA
premises, (i.e. the changes were not detected in the comparison group) for consumption of
several food items at work: type of spreading fat, hard cheese, fruit, vegetables, red meat and
low fat cheese. However this change only reached significance for red meat and fruit. On the
other hand, there was more negative than positive change at work for crisps/fried snacks. At
home, there were more positive than negative changes for consumption of: biscuits and cakes,
fried food, starchy carbohydrates, processed meat and red meat (which reached significance
for processed and red meat). These changes in red/processed meat consumption could be
attributable to a powerful exogenous factor: the fears over beef consumption and bovine
spongiform encephalopathy (Lanska, 1998), which resulted in a population fall in meat
consumption during the period of data collection (Ministry of Agriculture, Fisheries and Food,
1996).
Several caterers thought the introduction of the award had positively influenced food
purchasing patterns, reporting increased acceptance of the award by men and manual
employees, after initial resistance. Some workplace caterers reported that more customers
were eating healthily, although they were uncertain whether this was due to the scheme. In
some cases there was a feeling that even if the award had not been instrumental in causing
change, it had enhanced customer awareness of healthier eating. At least a quarter of caterers
reported an increase in sales of healthier food items after introducing the HBA scheme,
particularly high fibre bread/sandwiches, healthy food choices and polyunsaturated margarine
portions. In addition, some workplaces reported increased sales of low fat spread portions,
low sugar drinks, healthy snacks, semi-skimmed milk in cartons and healthier salads.
However, only the increase in sales of low fat spread portions were confirmed by food
frequency data. The finding that an increase in purchases of healthier food choices was more
likely in workplaces than public eating places could be because customers are more likely to
choose healthy food choices at work than when eating out. Despite these reported positive
changes in purchasing patterns, the uptake of less healthy choices remained the same in the
majority of premises.
Changes in self rated diet
Approximately a quarter of respondents reported that their diets were healthier at home and
work since the award was introduced. More men and older respondents said their diets had
changed positively at work as a result of the HBA scheme. Programmes at work have been
shown to influence behaviour at home (Dugdill and Springett, 1994). Almost two-thirds of
142

respondents said that they did not think their diets had changed because they already followed a
healthy diet at home and work.
Respondents reported trying to change their fat intake the most, although this declined at stage
2, followed by sugar and lastly dietary fibre, neither of the latter changed over the 2 stages.
Other studies have found that people usually report changing the fat component of their diet
the most (Crawford and Baghurst, 1990; Glanz et al, 1994; HEA, 1996b).
At least a quarter of the sample reported that they had reduced consumption of several ‘less
healthy’ food items and almost a third of respondents reported eating more ‘healthy’ items.
However these reported changes were all mirrored in the comparison group, indicating there
was a perception of change in the general population. When compared with data on actual
intake (from food frequency data), these perceived changes were only confirmed for: red
meat, processed meats, confectionery, fried food, sugary drinks, fruit, chicken and fish.
These findings are based on individual perception of dietary change and highlight the fact that
individuals frequently over-estimate the ‘healthiness’ of their diets compared to actual intake,
which has been shown in several studies before (Lloyd et al, 1993; Brug et al, 1994; Lechner
eta l, 1997).
Influence of health on food choice
The majority of respondents agreed that what they ate was one of the most important things
for their health, in the workplace and public setting surveys, with no change over the two
stages at work. Most employees believed that eating a lot of fruit and vegetables and avoiding
fried foods contributes to reducing risk of CHD. Men and overweight/obese employees
became more convinced of the role of fruit and vegetables at stage 2. However both the
workplace and public eating place surveys indicated that apparent ‘healthiness’ of food does
not seem to be a major influence on food choice. Another survey of customer views in public
eating places (HEA, 1996b), found that health was not a major influence on food choice when
eating out, finding as in the workplace study, that healthier eating has more influence on food
choice when eating at home.
Potential of the scheme in changing behaviour
The HBA scheme is an environmental strategy that increases opportunities for behaviour
change by providing customers with information, reminders and reinforcement to guide them
143

towards healthier food choices. As food eaten outside the home is making an increasingly
important contribution to food intake, the potential role of the HBA scheme in influencing
dietary change is evident. The workplace is a particularly good opportunity to expose
individuals to healthier food choices as there are over 2 million workplaces in England (HEA,
1993).
The HBA scheme contains some elements which fit a previous description of the
characteristics of effective nutrition interventions (Winett et al., 1993), i.e. persuasion,
prompts, reminders and environmental support. However there are several elements missing:
providing guidelines to eat healthily; teaching people how to overcome barriers to change and
enhance motivation by providing feedback on performance with specific goals. These
elements could be provided if the HBA scheme became part of a wider nutrition programme
at work, acknowledging the fact that environmental support alone is not sufficient to facilitate
change.
Multi-faceted workplace programmes have been demonstrated to be most effective (American
Dietetic Association, 1993; Dugdill and Springett, 1994; Workplace Task force, 1994;
Contento et al, 1995). Targeting the HBA scheme at workplaces involved in wider
workplace health promotion programmes could achieve this, for example, as part of the
Health at Work Award scheme (HEA, 1998). A concern is that these are more likely to be
larger employers (HEA, 1993), whereas lower income groups may be reached more by
targeting smaller organisations (Cockshott and Daykin, 1996). Introducing a food and
nutrition policy at work could be one means of widening the scope of the scheme beyond food
provision in the canteen, which has been advocated before (Poulter, 1994; HEA, 1998) and
could be the basis for a ‘whole’ workplace approach.
Indeed nearly 40% of employees in the workplace survey said they would find a diet and
exercise group useful at work, and just over a tenth of the sample saying that a slimming group
would be useful. Women and overweight/obese respondents were most interested in
participating in a group. Such groups may be a means of harnessing social support in the
workplace as only a small number of employees agreed that they received encouragement for
eating a healthy diet from their co-workers at both stages. This suggests that the opportunity
for social support in the workplace was not being utilised, it has however been suggested that
social support may not be such an important influence on behaviour change in the workplace
as was previously thought (Terborg et al., 1995).
144

The need to incorporate relevant theories of dietary behaviour change in developing and
evaluating effective nutrition interventions has been identified by several authors (Glanz and
Mullis, 1988; Glanz and Eriksen, 1993; Steuart, 1993; Winett et al, 1993; Contento etal.,
1995). Steuart states that the way these models are interpreted influences planning and
evaluation of health education. The theoretical frameworks most applicable to the HBA
scheme are consistent with social learning theory (Bandura, 1977) which postulates that an
individual both affects and is affected by their environment. Social marketing is another tool
of relevance to the HBA scheme, as it uses marketing concepts to increase the acceptability
of healthier eating (Glanz and Mullis, 1988; Contento et al, 1995). Social marketing has
been used widely in environmental nutrition education programmes (Glanz and Mullis,
1988; Winett et al., 1993; Contento et al, 1995). It is important to recognise that eating
behaviour is located within a complex social framework and that interventions need to focus
on providing supportive environments rather than focusing solely on individual
responsibility (Vaandrager et al, 1993).
Several models have been developed to explain how and why individuals change their
behaviour (Glanz et al, 1993). The Stages of Change Model proposes that there is a sequence
of change that involves attitudes, beliefs and knowledge, culminating in measurable change
(Prochaska and DiClemente, 1982; Prochaska et al, 1994). Briefly this model regards
individuals as traversing through phases of precontemplation (not interested in change),
contemplation (thinking about change), preparation (making definite plans to change), action
(actively modifying habits or environment) and maintenance of behaviour change (sustaining
new, healthier habits and preventing relapse).
The Stage of Change model illustrates the fact that behaviour change can be slow, as
individuals may move through a series of stages. With a low-intensity programme such as the
HBA scheme, it may not necessarily cause an immediate effect or change in eating habits, as a
low level of input has been described as insufficient to facilitate measurable change (Poulter
1994; Contento eta l, 1995; Guldan, 1996). If individuals are ‘precontemplative’ or
‘contemplative’, then providing persuasive information (Rogers, 1995) could increase the
likelihood of positive attitude or behaviour change and move individuals towards the
‘preparation’ phase. The scheme may reinforce the behaviour of people further on in the
‘stages of change’ process, i.e. action, maintenance and relapse stages. Having taken action to
change their diet, the HBA scheme may help individuals to maintain this change. Providing
145

customers with this type of information and reinforcement may decrease the possibility of
relapsing into less healthy eating habits. The HBA scheme therefore has the potential to
influence consumers at all stages of change in dietary behaviour, by optimising the elements
most likely to reach individuals at all stages of change.
The importance of gender emerges from several aspects of the study. Women were more
likely to eat healthily, be aware of the scheme and its promotion and respond positively to the
scheme than men. Men should be one of the main target groups for nutrition education
initiatives, due to their greater need to change dietary behaviour, the scheme therefore needs
modifying to appeal to them.
8.2 Methodological limitations
8.2.1 Limitations of using a questionnaire in the workplace
One of the difficulties in measuring changes in behaviour is that any instrument used needs to
be sensitive enough to measure change and be simple enough to be used in the workplace.
There may have been changes in dietary behaviour which were not detected with the food
frequency questionnaire, that could have been detected by more rigorous dietary assessment
techniques, such as food diaries or weighed intake. It would have simplified the questionnaire
and analysis if employees had only responded about diet at work, but it would not then have
been possible to investigate any change at home that occurred. In fact there was a positive
shift in some of the dietary indices at home and a quarter of respondents thought their diets
had improved at home as a result of the scheme, so from this perspective it was worth
including.
The ‘open’ question asking employees if anything could encourage them to eat canteen food
more often led to some coding difficulties due to the large range of responses given. In
retrospect, it would have been more straightforward to have included a ‘closed’ question using
responses gained from the pilot to form pre-coded responses. In addition, it would have been
better to have included a definition of ‘main meal’ of the day in question 2 (part 1).
It may be that instead of focusing on changes in dietary behaviour, a more sensitive measure
of change would have been to investigate whether the HBA scheme helped individuals
progress through stages of change (as described above), but the questions assessing attitudes
used in this study were not sensitive or specific enough to measure this. The small number of
items for assessing each psycho-social concept is a limitation, but was unavoidable as keeping
146

the questionnaire as short as possible was a priority. The task of measuring change in
attitudes is difficult (Henderson et al, 1987). A questionnaire did not allow individuals to
express their views as fully as interviews would have done. Given these limitations, there are
advantages in using a questionnaire to measure attitudes, in that it allows respondents time to
consider their responses and provides greater uniformity for comparison of results, meaning
data can be easily analysed.
8.2.2 Information bias from the food frequency questionnaire
Information bias could have been introduced as FFQs tend to have an in built tendency to be
biased upwards as subjects typically overestimate consumption, particularly of fruit and
vegetables (Feskanich et al., 1993; Hammond et al., 1993; Nelson and Bingham, 1997).
There is bias in all dietary assessment techniques and individuals can with any method present
an eating pattern that puts them in a positive light, overestimating food frequency judgements
for ‘healthy foods’ and underestimating those for so called ‘unhealthy’ foods (Salvini et al,
1989; Hebert et al, 1995). As the FFQ was not validated against a more rigorous quantifiable
measure of dietary intake, it is not possible to describe the extent of information bias.
The fact that the study focused on measuring internal change means that at least any
information bias was constant. Cole (1997) describes how bias is reduced in a sample
surveyed on 2 separate occasions if the bias in the method is uniform throughout the sample.
If for example, the bias tends to reduce the estimate of dietary intake by a fixed amount, e.g.
10%, then the change in intake is likely to be relatively unaffected.
8.2.3 Limitations of dietary indices developed
There are obvious limitations in using a scoring system that has not been validated against
quantified nutrient intake. However, the purpose of the workplace survey was to assess
internal change and population shift rather than define a quantified nutrient intake. The
indices do indicate that if an individual scored highly, they are going to be eating more fibre
than an individual with a low fibre score, i.e. individuals are ranked according to their dietary
behaviour. The dietary indices are not a definitive picture of healthy or unhealthy practice but
reflect probable levels of intakes and are estimates of healthy and less healthy practice. Their
primary use is as a means of comparison between groups. An indication of validity could be
the differentiation between socio-demographic variables which are consistent with expected
variations in diet.
147

The index could not be based absolutely on the number of times food was eaten in relation to
food group recommendations because data were collected separately for diet at home and at
work and this is one of the limitations of this method as it is less clear when respondents are
reaching dietary targets.
8.2.4 Selection/sampling bias
Self selection bias was inevitable in both the workplace and public eating place surveys, as it
was not possible to determine the participation either of premises or employees/customers
who would be involved. The difficulty in randomising within health education programmes
has been discussed before (Israel et al., 1995).
The approach used to analyse change meant that data were analysed only for the sub-group
who responded to the questionnaire at both stages, hence all stage 1 respondents were not
included in the analysis. The longitudinal survey design used has the advantage of capturing
variation over time within a sample population and is therefore more powerful in detecting
change than a cross-sectional design (Koepsell et al., 1992; Hawe et al, 1994; Fraser et al,
1995). It can also be argued that the bias of self selection is partially overcome (Hawe et al,
1994; Fraser et al, 1995; Cole, 1997). The limitations however include possible bias from
sample attrition. In the workplace survey, non-responders at stage 2 were similar in terms of
their dietary behaviour (based on differences between mean dietary indices) to employees who
responded at both stages, and they had a profile similar to the final study population for age
group; BMI; ethnicity and hours worked. However, stage 2 non-responders did include
substantially more men and slightly more individuals in social class groups IE non-manual, IV
and V than the sample of employees who had responded at both stages. This could have
introduced a bias as more motivated employees were over-represented in the final study
population. It would have been useful to have had data on the socio-demographic profile of
the whole workforce, so that response in the final sample of various subgroups could be
compared to their representation in the workforce, however personnel departments were not
able to provide this confidential information for an external study.
The average response rate was 72.3% in public eating places. The overall response rates in
the workplace study were lower at stage 1 (HBA premises: 62.6%; comparison group: 50.3%)
than at stage 2 (HBA premises: 73.2%; comparison group: 62.6% of possible employees).
The response rates were lower than anticipated at stage 1. They do however compare
favourably with other response rates to workplace nutrition surveys reviewed in chapter 2,
148

which ranged from 23.9% (Cole-Hamilton, 1986), 39% (Williams and Poulter, 1991), 53%
(Richmond, 1986) to 74% (Sorenson e ta l, 1992).
Nationally black and ethnic groups represent 6% of the British population (Rehman and
Walker, 1995). These groups represented 6.7% of the workplace survey population and 2.6%
of customers in public eating places and was therefore comparable with the national figure
only in the workplace. All the public eating places were situated outside of Leicester City
boundaries, however 2 of the successful workplaces were situated in Leicester City where
28% of the population are of Asian origin (Leicester City Council population Census, 1990),
and based on this figure these groups were under-represented in the workplace survey
population (2.7% of which was Indian). Non-responders at stage 2 had a similar ethnic
profile to those responding at stage 2, so there was no evidence to suggest that these groups
were less likely to respond at the second stage. There were less overweight and obese
individuals (stage 1: 33.1%; stage 2: 36.0%) in the workplace survey (HBA sites and the
comparison sites) than one would expect based on national averages (53%) (Department of
Health, 1994b). This may indicate that more overweight/obese did not respond at stage 1, or
that the profile of the total workplace population did not mirror the national picture.
8.2.5 Attributing change to the HBA scheme in the workplace
The availability of a comparison group is very important in accurately assessing the impact of
health promotion interventions (Kronenfield et al., 1987), it helps clarify if observed change is
due to the intervention or changes in the general population. However, the lack of a true
control group in this study diminished its power to establish causal links between the HBA
scheme and any changes observed in the sample. The fact that the comparison group was
non-equivalent was a bias, as the comparison group contained significantly more men,
‘Indian’ respondents and social class group HI manual, IV and V employees. As a reflection
of this different profile, the mean dietary indices for the comparison group were not
comparable in all situations, and were lower particularly for sugar and fibre indices at work.
It would have been difficult to have a true control group given the difficulties encountered in
conducting research in workplaces, when often the incentive to agree to be involved in the
study was because they were working towards the HBA.
Attributing any observed change to an intervention is difficult due to the effect of exogenous
confounding factors and design effects (Rossi and Freeman, 1993; Steuart, 1993, Fraser et al.,
1995; Oshaug, 1995). Long term trends or secular drift could have produced changes in gross
149

outcomes that enhance the effects of an intervention, which are difficult to control for. In
addition, there are always design effects present from the intervention, which threaten the
validity of impact evaluation and performing the evaluation in itself may have an impact on
results (the Hawthorne effect).
The lack of change in behaviour could have several explanations: the sample size was not
large enough to detect small changes in behaviour (a type II error). Although this study has
attempted to characterise the people who have been successful in changing and maintaining
change, the sample size of sub-groups have not always made this possible. As this study
assessed the effectiveness of the HBA scheme in ‘real-life’ situations, there was some
evidence that the scheme was not fully implemented, which may have reduced its efficacy. It
may be that even if the scheme was perfectly implemented it may not influence behaviour.
8.2.6 Difficulties of working with employers
Within the study there were a range of organisations with diverse philosophies and
management structures, which made carrying out the study challenging. As Clapham (1992)
describes it is crucial to identify who is responsible for making decisions to give permission
for research in the workplace. In the health service sites, this was done verbally with
personnel and hospital managers, and was relatively straight forward. In the commercial
sector the approach was different, as obviously the main purpose of commercial organisations
is to operate the business, rather than participate in healthy eating studies, so harnessing their
support was sometimes difficult. The fact that they were keen to receive the HBA was often
an incentive for them to agree to participate in the study.
In one of the workplaces (a national retailer) permission had to be attained nationally, and in
another local manufacturing company permission was given verbally by the site manager and
personnel department to carry out the study, and having started data collection the Managing
Director of the company objected as he had not been consulted. The situation was eventually
resolved, but it was certainly clear that it was essential to receive written permission at the
highest level from commercial organisations. In addition, employees were sometimes
suspicious of the goals of the survey, for example, in one workplace there was a belief that the
survey was a management initiative to identify ‘unhealthy’ employees for redundancy even
though a letter had been sent to individuals explaining the purpose and independent nature of
the study. Suspicion about management motives has been reported before (Tones et al,
150

1990), which highlights the importance of consulting with Trade Unions/works committees to
obtain their support and understanding of the study’s objectives.
8.2.7 Limitations of cross-sectional study in public eating places
One limitation of the cross-sectional study in public eating places is that although the
awareness of the scheme and its effect on choice of restaurant was assessed, it is not possible
to say if the HBA scheme has increased the consumption of healthier foods in public eating
places or changed customer attitudes to food. In retrospect, it would have been useful to have
included questions about customer awareness of different means to promote the award and if
customers felt the introduction of the award had influenced their food choice. In addition, it
would have been better to have spent a whole week in each establishment to increase sample
size. This was not possible due to time and financial constraints.
8.2.8 Limitations of interviews and focus group with the community dietitians
Bias may have been introduced as the interviewer had worked previously with all the 5
dietitians who participated. Although the numbers are small, they represent all the dietitians
involved in the scheme. The evaluation related specifically to the scheme in Leicestershire, so
therefore many of the dietitians’ views that emerged are specific to the operation and efficacy
of the scheme locally and may not be applicable nationally.
8.2.9 Limitations of caterers interviews and audit of food provision
Three different researchers carried out the interviews with caterers, which may have
introduced interviewer bias, therefore influencing reliability of the data, even though all
researchers used the same interview schedule to guide the interview. As with all qualitative
studies, it is not always possible to generalise the findings of data generated from interviews,
as findings and experiences may be unique.
Although the study audited food provision in premises after receipt of the award, it would also
have been useful to audit food provision before premises receive the award, to assess changes
that HBA premises have made, if any, to meet nutrition criteria. A more accurate assessment
of food purchasing trends could be done, by for example analysing till-roll receipts for
changes in actual food purchases. A limitation of this study is that data rely on the caterers
views of changes in food purchasing trends.
151

CHAPTER 9: CONCLUSION/THE WAY FORWARD
9.1 Conclusion
The publication of the Government’s green paper ‘Our Healthier Nation’ (Department of
Health, 1998) acknowledges for the first time that inequality in health is related to socio
economic environment (Horton, 1998). This may add impetus to the local goal to target all
nutrition education activities at lower income groups, and develop the most effective means to
do so. The green paper also mentions the workplace as an ideal setting to reach the adult
population.
The importance of developing strategies targeting low income groups was outlined locally
(Leicestershire Health Plan Steering group, 1993; Holdsworth, 1994; 1996) and nationally
(Low Income Project Team, 1996). The specific needs of lower income groups need to be
prioritised within local nutrition education activity. If the HBA scheme is to reach the target
group of social class groups III manual, IV and V, then targeting smaller workplaces and/or
workplaces with a high profile of lower paid workers is the most appropriate strategy.
Providers and purchasers of health services locally need to decide what action to take in
relation to the HBA scheme. In answer to the fundamental question of whether the award has
been a success, the evidence of this study indicates that it although it is valued by caterers and
dietitians, the main impact measure is whether it has been successful in changing eating
habits. There was a slight positive shift in fat consumption at home in the workforce
population, and in individual behaviour for fat and sugar indices at home, and sugar and
healthy diet indices at work. There were also some positive changes at work in consumption
of type of spreading fat, hard cheese, fruit, vegetables, and low fat cheese. At home, there
were positive changes in consumption of: biscuits and cakes, fried food, starchy
carbohydrates, red meat. None of these dietary changes were detected in the comparison
group, suggesting that the small dietary changes described are likely to have been caused by
the intervention, however the changes only reached significance for red meat and fruit
consumption at work and red meat consumption at home.
There is some evidence that the scheme influenced the behaviour of men, lower social class
groups and younger age groups after initial resistance. These are the groups most in need of
change. Indeed small changes are used to indicated success in health promotion, and one
could argue that it may be unrealistic to expect change from such a low intensity programme.
152

Wider political and social change are also needed if there is to be any significant shift in
dietary behaviour in lower social class groups.
The evidence in this thesis suggests that the scheme is not worth continuing unless radical
improvements are made. The recommendations described below should be implemented
before the decision to stop operating the HBA scheme is made. It is crucial that the nutrition
standards of the HBA are in place, otherwise maximum opportunity for change is not possible.
As compliance by caterers is erratic, one has to question the value of dietetic input if the issue
of monitoring is not addressed. The scheme does have a lot of potential. The inability to
demonstrate benefit from the scheme does not mean that it should not be purchased
(McCallum, 1993). Purchasers can not expect large health gain from a low intensity project,
which is run on a shoestring budget. Clearly a more comprehensive scheme focusing on the
workplace could not be provided within current resources. Purchasers of health promotion
activity in the local health authority need to decide whether to invest more money in the
scheme. A cost benefit analysis could be useful to compare the impact of the HBA scheme in
influencing its target groups with other nutrition education projects.
9.2 Recommendations to improve the award locally
9.2.1 There needs to be more flexibility in implementing the nutrition criteria. Caterers with
a limited number of choices on the menu should have more lenience. Broad criteria,
rather than quantified criteria should be used to decide whether a dish is a healthy food
choice. Simplifying the award criteria by introducing a partial award should be
considered. Simple, measurable nutrition criteria are needed.
9.2.2 The variability in the level of change in food provision acceptable to individual
dietitians needs to be addressed so that there is a uniform standard and approach.
9.2.3 Workplaces need to be encouraged to gain support from higher management and
involve occupational health, if it exists, to widen the promotion of the scheme.
9.2.4 Ways to maintain regular contact with HBA premises need to be developed, these
could include: a regular newsletter for HBA holders; regular contact with the health
promotion officer/dietitian; and a local network for HBA holders.
153

9.2.5 The profile of the dietitian needs raising so that customers are aware of their input. A
dietitian is needed to assess composite dishes, whereas advice on making general
changes on healthy food provision could be carried out by another health professional.
9.2.6 Communication channels between the agencies involved need to be clearer to prevent
delays in renewing the award and arranging the award ceremony for approved
premises. More available dietetic time would mean the award process would be
quicker.
9.2.7 The lack of compliance is a major concern. A system of monitoring premises once
they have received the award needs to be introduced. Who is best placed to carry out
this role needs to be considered, whether this needs to be a dietitian is unclear. A
trained dietetic helper/HPO could take on a monitoring role. Clearly this is a resource
issue.
9.2.8 Cost, visual appearance, taste and ‘speed’ should be paramount when advising caterers
on the promotion of healthy food choices. This needs to be communicated to caterers
via training sessions.
9.2.9 The target group of the scheme needs defining locally. Target groups should include
those most in need of dietary change: men, younger age groups, lower socio-economic
groups and the overweight/obese. The Asian community also need targeting, due to
their higher incidence of CHD. These target groups are more likely to be reached if
the scheme operates in workplaces rather than public eating places.
9.2.10 The scheme needs further promotion within the eating place, with improved written
resources for premises to promote the award and market healthy food choices and
healthier eating, and more information for customers to take away. Written resources
also need to be developed to work with different ethnic groups. The ideas and
resources developed for the National Catering Initiative (Department of Health, 1994)
need adapting for local use.
9.2.11 There needs to be more local publicity from the agencies involved. Local organisations
could be encouraged to endorse the scheme, such as tourism and business groups,
media, restaurant and hotel associations.
154

9.2.12 Training of caterers is essential to encourage both the provision of tasty, healthy dishes
and the marketing and monitoring of schemes. The way such training is promoted to
chefs is important so that it is not seen as patronising. Involving award holding chefs
in delivering part of the training may help overcome this and give it credence.
Training needs to involve catering assistants involved in preparing and serving food.
9.2.13 Caterers need to be encouraged to communicate and consult with customers.
Workplace caterers should be encouraged to convene a group of interested parties,
involving other catering staff, an employee and occupational health representative to
increase acceptance of the scheme.
9.2.14 Targeting the HBA scheme at workplaces involved in wider workplace health
promotion programmes, such as the Health at Work Award scheme may be more
effective.
9.3 Recommendations to improve the award nationally
9.3.1 Catering contracts and menus which were set nationally posed particular problems. The
HEA could liaise more with food chains that set menus nationally, which would
overcome some of the local frustrations. The HEA should also liaise with caterers’
suppliers to encourage them to provide catering size quantities of healthier products.
9.3.2 The HEA could help promote nutrition training for caterers by linking in with national
catering organisations and examination boards to gain their support for the scheme.
9.3.3 The prevention of cancer as a specific aim of the HBA scheme also needs incorporating to
reflect the increasing recognition of the role of diet in the development of cancer (World
Cancer Research Fund/American Institute for Cancer Research, 1997).
9.3.4 The HEA could take responsibility for producing multi-cultural/lingual information to
attract a wider range of premises.
9.3.5 More national publicity from the HEA is recommended to raise public understanding,
enhance the award’s association with health and improve its credibility.
155

a ppe n d ic e s
156

VISIT NO.l
SITE ..................
SERIAL NUMBER
FOOD SURVEY
This survey will ask you questions about your eating habits - the food you eat and what influences your choices, particularly at work.
All the information is completely confidential and will only be used for the purposes of this research.
I will be visiting your workplace 3 times over the next 6 months to assess eating habits. This is the first visit. Results collected for the whole workforce will be fed back via an informal report to your workplace.
Michelle HoldsworthDepartment of Epidemiology and Public HealthUniversity of LeicesterClinical Sciences BuildingLeicester Royal InfirmaryPO Box 65Leicester LE2 7LX.
If you are not dear how to complete some of the questions, our researcher will be happy to help.

1.
PART 1
1. Which meals do you usually buy from the staff canteen?(Please tick even if you rarely or never use the staff canteen)
5 or more 3-4 days 1-2 days Never/rarelydays
Breakfast □ □ □ □Lunch □ □ □ □Evening meal □ □ □ □Breaktime □
3□2
□1
□0
What would (if anything) encourage you to eat canteen food more often?
2. Do you have your ‘main meal’ of the day in the canteen?(Please tick)
5 or more 3-4 days 1-2 days Never/raiely days□ □ □ □
3 2 1 0
3. Do you bring your own food to work e.g. packed lunch?(Please tick)
5 or more 3-4 days 1-2 days Never/rarely days□ □ □ □
4. If you follow any special diets, please tick
Vegetarian D o Vegan CI3
Diabetic D i Weight reducing G 4
Cholesterol lowering EL Pregnant/breastfeeding D s
Other, please describe ..............................................
For how long have you followed this diet? ........................

2.
HOW OFTEN DO YOU EAT THE FOODS BELOW WHILST AT WORK/AT HOME?
Please tick the box which is nearest to your eating pattern, please tick both the ‘at home9 and ‘at work9 boxes
What type of milk do you usually choose? AT HOME AT WORKSkimmed (blue/silver top)............................... ......... D o ...........Semi skimmed (red/silver top)......................... ............ □ . ............. ....... D iWhole (silver top), condensed or evaporated.....Soya.............................................................. ........ O s ......... ................... D 3
I do not drink milk........................................ ............. D 4........ .Milk substitute, e.g. Coffeemate.................... .......... D s ...........
2. What type of bread (or chapattis) do you usually eat?(Include toast) AT HOME AT WORKHardly ever eat biead/chapattis................................ D o........................DoBrown/high fibre white bread (No.2chapatti flour) □ 1........................O iWhite bread (No.l chapatti flour)............................... D 2........................D 2Wholemeal/granary bread (no.3 or No.4 chapatti flour) D 3................. ......O 3A mixture of types.................................................. D 4........................O 4
3. What type of spread do you use on bread/chapattis?AT HOME AT WORK
Do not use any........................................................ D o .................. D oLow fat spread, e.g. St. Ivel Gold, Flora Lite D 1................... D 1
Butter/butter based spreads .............. D 2 D 2Margarine labelled ‘high in polyunsaturates’
e.g. sunflower/soya margarine................................. D 3................. O sOther type of margarine (not polyunsaturated).... D 4........................ O 4Don’t know............................................................. D s............................D 5

What do you orally have for breakfast? AT HOME
at home and at work boxes
AT WORKNothing............................................................. n „ ....................D oWholegrain cereal (without sugar added)
e.g. Weetabix, porridge, Branflakes, Shreddies ... n . ....................□ ,Wholegrain cereal (with sugar added)
e.g. Muesli or any with sugar added by you...... n . ................... □ ,Lower fibre cereal without sugar coating and no
sugar added by you, e.g. Cornflakes, Rice Krispies n , ................n 3Lower fibre cereal with sugar coating or sugar added
by you e.g. Frosties, Coco Pops............................. n . ................Toast or chapattis............................................... □ 5.... ................... □ ]Fried, cooked breakfast...................................... LJ 6....Grilled, cooked breakfast............................... r b ....................D iOther, please describe ..................................... LJ io... ................... D io
How many teaspoons of sugar/gur/honey do you add to drinks i.e. tea/coffee AT HOME AT WORKDo not add any.................................................. n « ....................D o1 teaspoon......................................................... n . ................... □<2-3 teaspoons.................................................... n , ................n 2More than 3 teaspoons....................................... O 3....Use an artificial sweetener................................. . n < ................ □ «Never drink....................................................... D s ................ □ 3
HOW OFTEN DO YOU EAT THE FOLLOWING FOODS? (Please tick)
Chicken and fish, (include all fish except fried) AT HOME AT WORKNever............................................................... n , ................ □ ,Less than once a week....................................... n 7 ................ O t1-3 times a week................................................ n , ....................□ ,4-6 times a week................................................ n . ................ □ .Once a day........................................................ n , ................More than once a day................................. ...... □ . ....................
Red meat - beef, pork, lamb AT HOME AT WORKNever............................................................... n , ....................□ ,Less than once a week....................................... n , ....................□ *1-3 times a week................................................ n , ....................4-6 times a week................................................ r u ....................□ .Once a day........................................................ n , .................... □ 5
More than once a day........................................ n . ................ □ .

4.
Tick bath at home and at work boxes
Processed meats (sausages, burgers, pies, AT HOME AT WORKpork pie, luncheon meat)Neva'...................................................................... □ i.................... . □ iLess than once a week................ ........... ................. □ > ............................□ ,1-3 times a week................... ..................................... □ ,.........................□ ,4-6 times a week...................................................... D 4........................D 4Once a day............................................................... □ j........................D sMore than once a day................. .:............................ D (
Baked beans or pulses (e.g. dahl, lentils, soya products, red kidneybeans) AT HOME AT WORKNever..................................................................... D i .................... D iLess than once a week................................................ D .2...........................D 21-3 times a week........................................................ D .3..................... D 34-6 times a week........................................................ D .4.........................D 4Once a day................................................................. Cl.5......................... □ 5More than once a day................................................. D .6...........................D 6
10. Hard cheese (including Cheddar, RedLeicester, Stilton, blue cheese) AT HOME AT WORKNever.................................................................................... D .1............................ D 1Less than once a week................................................ D 2......................O 2
1-3 times a week.................. ................................ . . . .□>4-6 times a week................................- ........................... Cl.4....................... D a
Once a day................................................................. Cl.5................ .D jMore than once a day................................................. D .6................. O «
11. Reduced fat cheese e.g. cottage cheese,low fat cheddar, low fat cheese spreads AT HOME AT WORKNever.................. ....................................... ............ □ . ............... .Less than once a week................................. ............ □ * ........................o »1-3 times a week......................................... ............ □ , ........................4-6 times a week......................................... ............□ < ............. ..............□ «Once a day.................................................. ............ O s ........................O sMore than once a day..................................

5.
Tick both at home and
12. Bread, chapattis, rice, pasta, potatoes or breakfast cereal at work boxes(not including fried varieties) AT HOME AT WORKNever........................... ......................................... D 1........................ D iLess than once a week............... □ * ........................ □ :1-3 times a week................... ................................. n 3........................ Ds4-6 times a week...................................... □ 4.............. □ 4Once a day.............................................................. D s ........................ DsMore than once a day.............................................. □ 6........................ □ 6
13. Fruit (fresh, stewed, unsweetened tinned) AT HOME AT WORKNever..................................................................... □ i........................ □ iLess than once a week............................................. □ 2........................ D 21-3 times a week.................... ................................ C3 3........................ O 3
4-6 times a week................... .................................. c h ......................... n 4Once a day.............................................................. □ s......................... □ 5More than once a day.............................................. □ 6......................... □ 6
14. Vegetables (fresh, frozen, tinned, salad) AT HOME AT WORKNever..................................................................... D 1......................... D 1
Less than once a week............... ............................. □ * ......................... D i1-3 times a week................... .................................. □ , .............................□ ,4-6 times a week..................................................... D 4......................... D 4Once a day.............................................................. D s......................... D 5
More than once a day.............................................. D ( ......................... D 6
15. Sweets or chocolate e.g. packet of sweets/bar ofchocolate or Indian sweets (e.g. Burfi) AT HOME AT WORKNever......................... ............................................ □ , ......................... □ ,Less than once a week............... ............................. □ * ........................□ *1-3 times a week................... .................................. □ , .............................□ ,4-6 times a week................... ..................................□ « .............................□ «Once a day.............................................................. D s......................... D 5
More than once a day.............................................. D 6......................... D (
16. Puddings, e.g. fruit pies AT HOME AT WORKNever........................ ............................................ □ , ......................... □ ,Less than once a week............... □ , ........................ □ *1-3 times a week.................. □ , ........................ □ ,4-6 times a week.................. □ « .........................□ «Once a day.............................................................. D s ......................... D sMore than once a day.............................................. D 6........................ D 6

6.Tick both at home and at work boxes
17. Sweet biscuits and/or cakes AT HOME AT WORKNever.............................................................. ........ d i . . . . . . ......... O iLess than once a week.............................................. □ 2..... D 21-3 times a week.................. ................................... CL........................C L4-6 times a week...................................................... □ 4 D 4Once a day............................................................... □ 5.................... G 5More than once a day............................................... D «............. ..........CK
18. Crisps or other fried snack, e .g .:samosa, Bombay mix, bhqjis, peanuts AT HOME AT WORKNever...................................................................... □ 1........................0 1
Less than once a week................. . ........................... O 2........................O 21-3 times a week...................................................... □ 3........................D 34-6 times a week...................................................... D 4........................D 4Once a day........................................................ ...... O j........................D sMore than once a day............................................... G 6................... D 6
19. Any fried food (except crisps), e.g. chips, fried fish, fried breakfast, roast potatoes AT HOME AT WORKNever................................................................ ..............O iLess than once a week....................................... ...... CL.......................... □ *1-3 times a week............................................... ...... CL..........4-6 times a week............................................... ...... CL........................CD 4Once a day........................................................ ...... CL......... ............. O sMore than once a day........................................ ...... CL.........
20. Low calorie/sugar free drinks e.g.Diet Coke/Pepsi, low calorie squash AT HOME AT WORKNever................................................................ ........ □ . ...................... ........□ ,Less than once a week.......................................1-3 times a week............................................... ......... D i.......... ..............O s4-6 times a week...............................................Once a day........................................................ ....... O s ........... ............ O sMore than once a day..............................................
21. Sugary drinks - fizzy pop/squash AT HOME AT WORKNever.........................................................................Less than once a week............................... ............. ....... D i ...........1-3 times a week....................................................... ....... -O s ............. ................ CD 34-6 times a week....................................................... ....... ED 4........... ............... CD 4Once a day.............................................................. El*...... .................C3*More than once a day............................................... D 6........................D 6
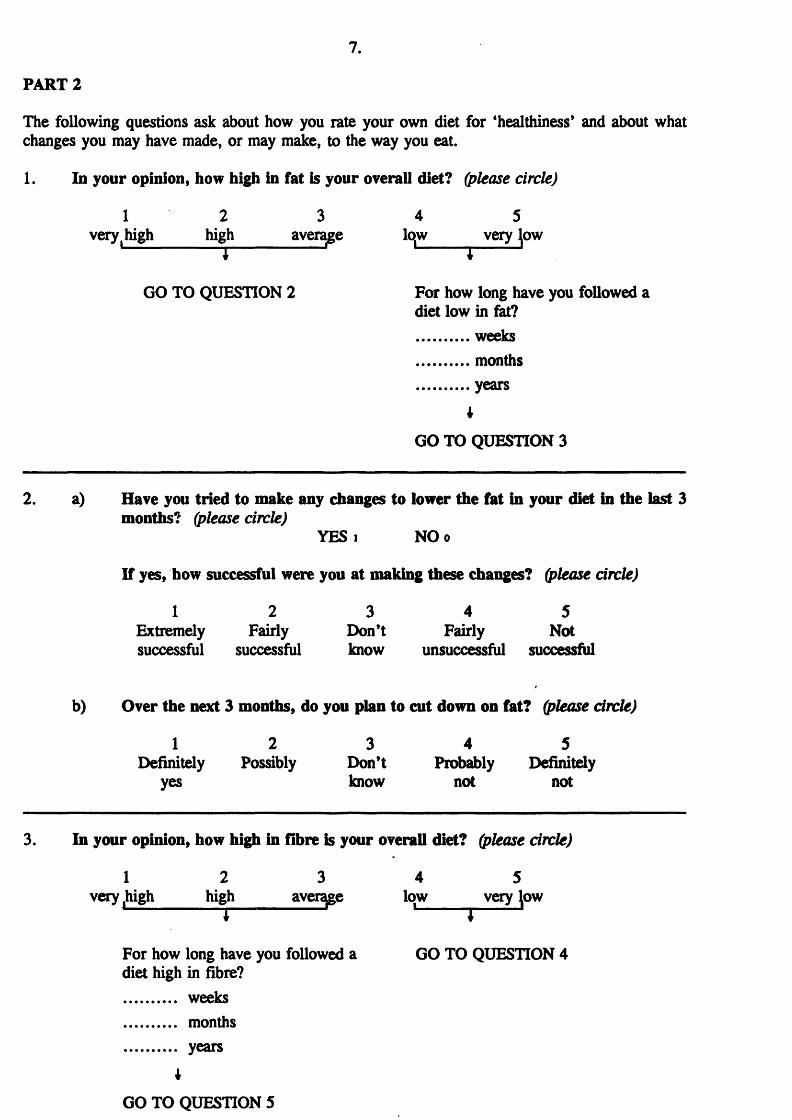
PART 2
The following questions ask about how you rate your own diet for ‘healthiness’ and about what changes you may have made, or may make, to the way you eat.
1. In your opinion, how high in fat is your overall diet? (please circle)
1 2 3 4 5very | high_____high______ average lqw very few
GO TO QUESTION 2 For how long have you followed adiet low in fat? weeks months years
t
GO TO QUESTION 3
2. a) Have you tried to make any changes to lower the fat in your diet In the last 3 months? (please circle)
YES i NOo
If yes, how successful were you at making these changes? (please circle)
1 2 3 4 5Extremely Fairly Don’t Fairly Notsuccessful successful know unsuccessful successful
b) Over the next 3 months, do you plan to cut down on fat? (please circle)
1 2 3 4 5Definitely Possibly Don't Probably Definitely
yes know not not
3. In your opinion, how high in fibre is your overall diet? (please circle)
1 2 3 4 5very high high average low very low
i --------------------- '----------- 1----------J
For how long have you followed a GO TO QUESTION 4diet high in fibre? weeks months years
*
GO TO QUESTION 5

p
8.
4. a) Have you tried to make any changes to increase the fibre in your diet in the last 3 months? (please circle)
YES i NO o
If yes, how successful were you at making these changes? (please circle)
1 2 3 4 5Extremely Fairly Don’t Fairly Notsuccessful successful know unsuccessful successful
b) Over the next 3 months, do you plan to eat more fibre? (please circle)
1 2 3 4 5Definitely Possibly Don’t know Probably Definitely
yes not not
overall diet? (please circle)
4 5low very low
1 I 3
For how long have you followed a diet low in sugar? weeks months years
I
GO TO PART 3 (overleaf)
6. a) Have you tried to make any changes to decrease the amount of sugar in your diet in the last 3 months? (please circle)
YES i NOo
If ‘yes’, how successful were you at making these changes? (please circle)
1 2 3 4 5Extremely Fairly Don’t Fairly Notsuccessful successful know unsuccessful successful
b) Over the next 3 months, do you plan to eat less sugar? (please circle)
1 2 3 4 5Definitely Possibly Don’t Probably Definitely
yes know not not
5. In your opinion, how high in sugar is your
1 2 3very, high high______ average
GO TO QUESTION 6

9.PART 3
This part is about what influences the food you choose.
Please circle the answer that is closest to yours, indicating how you feel about the statement.
e.g. 1 2 3 4 5strongly agree don’t disagree stronglyagree know disagree
Eating a lot of fruits and vegetables decreases my chances of developing heart disease.
1 2 3 4 5 strongly strongly agree disagree
Eating a lot of fried foods increases my chances of developing heart disease.
1 2 3 4 5 strongly strongly agree cfisagree
It is important that healthy food choices are available at work.
1 2 3 4 5 strongly strongly agree disagree
I find that there are a lot of conflicting messages around concerning a healthy diet.
1 2 3 4 5 strongly strongly agree disagree
What I eat is one of the most important things for my health.
1 2 3 4 5 strongly strongly agree disagree
The available information on healthy eating is easy to understand.
1 2 3 4 5 strongly strongly agree disagree
There is a lot of information on healthy eating where I work.
1 2 3 4 5 strongly strongly agree disagree
At my workplace it is easy to eat a healthy diet. 1 2 3 4 5 I strongly strongly agree disagree
Healthy foods taste good 1 2 3 4 5 strongly strongly agree disagree
At work, I tend to eat similar foods most days 1 2 3 4 5 strongly strongly agree disagree
I need something quick to eat at work 1 2 3 4 5 strongly strongly agree disagree
I feel confident that I know what foods I should be eating to have a healthy diet
1 2 3 4 5 strongly strongly agree disagree
At work, the cost of food influences what I eat 1 2 3 4 5 strongly strongly agree disagree

10.
1 For me, the way in which food is presented at work influences my food choice
1stronglyagree
2 3 45 " 1strongly
disagree
; At work, I choose foods to improve my mood 1stronglyagree
2 3 4 5stronglydisagree
i 1 tend to have a healthy diet at work 1stronglyagree
2 3 4 5stronglydisagree
| I tend to have a healthy diet at home 1stronglyagree
2 • 3 4 5stronglydisagree
i 1 get a lot of encouragement for eating a healthy diet from my co-workers
1stronglyagree
2 3 4 5stronglydisagree
I get a lot of encouragement for eating a healthy diet from my dose friends and family
1stronglyagree
2 3 4 5stronglydisagree
Eating a healthy diet is very important to me 1stronglyagree
2 3 4 5stronglydisagree
| At home, the cost of food influences what I eat 1stronglyagree
2 3 4 5stronglydisagree
FART 4
This part is about vour knowledge of ‘healthy’ eating. If you are not sure, please tick 'don’t know*.
; 1. According to the latest health guidelines to improve the nation’s health, should people generally eat more or less or the same of the following: -
[ (Please tick one box per food)
Fat...........................................................................Sweets and chocolates........................... DSugar.......................................................................Starchy foods, e.g. bread, potatoes, rice, chapatds ClFruit and vegetables.................................................... DFried food.......................................... d
Eat Eat Eat Don’tmore less same know
□ □ □ □□ □ □ □□ □ □ □□ □ □ □□ □ □ □□ □
2□3
□4

11.
2. If you were trying to choose more low fat foods, which foods in the following pairs would you select because it was lower in fat?
(please tick one per pair)
(a) Shepherds pie and peas OR □Cornish pasty and roast potatoes □Don’t know □
(b) Cheese flan and salad OR □Tuna, bread roll and salad □Don't know □
(c) Stewed apple and custard OR □Apple pie and custard □Don't know □
3. If you were trying to choose more high fibre foods, which foods in the following pairs would you select because it was higher in fibre?
(please tick one box per pair)
(a) Chilli con came and rice OR □Mince beef pie and chips □Don't know □
(b) Baked beans and jacket potato OR □Coleslaw and jacket potato □Don't know □
(c) Rhubarb crumble and custard OR □Jam tart and custard □Don't know □
4. If you were trying to choose more low sugar foods, which foods in the following pairs would you select because it was lower in sugar?
(please tick one box per pair)
(a) Pear OR □Muesli bar □Don’t know □
(b) Diet coke OR □Milkshake □Don’t know □

T 5 12.
W FOR SOME INFORMATION ABOUT YOU
of this information is confidential Tick one box only □
NAME..................................................................
We need your name so that we can match this questionnaire with future ones because we’re interested in changes in people’s diet. This is entirely confidential and will only be used for the purpose of this research.
MALE □ FEMALE- □1 2
AGE
OCCUPATION (please describe fully)
I WORK:- FULLTIME □ PART TIME □ Average No. of days2 i worked per week
PLEASE DESCRIBE YOUR ETHNIC ORIGIN
White □ . Black African D 4 Black Caribbean G 1
Indian □ 2 Chinese □ 5 Black other □ .Pakistani □ 2 Bangladeshi □ « Other □
(please specify)
I do not wish to indicate my ethnic origin D 9
MY WEIGHT IS ...........stones .............. pounds
MY HEIGHT IS ............feet ............... inches
I AM CURRENTLY TRYING TO LOSE WEIGHT
YES D i NO Do
If ‘yes’; Do you follow a healthy diet because you are trying to lose weight?
YES D i NO d o

Appendix 3.2
HEARTBEAT QUESTIONNAIRE
All the information in this questionnaire is completely confidential
ABOUT YOU
NAME..............................................................
Tick one box only 0
MALE D FEMALE U
My age now is
Please describe your ethnic origin
Bangladesh □Black Caribbean □Chinese □Pakistan [~J.Other □(please specify)
Black African 01Black other □Indian □White Q
I do not wish to indicate my ethnic origin L j
My job is................. ...................................
I work Full Time 01 Part Time □(Tick one only)
I am trying to lose weight YES □ NO □
My weight is stones pounds(or...............kilos)
My height is .............. feet inches(or metres cms)

- 2 -
B. WHAT IS YOUR USUAL DIET?
1.
A bout how m any slices of bread or rolls (or chappatis) do you eat on a usual day?Are they usually white, brown or wholemeal? (choose 1 only, i f possib le)
B read less than 1 a day
1-2 a day
3-4 a day
5 or more a day
White bread
Brown or granary bread M ig h ty W hite , so ft gra in
Wholemeal bread or 2 slices crispbread
2.
About how m any times a week do you have a bowl of breakfast cereal o r porridge? W hat kind do you have most often? (choose 1 only, i f possib le)
Breakfast cereal less than 1 a week
1-2 a week
3-4 a week
6 or more a week
Sugar type: Frosiies, Coco Pops, Ricicles, Sugar Puffs
Rice/Com type: Corn Flakes, Rice Krispies, Special K
Porridge or Ready Brek
High Fibre type: Shredded Wheat, Weetabix, Puffed Wheat, Fruit’n Fibre, Nutri-Grain, All Bran, Branflakes, Sultana Bran
Muesli type: Alpen, Jordan’s
3.
About how m any times a week do you eat a serving o f the following foods? (choose one on each line)
less than 1 a week
1-2 a week
3-4 a week
6 or more a week
Pasta or rice
Potatoes
Peas
Other vegetables (any type)
Beans (baked, soya products, tinned, dried) or lentils
Fruit (fresh, fro ze n o r canned)

- 3 -
4 .
About how m any times a week do you eat a serving of the following foods:
less than 1 a week
1-2 a week
3-4 a week
6 or more a week
Cheese (any except cottage)
Beefburgers or sausages
Beef, pork or lamb (if vegetarian; nuts)
Bacon, meat pies, processed meat
5.
About how m any times a week do you eat a serving o f the following foods:
less than 1 a week
1-2 a week
3-4 a week
6 or more a week
Chicken or turkey
Fish (NOT fried)
ANY fried food; including that with oil, fried fish, chips, cooked breakfast, samosas
Cakes, pies, puddings, pastries t* .
Biscuits, chocolate, or crisps
6 .
About how m uch m ilk do you yourself use in a day, for drinking o r in cereal, tea, or coffee? (Please indicate type) (choose o n ly 1 i f possib le)
Milk less than 1/4 pint
about 1/4 pint
about a 1/2 pint
1 pint or more
Full cream (silver top) or Channel Islands (gold top)
Semi-skimmed (red striped top)
Skimmed (blue checked top)

- 4 -
7.
About how m any rounded teaspoons o f m argarine, bu tter or other spread do you usually use in a day, for example on bread, sandwiches, toast, potatoes or vegetables?
Butter o r m argarine: Flora, viialiie/Light, sunflower and soya types, Blue Band, Golden Crown, Mello, Krona, Stork/Light Summer County □Low fa t Spread: Gold/Lowest, Outline, Shape, Flora Extra Light, Clover Extra Lite, Delight, Half Fat Butter, County Light □
8 .
How m any times a week do you eat/drink the following?
Sugary Foods less than once a week
1-2 a week
3-5 a week
most days 6 or more per week
Sweets/chocolates
Sweet puddings/cakes
Biscuits - ■ • . ••
Sweetened drinks e.g. fizzy/squashes
'o u . .
9.
Do you add sugar to drinks?
less than 3 tsps daily
4-9 tsps daily
10 or more . tsps daily -
10.
W hich m eals do you usually eat in the staff canteen?
Breakfast
Never 1-2 times a week
3-5 times a week
Lunch
Evening Meal

- 5 -
11. Do you think it is important that healthy food choices are available in the staffcanteen?
Of great □ Of some CD Of little/ CH importance importance no importance
12. What do you think of the choice of food provided in your staff canteen?(Please circle)
5 4______ 3___________2___________ 1_
Excellent good okay poor very poor
* How would you like to see it inipfroved?
13. In your view, are healthy choices available? (please circle)
1. Yes 2. Sometimes 3. Never
14. Do you consider yourself to have a healthy diet? (please circle)
1. Yes 2. No

- 6 -
If no, what would help you to improve your diet? (Circle one or more and write in the space below)
1. More money2. Better transport3. More information4. More support from my family5. Better local shops6. More time7. More willpower8. Healthy food choices at work
Other, please say w hat................................
15. What are your main sources of information about eating and health? Could you comment on the quality of the information? (Please tick)
SOURCES VERY CLEAR MODERATELYCLEAR
VERYCONFUSING
At work
G.P.
Magazines/newspapers'V u . »
Radio
T.V.
Leaflets/posters
None o f these
Comments:
16. Have you heard of the Heartbeat Award?
Yes □ No □

- 7 -
C. QUIZ ON FOOD KNOWLEDGE
Please indicate whether the following statements are true/false by circling the correct answer. We are interested in your own individual response.
1. Skimmed milk contains as much fat as whole milk. TRUE/FALSE
2. Sugar is needed for energy. TRUE/FALSE
3. It does not matter how much fat we eat TRUE/FALSE
4. Butter and margarine have the same total fat content.
TRUE/FALSE
5. Edam cheese contains less fat than Cheddar cheese.
TRUE/FALSE
6. Boiled potatoes are low in fat. TRUE/FALSE
7. It is necessary to eat some meat, fish, eggs, cheese, beans or nuts every day.
TRUE/FALSE
Vegetable oils are good for you because they’re polyunsaturated.
TRUE/FALSE
Brown bread and wholemeal bread are the same thing.
TRUE/FALSE
10. We should eat less sugar. TRUE/FALSE
11. Bread and potatoes have a high fibre content. TRUE/FALSE
12. Starchy foods like bread and potatoes are fattening.
TRUE/FALSE

PILOT
A ppendix 3.3
FOOD SURVEY
This survey will ask you questions about your eating habits - the food you eat and what influences your choices, particularly at work.
All the information is completely confidential and will only be used fo r the purposes of this research.
If you are not clear how to complete some of the questions, our researcher will be happy to help.
Michelle Holds worthDepartment o f Epidemiology and Public healthUniversity o f LeicesterSchool o f MedicineLeicester Royal InfirmaryPO Box 65Leicester LE2 7LX.

PART 11 .
WHAT DO YOU EAT AT WORK?
1. Which meals do you usually eat in the staff canteen? (Please tick)
Never 1-2 times 3-5 timesa week a week
Breakfast □ □ □Lunch □ □ □Evening meal □ □ □
2. Do you have your ‘main meal’ of the day in the canteen? (Please tick)
Every day 3-5 days 2 days Never □ □ □ □
3. Are you on a ‘special’ diet? (Please tick)
YES □ NO □
e.g. vegetarian, vegan, diabetic, weight reducing, cholesterol lowering.
Please describe:

2.
HOW OFTEN DO YOU EAT THE FOODS BELOW WHILST AT WORK/AT HOME?
Please tick the box which is nearest to your eating pattern
AT HOME
1. Skimmed or semi skimmed milk only (include soya)Never [HLess than once a week Cl2-3 times a week □4-6 times a week □More than once a day Cl
2. Any other type of milk(Full fat milk, evaporated etc.)Never ClLess than once a week □2-3 times a week □4-6 times a week □More than once a day C
3. Chicken and fish, include all fish (not fried), turkeyNever ClLess than once a week □2-3 times a week □4-6 times a week □More than once a day Cl
4. Processed meats (sausages, burgers, pies, luncheon meat, corned beef)Never ClLess than once a week □2-3 times a week □4-6 times a week □More than once a day Cl
5. Baked beans or pulses (e.g. dahl, lentils, soya products, red kidney beans)Never □Less than once a week □2-3 times a week Cl4-6 times a week □More than once a day U
AT WORK
□□□□□
□□□□□
□□□□□
□□□□□
□□□□□

3.
AT HOME
6. Butter or margarine (all types of margarine)Never dLess than once a week d2-3 times a week □4-6 times a week dMore than once a day d
7. Low fat spread, e.g. St. Ivel Gold,Flora Lite, VitaliteNever dLess than once a week □2-3 times a week □4-6 times a week □More than once a day d
8. Pies, puddings, pastriesNever dLess than once a week □2-3 times a week □4-6 times a week □More than once a day d
9. High fibre breakfast cereal e.g. Weetabix,Shredded Wheat, Branflakes, AH Bran (without added sugar)Never □Less than once a week □2-3 times a week □4-6 times a week dMore than once a day d
10. Lower fibre breakfast cereals e.g. Cornflakes,Rice Krispies, Special K (without sugar coating) or adding sugarNever □Less than once a week □2-3 times a week d4-6 times a week □More than once a day d
AT WORK
□□□□□ □□□□□
□□□□□ □□□□□
□□□□□

AT HOME AT WORKBreakfast cereal with sugar coating e.g. Frosties, Coco Pops, Crunchy Nut Cornflakes, Sugar PuffsNever ClLess than once a week Cl2-3 times a week □4-6 times a week DMore than once a day Cl
High fibre breakfast cereal with added sugar e.g. Muesli (or sugar added by you)Never ClLess than once a week □2-3 times a week Cl4-6 times a week QMore than once a day Cl
Low calorie/sugar free drinks e.g.Diet Coke/Pepsi, low calorie squash Never ClLess than once a week Cl2-3 times a week Cl4-6 times a week ClMore than once a day Cl
Sweet drinks - fizzy pop/squash or more than 3 teaspoons sugar in tea/coffee Never ClLess than once a week Cl2-3 times a week □4-6 times a week ClMore than once a day Cl
Red meat - beef, pork, lambNever ClLess than once a week Cl2-3 times a week Cl4-6 times a week ClMore than once a day Cl
□Hard cheese (including Cheddar, Red Leicester, Stilton, blue cheese)NeverLess than once a week □2-3 times a week Cl4-6 times a week ClMore than once a day Cl
□□□□□ □□□□□
□□□□□ □□□□□
□□□□□ □□□□□

AT HOME AT WORK
17. Reduced fat cheese e.g. cottage cheese, low fat cheddarNever dLess than once a week CH2-3 times a week □4-6 times a week dMore than once a day d
18. Sweet biscuits or cakesNever dLess than once a week □2-3 times a week d4-6 times a week □More than once a day d
19. Rice or pasta or potatoesNever dLess than once a week □2-3 times a week □4-6 times a week □More than once a day d
20. Wholemeal, granary or other high fibre bread/crispbread including chapattis made with No.2, 3 or 4 flour)Never dLess than once a week □2-3 times a week □4-6 times a week □More than once a day d
21. Any other type of bread (including chapattis made with No.l flour, white bread, white pitta naan bread)Never □Less than once a week □2-3 times a week □4-6 times a week □More than once a day d
22. Fruit (fresh, stewed, tinned)Never dLess than once a week □2-3 times a week □4-6 times a week dMore than once a day d
□□□□□ □□□□□
□□□□□ □□□□□
□□□□□ □□□□□

6.
AT HOME23. Vegetables (fresh, frozen, tinned, salad)
Never CZ3Less than once a week □2-3 times a week □4-6 times a week □More than once a day Cl
24. Sweets or chocolateNever ClLess than once a week Cl2-3 times a week □4-6 times a week □More than once a day Cl
25. Crisps or other fried snack, e.g. samosa, Bombay mixNever ClLess than once a week Cl2-3 times a week □4-6 times a week ClMore than once a day Cl
26. Any fried food (except crisps), e.g. chips, fried fish, fried breakfast, roast potatoesNever ClLess than once a week Cl2-3 times a week □4-6 times a week ClMore than once a day Cl
AT WORK
□□□□□ □□□□□
□□□□□ □□□□□

/ .
PART 2
The following questions ask about how you rate your own diet for ‘healthiness’ and about what changes you may have made, or may make, in the way you eat.
1. How high in fat is your overall diet? (please circle)
1 2 3 4 5very high high average low very low
If ‘very high, high or average’ move on to question 2.
If ‘low or very low’:-
For how long have you followed a diet low in fat?.............................................................
Now move onto to question 3.
2. a) Have you tried to make any changes to lower the fat in your diet in the last 3months? (please tick)
YES □ NO □
If yes, how successful were you at making these changes? (please circle)
1 2 3 4 5Extremely Notsuccessful successful
b) Over the next 3 months, do you plan to cut down on fat? (please circle)
1 2 3 4 5Definitely yes Definitely no
3. How high in fibre is your overall diet? (please circle)
1 2 3 4 5very high high average low very low
If ‘very low, low or average’ - move on to question 4.
If ‘very high or high’:-
For how long have you followed a diet high in fibre?
Now move on to question 5.

8.
4. a) Have you tried to make any changes to increase the fibre in your diet in the last 3 months? (please tick)
YES □ NO □
If yes, how successful were you at making these changes? (please circle)
1 2 3 4 5Extremely Notsuccessful successful
b) Over the next 3 months, do you plan to eat more fibre? (please circle)
1 2 3 4 5Definitely yes Definitely no
5. How high in sugar is your overall diet? (please circle)\
1 2 3 4 5;■ very high high average low very low
If ‘very high, high or average, move on to question 6.
If ‘low or very low’:-
For how long have you followed a diet low in sugar? .................................
Now move on to question 7.
6. a) Have you tried to make any changes to decrease the amount of sugar in your diet in the last 3 months? (please tick)
YES □ NO □
If ‘yes’, how successful were you at making these changes? (please circle)
1 2 3 4 5Extremely Notsuccessful successful
b) Over the next 3 months, do you plan to eat less sugar? (please circle)
1 2 3 4 5Definitely yes Definitely no

PART 3
This part is about what influences the food you choose.
Please circle the answer that is closest to yours, indicating how you feel about the statement.
Eating a lot o f fruits and vegetables decreases a person’s chances o f developing heart disease.
1stronglyagree
2 3 4 5stronglydisagree
Eating a lot o f fried foods increases a person’s chances o f developing heart disease.
1stronglyagree
2 3 4 5stronglydisagree
It is important that healthy food choices are available at work.
1stronglyagree
2 3 4 5stronglydisagree
There is so much advice about healthy ways to eat, I don’t know what is good o r bad.
1stronglyagree
2 3 4 5stronglydisagree
What I eat is one o f the most important things for my health.
1stronglyagree
2 3 4 5stronglydisagree
Low fat foods taste good. 1stronglyagree
2 3 4 5stronglydisagree
There is a lot o f information on healthy eating where I work.
1stronglyagree
2 3 4 5stronglydisagree
At my workplace it is easy to eat a healthy diet. 1stronglyagree
2 3 4 5stronglydisagree
Healthy foods taste good 1stronglyagree
2 3 4 5stronglydisagree
At work, I tend to eat similar foods most days 1stronglyagree
2 3 4 5stronglydisagree
I need something quick to eat at work 1stronglyagree
2 3 4 5stronglydisagree
I tend to eat the first food I see when I go into the canteen
1stronglyagree
2 3 4 5stronglydisagree
At work, the cost o f food influences what I eat 1stronglyagree
2 3 4 5stronglydisagree

10.
work, I eat foods that are presented well 1stronglyagree
2 3 4 5stronglydisagree
work, I eat foods that improve my mood 1stronglyagree
2 3 4 5stronglydisagree
end to have a healthy diet at work 1stronglyagree
2 3 4 5stronglydisagree
end to have a healthy diet at home 1stronglyagree
2 3 4 5stronglydisagree
:>w much encouragement for eating a healthy diet do u get from your co-workers?
1verymuch
2 3 4 5none
)w much encouragement for eating a healthy diet do u get from close friends and family?
1verym uch
2 3 4 5none
)w important to you is eating a healthy diet? 1extrem elyim portan t
2 3 4 5not
im portant

P A R T 4
T his part is about your k n ow led ge o f ‘healthy’ foods.
1. If you were trying to choose more low fat foods, which foods in the following pairs would you selt because it was lower in fat?
(please tick one per pair)
(a) Shepherds pie and peas OR □ Don’t know □Cornish pasty and roast potatoes □
(b) Macaroni cheese and salad OR □ Don’t know □Tuna, bread roll and salad □
(c) Stewed apple and custard OR □ Don’t know □Apple pie and custard □
2. If you were trying to choose more high fibre foods, which foods in the following pairs would y select because it was higher in fibre?
(please tick one box per pair)
(a) Chilli con came and rice OR □ Don’t know □Mince beef pie and chips □
(b) Baked beans and jacket potato OR □ Don’t know □Cheese and coleslaw and jacket potato □
(c) Rhubarb crumble and custard OR □ Don’t know □Jam tart and custard □
3. If you were trying to choose more low sugar foods, which foods in the following pairs would y select because it was lower in sugar?
(please tick one box per pair)
(a) Banana OR CD Don’t know dMuesli bar D
(b) Diet coke OR Milkshake
□□ Don’t know CD

RT5 12.
)W FOR SOME INFORMATION ABOUT YOU
of this information is confidential Tick one box only 0
MALE □ FEMALE □
My age now is ...................................................
My occupation is ............................... ...................(please describe fully)
I work:-
Full time O Part time O
My weight is ................. stones ............ pounds( o r ............. kilos)
My height is ................. feet ............ inches( o r ........metres ........................cms)
I am currently trying to lose weight
YES □ NO □
Please describe your ethnic origin
Bangladesh O Black African OBlack other Q Chinese GPakistan Q White Q
I do not wish to indicate my ethnic origin Q
a result of this study we would like to follow you up - would you be prepared to complete another food ;stionnaire in 3 months’s time?
YES Q NO Q
yes, please fill in your name.
N A M E....................................................
Black Caribbean □Indian □Other Q(please specify)
THANK YOU FOR YOUR HELP

Appendix 3.4
EVALUATION FORM FOR FOOD SURVEY
We would be grateful if you could answer the following questions to help us improve the survey for future use.
1. Was the survey easy to follow and logically written?
5 4 3 2very clear and logical
2. Any comments:-
3. How long did the survey take you to complete?'
4. Any other comments on the content of the survey?
1confusing
doesn’t link together

A ppendix 3.5
SERIAL NUMBER
STAGE 2
FOOD SURVEY
This survey will ask you questions about your eating habits - the food you eat and what influences your choices, particularly at work.
We are also interested in your views about the Heartbeat Award scheme that was introduced into your workplace.
A ll the information is completely confidential and will only be used for the purposes of this research. Individualresponses will not be identified.
Michelle HoldsworthC/o Department of Epidemiology and Public HealthUniversity of Leicester22-28 Princess Rd WestLeicesterLEI 6TP

1.
PART 1
1. Which meals do you usually buy from the staff canteen?(Please tick even if you rarefy or never use the stoff canteen)
5 or more 3*4 days 1*2 days Never/raidays
Breakfast □ □ □ □Lunch □ □ □ □Evening meal □ □ □Breaktime □
3□2
□1
□0
What would (if anything) encourage you to eat canteen food more often?
2. Do you have your ‘main meal’ of the day in the canteen?(Please tick)
5 or more 3-4 days 1-2 days Never/rarely days□ □ □ □
3 2 1 0
3. Do you bring your own food to work e.g. packed lunch?(Please tide)
5 or more 3*4 days 1*2 days Never/rarely days□ □ □ □
4. If you follow any special diets, please tick
Vegetarian G o Vegan O 3
Diabetic D i Weight reducing DoCholesterol lowering D 2 Pregnant/breastfeeding G s
Other, please describe ...................
For how long have you followed this diet?

HOW OFTEN DO YOU EAT THE FOODS BELOW WHILST AT WORK/AT HOME?
Please tick the box which is nearest to your eating pattern, please tick both the ‘at home’ and ‘at work’ boxes
What type of milk do you usually choose? AT HOME AT WORKSkimmed (blue/silvertop)........................................... G o...................... G oSemi skimmed (red/silver top)..................................... G .i....................... G 1
Whole (silver top), condensed or evaporated................. G .2....................... G 2Soya......................................................................... □ .3...........................□ 3I do not drink milk.................................................... Q .4....................... G 4Milk substitute, e.g. Coffeemate................................. G .s.......................G s
What type of bread (or chapattis) do you usually eat?(Include toast) AT HOME AT WORKHardly ever eat bread/chapattis................................. G o ..............Brown/high fibre white bread (No.2 chapatti flour)..... G i..........White bread (No.l chapatti flour)............................... G 2..............................0 2Wholemeal/granary bread (no.3 or No.4 chapatti flour) G 3..........A mixture of types.................................................. LJ 4..............................0 4
What type of spread do you use on bread/chapattis?AT HOME AT WORK
Do not use any.......................................................... G o ....................... G oLow fat spread, e.g. St Ivel Gold, Flora Lite G 1......................... G 1
Butter/butter based spreads......................................... G .2........................G 2Margarine labelled ‘high in polyunsaturates’
e.g. sunflower/soya margarine................................. G .3........................G 3Other type of margarine (not polyunsaturated).................. G .4.........................G 4Don't know............................................................... Q .5............................ O s

3.Tick both at home and at work boxes
What do you usually have for breakfast? AT HOME AT WORKNothing......................... 0 o,..... . D oWholegrain cereal (without sugar added)
e.g. Weetabix, porridge, Branflakes, Shreddies □ 1.............. O tWholegrain cereal (with sugar added)
e.g. Muesli or any with sugar added by you □ 2......... . D 2Lower fibre cereal without sugar coating and no
sugar added by you, e.g. Cornflakes, Rice Krispies P 3 O sLower fibre cereal with sugar coating or sugar added
by you e.g. Frosdes, Coco Pops............................. □ 4........................ □ 4Toast or chapattis .................................. ........ P s ........................O sFried, cooked breakfast............................................. P 6....... ........... . P *Grilled, cooked breakfast......................................... □ 7..Other, please describe ............................ ......... P 10.
O 7P 10
How many teaspoons of sugar/gur/honey do you add to drinks i.e. tea/coffee AT HOMEDo not add any......................................................... □ 0....1 teaspoon ........................................... Pi....2-3 teaspoons ........... ..................... ........................ D 2....More than 3 teaspoons.............................................. O s....Use an artificial sweetener........................................ O 4....Never drink............................................................ Ps....
AT WORK ....... Do P i Da .O s .......... 0 4...... P s
HOW OFTEN DO YOU EAT THE FOLLOWING FOODS? (Pleas* tick)
Chicken and fish, (include all fish except fried) AT HOME ATW0RKNever . 0 1 O 1Less than once a week................ ..................................... P 2........ . O 21-3 times a week...................................................... 0 O s4-6 times a week ................................... .......... O 4...... P 4
Once a day............................................................... O s................. O sMore than once a day ........... ....................... P «................... . P #
Red meat - beef, pork, lamb ATHOME AT WORKNever.............................. ....................................... 0 1.....................O tLess than once a week..................................................... P 2 ............... ....... D 21-3 times a week...................................................... D s.........................P 1
4-6 times a week .......................................... O 4.........................O#Once a day.............................................................. O s ....... .........O sMore than once a day................. ............................. 0 « ..... P «

4.
Tick both at home and at work boxes
Processed meats (sausages, burgers, pies, AT HOME AT WORKpork pie, luncheon meat)Never........................................................... .............. □ , ..................................□ .Less than once a week...................................1-3 times a week.......................................... ................ □ , ................... ...................□ ,4-6 times a week.......................................... ,...........n * ............. ....................□ .Once a day.................................................. ................ □ « .................. ....................□ ,More than once a day................................... ................ □ . ..............
9. Baked beans or pulses (e.g. dahl, lentils, soya products, red kidneybeans) AT HOME AT WORKNever...................................................................... O 1........................ G iLess than once a week.............................................. D 2........................ G 21-3 times a week................... ..................................□ » ........ .................. □ ,4-6 times a week...................................................... D 4........................ D 4Once a day.............................................................. D s........................ O sMore than once a day............................................... G •........................ Q •
10. Hard cheese (Including Cheddar, RedLeicester, Stilton, blue cheese) AT HOME AT WORKNever...................................................................... G 1........................ Q 1
Less than once a week.............................................. Q 2........................Q 21-3 times a week...................................................... G 3........................G 34-6 times a week...................................................... O 4 ...............O 4
Once a day.............................................................. G s........................Q sMore than once a day............................................... G *........................Q «
11. Reduced fat cheese e.g. cottage cheese,low fat Cheddar, low fat cheese spreads AT HOME AT WORKNever ............................................................... G 1........................ G 1
Less than once a week................ ,...............□ * ........................1-3 times a week Q 3..........................G 34-6 times a week........................................................ G .4..........................G 4Once a day................................................................ Q .s..........................G sMore than once a day................................................. G .6..........................Q «

Tick both at home and
Bread, chapattis, rice, pasta or potatoes at work boxes(not including fried varieties) AT HOME AT WORKNever........................................................................ □ .i...... ................P iLess than once a week.............................................. □ ̂ ...................... ., P 21-3 times a week........................................................ P 3........... D t4-6 times a week........................................................ P 4.......................P 4
Once a day................................................................. □ .s........................□ sMore than once a day.................................. □«.......
Fruit (fresh, stewed, unsweetened tinned) AT HOME AT WORKNever .................................................................. □ .1.............. P 1
Less than once a week ............................................ □ .2........................□ 21-3 times a week P 3............P 34-6 times a week........................................................ □ .4........................P 4Once a day ............................................................ □ .s..................... P sMore than once a day......................................... □ .6................ P 4
Vegetables (fresh, frozen, tinned, salad) AT HOME AT WORKNever........................................................................ □ .1........................ P 1
Less than once a week................................................ P 2.................. . . . .O 2
1-3 times a week ......................................... P 3.......... ...........P 3
4-6 times a week........................................................ D .4..................... P 4Once a day................................................................. D .s...................... O sMore than once a day .. D .6.................... P 6
Sweets or chocolate e.g. packet of sweets/bar ofchocolate or Indian sweets (e.g. Burfi) AT HOME AT WORKNever......................................................... P i .... . . .O tLess than once a week............................................... G 2........... ......... P 31-3 times a week............................................................... P 3.......... .......... . Q 34-6 times a week .................................................. P 4....... ......... P 4Once a day............................................................... P s ................ .......PsMore than once a day............................................... D 6........................ P «
Puddings, e.g. fruit pies AT HOME AT WORKNeva:................................ ............................ P 1................. P *Less than once a week.............................................. P 2................ P 21-3 times a week...................................................... P 3....... ..............D 34-6 times a week .............. ................................... □ « ........... :...........□ «Once a day............................................................... P *................. P *More than once a day.............................................. P «........................P «

6.Tick both at home and at work boxes
17. Sweet biscuits and/or cakes AT HOME AT WORKNever....................................................................... G .i......................... G tLess than once a week............................................... G .2......................... G 21-3 times a week G s......................... G s4-6 times a week........................................................ G .4......................... G 4Once a day................................................................ G .s......................... G sMore than once a day................................................. G .4......................... O <
18. Crisps or other fried snack, e.g.samosa, Bombay mix, bhqjis, peanuts AT HOME AT WORKNever..................................................................... G 1.........................Q tLess than once a week.............................................. O 2........................O 2
1-3 times a week .................................................. G s.........................G s4-6 times a week...................................................... G 4.........................G 4Once a day ................................................. G s.........................G sMore than once a day.............................................. G «.........................G •
19. Any fried food (except crisps), e.g. chips, friedfish, fried breakfast, roast potatoes AT HOME AT WORKNever...................................................................... G «...................... . . G iLess than once a week.............................................. G 2........................ G 21-3 times a week...................................................... G s........................ G s4-6 times a week...................................................... Q ........................ G 4Once a day.............................................................. G 5........................ G sMore than once a day............................................... G «........................G i
20. Low calorie/sugar free drinks e.g. 'Diet Coke/Pepsi, low calorie squash AT HOME AT WORKNever................................... .................................. G 1......................... G 1
Less than once a week.............................................. G 2 G 21-3 times a week...................................................... G s G s4-6 times a week...................................................... G 4 G 4Once a day.............................................................. G s G sMore than once a day............................................... O * G «
21. Sugary drinks - fizzy pop/squash AT HOME AT WORKNever...................................................................... G i......................... G .Less than once a week.............................................. O 2..................... . . .O 2
1-3 times a week...................................................... G 2 G s4-6 times a week...................................................... Q ........................ G 4Once a day.............................................................. G s.........................G sMore than once a day............................................... G § G *

Overall, are you generally eating the following foods, more, less or than you did 6 mouths ago?
Please tkk *0 1 0 1 0% ‘less* or ‘same*
column
Chicken and fish (not fried)more ■ Wmmi ■■ mme
Red meat - beef, pork, lamb
Processed meats (sausages, burgers, pies, pork pie, luncheon meat)
Baked beans or pulses (e.g. dahl, lentils, soya products, red kidney beans)
•
Hard cheese (including cheddar, Red Leicester, Stilton, blue cheese)
Reduced fid cheese (e.g. cottage cheese, low fid cheddar/low fid cheese spread)
I Bread, chapattis, rice, pasta, potatoes
I Fruit (fresh, stewed, unsweetened tinned)
Vegetables (fresh, frozen, tinned, salad)
Sweets or chocolate
Puddings e.g. fruit pies
Sweet biscuits and/or cakes
Crisps or other fried snack
Any fried food (except crisps) e.g. chips, fried fish, fried breakfast, roast potatoes
' ■ ,
Low calorie/sugar free drinks e.g. Diet Coke/Pepsi, low calorie squash
Sugary drinks - fizzy pop/squash

PART 2
The following questions ask about how you rate your own diet for ‘healthiness* and about what changes you may have made, or may make, to the way you eat.
1. In your opinion, how high in fat is your overall diet? (please circle)
1 2 3 4 5very high high average low very low
----------------------- j ---------------------- ------------j -----------
GO TO QUESTION 2 For how long have you followed adiet low in fat? weeks months years
GO TO QUESTION 3
2. a) Have you tried to make any changes to lower the fat in your diet in the last 3 months? (please circle)
YES i NOo
If yes, how successful were you at making these changes? (please circle)
1 2 3 4 5Extremely Fairly Don't Fairly Notsuccessful successful know unsuccessful successful
b) Over the next 3 months, do you plan to cut down on fat? (please circle)
1 2 3 4 5Definitely Possibly Don't Probably Definitely
yes know not not
3. In your opinion, how high in fibre is your overall diet? (please circle)
1 2 3 4 5very high high average low very low
I I
For how long have you followed a GO TO QUESTION 4diet high in fibre? weeks months years
t
GO TO QUESTION 5

9.
4. a) Have you tried to make any changes to increase the fibre in your diet in the last3 months? (please circle)
YES i NOo
If yes, how successful were you at making these changes? (please circle)
1 2 3 4 5Extremely Fairly Don't Fairly Notsuccessful successful r know unsuccessful successful
b) Over the next 3 months, do you plan to eat more fibre? (please circle)
1 2 3 4 5Definitely Possibly Don’t know Probably Definitely
yes not not
5. In your opinion, how high in sugar is your overall diet? (please circle)
1 2 3 4 5very high high average low very low
------------------- 1------------------- --------- r —
GO TO QUESTION 6 For how long have you followed adiet low in sugar? weeks months years
GO TO PART 3 (overleaf)
6. a) Have you tried to make any changes to decrease the amount of sugar in your dietin the last 3 months? (please circle)
YES i NOo
If ‘yes', how successful were you at making these changes? (please circle)
1 2 3 4 5Extremely Fairly Don't Fairly Notsuccessful successful know unsuccessful successful
b) Over the next 3 months, do you plan to eat less sugar? (please circle)
1 2 3 4 5Definitely Possibly Don’t Probably Definitely
yes know not not

10.PART 3
This part is about what influences the food you choose.
Please circle the answer that is closest to yours, indicating how you feel about the statement.
e.g. 1 2 3 4 5strongly agree don’t disagree strongly
agree know disagree
Eating a lot of fruits and vegetables decreases my chances of developing heart disease.
1stronglyagree
2 3 4 5stronglydisagree
Fating a lot of fried foods increases my chances of developing heart disease.
1stronglyagree
2 3 4 5stronglydisagree
It is important that healthy food choices are available at work.
1stronglyagree
2 3 4 5 strongly disagree
I find that there are a lot of conflicting messages around concerning a healthy diet.
1stronglyagree
2 3 4 5stronglydisagree
What I eat is one of foe most important things for my health.
1stronglyagree
2 3 4 5stronglydisagree
The available information on healthy eating is easy toupHffptanH
1stronglyagree
2 3 4 5stronglydisagree
There is a kit of information on healthy eating where I work.
1stronglyagree
2 3 4 5stronglydisagree
At my workplace it is easy to eat a healthy diet. 1stronglyagree
2 ; 3 4 5strongly
— - - disagree
Healthy foods taste good 1stronglyagree
2 3 4 5stronglydbagree
At work, 1 tend to eat similar foods most days 1stronglyagree
2 3 4 5stronglydisagree
I need something quick to eat at work 1stronglyagree
2 3 4 5stronglydisagree
I fed confident that I know what foods I should be eating to have a healthy diet
1stronglyagree
2 3 4 5stronglydisagree
At work, foe cost of food influences what I eat 1stronglyagree
2 3 4 5stronglydisagree

r me, die way in which food is presented at work toeocci my food choice
1stronglyagree
2 3 4 5stronglydisagree
work, 1 choose foods to improve my mood 1stronglyagree
2 3 4 5stronglydisagree
md to have a healthy diet at work 1stronglyagree
2 3 4 5stronglydisagree
md to have a healthy diet at home 1stronglyagree
2 3 4 5stronglydisagree
it a lot of encouragement for eating a healthy diet nt my co-workers
1stronglyagree
2 3 4 Sstronglydisagree
St a lot of encouragement for eating a healthy diet m my dose friends and family
1stronglyagree
2 3 4 5stronglydisagree
Ing a healthy diet is very important to me 1stronglyagree
2 3 4 5stronglydisagree
home, the cost of food influences what I eat 1stronglyagree
2 3 4 5stronglydisagree
IT 4
part is about your knowledge of ‘healthy* eating. If you are not sure, please tick 'don't know'.
According to the latest health guidelines to improve die nation's health, should people generally eat more or less or the same of the following:- (Please tide one box per food)
Eat Eat Eat Don’tmore less same know
Fat............................................................................ □ □ □ □Sweets and chocolates................................................ D D D DSugar......................................................................... Q D □ DStarchy foods, e.g. bread, potatoes, rice, chapattis □ □ □ □Fruit and vegetables................................................... D D D GFried food............................................. □ □ D D

12.
2. If you were trying to choose more low fat foods, which foods in the following pairs would you sele because it was lower in fat?
(please tick one per pair)
(a) Shepherds pie and peas OR □Cornish pasty and roast potatoes □Don’t know □
(b) Cheese flan and salad OR □Tuna, bread roll and salad □Don’t know □
(c) Stewed apple and custard OR □Apple pie and custard □Don’t know □
3. If you were trying to choose more high fibre foods, which foods in the following pairs would yc select because it was higher in fibre?
(please tide one box per pair)
(a) Chilli con came and rice OR □Mince beef pie and chips □Don’t know □
(b) Baked beans and jacket potato OR □Coleslaw and jacket potato □Don’t know □
(c) Rhubarb crumble and custard OR □Jam tart and custard □Don’t know □
4. If you were trying to choose more low sugar foods, which foods in the following pairs would y< select because it was lower in sugar?
(please tick one box per pair)
(a) Pear OR □Muesli bar □Don’t know □
<b) Diet coke OR □Milkshake □Don’t know □

13.
nr 5 ABOUT THE HEARTBEAT AWARD
Did you know that your workplace has now received the Heartbeat Award? (please tick)Yes □ ) No Do
Have you noticed any of the following in the canteen to promote the Heartbeat Award scheme? (Please tick as many boxes as apply):-
(a) Symbol highlighting healthy choice on menu G 1
(b) Posters G 2
(c) Leaflets D 3
(d) Cards on tables D 4
(e) Drinkmats Gs
How many days a week do you choose the highlighted healthy meal? (please tick)
5 or more days 3-4 days 1-2 days Never/rarely□ □ G G3 2 1 0
Do you find the highlighting of healthy choices:- (please tick)
(a) Very useful G 1
(b) Useful G2(c) Not useful G 3
Any other comments?...................................................................
In your opinion, has your diet changed as a result of the Heartbeat Award__introduced to your workplace? (Please tide the response which is closest to your opinion)
AT WORK AT HOME(a) Yes, my diet is a lot healthier......................................G i............ Q r(b) My diet is slightly healthier.......................................... O 2 ............ D 2(c) I do not think my diet has changed because I already
follow a healthy diet.................................................. O 3 ............ Q 3(d) I do not think my diet has changed because I am not
concerned about healthy eating................................... O 4 .......... Q 4(e) I think my diet is less healthy now.............................. G s.......... Q 5(f) Any other reason (please write)

14.
6. Would you find any of the following useful at work? Please tick any you agree with:
(a) Slimming group □ 1(b) Diet and exercise group Eh(c) Calorie content of foods displayed in canteen Da(d) Other ideas (please write)...................................................................................
PART 6
INFORMATION ABOUT YOU
All of this information is confidential Tick one box only
1. I WORK:- FULLTIME □ PART TIME □ Average No. of days2 i worked per week
2. MY WEIGHT IS ............stones ................pounds
MY HEIGHT IS ............ feet ................ inches
3. I AM CURRENTLY TRYING TO LOSE WEIGHT
YES □ i NO □ o
If ‘yes’; Do you follow a healthy diet because you are trying to lose weight?
YES D i NO d o
If you have any further comments that you think might be helpful to us, please write them below.
V U A X IX T V A T T D A D V A T T D D T T 1» It ...

Appendix 3.6
15th April 1994.
Ms Angela Buntin, Personnel Department, Carlin factory,Fir Tree Lane, Leicestershire.
Dear Ms Buntin,
I am currently working on a research project at Leicester University with Leicestershire Nutrition and Dietetic Service to assess if the local Heartbeat Award Scheme is effective in improving eating habits of employees.
Your workplace has been identified as appropriate for this study by the Community Dietitian working with you.
Participation in the project would involve the following:-
1. I would assess the eating habits of employees on 2 occasions - prior to receiving the Heartbeat award and 6 months after receiving the award. I would attend at lunchtime and ask your employees if they will complete a questionnaire on eating habits. I would need to identify those who do not use the canteen on the day I attend, so that I can send them a copy of the questionnaire to complete.
2. I would need to interview the catering manager to obtain his/her views about the award and to collect information on changes in food availability.
Five workplaces in Leicestershire will be taking part in the research project. The results will be used to improve nutrition programmes in the workplace in Leicestershire. I would also provide you with feedback on the effectiveness of the award in your workplace in changing eating habits.
I hope you are able to participate and look forward to your reply.
Yours sincerely,
MICHELLE HOLDSWORTH

Appendix 3.7
7th O ctober 1994.
Dear Employee,
I am carrying out a research project with Leicester University investigating eating habits at work! In order to collect the information I require for my research, I would be very grateful if you could complete the enclosed food questionnaire, and return it to me in the internal post, in the envelope provided. All the information is completely confidential and individual responses will not be identified. It should take you only 10-15 minutes to fill in the questionnaire.
Your participation in the study is greatly appreciated. You will be sent a follow up questionnaire in 6 months time. The results of the survey will be very useful in helping us evaluate nutrition programmes in the workplace and improve them in the future. There are 5 workplaces in Leicestershire which have agreed to participate in this 'Food at Work' study.
If you have already returned a completed questionnaire, please ignore this letter.
Many thanks for your co-operation,
Yours sincerely,
M ICH ELLE H O LD SW O R T H

Appendix 3.8
8th D ecem ber 1994.
Dear Employee,
You may remember that I wrote to you in October enclosing a food questionnaire. Although a large number of questionnaires have been returned, I would ideally like as many of the staff working at the site to complete and return the questionnaire, to ensure the validity of the study.
I have therefore enclosed another copy of the questionnaire with this letter, which I would be very grateful if you could complete and return to me in the internal post, in the envelope provided. It should take you only 10-15 minutes to fill in. We need your name so that we can send you a further questionnaire in about 6 months time, all information will be treated as confidential.
Your participation in the study is greatly appreciated. The results of the survey will be very useful in helping us evaluate nutrition programmes in the workplace and improve them in the future.
Many thanks for your co-operation,
Yours sincerely,
Michelle Holdsworth

Appendix 3.9
15th M ay 1995
Dear Employee,
You may remember completing a questionnaire on food issues within the last few months, which was very useful for our 'Food at Work' study. In order to collect the information I require for my research, I would be grateful if you could complete a further food questionnaire, and return it to me in the prepaid envelope provided.
In addition to asking you about the food you eat and what influences your choices, we are also interested in your views about the Heartbeat Award scheme that was introduced into your workplace.
All the information is completely confidential and individual responses will not be identified. It should take you only 10-15 minutes to fill in the questionnaire. The questionnaire is being sent to all staff who completed the first one.
Your participation in the study is greatly appreciated. The results of the survey will be very useful in helping us evaluate nutrition programmes in the workplace and improve them in the future.
If you would like further information, you can contact me on (0116) 2585265 or (0116) 2525418.
Many thanks for your co-operation,
Yours sincerely,
M ICH ELLE H O LD SW O R T H

Appendix 3.10
VIEWS ON THE HBA FROM CATERER AFTER IMPLEMENTATION:-
BACKGROUND INFORMATION:-
1. How long have you had your HBA?
2. What meals are provided- breakfast-lunch-evening meal-snacks
3. What is the average number of meals served daily?
4. How long is the menu cycle?
S. Have there been any changes in uptake of meals/foods?
More ED Less Q No Change CD
Healthy food choices whole milk sold in cartons
•»? *-%,
semi-skimmed milk sold in cartonsbutterpatsmarg portionslow fat spread portionshigh fibre breadwhite breadhigh fibre bread sandwicheswhite bread sandwichesvegetablessaladsmeat disheschicken dishesfish dishesegg dishesvegetarian dishesboiled potatoes, including jacketchipsricepasta dishes baked beans fruithealthy puddings low fat yogurts sugary drinks low sugar drinks chocolate/sweets healthy snack alternatives

6. What methods do you use to promote the choices?
* special symbols on menu* special section on menu* descriptive copy promotes items* statement on menu encourages special requests* food server informs customer* none ♦other
7. Approximate percentage of total sales of healthy choices
0- 10%
11- 20%
21-30%21-40%41-50%51-60%61-70%71-80%81-90%91-100%

LEICESTERSHIRE NUTRITION AND DIETETIC SERVICE APPendlx 311
HEARTBEAT AWARD - CHECKLIST
Name of Establishment:
Contact person: ..........
CommunityDietitian:.................... ..........
Date of first assessment:
Date of second assessment:
Date of subsequent assessments:
Meal Service provided:-
Vending Yes □ No D
Buffet Yes □ No D
Breakfast Yes □ No D
Lunch Y esD No D
Evening Meal Yes □ No D
Breaktime snacks Y esD No D
Menu cycle length ..............................................
Type of establishmentif workplace ..............................................
No. of employees in workplace .........................
Contract Caterers ? Yes □ No □

- 2 -
General 1st 2nd Renewalvisit visit
(1) TYPE OF MILK
a) Low fat milk is available for drinks. □ □ □
Full fat milk only is available for drinks. □ □ □
b) Cartons of milk sold to customers are full fat only. □ □ □
Low fat milk is sold in cartons to customers. □ D □
(2) TYPE OF FAT
a) A polyunsaturated fat is used in all cooking. □ □ □
A combination of polyunsaturated and saturated fat is used in cooking. □ □ □
A saturated fat is used in cooking □ □ □
A blended vegetable oil □ □ □

- 3 -
b) A polyunsaturated fat is used for spreading.
A low fat spread is used for spreading.
Butter/saturated vegetable fat is used for spreading.
1st 2nd Renewalvisit visit
□ □ □
□ □ □
□ □ □
c) Fat is spread thinly. □ □ □
Fat is spread medium thickness □ □ □
Fat is spread thickly. □ □ □
d) A choice of butter and/or PUFA margarine and low fatspread is available for customers in portions. G □ □
Butter and/or margarine (PUFA) only are availablein portions. □ □ □
Only low fat spread is available. □ □ □

- 4 -lst 2nd Renewal
visit visit
(3) TYPE OF BREAD
Wholemeal/granary bread is available always for □ □ □sandwiches/rolls.
Only white bread is available for sandwiches/rolls. □ □ □
There is a limited choice of sandwiches/rolls in high G O Ofibre bread, but full choice in white bread.
(4) TYPE OF SAUCE
a) *A11 white/cheese sauces are made using the rouxmethod. O O O
- *<-* t* .
*A11 white/cheese sauces are made using thecornflour blended method. O □ G
* Only proposed ‘healthy choices’ are made with a low fat cornflour sauce. G G G
b) * Sauces are made with low fat milk.
* Sauces are made with full fat milk.
G G G
G G G

- 5 -
(5) TYPE OF CHEESE
1st 2nd Renewalvisit visit
* A reduced fat hard cheese is used in all dishes whichare/will be highlighted as healthy, or a maximum of G G Gloz of hard cheese/portion.
* A reduced fat hard cheese is used in all dishes. G O O
* Only full fat hard cheese is used in cooking. D D □
(6) VEGETABLES/SALAD
a) Fat is never added to cooked vegetables. □ □ □
Fat is occasionally added to cooked vegetables. □ □ □
Fat is always added to cooked vegetables. □ □ □
b) Mayonnaise/oil dressing is added to all salads. O G O
Mayonnaise/oil dressing is never added to salads at G G Gpoint of choice.
At least 'fa of salads are mayonnaise/oil dressing free. G G G
Mayonnaise/oil dressing is added to more than !fa ofsalads. Q G Q

- 6 -
1st 2nd Renewalvisit visit
(7) MEAT TYPE - for ‘healthy choices only’
a) * Dry Fry mince/stewing steak i.e. no added fat. □ □ □
* Meat/mince is ‘browned off’ in fat before cooking. □ □ □
b) *There are clear specifications for meat suppliers □ D □ about the fat content and quality of mince/meats.
*There are no clear specifications for meat suppliers □ □ □about the fat content and quality of mince/meats.
d) * Meat is trimmed of visible fat before cooking. D D Dt*.
* Meat is sometimes trimmed of visible D D Dbefore cooking.
d) * Skin is removed from poultry.
* Skin is not removed from poultry.
□ □ □□ □ □

- 7 -1st 2nd Renewal
visit visite) Lean meat portion sizes to be/are labelled as healthy □ □ □
are no more than 6-8oz raw.
f) * Gravy is made using meat fat. □ □ □
* Gravy is made without meat fat. □ □ □
(8) FISH - for ‘healthy options’
* Tinned fish is always in brine/tomato sauce/water. □ □ □
* Tinned fish is always in oil. □ n □
* Tinned fish is in a mixture of the above. □ □ □
(9) EGGS - for ’healthy options’
* Egg dishes are made with a minimum of fat - with a □ □ Gmaximum of 2 eggs per portion.
* Egg dishes are made with a minimum of fat, with more G □ Qthan 2 eggs per portion.
* Egg dishes are made with too much fat. G G G

- 8
(10) VEGETABLE DISHES - ‘healthy options’
1st 2nd Renewalvisit visit
* At least V3 of vegetarian dishes are healthy choicesi.e. no more than loz hard cheese, 2oz V2 fat cheese CD CD CDor loz nuts per serving.
* Less than V3 of vegetarian dishes are healthy choices. D CD CD
(11) POTATOES
* Potatoes without marg/butter are available every day CD CD . CDe.g. boiled/mashed (no fat) jacket.
* Potatoes without marg/butter are available 2-3 times a week. CD CD CD
* Potatoes without marg/butter are never available. CD CD CD
(12) RICE/PASTA/CHAPATTI
a) * Rice/pasta/chapatti are served without added fat. CD □ □
* Rice/pasta/chapatti are served with added fat. CD □ □

- 9 -1st 2nd Renewal
visit visit
b) * Only white varieties are available. □ □ □
* Only wholemeal varieties are available. □ □ □
* A mixture of wholemeal/white varietiesare available. □ □ □
(13) FLOUR IN BAKING
At least 25% wholemeal flour is used in baked products Gto be/are highlighted as healthy.
Less than 25 % wholemeal flour is used in baked products Gto be/are highlighted as healthy.
(14) USE OF PULSES
* Pulses are often used in a variety of dishes G Qe.g. once a week or more.
* Pulses are occasionally used/available G Ge.g. once a fortnight.
* Pulses are only very occasionally used/available Q Ge.g. once every 3-4 weeks or less.
G
G
G
G G
G G

- 1 0 -lst 2nd Renewal
visit visit(15) JACKET POTATO FILLINGS
* At least Vs of fillings are low in fat (without mayonnaise). EH O CD
* Less than Vs of fillings are low in fat. D □ □
(16) SANDWICH FILLINGS
* At least Vs of fillings are low in fat (without mayonnaise). D D D
* Less than Vs of fillings are low in fat. D □ □
(17) PUDDINGS
* Fresh fruit is always available.
* Fresh fruit is not always available.
* At least Vs of puddings are Wealthy choices’.
* Less than Vs of puddings are ‘healthy choices’.
Low fat/sugar yogurts are always available.
Low fat/sugar yogurts are not always available.
□ □ □□ □ □□ □ □□ □ □□ □ □□ □ □

- 1 1 -
(18) DRINKS
* Unsweetened fruit juice, sugar free squashes or fizzy drinks mineral water are always available.
* Only sugary drinks are available.
1st 2nd Renewalvisit visit
□ □ □
□ □ □
(19) SNACK ITEMS
* ‘Healthy’ alternatives are available for ‘at least Va of choices e.g. teacakes; scones; malt loaf; fruit bars;dried fruit and nuts. D D □
* Healthy alternatives are not available for atleast Va of choices. □ □ □
ANY OTHER COMMENTS

- 12 -
FOR THE SECOND CONTACT
PROMOTION/MARKETING
(1) Is there Vz healthy choices available in D yeseach section of the menu? D no
(2) Are the healthy choices highlighted on the menu? □ yesD no
(3) Is there additional supporting information for employees □ yese.g. leaflets, recipe ideas, posters? D no

Appendix 3.12
VIEWS OF THE CATERER AFTER RECEIVING THE HBA- qualitative questions
1. What do you think of the organisation of the HBA? How could this be improved?
2. What do you think of the resources/ support offered in implementing healthy food choices?
3. What do you think of the time-scale from showing an interest in receiving the award to actual receipt? how long did this take for your work places?
4. What were the easiest changes to make?
5. What were the hardest changes to make? also, what were the main obstacles you had to overcome to receive the award?
6. What comments do you get from staff? Have these changed over time?
7. What do you consider to be the largest influences on food choice of your customers?
7. Do you have management support for this initiative?
'«-* t*.
8. Do you have occupational health support for this initiative?
9. How successful do you think the award is in improving eating habits? Are there anynotable differences in parts of the workforce? (sex,age,job type/status)
10. Do you consider yourself and your staff to be up to date on healthy catering practice?
11. Would you have found a healthy eating training session useful? if so, at what stage?
12. In your view is it your responsibility to promote healthy choices to your customers?
13. Has the HBA increased your costs at all?
14. Do you feel the HBA is valuable and why (to yes and no)?

15. Has the HBA affected the no. of clients you have? or the type of clients?
16. Do you think the HBA has affected what people buy?
17. Are the healthy eating criteria for the HBA realistic?

Appendix 3.13
FOOD SURVEY
This survey contains questions about eating out - the food you choose and what influences these choices.
We are also interested in your views about the provision of healthy food in public eating places.
All the information is anonymous and will only be used for the purposes of this research.
Please place completed questionnaire in the box, as you leave.
Thank you.
Leicestershire Nutrition & Dietetic Service and Department of Epidemiology and Public Health, Leicester University.

1. How often do you eat out? (please tick)
2. Which meal do you usually go out for? (please tick)
Breakfast D l Lunch D 2 Afternoon tea D 3 Evening meal G 4
3. Did you know that this establishment has received the Heartbeat Award?(please tick)
Yes □ l No □ 2
4. What criteria do restaurants need to meet to be given a Heartbeat Award?(please tick those which apply)
a) Have 1A of seating as non-smoking ................................ D lb) Have 1A of meals as healthy choices .............................. G 2c) Follow food hygiene guidelines ..................................... G 3d) Have whole menu assessed by a dietitian .................... G 4e) Have all the food as healthier choices........................... G sf) Don’t know ......................................................................... 0 6
5. Did you choose this restaurant because it has a Heartbeat Award? (please tick)
Yes G l No G o

In your opinion, does this eating place allow you to choose healthy meals and snacks? (please tick)
Yes D l No CD o Don’t know CD 2
What influences your choice of eating place? (Please tick)
a) Quality o f the food ........................................... □ lb) Affordable prices ............................. D 2
c) Location...................................................... □ 3
d) Availability o f healthy choices............... D 4e) Good service............................................ □ 5
f) Variety of choice..................................... □ 6g ) Other (please specify)................ □ 7
How do you feel the prices of healthy choices compare to prices of other choices?(please tick)
More expensive CD 1
Less expensive CD 2About the same ED 3Don’t know CD 4
What did you choose today? (Please write)
What were the major influences on your choice of this meal? (please write)

11. In your opinion, how high in fat is your diet? (please tick)
Very High □ l High □ 2 Average □ 3 Low □ 4 Very Low □ 5
12. In your opinion, how high in fibre is your diet? (please tick)
Very High □ l High □ 2 Average D 3 Low □ 4 Very Low □ 5
13. In your opinion, how high in sugar is in your diet? (please tick)
Very High D l High D 2 Average D 3 Low □ 4 Very Low D 5
14. Please circle the answer that is closest to yours, indicating how you feel about the statement.
1 It is important that healthy food I choices are available when eating out.
1 2 strongly
agree
3 4 5stronglydisagree
Healthy food tastes good. 1 2 strongly
agree
3 4 5stronglydisagree
I I know what I should be eating to I have a healthy diet.
1 2 strongly
agree
3 4 5stronglydisagree
I eat healthily at home. 1 2 strongly
agree
3 4 5stronglydisagree
Eating a healthy diet is very important to me.
1 2 strongly
agree
3 4 5stronglydisagree

15. According to the latest guidelines to improve the nation’s health, should people generally eat more or less or the same of the following (Please tick one box per food)
Eat Eat Eat Don’tmore less same know
Fat................................ G □ □ □Sweets and chocolates □ □ □ □Sugar........................... □ □ □ □Starchy foods*........... □ □ □ □Fruit and vegetables... □ □ □ □Fried foods................. □ □ □ □
i 2 3 4* e.g. bread,potatoes, rice.chapatds.
16. Are you currently employed? Yes □ l No G o
17. If Yes, what is your occupation? (please describe fully)
18. What is your age?
19. Are you: Male O l Female O 2
Chinese D 7Bangledeshi G 8Other G(please specify)
20. Please describe your ethnic origin, are you:-
White Q l Black African G 4Indian Q 2 Black Caribbean G 5Pakistani Q 3 Black other Q 6
I do not wish to indicate by ethnic origin G 9

21. Do you:
Live alone □ 1With your partner D 2Other D 3
22. I am currently trying to lose weight.
Yes Ch No D o
23. My weight is ............... stones pounds
My height is feet inches
THANK YOU FOR YOUR HELP.
MH2 fbodsurv Oct 9S


Appendix 3.14
VIEWS OF COMMUNITY DIETITIANS ON THE HBA- focus group questions
1. What do you think of the organisation of the HBA? How could this be improved?
2. What do you think of the resources/support offered in implementing healthy food choices?
3. What do you think of the time-scale for HBA applicants? how long does this usually take?
4. What do you find are the easiest changes for caterers to make?
5. What do you find are the hardest changes to make? also, in general what are the main obstacles for caterers to receive the award?
6. How successful do you think the award is in improving eating habits?
7. Do you think that caterers should be trained in healthy eating practice?
8. Do you feel the HBA is valuable and why?
9. Do you think it is an effective use of your time?
10. How do you think it could be improved?
11. Do you think that a dietitian needs to be involved?
12. Can you see a role for the HBA without dietitians?
13. Are the criteria for the HBA realistic?
14. How do you think the issue of monitoring should be tackled?
15. In your experience what factors influence whether an establishment is successful in achieving and sustaining the HBA scheme?
16. Do you have any concerns about the HBA scheme?
17. What format would be your ideal 'Heartbeat Award' scheme?

Appendix 3.15
VIEWS OF COMMUNITY DIETITIANS ON THE HBA- individual interviews
1. What do you think of the time-scale for HBA applicants? how long did this take?
2. What were the easiest changes for the caterer to make?
3. What do you find were the hardest changes to make? also, what were the main obstacles for the caterer to receive the award?
4. How successful do you think the award has been in improving eating habits in the establishment?
5. Were the HBA criteria realistic for the establishment?
6. What factors influenced whether the establishment was successful in achieving andsustaining the HBA scheme?
7. Do you think that the caterer needed training in healthy eating practice?
8. Do you feel the HBA is valuable in the establishment and why?
9. Do you think the resources/support you were able to offer in implementing healthy food choices were adequate?
10. Do you think it was an effective use of your time?
11. Do you think the HBA assessment you did could have been done by someone else?
12. Do you have any concerns about monitoring? How do you think the issue of monitoring should be tackled?
13. Do you have any concerns about the HBA scheme in the establishment?
14. What format would be your ideal 'Heartbeat Award' scheme?
15. How do you think the current scheme could be improved?

BIBLIOGRAPHY
Albright, C.L., Flora, J.A. and Fortmann, S.P. (1990) Restaurant menu labelling: impact of nutrition information on entree sales and patron attitudes. Health Education Quarterly. 17, 157-167.
Almanza, B.A. (1995) Consumer preferences among nutrition labeling formats in a restaurant. Journal o f the American Dietetic Association. 95, 83-85.
Almanza, B.A., Nelson, D. and Chai, S. (1997) Obstacles to nutrition labeling in restaurants. Journal o f the American Dietetic Association. 97, 157-161.
American Dietetic Association/US Public Health service (1993) Worksite nutrition- A guide to planning, implementation and evaluation. 2nd edition. Chicago, The American Dietetic Association.
Anderson, A.S. (1993) An overview of diet survey methodology. British Food Journal. 97, 22-26.
Anderson, A.S., Campbell, D. and Shepherd, R (1993) Nutrition knowledge, attitude to healthier eating and dietary intake in pregnant compared to non-pregnant women. Journal of Human Nutrition and Dietetics. 6, 335-353.
Bandura, A. (1977) Social Learning Theory. Englewood Cliffs, N.J., Prentice-Hall.
Barker, M.E., Thompson, K.A. and McClean, S.I. (1995) Attitudinal dimensions of food choice and nutrient intake. British Journal o f Nutrition. 74, 649-659.
Baxter, P. (1993) Heartbeat Award Monitoring report. London, HEA.
Beaton, G.H. (1994) Approaches to analysis of dietary data: relationship between planned analyses and choice of methodology. American Journal o f Clinical Nutrition. 59, 253-261.
Bergman, E.A., Boyungs, J.C. and Erickson, M.L. (1990) Comparison of a food frequency questionnaire and a 3 day diet record. Journal of the American Dietetic Association. 90, 1431-1433.
Bland, M. (1996) An introduction to Medical Statistics. 2nd edition. Oxford, Oxford University Press.
Bolton-Smith C., Smith, W.C., Woodward, M. and Tunstall-Pedoe, H. (1991) Nutrient intakes of different social class groups: results from the Scottish Heart Health Study. British Journal o f Nutrition. 65, 321-335.
Boonekamp, G.M.M., Vaandrager, H.W., Koelen, M.A. and Kennedy-Haynes, L. (1995) Travelling Through Health Promotion Land. Wageningen, Agriculural University de Leewenworch.
Breakwell, G.M., Hammond, S., and Fife-Shaw, C. (1995) Research Methods in Psychology. London, Sage Publications.
157

Brug, J. van Assema, Kok, G.J., Lenderink, T., Glanz, K. et al., (1994) Self-rated dietary fat intake: Association with objective assessment of fat, psychosocial factors and intention to change. Journal of Nutrition Education. 26, 218-223.
Cameron, W.E. and van Staveren, W.A. (1988) Manual on Methodology for Food Consumption Studies. Oxford, Oxford University Press.
Candeias, N.M.F. (1991) Evaluating the quality of health education programmes. Hygie. x(2), 40-45
Carlson, E., and Kipps, M. (1988) What do caterers know about nutrition? Nutrition and Food Science. Jan/Feb, 10-11.
Cassidy, C. (1994) Walk a mile in my shoes: culturally sensitive food-habit research. American Journal of Clinical Nutrition. 59, 190-197.
Catford, J. (1993) Auditing health promotion: What are the vital signs of quality? Health Promotion. 8, 67-68.
Cincirpini, P.M. (1984) Changing food selections in a public cafeteria. Behaviour Modification. 8, 520-539.
Clapham, M. (1992) Aspects of data collection in large employers. In Promotion of Healthier Eating. How to collect and use information for planning, monitoring and evaluation. Ed: Kemm, K.R. and Booth, D. p226-228. London, HMSO.
Cockshott, Z. and Daykin, N. (1996) Workplace health: let’s focus on the low paid. Healthlines. May, 10.
Colby, J.J., Elder, J.P., Peterson. G., Knisley, P.M. and Carleton, R.A. (1987) Promoting the selection of healthy food through menu item description in a family style restaurant. American Journal o f Preventative Medicine. 3, 171-176.
Cole, T.J. (1997) Sampling, study size and power. In Design Concepts in Nutritional Epidemiology. Ed: Margetts, B.M. and Nelson, M., p 64-86. 2nd edition. Oxford, Oxford University Press.
Cole-Hamilton, I. (1986) Star Rated Menus. London, The London Food Commission.
Contento, I. and Maksymowicz-Murphy, B. (1990) Psycho-social factors differentiating people who reported making desirable changes in their diets from those who did not. Journal of Nutrition Education. 22, 6-14.
Contento, I., Balch, G.I., Bronner, Y.L., Lytle, L.A., Maloney, S.K., Olson, C.M. et al, (1995) The effectiveness of Nutrition Education and implications for Nutrition Education Policy, Programs and Research: A review of research. Journal of Nutrition Education (special issue). 27, 279-418.
Coronary Prevention Group (1990) Nutrition Banding: A scientific system for labelling the nutrient content of foods. London, Coronary Prevention Group.
Crawley, H (1988) Food Portion Sizes. 2nd edition. London, HMSO.
158

Crawford, D.A. and Baghurst, K.I. (1990) Diet and health: a national survey of beliefs, behaviours and barriers to change in the community. Australian Journal o f Nutrition and Dietetics. 47, 97-104.
Davenport, M., Roderick, P., Elliott, L., Victor, C. and Geissler, C. (1995) Monitoring dietary change in populations and the need for specific food targets; lessons from the North West Thames Regional Health Survey. Journal of Human Nutrition and Dietetics. 8, 119- 128.
Davis-Chervyn, D., Rogers, T. and Clark, M. (1985) Influencing food selection with point- of-choice nutrition information. Journal of Nutrition Education 17, 18-22.
Department of Health and Social Security (1984). Committee on Medical aspects of Food Policy: Diet and Cardiovascular disease. Report on Health and Social Subjects, 28. London, HMSO.
Department of Health and Social Security/Health Education Council (1986) Look After Your Heart campaign- notes on background, aims and objectives. London, HMSO.
Department of Health (1991) Dietary Reference Values for food energy and nutrients in the UK. Department of Health, London, HMSO.
Department of Health (1992) The Health o f The Nation- A strategy for health for England. Department of Health, London, HMSO.
Department of Health (1993) Key Area Handbook - Coronary Heart Disease and Stroke. Department of Health, London, HMSO.
Department of Health (1994a) Eat Well! An action plan from the Nutrition Task Force to achieve the Health of the Nation targets on diet and nutrition. Department of Health, London, HMSO.
Department of Health (1994b) Health Survey for England. Department of Health, London, HMSO.
Department of Health (1995) ABC o f Health Promotion in the Workplace. A resource pack for employers. The Health of the Nation. Department of Health, London. HMSO.
Department of Health (1996) Eat Well II! A progress report from the Nutrition Task Force on the action plan to achieve the Health of the Nation targets on diet and nutrition. Department of Health, London, HMSO.
Department of Health (1998) Our Healthier Nation Green paper- A contract for health. Department of Health, London, HMSO.
Dey, I. (1993) Qualitative Data Analysis. A user friendly guide for social scientists. London, Routledge Press.
Dhillon H.S. and Tolsma D.D. (1991) Meeting global health challenges: a position paper on health education. XIV World Conference on Health Education, Helsinki, Finland, June 16-21 .
159

Dobson, B; Beardsworth, A; Keil, T and Walker, R. (1994) Diet, choice and poverty: social, cultural and nutritional aspects o f food consumption in low income families. London, Family Policy Studies Centre.
Dowler, E. and Calvert, C. (1995) Nutrition and diet in lone parent families in London. London, Family Policy Studies Centre.
Downie, R.S. (1990) Health Promotion: models and values. Oxford, Oxford University Press.
Dubbert, P.M., Johnson, W.G., Schlundt, D.G. and Montague N.W. (1984) The influence of caloric information on cafeteria food choices. Journal of Applied Behavior Analysis. 17, 85- 92.
Dugdill, L. and Springett, J. (1994) Evaluation of workplace health promotion: a review. Health Education Journal. 53, 337-347.
Earless, A., Khan, H. and Parsons, A. (1996) Menu labelling for healthy eating. Hygiene and Nutrition in Foodservice and Catering. 1, 203-211.
Eck, L.H. and Willett, W.C. (1991) Considerations in modifying a semi quantitative food frequency questionnaire. Journal o f the American Dietetic Association. 91, 970-973.
Eck, L.H., Klesges, R.C., Hanson, C.L., Slawson, D., Portis, L. and Lavasque, M.E. (1991) Measuring short term dietary intake: development and testing of a 1-week food frequency questionnaire. Journal of the American Dietetic Association. 91, 940-945.
Edwards, P.K., Mullis, R.M. and Clarke, B. (1986) A comprehensive model for evaluating innovative nutrition education programs. Journal of Nutrition Education. 18, 10-15.
Ellis, S. (1995) The Heartbeat Award: findings from research into the needs of those managing the scheme. London, HEA.
Eves, A. Comey, M., Kipps., Noble, C., Lumbers, M. and Price, M. (1996) The nutritional implications of food choices from catering outlets. Nutrition and Food Science. 5, 26-29.
Ewles, L. and Simnett, I. (1992) Promoting Health: A practical guide. 2nd edition. Chichester, Wiley Press.
Feskanich, D., Rimm, E.B., Giovannucci, E.L., Colditz, G.A., Stampfer, M.J., Litin, L., et al., (1993) Reproducibility and validity of food intake measurements from a semiquantitative food frequency questionnaire. Journal of the American Dietetic Association. 93, 790-796.
Flegal, K.M. and Larkin, F.A. (1990) Partitioning macronutrient intake estimates from a food frequency questionnaire. American Journal o f Epidemiology. 131, 1046-1058.
Fraser, E., Bryce, C., Crosswaite, C., McCann, K. and Platt, S. (1995) Evaluating health promotion: doing it by numbers. Health Education Journal. 54, 214-225.
Garrow, J.S. (1983) Indices of adiposity. Nutrition Abstract Reviews. 53, 697-708.
160

Gibson, L. and Champion, P. (1989) Results of the 1986 Food Health Policy Survey. London, HEA.
Gibson, L. and Kallevik K, J. (1990). UK Study of District Health Authority and Health Board Food Health Policies. London, HEA.
Glanz, K. and Seewald-Klein, T. (1986). Nutrition at the worksite: an overview. Journal of Nutrition Education. 18, 1-12.
Glanz, K. and Mullis, R.M. (1988) Environmental interventions to promote healthy eating: a review of models, programs, and evidence. Health Education Quarterly. 15, 395-415.
Glanz K. and Eriksen, M.P. (1993). Individual and community models for dietary behavior change. Journal o f Nutrition Education. 25, 80-85.
Glanz, K., Kristal, A.R., Sorenson, G., Palambo, R., Heimendinger, J., Probart, C. (1993) Development and validation of measures of psychosocial factors influencing fat and fibre related dietary behavior. Preventive Medicine. 22, 373-387.
Glanz, K., Patterson, R.E., Kristal, A.R., DiClemente, C.C., Heimendinger, J., Linnan, L. et al., (1994) Stages of change in adopting healthy diets: fat, fiber and correlates of nutrient intake. Health Education Quarterly. 21, 499-519.
Glanz K., Sorenson, G. and Farmer, A. (1996) The health impact of worksite nutrition and cholesterol intervention programs. American Journal of Health promotion 10, 453-470.
Glasgow, R.E., Perry, J.D., Toobert, D.J. and Hollis, J.F. (1996) Brief assessments of dietary behavior in field settings. Addictive Behaviors. 21, 239-247.
Goode, J., Beardsworth, A.D., Haslam, C., Keil, T. and Sherratt, E. (1995) Dietary dilemmas: nutritional concerns for the 1990s. British Food Journal. 55, 285-299.
Goode, J., Beardsworth, A.D. Keil, T., Sherratt, E. and Haslam, C. (1996) Changing the nation’s diet: a study of responses to current nutritional messages. Health Education Journal. 55, 285-299.
Green, L.W., Kreuter, M.W., Deeds, S.G. and Partridge, K.B. (1980) Health Education planning: A diagnostic approach. Mountain View, CA, Mayfield.
Green, K.L., Steer, S.L., Maliu, R.E., Mahaffey, S.M. and Muhajarine, N. (1993) Evaluation of the Heart Smart restaurant program in Saskatoon and Regina, Saskatechewan. Canadian Journal o f Public Health. 84, 399-402.
Gregory J., Foster, K., Tyler, H and Wiseman, M. (1990) The Dietary and Nutritional Survey of British Adults. OPCS, London, HMSO.
Griffiths, S. Chipperfield, B., Todd, S., Rushton, C. and McCarthy, M. (1994) Dietary beliefs, practices and attitudes of adults in an inner city population. Journal of Human Nutrition and Dietetics. 7, 319-334.
Guldan, G.S. (1996) Obstacles to community health promotion. Social Science and Medicine. 43, 689-695.
161

Hammond, J. Nelson, M., Chinn, S. and Rona, R.J. (1993) Validation of a food frequency questionnaire for assessing dietary intake in a study of CHD risk factors in children. European Journal o f Clinical Nutrition. 47, 242-250.
Haraldsdottir, J. (1993) Minimising error in the field: quality control in dietary surveys. European Journal o f Clinical Nutrition. 47, SI 9-24.
Hamack, L., Block, G. and Lane, S. (1997) Influence of selected environmental and personal factors on dietary behavior for chronic disease prevention: a review of the literature. Journal of Nutrition Education. 29, 306-312.
Hawe, P., Degeling, D. and Hall, J. (1994) Evaluating Health Promotion. Maclennan and Petty Pty Ltd, Australia.
HEA (1992) A Guide to the Heartbeat Award. London, HEA.
HEA (1993) Health Promotion in the Workplace: A summary. London, HEA.
HEA (1995) The Balance o f Good Health. London, HEA.
HEA (1996a) A Caterer’s guide to achieving the Heartbeat Award. London, HEA.
HEA (1996b) The National Catering Initiative- offering the consumer a choice. London, HEA.
HEA (1997) Health Promotion Interventions to promote healthy eating in the general population a review. Summary bulletin 6. London, HEA.
HEA (1998) Health At Work Award. London, HEA.
Heady, J.A. (1961) Diets of bank clerks- development of a method of classifying the diets of individuals for use in epidemiological studies. Journal of the Royal Statistical Society. 124, 336-361.
Hebert, J.R., Clemow, L., Pbert, L., Ockene, I.S. and Ockene, J.K. (1995) Social desirability bias in dietary self-report may compromise the validity of dietary intake measures. International Journal o f Epidemiology. 24, 389-398.
Henderson, M.E., Morris, L.L. and Fitz-Gibbon, C.T. (1987) How to Measure Attitudes. London, Sage Publications.
Herman, J.L. (1987) Evaluators Handbook. Thousand Oaks, C.A., Sage Publications.
Hoerr, S.M. and Louden V.A. (1993) Can nutrition information increase sales of healthful vended snacks? Journal o f School Health. 63, 386-390.
Holdsworth, M. (1994). Leicestershire Food and Nutrition Policy- Opportunities for implementation. Leicester, Leicestershire Health Local Policy Document.
162

Holdsworth, M (1995) Healthy Eating for a Healthy Leicestershire- a summary of the Leicestershire Food and Nutrition Policy. Leicester, Leicestershire Health Local Policy Document.
Holdsworth, M. and Spalding, D. (1997) The development, implementation, monitoring and evaluation of a food and nutrition policy within a local health plan. Journal of Human Nutrition and Dietetics. 10, 209-217.
Holland, B., Welch, A., Unwin, I. D., Buss, D.H., Paul, A.A. and Southgate, D.A.T. (1997) McCance and Widdowson’s: The Composition of Foods. 5th edition. The Royal Society of Chemistry/Ministry of Agriculture, Fisheries and Food.
Horton, R. (1998) Our healthier nation, possibly. Lancet. 351,463.
Horwarth, C.C. (1990) Food frequency questionnaires: a review. Australian Journal of Nutrition and Dietetics. 47, 71-76.
Hughes, J. (1996) How much are we spending and what are we consuming when we eat out? Nutrition and Food Science. March/April, 12-15.
Hunt, M.K., Hebert, J.R. Sorenson, G., Harris, D.R. Hsieh, J., Morris, D.H. etal, (1993) Impact of a worksite cancer prevention program on eating patterns of workers. Journal of Nutrition Education. 25, 236-244.
Hunt, M.K., Stoddard, A.M. Glanz, K. Hebert, J.R., Probart, C., Sorenson, G. etal., (1997) Measures of food choice behavior related to intervention messages in worksite health promotion. Journal o f Nutrition Education. 29, 3-11.
Israel. B.A., Cummings, K.M., Dignan, M.B. Heaney, C.A., Perales, D.P., Simons-Morton, B.G. etal., (1995) Evaluation of heath education programs: current assessment and future directions. Health Education Quarterly. 22, 364-389.
Jones, P., Cliff, J., Meiselman, H., Samuel, S., Symonds, C., Taylor, J., et al., (1991) Can caterers contribute to a healthy diet? In The Food Network- Achieving a healthy diet by the year 2000, Ed: Hurren, C and Black, A., p63-71. London, Smith-Gordon.
Kant, A.K. (1996) Indexes of overall diet quality: a review. Journal o f the American Dietetic Association. 96, 785-791.
Keen, H., Thomas, B.J., Jarrett, R.J. and Fuller, J.H. (1979) Nutrient intake, adiposity and diabetes. British Medical Journal. 1, 655-658.
Kelsey, K.S., Kirkley, B.G. and deVellis, R.F. (1996) Social support as a predictor of dietary change in a low income population. Health Education Research. 11, 383-395.
Kemm, K.R. and Booth, D. (1992) Promotion of Healthier Eating. How to collect and use information for planning, monitoring and evaluation. London, HMSO.
King, J.C. and Van-Horn, L. (1983) Nutrition in the workplace. Journal of Nutrition Education 15, 59.
163

Kinlay, S, Heller, R.F. and Halliday, J.A. (1991) A simple score and questionnaire to measure group changes in dietary fat intake. Preventive Medicine. 20, 378-388.
Koepsell, T.D, Wagner, E.H., Cheadle, A.C., Patrick, D.L., Martin, D.C., Diehr, P.H. et al., (1992) Selected methodological issues in evaluating community based health promotion and disease prevention programs. Annual Reviews of Public Health. 13, 31-57.
Kohlmeier, L. (1994) Ed Dietary assessment resource manual. The Journal of Nutrition. 124, 2245-2317.
Kristal, A.R., Beresford, S.A.A. and Lazovich, D. (1994) Assessing change in diet- intervention research. American Journal of Clinical Nutrition. 59 (suppl), 185-189.
Kronenfield, J.J., Jackson, K., Blair, S.N., Davis, K., Dell-Gimarc, J., Salisbury, Z., et al., (1987) Evaluating health promotion: A longitudinal quasi-experimental design. Health Education Quarterly. 14, 123-139.
Lanska, D.J. (1998) The Mad Cow problem in the UK: risk perceptions, risk management, and health policy development. Journal of Public Health Policy. 19, 160-183.
Larson-Brown, L.B. (1978) Point-of purchase information on vended foods. Journal of Nutrition Education. 10, 116-118.
Lechner, L. Brug, J. and de Vries, H. (1997) Misconceptions of fruit and vegetable consumption: differences between objective and subjective estimation of intake. Journal of Nutrition Education. 29, 313-320.
Leicestershire Health Authority (1987) Eating for a Health: The District Food Policy. Leicester, Leicestershire Health Local Policy Document.
Leicester City Council (1990) Leicester City census data. Leicester City Council.
Leicestershire Health Plan Steering Group (1993) Healthy Leicestershire-A Plan For Health. Leicester, Leicestershire Health Local Policy Document.
Levine, J.A and Morgan, M.Y. (1991) Assessment of dietary intake in man: a review of available methods. Journal o f Nutritional Medicine. 2, 65-81.
Likert, R (1932) A technique for the measurement of attitudes. Archives o f Psychology. 40, 44-53.
Lloyd, H.M., Paisley, C.M. and Mela, D.J. (1993) Changing to a low fat diet: attitudes and beliefs of UK customers. European Journal of Clinical Nutrition. 47, 361-373.
Lockie, G.M., Wise, A. and Liddell, J.A. (1988) Methods for analysis of a food frequency questionnaire. Journal of Human Nutrition and Dietetics. 1, 29-37.
Low Income Project Team (1996) Low income, food, nutrition and health: strategies for improvement. Nutrition Task Force. London, Department of Health.
MacAuslan, E.M.R. (1995a) Heartbeat: hit or miss for sandwich bars? Environmental Health. 103, 106-107.
164

MacAuslan, E.M.R. (1995b) The Heartbeat Award. Is attainment of the current criteria by eat-in sandwich bars practicable? Health and Hygiene. 16, 163-167.
Margetts, B.M. and Nelson, M. (1997) Design Concepts in Nutritional Epidemiology. 2nd edition. Oxford, Oxford University Press.
Marmot, M. (1992) Coronary Heart Disease: rise and fall of a modem epidemic. In Coronary heart disease epidemiology. From aetiology to public health. Ed: Marmot, M. and Elliott, P. Oxford Medical publications. Oxford, Oxford University Press.
Marr, J.W. (1971) Individual dietary surveys: purposes and methods. World Reviews of Nutrition and Dietetics. 13, 105-164.
Martens, L. and Warde, A. (1995) On the future o f eating out. Presentation at the Nation's diet conference, 14th November 1995, London.
Maryon-Davis, A., Briscoe, C., Heughan, A., Knowler, S., Lean, M., Sanderson, M. et al., (1991) An agenda for nutrition education in the 1990s. In The Food Network- Achieving a healthy diet by the year 2000, Ed: Hurren, C and Black, A., p83-l 11. Smith-Gordon, London.
Mayer, J.A., Heins, J.M., Vogel, J.M., Morrison, D.C., Lankester, L.D. and Jacobs A.L. (1986) Promoting low-fat entree choices in a public cafeteria. Journal of Applied Behavior Analysis. 19, 397-402.
Mayer, J.A., Brown, T.P., Heins, J.M. and Bishop D.B. (1987) A multi-component intervention for modifying food selections in a worksite cafeteria. Journal of Nutrition Education 19, 277-280.
Mayer, J.A., Dubbert, P.M. and Elder, J.P. (1989) Promoting nutrition at the point of choice: a review. Health Education Quarterly. 16, 31-43.
McCallum, A. (1993) What is an outcome and why look at them? Critical Public Health. 4, 4-9.
Ministry of Agriculture, Fisheries and Food (1992) Household food consumption and expenditure. London, HMSO.
Ministry of Agriculture, Fisheries and Food (1994) The Dietary and Nutritional Survey of British Adults-further Analysis. London, HMSO.
Ministry of Agriculture, Fisheries and Food (1995) National Food Survey 1994. London, HMSO.
Ministry of Agriculture, Fisheries and Food (1996) The National Food Survey 1995. London, HMSO.
Mock, J. (1989) Healthy eating- a caterers response. Nutrition and Food Science. July/August, 66-69.
165

Mullen, P. and Iverson, D. (1982) Qualitative methods for evaluative research in health education programmes. Health Education. May/June, 11-18.
Murphy, S., Powell, C. and Smith, C. (1993) An Evaluation of the Heartbeat Award Scheme. Briefing Report Number 3. Health Promotion Wales.
Murphy, M., Wise, A., and McLeish, A. (1993b) Persuasiveness of nutritional messages. Journal o f Human Nutrition and Dietetics. 6, 49-55.
Murray, J., Shannon, B. and Sims, L. (1986) Nutrition as a component of health promotion programs in the Northeast. Journal o f Nutrition Education 18, 25-29.
National Advisory Committee on Nutrition Education (1983). A discussion paper on proposals for nutritional guidelines for health education in Britain. HEA.
National Dairy Council (NDC) (1992) Food and Health- What does Britain think? London, NDC.
National Childrens Home (1991) Poverty and Nutrition Survey. London, National Childrens Home.
Nelson, M. and Bingham, S. (1997) Assessment of food consumption and food intake. In Design Concepts in Nutritional Epidemiology. Eds: Margetts, B.M. and Nelson, M., p 123- 169. 2nd edition. Oxford, Oxford University Press.
Nichols, S., Waters, W.E., Woolaway, M. and Hamilton-Smith, M.B. (1988) Evaluation of the effectiveness of a nutritional health education leaflet in changing public knowledge and attitudes about eating and health. Journal of Human Nutrition and Dietetics. 1, 233-238.
Norusis, M.J. (1993) SPSS for Windows Base System User’s Guide. Release 6.0. Chicago, SPSS Inc.
Nutbeam, D., Smith, C. and Catford, J. (1990) Evaluation in health education. A review of progress, possibilities and problems. Journal of Epidemiology and Community Health. 44, 83-89.
OPCS (1991) Standard Occupation Classification. Volume 3. London, HMSO.
Oshaug, A. (1994) Planning and managing community nutrition work. Manual for personnel involved in community nutrition. International Nutrition Section, WHO Collaborating Centre, Nordic School of Nutrition, University of Oslo.
Oshaug, A.s (1995) Evaluation o f Nutrition Education Programs: Implications for program planners and evaluators. Paper presented for the expert consultation on Nutrition Education for the Public. Rome, 18-22nd September, 1995.
Osier, M and Heitmann, B.L. (1996) The validity of a short food frequency questionnaire and its ability to measure changes in food intake: a longitudinal study. International Journal of Epidemiology. 25(5), 1023-1029.
166

Palmer, J. and Leontos, C. (1995) Nutrition training for chefs: Taste as an essential determinant of choice. Journal o f the American Dietetic Association. 95, 1418-1421.
Pawan, A. (1991) In The Food Network- Achieving a healthy diet by the year 2000, Ed: Hurren, C and Black, A., pi 18. London, Smith-Gordon.
Pawan, A. (1993) Nutritional quality: a contract caterers perspective. Journal of the Royal Society o f Health. 113, 324-326.
Peach, R., Dehar, M., Casswell., Gourley, G. (1996) Heartbeat Awards in Intermediate and Secondary schools in New Zealand: outcomes of the first two years. Health Promotion Journal of Australia. 6(1): 42-50.
Peterson, G.S., Lefebvre, R.C., Ferreira, A., Sennett, L., Lazieh, M. and Carleton, R.A. (1986) Strategies for cholesterol lowering in the worksite. Journal of Nutrition Education. 18,54-57.
Pope, C. and Mays, N. (1995) Reaching the parts other methods cannot reach: an introduction to qualitative methods in health and health services research. British Medical Journal. 311, 42-45.
Pope, R., Cooney, M. and Bowyer, J. (1994) Current national status of Heartbeat Award project activity. University of Greenwich.
Pope, R. and Cooney, M. (1995) The Heartbeat Award for caterers: experiences of health professionals involved. Health Education Journal. 54, 322-330.
Poulter, J. and Torrance, I. (1993). Food and Health at Work-a Review. Journal of Human Nutrition and Dietetics. 6, 89-100.
Poulter, J. (1994). Healthy Eating at Work. Part 1. London, HEA.
Prochaska J.O. and DiClemente C.C. (1982) Transtheoretical therapy: toward a more integative model of change. Psychotherapy, Theory, Research and Practice. 19, 276-288.
Prochaska, J.O., Norcross, J.C. and DiClemente, C.C. (1994) Changing for Good, New York, Morrow and Company.
Rehman, H. and Walker, E. (1995) Researching black and minority ethnic groups. Health Education Journal. 54,489-500.
Rice, N. (1994) Promoting Health of the Nation targets through catering. British Nutrition Foundation Nutrition Bulletin. 19, 88-93.
Richmond, K. (1986) Introducing heart-healthy foods in a company cafeteria. Journal of Nutrition Education. 18, 63-65.
Ritchie, J. and Spencer, L. (1994) Qualitative data analysis for applied policy research. In Analysing Qualitative Data. : 173-194. Ed: Bryman A, Burgess, RG. London, Routledge.
Rogers, E.M. (1995) Diffusion o f innovations. 4th edition. New York, The Free Press.
167

Rossi, P.H. and Freeman, H.E. (1993) Evaluation: a systematic approach. 5th edition. Thousand Oaks, C.A., Sage Publications.
Salvini, S. Hunter, DJ, Sampson, L., Stampfer, M.J. annd Colditz, G.A. (1989) Food based validation of a dietary questionnaire: the effects of week to week variation in food consumption. International Journal of Epidemiology. 18: 858-67.
Schmitz, M.F. and Fielding, J.E. (1986) Point-of-choice nutritional labelling: evaluation in a worksite cafeteria. Journal o f Nutrition Education. 18, 65-68.
Scott, L.W., Foreyt, J.P., Manis, E., O'Malley, M.P. and Gotto, A.M. (1979) A low cholesterol menu in a steak restaurant. Journal of the American Dietetic Association.!4, 54- 56.
Sempos, C.T. (1992) Some limitations of semiquantative food frequency questionnaires. American Journal o f Epidemiology. 135, 1127-1132.
Seymour, D. (1990) The Heartbeat Award Briefing Paper. London, HEA.
Sheiham, A., Marmot, M., Taylor, B., and Brown, A. (1990) British Social Attitudes: 7th report. Aldershot, Gower Press.
Shepherd, R. and Stockley, L. (1987) Nutrition knowledge, attitudes and fat consumption. Journal of the American Dietetic Association. 87, 615-619.
Silverstone, R. (1995) Application of the new nutritional consensus to the catering industry. British Food Journal. 97, 16-22.
Simnett, I. (1995) Measuring Health Promotion. Developing Health Organisations and Communities. Chichester, Wiley Press.
Sloan, R.P. and Gruman, J.C. (1988) Participation in workplace health promotion programs: the contribution of health and organizational factors. Health Education Quarterly. 15, 269- 288.
Smith, A.M. and Baghurst, K.I. (1992) Public health implications of dietary differences between socio-economic status and occupational category groups. Journal of Epidemiology and Community Health. 46, 409-416.
Smith, A.M. and Smith, C. (1994) Dietary intake and lifestyle patterns: correlates with socioeconomic, demographic and environmental factors. Journal of Human Nutrition and Dietetics. 7, 283-294.
Sneed, J and Burkhalter, J.P. (1991) Marketing nutrition in restaurants: A survey of current practice and attitudes. Journal o f the American Dietetic Association. 91,459-462.
Sorenson, G., Morris, D.M., Hunt, M.K., Hebert, J.R., Harris, D.R., Stoddard, A. and Ocklene, J.K. (1992) Work-site nutrition intervention and employees' dietary habits: the Treatwell program. American Journal o f Public Health. 82, 877-890.
Stefanik, P. A. and Trulson, M.F. (1962) Determining the frequency intakes of foods in large group studies. American Journal o f Clinical Nutrition. 11, 335-343.
168

Steuart, G.W. (1993) Planning and evaluation in health education. Health Education Quarterly. Suppl 1, 71-84.
Stockley, L. (1993) The Promotion o f Healthier Eating- a basis for action. London, HEA.
Terborg, J.R., Hibbard, J. and Glasgow, R.E. (1993) Behavior change at the worksite: does social support make a difference? American Journal of Health Promotion. 10, 125-131.
Teufel, N.I. (1992) Diet and activity patterns of male and female co-workers. Women Health. 19,31-54.
Thomas, J. (1993) Review of approaches to nutrition education and their effectiveness. London, HEA.
Tones, K., Tilford, S. and Robinson, Y. (1990) Health Education-effectiveness and efficiency. London, Routledge.
Vaandrager, H.W., Koelen, M.A., Ashton, J.R. and Revuelta, C.C. (1993) A four-step health promotion approach for changing dietary patterns in Europe. European Journal of Public Health. 3, 193-198.
Van Assema, P., Brug, J., Kok, G. and Brants, H. (1992) The reliability and validity of a Dutch questionnaire on fat consumption as a means to rank subjects according to individual fat intake. European Journal o f Cancer Prevention. 1, 375-380.
Wagner, J.L. and Winett R.A. (1988) Prompting one low-fat, high-fiber selection in a fast food restaurant, Journal o f Applied Behavior Analysis. 21, 179-185.
Warm, D.L., Rushmere, A.E., Margetts, B.M., Kerridge, L. and Speller, V.M. (1997) The Heartbeat Award Scheme: an evaluation of catering practices. Journal of Human Nutrition and Dietetics. 10, 171-179.
WHO (1987) Measurement in health promotion and protection. European series. No.22. Geneva, WHO.
WHO (1991) Meeting Global Health Challenges: A position Paper on Health Education. Presented at XIV World Conference on Health Education. Helsinki, Finland, June 16-21, 1991.
Wilbur, C.S., Zifferblatt, S.M., Pinsky, J.L. and Zifferblatt, S. (1981) Healthy vending: a cooperative pilot research program to stimulate good health in the marketplace. Preventive Medicine. 10, 85-93.
Willett, W.C., Sampson, 1., Stampfer, M.J., Rosner, B., Bain, C., Witschi, J., etal., (1985) Reproducibility and validity of a semiquantative food frequency questionnaire. American Journal of Epidemiology. 122, 51-65.
Williams, C. and Poulter, J. (1991) Formative evaluation of a workplace menu labelling scheme. Journal o f Human Nutrition and Dietetics. 4, 251-262.
169

Winett, R.A., Southard, D.R. and Rankin, J.W. (1993) Nutrition Promotion and dietary change: Framework to meet Year 2000 goals. Medicine, Exercise, Nutrition and Health. 2,7- 26.
Wong, Y., Bauman, K.E. and Koch, G.G. (1996) Increasing low income employee participation in a worksite health promotion program: a comparison of three common strategies. Health Education Research. 11, 71-76.
Workplace Task Force (1994) The Health of the Nation Workplace Task force report. London, HMSO.
World Cancer Research Fund/American Institute for Cancer Research (1997) Food, Nutrition and the prevention o f cancer: a global perspective. Washington, American Institute for Cancer Research.
Zifferblatt S.M., Wilbur C.S. and Pinsky J.L. (1980) Changing cafeteria eating habits, Journal of the American Dietetic Association. 76, 15-20.
170