ORGANIZATIONAL COMMUNICATION SATISFACTION AND JOB SATISFACTION

Malaysian Journal of Distance Education 16(1), 101−121 (2014)
© Penerbit Universiti Sains Malaysia, 2015
An Evaluation of Participants’ Levels of Satisfaction and Perceived Learning Regarding the MOOC in @RAL
Platform
Joyce Mae A. Manalo University of the Philippines Open University, Philippines
[email protected] Abstract A university in the Philippines launched an independent Massive Open Online Course (MOOC) Portal called @RAL and presented an “Introduction to Mobile Applications Development Using the Android Platform” course as its first offering. The current study evaluated this MOOC according to participants’ experiences and expectations to develop recommendations for future MOOC offerings. A subjective survey with both quantitative and qualitative items was administered to all of the course’s participants regardless of whether they had completed the course. The MOOC was evaluated using Level 1 and Level 2 of the Kirkpatrick Model of Evaluation to measure the learner satisfaction and perceived learning of the participants. Level 1 (i.e., Satisfaction) was measured according to participants’ responses to specific statements using a 5-point Likert Scale. Level 2 (i.e., Perceived Learning) was measured by survey items that reflected the participants’ levels of involvement and perceived learning in the course. Relationships between satisfaction and completion as well as between participants’ level of involvement in the course and perceived learning were identified. Comments and suggestions from the participants were also analysed. Results revealed that the participants generally found MOOCs to be appealing given that the courses are free and easily accessible; however, participants had issues with schedules and deadlines that caused them to not finish the course. The participants also discussed their desire to receive more frequent updates. Future offerings of this course, as well as other MOOCs on university MOOC platforms, should incorporate these suggestions to improve learning and learner satisfaction. Keywords: MOOC Evaluation, Participant Satisfaction, Independent MOOC Platform Introduction Given the university mandate to provide open, distance e-learning opportunities, offering Massive Open Online Course (MOOC) was an obvious next step to provide education for everyone in accordance with public service initiatives. Although a number of universities offer MOOCs through popular MOOC providers, such as Coursera, EdX and Udacity,

102 Malaysian Journal of Distance Education 16(1), 101−121 (2014)
there are some universities that prefer to offer MOOCs through their own systems. In cooperation with a telecommunications company in the Philippines, the university developed a MOOC Portal called @RAL. This portal runs on Moodle, which is the same Learning Management System used by the university for its online programs. By developing its own MOOC portal, the university can exercise control with regard to course content, protect MOOC students’ data, and utilise a Learning Management System that is familiar to the majority of the university faculty. The first MOOC offered on this portal was an Android application development course that was designed and facilitated by a representative from the partner telecommunications company. The six month course was conducted in 2013 and served as a trial run of the @RAL portal. The outcomes of this course served as the basis for deciding the university’s future directions with regard to offering MOOCs. The current study examined the effectiveness of the design and delivery of the MOOC and, importantly, whether participants perceived that the course satisfied learner objectives. The results from this study will determine the course’s strengths and weaknesses, as well as what aspects of the course require improvement. The university’s experience in offering this course and developing @RAL can be applied to the development of future MOOC offerings and may improve how MOOCs are designed, particularly for universities that offer MOOCs through independent systems. Objectives This study evaluates whether the MOOC called “Introduction to Mobile Applications Development Using the Android Platform” was successfully delivered based on participants’ expectations and experiences. Specifically, the study has the following aims: 1. Identify the factors affecting participant satisfaction in the MOOC
platform that influence the effectiveness of course delivery. 2. Evaluate the effectiveness of this course through participants’
evaluations of their own learning.

Evaluation of Android MOOC in @Ral 103
3. Collect and analyse participant feedback. 4. Make recommendations for future MOOC development. Course Design and Structure The current study focused on the initial offering of the MOOC titled “Introduction to Mobile Applications Development Using the Android Platform” in the @RAL Portal. This MOOC had the following characteristics that are typical for such platforms, according to Glance et al. (2013): an online mode of delivery (using Moodle), online quizzes and assessments, short videos, peer assessments and online forums. This course was aimed towards individuals who were interested in learning basic knowledge about creating mobile applications for Android. To pass this course, participants should have gained the knowledge and skills to successfully engage in the following: 1. Discuss background and concepts supporting mobile application
development 2. Perform the basic skills needed to create an Android application 3. Develop a basic Android application
The course consisted of six modules that were completed during a six month period (from July to December of 2013). Each module addressed a topic supporting participants’ ability to create their own Android application, which would be made possible by the conclusion of the course. The course modules were as follows: Module 1: Introduction to Mobile Applications Program (uploaded July
1). Module 2: Introduction to Android (uploaded July 17). Module 3: User Interface Components and Modifying Your Project
(uploaded September 3). Module 4: Android Activities, Intents, Preferences and Services
(uploaded July 29). Module 5: Databases and Content Providers (uploaded September 19). Module 6: Finishing Your Application (uploaded October 4).
104 Malaysian Journal of Distance Education 16(1), 101−121 (2014)
The modules consisted of a text-based reference in PDF format and lecture videos created by the faculty-in-charge (FIC), which were provided via YouTube. Additional readings in the form of external links were also provided. Module 4 was uploaded prior to Module 3 due to an error on the part of the FIC. Each module included a quiz as a form of assessment. The final projects, which were participants’ own Android applications, were peer-evaluated using Moodle’s forum. The course also included five main discussion forums, as follows: 1. News Forum – a forum for announcements from the FIC. 2. Module Discussions – a forum for participants to ask questions and
discuss course materials with their course-mates. 3. General Discussions – a forum for self-introductions and served as
socialisation/networking forum. 4. Assignment Questions and Clarifications – a forum for addressing any
concerns regarding the course assessments. 5. Technical Questions and Feedback – a forum for discussions and
inquiries regarding the use of the course site and its features. To attain a certificate of completion, participants had to obtain a total grade of 75% or higher and had to submit a final project, which was their own Android application. Course Analytics In the initial design, each module should have taken 2–3 weeks to complete, for a total course period of 16 weeks. However, the course encountered problems, such as modules and quizzes being uploaded later than anticipated and majority requests for deadline extensions, such that the course was extended from 16 weeks to approximately 24 weeks. The course had a total of 395 enrolled participants, yet not all of the individuals were able to complete the course. For the first module, there were 91 unique views on the first day, which slowly tapered down to 1–5 views per day during the final week. The final module, which was uploaded in October and addressed the packaging and finishing touches

Evaluation of Android MOOC in @Ral 105
for an Android application, received a maximum of seven unique views per day. The trend for the unique views per module was a peak in views on the first week, which gradually decreased across time. For each progressing module, there was a decrease in the total number of views, as shown in Table 1. The data were recorded from the upload date of the module until October 13, 2013 (Borromeo, 2013). Table 1: Module Unique Views
Minimum Unique Views/Day
Maximum Unique Views/Day
Sum of unique views on all days
Module 1 1 91 799 Module 2 1 56 488 Module 3 1 10 72 Module 4 1 23 301 Module 5 1 5 55 Module 6 1 7 33 This decreasing trend in views is consistent with the course completion rate, as only five participants eventually submitted their final projects. These five participants were most likely the only ones accessing the course during the final days, as they were the only ones relying on the module knowledge to create their final projects. Literature Review The primary focus of the current study is participants’ perceptions of the effectiveness of the MOOC. Participants’ evaluations of courses, both MOOCs and other course types, are based on customer satisfaction and job satisfaction theories. According to the Customer Satisfaction theory, participants are considered to be customers and the course is the product that they are consuming (Franklin and Shemwell, 1995). In contrast, the Job Satisfaction theory argues that participants are similar to university employees and, as such, they base their satisfaction levels on the value of their input into the educational process (i.e., studying) compared with their educational compensation (i.e., grades) (Penington, 1989 in Franklin and Shemwell, 1995).
106 Malaysian Journal of Distance Education 16(1), 101−121 (2014)
According to Grover et al.’s (2013) evaluation framework, the Learner Background and Intentions dimension interacts with the Interactive Learning Environment and Technology Infrastructure dimensions in a MOOC. This framework regarding the design and evaluation of MOOCs proposes that improvement and learning originate from these dimensions, which are influenced by the designer’s assumptions regarding the learners, as well as the learners’ own expectations. Cross (2013) conducted an evaluation of OLDSMOOC that focused on participants’ experiences as measured by their onsite activity. Initially, the MOOC had 2,420 registered participants; however, the post-course survey only had 22 responses. By the conclusion of the MOOC, there were approximately 30 active participants. Cross (2013) aimed to obtain responses from the participants regardless of whether they completed the course. This inclusive perspective is important when attempting to collect data regarding satisfaction, as learners may be satisfied with their learning even without course completion based on their initial expectations and levels of exerted effort. Hannan and Ebner (2013) conducted a general study regarding the satisfaction of MOOC participants and found that 65% of participants reported that they were satisfied with their MOOCs. This study utilised an online survey to examine the interactivity aspect of the MOOCs, with a focus on participants’ interactions with their facilitator. This is an important aspect regarding satisfaction with a MOOC; however, there are a number of other factors that also influence participant satisfaction. The Kirkpatrick Model of Evaluation posits that there are four levels through which the effectiveness of a course can be measured, as follows: Level 1 Evaluation–Reactions; Level 2 Evaluation-Learning; Level 3 Evaluation-Behaviour; and Level 4 Evaluation-Results (Kirkpatrick and Kirkpatrick, 2006). The first level is Reactions, as the participants’ reactions to the course determine whether it was considered to be effective (Kirkpatrick and Kirkpatrick, 2006). The second level is Learning, which refers to whether the objectives of the course were met and whether the transfer of knowledge occurred. In the context of a MOOC, in which hundreds or even thousands of participants from different backgrounds can register for

Evaluation of Android MOOC in @Ral 107
the course, levels 3 and 4 with regard to learning are impractical to evaluate. Even in small group training situations, achieving evaluations up to level 3 is adequate for demonstrating the effectiveness of a course. Based on the objectives of the current study, the first two levels of the framework were deemed to be sufficient. Level 1 of the Kirkpatrick Model measures the participants’ reactions to a course. Reactions can be inferred from the participants’ levels of satisfaction with regard to the course and their attitudes regarding specific aspects of the course, such as the multimedia materials provided, the pacing of the course, the presentation style and many other factors. Participants’ responses should indicate the factors that affected their evaluation of the effectiveness of the course delivery. Level 2 of the Kirkpatrick Model measures the participants’ learning, which is consistent with the objectives of the course. In this study, the course included assessment methods to satisfy these objectives, yet these methods were not particularly indicative of the learning outcomes given that pre-tests and post-tests were not administered. The current study asked participants to reflect on how well the course satisfied its objectives based on their expectations and how much time and effort they personally invested in participating in the course. This study was conducted in accordance with the following two perspectives: the customer satisfaction theory, wherein the student is treated as a customer; and the Kirkpatrick Model, in which the student is considered to be an employee in need of training, consistent with the Job Satisfaction theory. Research Methods To identify and obtain feedback regarding the effectiveness of the course delivery, a post-course survey was emailed to all of the individuals who registered for the course. The email was sent on 25 February 2014. Email was used to administer the post-course survey due to the lack of activity on the course site during the final weeks of the course. It was considered likely that the participants still checked their emails even when they no longer visited the course site.

108 Malaysian Journal of Distance Education 16(1), 101−121 (2014)
Participants were not required to respond to all of the questions on the survey. They could not respond to certain questions and their responses were still recorded. Quantitative Study The survey questions utilised in this study were based on the questions recommended by the Kirkpatrick Partners in the New World Reaction Sheets, with some additional questions included that were specific to this research context. To address Level 1 evaluations, the participants’ reactions regarding the course were measured. The survey inquired about whether they agreed or disagreed with statements indicating satisfaction, such as “I like…”, “I feel…” and “I am satisfied with…” A Likert scale was utilised to measure the participants’ satisfaction levels. The survey items aimed to evaluate the participants’ levels of satisfaction with regard to specific aspects of the course, as follows: (1) Course Objectives; (2) Course Materials; (3) the Facilitator and Course Delivery; (4) Course Assessment; and (5) Course Site/MOOC Portal. As previously discussed, the course lacked any form of pre- and post-testing. Therefore, only perceived learning was measured given that actual learning (based on assessments) was unavailable due to deficiencies in the course design of the initial MOOC offering. To address Level 2 evaluations, the inquiry focused on the effort exerted by the participants during the course and on their perceived learning. The participants’ initial knowledge levels with regard to the topic may have varied vastly, given the large number and diverse background of the participants. Qualitative Study In addition to the Likert items, participants’ comments and feedback were recorded within the survey to identify factors affecting the success of the course. The following questions were asked: 1. What did you like most about the course? 2. What did you like least about the course?

Evaluation of Android MOOC in @Ral 109
The responses to these questions were categorised into common themes, with the most frequently mentioned comment taken into account. Feedback was also analysed to determine what factors influenced the participants’ satisfaction and learning during the course. Comments and suggestions from the students were also solicited within this part of the survey. Results Reactions/Responses A Likert scale was utilised for the responses to this survey, with “Strongly Disagree” given a value of one and “Strongly Agree” given a value of five; therefore, three is a neutral value. A higher value indicates agreement or a positive reaction towards a statement, whereas a lower value indicates disagreement or a negative reaction. Again, values close to 3 are deemed neutral. Course Objectives Table 2 shows that the participants had fairly positive reactions towards the course objectives. According to their responses, almost all of the participants understood the course objectives, although one participant disagreed with the statement, “I understood the objectives of the course”. Most of the participants agreed with this statement. The responses to this statement had a mean of 4.0, which indicates a positive response. Regarding whether the participants believed that the course satisfied its objectives, they had a neutral reaction to the statement, “I was able to relate each learning objective to the knowledge I gained.” This statement had a response mean of 3.48; however, the modal response was “Agree” (13 responses). In sum, these responses indicate neutrality with a tendency for satisfaction regarding the course objectives. Given that the course objectives were visible on the course site and were one of the first things that the participants could see, this neutrality suggests that they had a neutral

110 Malaysian Journal of Distance Education 16(1), 101−121 (2014)
response to the objectives as opposed to neutrality due to a lack of sufficient information to form an opinion. Table 2: Response to Course Objectives
Strongly Disagree
Disagree Neutral Agree Strongly Agree
Total Mean
I understood the objectives of the course
0 (0%)
1 (2.85%)
8 (22.86%)
16 (45.71%)
10 (28.57%)
35 4
I was able to relate each of the learning objectives to the learning I achieved
1 (2.94%)
4 (11.76%)
11 (32.35%)
13 (38.24%)
5 (14.70%)
34 3.48
Course Materials The participants’ response to the statement, “I found the course modules to be adequate” was neutral, with the most participants responding with a 3, as shown in Table 3. This neutral response may be attributed to course completion rates, as participants who did not complete the course may not be able to judge whether the modules satisfied their expectations and the course objectives. The participants’ response to the statement, “I found the course modules to be easy to follow and understand” was neutral. Most participants thought that the course modules were easy to follow and understand, as none strongly disagreed with this statement. With a mean of 3.2, the participants’ response to the statement, “I found the multimedia materials (videos) that were used to be engaging” was neutral. This result indicates that the participants did not have a strong reaction towards the multimedia materials used during the course.

Evaluation of Android MOOC in @Ral 111
Table 3: Response to Course Materials
Strongly Disagree
Disagree Neutral Agree Strongly Agree
Total Mean
I found the course modules adequate
1 (3.03%)
5 (15.15%)
12 (36.36%)
10 (30.30%)
5 (15.15%)
33 3.375
I found the course modules easy to understand and follow
0 4 (12.12%)
14 (42.42%)
12 (36.36%)
3 (9.09%)
33 3.42
I found the multimedia materials (videos) used to be engaging
1 (2.94%)
4 (11.76%)
16 (47.06%)
12 (35.29%)
1 (2.94%)
34 3.21
I found the multimedia materials used to be relevant to the course contents
1 (2.94%)
3 (8.82%)
13 (38.24%)
14 (41.18%)
3 (8.82%)
34 3.09
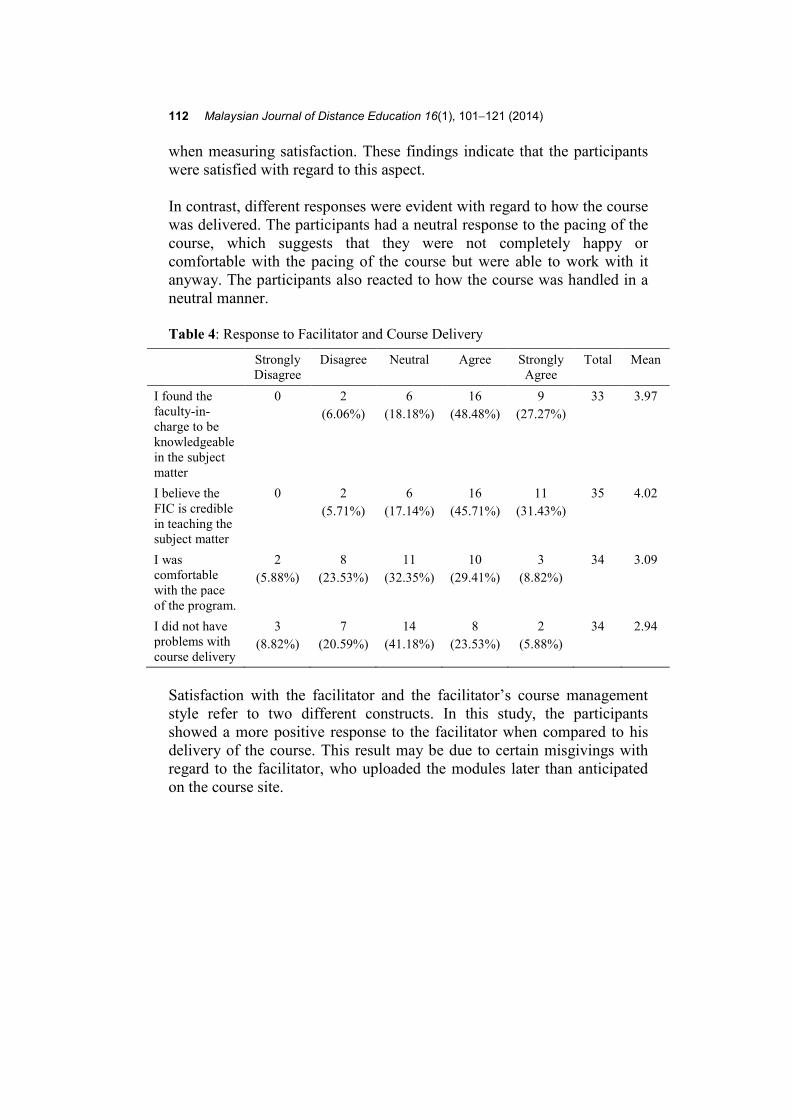
Consistent with the previous finding, the participants’ response to the statement, “I found the multimedia materials used to be relevant to the course content” was also neutral, yet participants tended to agree with this statement. Few participants had strong reactions regarding the relevance of the videos to the course content. The Facilitator and Course Delivery As shown in Table 4, the participants’ response to the FIC was generally positive. They considered him to be knowledgeable (mean score of 3.97) and credible (mean score of 4.0). No participant had a strong negative reaction towards him. The New World Kirkpatrick Level 1 Reaction Sheets (2008) include reaction to the facilitator as an important indicator
112 Malaysian Journal of Distance Education 16(1), 101−121 (2014)
when measuring satisfaction. These findings indicate that the participants were satisfied with regard to this aspect. In contrast, different responses were evident with regard to how the course was delivered. The participants had a neutral response to the pacing of the course, which suggests that they were not completely happy or comfortable with the pacing of the course but were able to work with it anyway. The participants also reacted to how the course was handled in a neutral manner. Table 4: Response to Facilitator and Course Delivery
Strongly Disagree
Disagree Neutral Agree Strongly Agree
Total Mean
I found the faculty-in-charge to be knowledgeable in the subject matter
0 2 (6.06%)
6 (18.18%)
16 (48.48%)
9 (27.27%)
33 3.97
I believe the FIC is credible in teaching the subject matter
0 2 (5.71%)
6 (17.14%)
16 (45.71%)
11 (31.43%)
35 4.02
I was comfortable with the pace of the program.
2 (5.88%)
8 (23.53%)
11 (32.35%)
10 (29.41%)
3 (8.82%)
34 3.09
I did not have problems with course delivery
3 (8.82%)
7 (20.59%)
14 (41.18%)
8 (23.53%)
2 (5.88%)
34 2.94
Satisfaction with the facilitator and the facilitator’s course management style refer to two different constructs. In this study, the participants showed a more positive response to the facilitator when compared to his delivery of the course. This result may be due to certain misgivings with regard to the facilitator, who uploaded the modules later than anticipated on the course site.
Evaluation of Android MOOC in @Ral 113
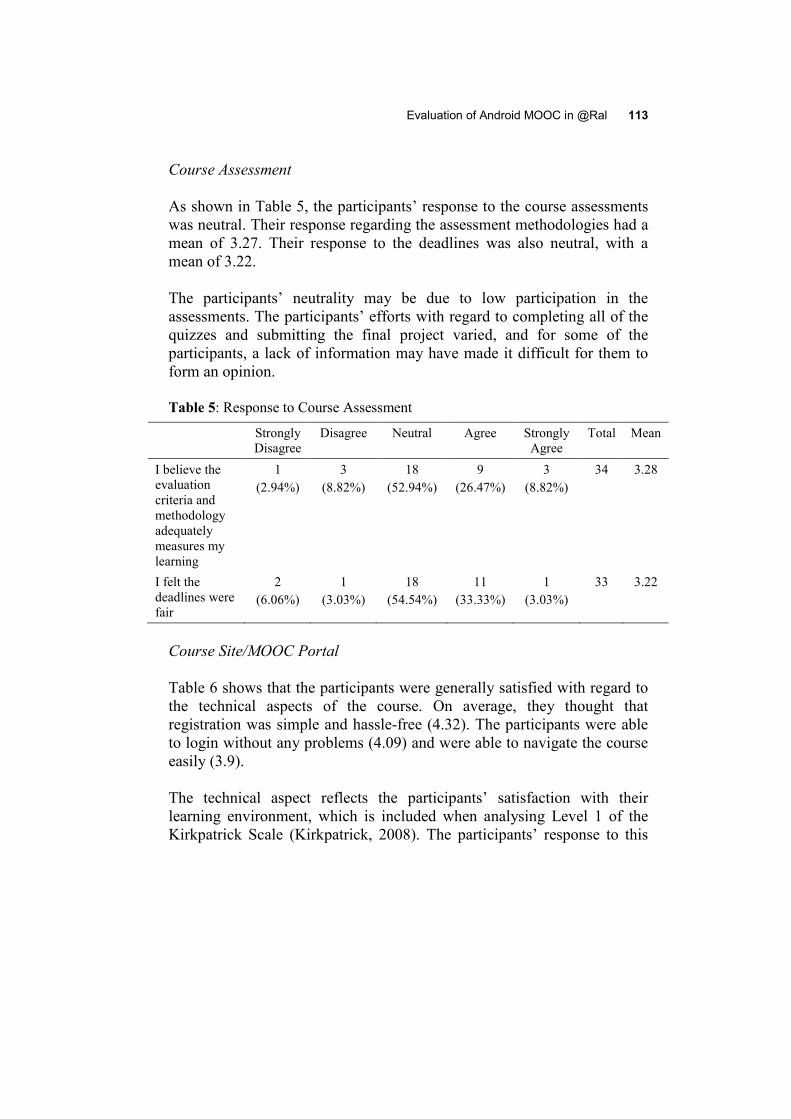
Course Assessment As shown in Table 5, the participants’ response to the course assessments was neutral. Their response regarding the assessment methodologies had a mean of 3.27. Their response to the deadlines was also neutral, with a mean of 3.22. The participants’ neutrality may be due to low participation in the assessments. The participants’ efforts with regard to completing all of the quizzes and submitting the final project varied, and for some of the participants, a lack of information may have made it difficult for them to form an opinion. Table 5: Response to Course Assessment
Strongly Disagree
Disagree Neutral Agree Strongly Agree
Total Mean
I believe the evaluation criteria and methodology adequately measures my learning
1 (2.94%)
3 (8.82%)
18 (52.94%)
9 (26.47%)
3 (8.82%)
34 3.28
I felt the deadlines were fair
2 (6.06%)
1 (3.03%)
18 (54.54%)
11 (33.33%)
1 (3.03%)
33 3.22
Course Site/MOOC Portal Table 6 shows that the participants were generally satisfied with regard to the technical aspects of the course. On average, they thought that registration was simple and hassle-free (4.32). The participants were able to login without any problems (4.09) and were able to navigate the course easily (3.9). The technical aspect reflects the participants’ satisfaction with their learning environment, which is included when analysing Level 1 of the Kirkpatrick Scale (Kirkpatrick, 2008). The participants’ response to this

114 Malaysian Journal of Distance Education 16(1), 101−121 (2014)
aspect was positive, indicating that they were satisfied with their learning environment. Table 6: Response to Course Site/MOOC Portal
Strongly Disagree
Disagree Neutral Agree Strongly Agree
Total Mean
I found the registration to be simple and hassle-free
1 (2.86%)
0 (0%)
5 (14.28%)
10 (28.57%)
19 (54.28%)
35 4.32
I was able to log-in without any problems
3 (8.82%)
0 5 (14.70%)
9 (26.47%)
17 (50.00%)
34 4.09
I was able to navigate the course site easily
2 (5.88%)
1 (2.94%)
10 (29.41%)
6 (17.65%)
15 (44.12%)
34 3.91
Most of the statements pertaining to Level 1 (i.e., satisfaction) received neutral responses, which may be due to one of two possibilities: The participants’ responses to the statements were truly neutral (neither agree nor disagree), or they lacked sufficient information to form an opinion. The participants who did not complete the course or attempt the assessments may not have been able to form opinions regarding their satisfaction with the modules and assessments. Despite the overall neutrality, there were more positive responses compared to negative responses across all of the statements, indicating that satisfaction with the course ranged from neutral to positive. There were also relatively few strong opinions for any of the statements, indicating that none of the aforementioned aspects were particularly impressive or noticeably lacking in some feature.
Evaluation of Android MOOC in @Ral 115
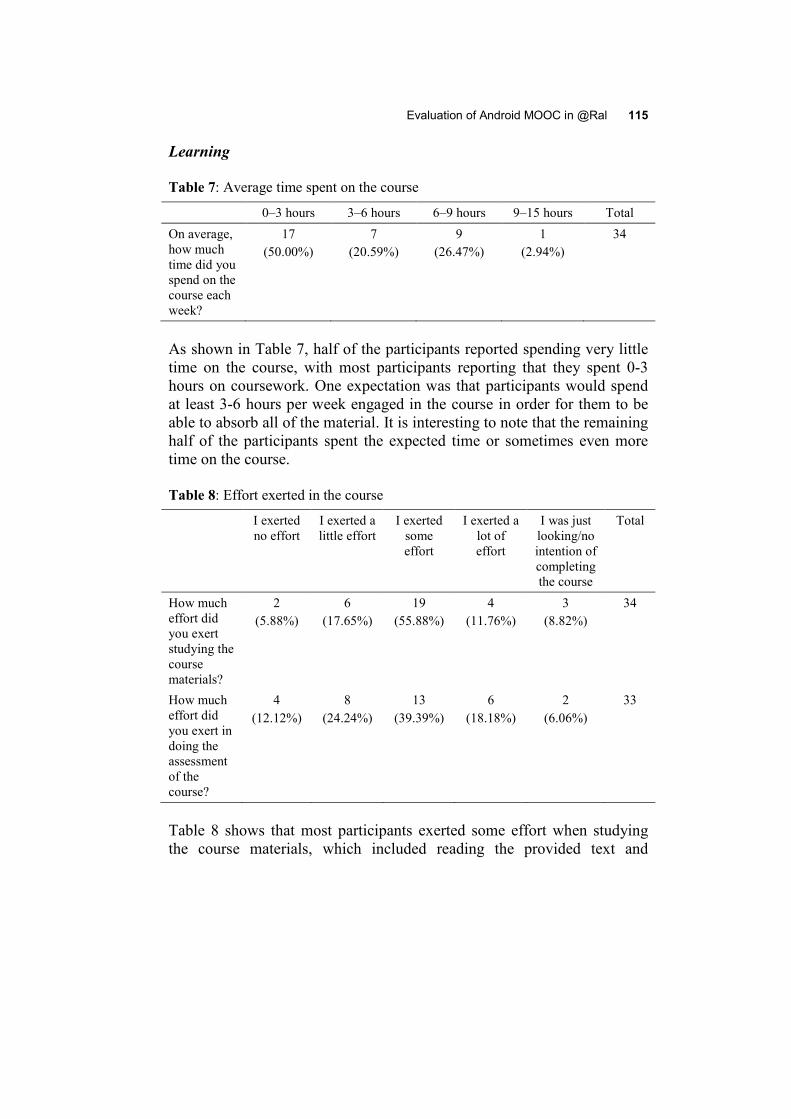
Learning Table 7: Average time spent on the course
0–3 hours 3–6 hours 6–9 hours 9–15 hours Total On average, how much time did you spend on the course each week?
17 (50.00%)
7 (20.59%)
9 (26.47%)
1 (2.94%)
34
As shown in Table 7, half of the participants reported spending very little time on the course, with most participants reporting that they spent 0-3 hours on coursework. One expectation was that participants would spend at least 3-6 hours per week engaged in the course in order for them to be able to absorb all of the material. It is interesting to note that the remaining half of the participants spent the expected time or sometimes even more time on the course. Table 8: Effort exerted in the course
I exerted no effort
I exerted a little effort
I exerted some effort
I exerted a lot of effort
I was just looking/no intention of completing the course
Total
How much effort did you exert studying the course materials?
2 (5.88%)
6 (17.65%)
19 (55.88%)
4 (11.76%)
3 (8.82%)
34
How much effort did you exert in doing the assessment of the course?
4 (12.12%)
8 (24.24%)
13 (39.39%)
6 (18.18%)
2 (6.06%)
33
Table 8 shows that most participants exerted some effort when studying the course materials, which included reading the provided text and
116 Malaysian Journal of Distance Education 16(1), 101−121 (2014)
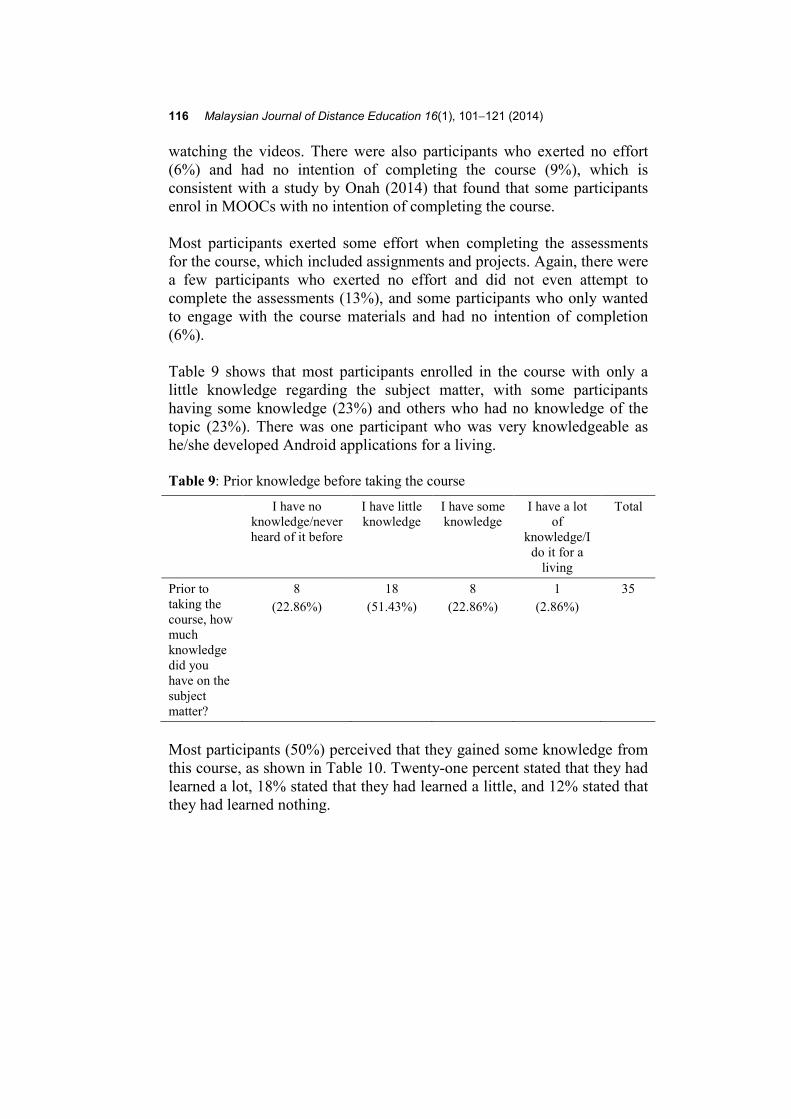
watching the videos. There were also participants who exerted no effort (6%) and had no intention of completing the course (9%), which is consistent with a study by Onah (2014) that found that some participants enrol in MOOCs with no intention of completing the course. Most participants exerted some effort when completing the assessments for the course, which included assignments and projects. Again, there were a few participants who exerted no effort and did not even attempt to complete the assessments (13%), and some participants who only wanted to engage with the course materials and had no intention of completion (6%). Table 9 shows that most participants enrolled in the course with only a little knowledge regarding the subject matter, with some participants having some knowledge (23%) and others who had no knowledge of the topic (23%). There was one participant who was very knowledgeable as he/she developed Android applications for a living. Table 9: Prior knowledge before taking the course
I have no knowledge/never heard of it before
I have little knowledge
I have some knowledge
I have a lot of
knowledge/I do it for a
living
Total
Prior to taking the course, how much knowledge did you have on the subject matter?
8 (22.86%)
18 (51.43%)
8 (22.86%)
1 (2.86%)
35
Most participants (50%) perceived that they gained some knowledge from this course, as shown in Table 10. Twenty-one percent stated that they had learned a lot, 18% stated that they had learned a little, and 12% stated that they had learned nothing.
Evaluation of Android MOOC in @Ral 117
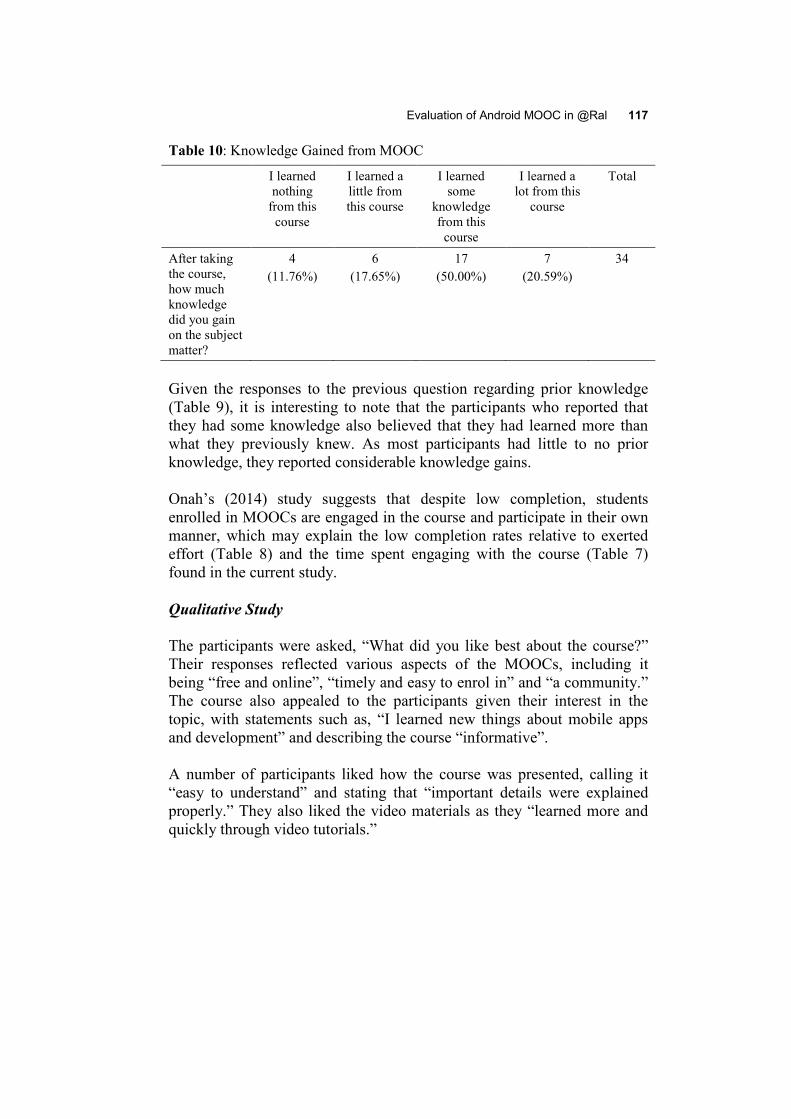
Table 10: Knowledge Gained from MOOC
I learned nothing
from this course
I learned a little from this course
I learned some
knowledge from this
course
I learned a lot from this
course
Total
After taking the course, how much knowledge did you gain on the subject matter?
4 (11.76%)
6 (17.65%)
17 (50.00%)
7 (20.59%)
34
Given the responses to the previous question regarding prior knowledge (Table 9), it is interesting to note that the participants who reported that they had some knowledge also believed that they had learned more than what they previously knew. As most participants had little to no prior knowledge, they reported considerable knowledge gains. Onah’s (2014) study suggests that despite low completion, students enrolled in MOOCs are engaged in the course and participate in their own manner, which may explain the low completion rates relative to exerted effort (Table 8) and the time spent engaging with the course (Table 7) found in the current study. Qualitative Study The participants were asked, “What did you like best about the course?” Their responses reflected various aspects of the MOOCs, including it being “free and online”, “timely and easy to enrol in” and “a community.” The course also appealed to the participants given their interest in the topic, with statements such as, “I learned new things about mobile apps and development” and describing the course “informative”. A number of participants liked how the course was presented, calling it “easy to understand” and stating that “important details were explained properly.” They also liked the video materials as they “learned more and quickly through video tutorials.”

118 Malaysian Journal of Distance Education 16(1), 101−121 (2014)
The participants were also asked, “What did you like least about the course?” Many of the participants’ problems were regarding the schedule and deadlines, as reflected by statements such as, “The deadline for the final project was a little too sudden; therefore, I wasn't able to complete it.” There were also times when the “class schedule was not followed.” The participants also stated that they had difficulty finishing the course due to their own schedules. Some commented on the lack of updates available on the site and through email or Facebook (although Facebook and email correspondence were not included in the course design). A lack of activities/assessments was also a theme that was observed in their responses. Comments Many of the participants commented that they would like for the course to be offered again. Some participants suggested that other MOOCs should be offered as well. Another common suggestion was to provide regular updates and notifications on the course site, as well as through other platforms, such as via email and on social media. In addition to updates, the participants commented on the lack of timely feedback from the FIC. Some participants hoped that the FIC would be more enthusiastic and engaging. Additional Findings Twelve participants emailed to say that they opted not to respond to the survey because they were not able to take part in the course due to technical reasons (e.g., unable to login, could not create account, forgot password, etc.) Discussion Of the 395 participants who registered for the course, only 35 (10%) responded to the survey, with several participants (3%) refusing to respond because they were unable to complete or even participate in the course who felt that they would not be able to evaluate the course fairly. Given the low completion rate for the course (1.2%) and the steady decline in views, it is possible that, in addition to the participants who explicitly

Evaluation of Android MOOC in @Ral 119
declined to answer, there may be other participants who felt similarly and refused to respond. The low completion rate may be due to problems with regard to timing and scheduling or to a gradual loss of interest due to the lack of timely updates. Participants who lost interest in the course may not have been interested in participating in this survey. Participants who were interested in the course were most likely those who took the time to respond to this survey. Their reactions to the MOOC were mostly neutral, although some encountered a few problems. Convenience was one issue that the participants mentioned that they liked about the MOOC. They also considered enrolment to be easy, and they appreciated that the MOOC was very convenient. Most participants registered for the course to learn, with only 9% stating that they were just browsing. Most participants also stated that they exerted some effort when engaging in the course (56%) and that they were able to learn new information from it (48%), which indicates genuine interest in the course and/or subject matter. There were a few to no complaints or negative reactions regarding the course content, the presentation of materials (aside from noting an erratum), or the FIC. Kirkpatrick’s framework indicates that for learning to occur, students should first be at ease. In this MOOC, the participants were neither disappointed nor overly pleased. Despite participants reporting that they were satisfied with the course and that they had exerted enough effort to learn the material, only 5 participants completed the course. The identified problems may play a larger role with regard to course completion than expected or other unidentified factors may be evident. Typical MOOC completion rates can be as high as 40%, but most have lower than 10% (Jordan, 2014). Based on the comments, most of the participants’ feedback and reactions regarding their satisfaction levels and perceived learning were fair, with time issues being the most prominent reason for non-completion. The results indicate that the participants were generally receptive to the MOOCs, with positive aspects being that the MOOCS are free and accessible. One possibility is that once the issues identified by the

120 Malaysian Journal of Distance Education 16(1), 101−121 (2014)
participants, such as those related to time (e.g., schedules and deadlines), specific technical aspects (e.g., receiving email updates and slow website responses) and pedagogical issues (e.g., a lack of feedback on assignments and students’ progress) are addressed, the participants’ reactions will become more positive. Yet, the neutrality of the responses may indicate that the participants neither agreed nor disagreed with the statements because they did not find the course to be applicable to them. Given the low completion rate and that there were individuals who stated that they were not able to complete or even participate in the course, there may be participants who responded neutrally because they were not able to spend enough time in the course to form an opinion. Summary, Conclusions and Recommendations The MOOC examined in this study had its own share of problems and, for a trial run, the course was not expected to be perfect. The survey participants had either neutral or positive reactions towards the MOOC, with very few strong negative reactions. The participants reported that they gained knowledge from the course based on their efforts and initial knowledge of the topic. Yet, only 5 of 395 participants completed the course. In the participants’ feedback regarding their satisfaction levels and perceived learning, they mentioned various factors that affected their experiences in the course, which may have contributed to the low completion rate. An evaluation of the course based on modified Levels 1 and 2 of the Kirkpatrick Scale revealed that the participants were more satisfied than dissatisfied with the course and that learning was present. This learning varied based on the participants’ prior knowledge and exerted effort, indicating that the course was acceptable but still had room for improvement. Given the results of this study, one recommendation is to adjust the MOOC by addressing the problems mentioned by the participants and then offer the MOOC again. It would be important to evaluate whether the satisfaction levels and perceived learning of the participants remains the same or whether it changes due to the adjustments. Other metrics, such as

Evaluation of Android MOOC in @Ral 121
completion rates and actual learning as measured by pre-test and post-test assessments, should be included to determine whether the adjustments enhanced satisfaction levels and perceived learning to have positively impact the course outcomes. References Borromeo, R. 2013. MOOC Stats. Unpublished raw data. Cross, S. 2013. Evaluation of the OLDS MOOC curriculum design course: Participant
perspectives, expectations and experiences. OLDS MOOC Project, Milton Keynes.
Franklin, K. K. and D. W. Shemwell. 1995. Disconfirmation theory: An approach to student satisfaction assessment in higher education. Washington, D.C.: Educational Resources Information Center (ERIC) Clearing on Higher Education. (ERIC Document Reproduction Service No. ED 388 199).
Glance, D., M. Forsey and M. Riley. 2013. The pedagogical foundations of massive open online courses. First Monday 18(5), doi:10.5210/fm.v18i5.4350.
Grover, S., P. Franz, E. Schneider and R. Pea. 2013. The MOOC as distributed intelligence: Dimensions of a framework for the design and evaluation of MOOCs. In Proceedings of the 10th International Conference on Computer Supported Collaborative Learning, Madison, WI, 16–19 June 2013.
Hannan Khalil and M. Ebner. 2013. “How satisfied are you with your MOOC?” - A research study on interaction in huge online courses. In Proceedings of World Conference on Educational Multimedia, Hypermedia and Telecommunications 2013, eds. Jan Herrington et al., 830–839. Chesapeake, VA: Association for the Advancement of Computing in Education (AACE).
Jordan, K. 2014. Initial trends in enrolment and completion of massive open online courses. The International Review of Research in Open and Distance Learning 15(1): 133–159.
Kirkpatrick, D. and J. Kirkpatrick. 2006. Evaluating training programs the four levels (Revised/Expanded ed.). San Francisco, CA: Berrett-Koehler.
Kirkpatrick, J. 2008 New world reaction level 1 reaction sheet http://www.kirkpatrickpartners.com/Portals/0/Storage/The%20new%20world%20level%201%20reaction%20sheets.pdf (accessed 18 September 2014.)
D.F.O. Onah, J. Sinclair and R. Boyatt. 2014. Dropout rates of massive open online courses: Behavioural patterns, EDULEARN14 Proceedings, 5825–5834.