Valuation: Packet 2 Relative Valuation, Asset-based valuation and Private Company Valuation

1 | P a g e
An Equity Valuation and Analysis of Havertys Furniture Companies, Inc.
Casey Noble [email protected]
Joel Dunn [email protected]
Kimberly Edge [email protected]
Lauren Heine [email protected]

2 | P a g e
Table of Contents Executive Summary………………………………………………………………………………3
Business & Industry Analysis…………………………………………………………………8
Company Overview…………………………………………………………………….8
Industry Overview………………………………………………………………………9
Five Forces Model…………………………………………………………………………………11
Rivalry Among Existing Firms……………………………………………………….12
Threat of New Entrants……………………………………………………………….17
Threat of Substitute Products………………………………………………………23
Bargaining Input and Output Markets…………………………………………..25
Bargaining Power of Customers………………………………………….25
Bargaining Power of Suppliers……………………………………………29
Value Chain Analysis…………………………………………………………………………….33
Firm Competitive Analysis……………………………………………………………………..38
Accounting Analysis………………………………………………………………………………43
Key Accounting Policies……………………………………………………………….43
Accounting Flexibility………………………………………………………………….49
Actual Accounting Policy……………………………………………………………..51
Quality of Disclosure…………………………………………………………………..54
Quantitative Analysis of Disclosure……………………………………………….55
Sales Manipulation Diagnostic……………………………………………56
Expense Manipulation Diagnostic……………………………………….61
Potential Red Flags……………………………………………………………………..68
Undo Accounting Distortions……………………………………………………….70
Financial Analysis, Financial Forecasts, and Cost of Capital Estimation………71
Financial Ratio Analysis……………………………………………………………….71
Liquidity Analysis………………………………………………………………………..71
Profitability Analysis……………………………………………………………………78

3 | P a g e
Capital Structure Analysis…………………………………………………………….86
Growth Rate Analysis…………………………………………………………………..92
Internal Growth Rate…………………………………………………………92
Sustainable Growth Rate……………………………………………………93
Financial Statement Forecasting…………………………………………………..94
Cost of Capital Estimation……………………………………………………………98
Cost of Equity…………………………………………………………………..98
Cost of Debt……………………………………………………………………..99
Weighted Average Cost of Capital………………………………………100
Equity Valuations………………………………………………………………………………….101
Methods of Comparable………………………………………………………………101
Intrinsic Values…………………………………………………………………………………….106
Discount Dividend Model……………………………………………………………..107
Free Cash Flow Model…………………………………………………………………109
Residual Income Model……………………………………………………………….110
Long Run Return on Equity Residual Income Model……………………….113
Abnormal Earnings Growth Model………………………………………………..115
Analyst Recommendation……………………………………………………………………..118
Appendix…………………………………………………………………………………………….120
Reference Page……………………………………………………………………………………157

4 | P a g e
Executive Summary
HVT: NYSE (4/01/2008) $11.00 Altman's Z-score
52 week range $7.21 - $13.53 2002 2003 2004 2005 2006
Revenue $787.06 M 3.84 3.7 3.72 3.84 3.96 Market Capitalization $202.2 M Shares Outstanding $22.328M Valuation Estimates Book Value Per Share 13.003 Actual Price (4/01/2008)- $11 Institutional Ownership (%) 114.90% Financial Based Valuations
ROE 0.60% Trailing P/E: $1.13
ROE (restated) -13.71% Forward P/E:
$17.02
ROA 0.37% P.E.G:
$10.98
ROA (restated) -7.36% P/B:
$34.43
P/EBITDA:
$2.23 Back Door Cost of Capital Method P/FCF:
$25.59
Cost of Equity 11.38% EV/EBITDA:
$144.60
Cost of Debt 4.74% Dividend Yield:
$12.36 Weighted Average Cost of Capital 8.62% Intrinsic Valuations:
Published Beta -0.74% Discounted Dividends:
$3.39
Free Cash Flow:
$26.84
Residual income:
$5.28
Abnormal earnings growth:
$4.07
LR ROE:
$2.74

5 | P a g e
Industry Analysis
Havertys Furniture Companies Inc. (HTV) is one of the top home furnishing
retailers in the nation. Today, there are over 120 stores throughout 17 states and they
sustain continued success. Havertys sells residential furniture, accessories, and bedding
and maintains a wide selection of products and breadth of styles in the middle to upper-
middle price ranges. In 2005, Havertys introduced a Havertys brand furniture line by
outsourcing many foreign and exotic materials. Now, nearly all the merchandise offered
is Havertys brand product. Havertys initial direct competitors included Ethan Allen, Pier
One, Bed Bath and Beyond, and William-Sonoma. The home furnishing industry is
highly fragmented. The 25 largest furniture store retailers only account for 22% of the
industry’s sales and 50 of the largest companies only account for around 30% of the
market (First Research). Due to this vast segmentation we had to reevaluate our
competitors. Stores like Dillards and Bed Bath and Beyond sell more than just furniture.
When comparing these types of firms to Havertys we found that we often
underperformed. However, when compared to firms that just sold furniture like Ethan
Allen and PierOne Imports we were more on par with the industry average. Because the
industry is far from homogeneous, it is a mixed industry, competing on both cost
leadership and differentiation strategies. Havertys competitive advantages include

6 | P a g e
brand image, customer service, and distribution which lends itself to competing mostly
on a differentiation strategy. The home furnishings industry has high industry
competition, high rivalry among existing firms, high threat of new entrants, and a
moderate threat of substitutes. The industry also has high bargaining power of both
customers and suppliers. As mentioned before, the home furnishing industry’s key
success factors are cost leadership and differentiation. Slight differences in competition
strategies can positively or negatively affect the success of a firm. The goal of each firm
is to increase product differentiation while keeping costs at a minimum. In doing this, a
firm is able to grab a larger share of the home furnishings industry.
Accounting Analysis
Analysis of accounting policies and procedures is done to establish the flexibility
of accounting policies, to establish and critique key accounting policies, and to scrutinize
the level of disclosure. This process is aimed at pinpointing the any possible distortions
caused by accounting procedures, as well as assess the quality of disclosure of the
government required annual disclosure. The source used in this process is the 10-k.
Specifically, the balance sheet, income statement, statement of cash flows, and finally,
any footnotes having to do with accounting policy. In the end key accounting policies
should be aligned with the firm’s key success factors in order to create value. The
flexible accounting policies for Havertys, as with most firms in the home furnishings
industry, revolve primarily around operating leases. The showrooms these firms need
are very large and often firms in this industry use operating leases. However, Havertys
operating leases are significant enough that their financials should be restated to
capitalize their operating leases. This discrepancy, when adjusted, can impact their
financial statements greatly. After our restatements you can see vast changes in:
assets, liabilities, stockholder’s equity, retained earnings and net income. By capitalizing
these leases an investor will get a better picture of the firm. Another major flexibility for
firms in the industry is post retirement benefit plans. Because the firm chooses the

7 | P a g e
discount rate to use when estimating the plans, potential error loom in the distance.
Just one percent off on a discount rate can cost the firm upwards of $1.5 million,
severely impairing a firm’s ability to pay its plan expense (Haverty’s 10-k). Another
accounting flexibility is the firm’s ability to choose a defined benefit or a defined
contribution retirement plan to its employees. A defined benefit plan can cripple a firm
if the proper discount rate is not used when calculating returns. The degree to which
Havertys discloses information on decisions it makes to come up with its calculations is
high. They do a good job describing how they calculate their number so the investor
can understand how the company makes money. The footnotes and the appendices
give ample amounts of information on how they came up with their numbers. Havertys
is a transparent company, which is beneficial with flexibility in their leases and
retirement plans.
Financial Analysis, Forecast Financials, and Cost of Capital
The financial analysis consists of financial ratios used to evaluate the liquidity,
profitability, and capital structure of a company. Investors and Analysts use these ratios
to help compare a firm to its competitors and help in forecasting the firm’s financial
statements. Ratios are the key tools used when evaluating a firm’s profitability and
growth to find its value. Liquidity ratios measure the firm’s liquid assets used to help
pay-off the firms current liabilities. The liquidity ratios are composed of the current
ratio, the quick asset ratio, the inventory ratio, the days inventory ratio, and the
working capital turnover. Havertys seems to maintain a healthy liquidity with a few
problems in operating efficiency, but its moving in the right direction. There are six
profitability ratios: gross profit margin, operating income margin net profit margin,
asset turnover, return on equity, and return on assets. We used these ratios to
determine that Havertys will struggle to have positive growth rates and profitability. The
capital structure ratios consist of; debt to equity ratio, times interest earned, and debt
service margin. These ratios show how firms raise funds for capital expenditures.
Accurately forecasting a firm’s financial statements is important because it will enable
you to get a glimpse of what the structure of that firm may look like in the future. Most
forecasts are done by using industry averages or ratios derived from a firm’s past
8 | P a g e
financial statements. A few forecasted ratios that we derived are; CFFO/net Sales ratio
of 5.98%, current ratio of 1.71, asset turnover rate of 1.78 (steady in 2010). To
estimate the cost of capital we first computed the cost of equity (11.38%). There are
two different method used to compute the cost of equity- the Regression Analysis and
the Back Door Method. We initially tried to estimate it by running regressions, but this
proved to give us inadequate information for calculating the cost of equity. We then
turned to the Back Door Method, which proved to be sufficient. Next, we calculated the
weighted average cost of debt (4.47%). To achieve this, we multiplied the short term
and long term debt of the company by appropriate interest rates. Once we had both the
cost of equity and the cost of debt, we could compute the Weighted Average Cost of
Capital (8.62%) by plugging these two factors into the WACC formula.
Valuation
After the industry analysis, accounting policies, and financial ratios are examined,
an analyst can determine a firm’s share price through equity valuations. Using the
method of comparables and various intrinsic models of valuations an analyst can
conclude if a firm share price is fairly valued, undervalued, or overvalued. The first
valuation model used to formulate a share price for Havertys was the method of
comparables. The Method of Comparables utilizes ratios that are then compared to
ratios of firms throughout the industry. Using comparable ratios is an easy way to place
a firm within an industry, but it lacks explanatory power and intellectual value is difficult
to add. However, these ratios did not reveal whether or not Havertys is fairly valued or
not. Only the PEG and dividend Yield models suggest that Havertys is fairly valued,
while Price to Book, Enterprise Value to EBITDA, Forward P/E, and the Price to Free
Cash Flow show Havertys to be undervalued. Still, Trailing price to Earnings and Price to
EBITDA show Havertys to be overvalued. In order to get a more accurate valuation we
needed to calculate a second set of valuation models. The second set of valuation
models we used were the intrinsic valuation models. These models include the Dividend
Discount Model, Free Cash Flow Model, Residual Income Model, Long Run Residual
Income Model, and the Abnormal Earnings Growth Model. These models range in

9 | P a g e
degrees of reliability based on the sensitivity they have to errors in growth rates,
WACCBT, and cost of equity. The free cash flow model and the dividend discount model
are especially sensitive and should not always be relied upon. However, the residual
income model, the long run residual income model, and the abnormal earnings growth
model are used by most analysts because of their liability. They are less sensitive to
errors in the estimated growth rates and cost of equity. In order to run these models
we assumed a cost of capital of 11.28%, a WACCBT of 8.62%, and a cost of debt of
4.47%. Using these rates we were able to determine that the price per share for
Havertys is overvalued. The Free Cash Flow Model was the only intrinsic model to show
that Havertys stock price was undervalued. However, as we mentioned before this
model is not very reliable and sensitive to error. For this reason we based our decision
off of the other four models to conclude that Havertys is overvalued.
Business and Industry Analysis
Company Overview
Havertys Furniture Companies Inc. (HTV) is one of the top home furnishing
retailers in the nation. Over 120 years ago, J.J.Haverty founded Haverty Furniture
Collection in downtown Atlanta, Georgia. A few years later the firm spread throughout
the South and Midwest and in 1929 they became publicly traded. Today there are over
120 stores throughout 17 states and they sustain continued success. Havertys also
provides its customers a, “revolving charge credit plan with credit limits determined
through our on-line credit approval system and an additional credit program outsourced
to a third party finance company” (Havertys 10K). Havertys headquarters remains in
Atlanta, Georgia.
Havertys sells residential furniture, accessories, and bedding and maintains a
wide selection of products and breadth of styles in the middle to upper-middle price
ranges. With the introduction of the Havertys Collections in 2005, nearly all the
merchandise offered is Havertys brand product. The graph below shows the breakdown
of revenue generated from the different products sold in 2006.

10 | P a g e
Industry Overview
The home furnishing industry is highly fragmented. The 25 largest furniture store
retailers only account for 22% of the industry’s sales and 50 of the largest companies
only account for around 30% of the market (First Research). Several of the larger home
furnishing retailers include Havertys, Ethan Allen, and Pier One, with most of them
grossing less than $1 million in a year.
In the beginning of this valuation project we included Dillards, Bed, Bath &
Beyond, Williams-Sonoma, PierOne Imports, and Ethan Allen as competitors in our
industry. However, throughout our evaluation of Havertys we concluded that not all of
the companies are actually direct competitors of Havertys. Stores like Dillards and Bed
Bath and Beyond sell more than just furniture. When comparing these types of firms to
Havertys we found that we often underperformed. However, when compared to firms
that just sold furniture like Ethan Allen and PierOne Imports we were more on par with
the industry average.
Many retailers within this industry operate similarly. Like Havertys, the typical
furniture store includes living room, bedroom, kitchen and office furniture, with a
possible mattress and children’s section. The industry considers these “case goods.”

11 | P a g e
“Most store operations include sales management, merchandising, inventory
management, and credit financing” (First Research).
Most profit within the home furnishing industry comes from merchandising and
marketing. Many firms rely on discounts, special offers, and sales to boost revenue
since furniture is not a necessary good, but a specialty good. This also causes home
furnishings sales to be highly sensitive to economic changes. Home furnishing sales are
known to be strongly associated with sales in the housing market. Their has recently
been a weakness in the housing industry, which in turn is putting a noticeable strain on
home furnishing retailers, causing many to go bankrupt. Kathy Shwiff of the Wall Street
Journal writes explaining the recent fall in house prices. “These are tough times for U.S.
homeowners... The decline was the largest since April 1991; prices have dipped for 23
consecutive months” (Home Prices Fall. Homeowners in a bind).
One way in which home furnishing retailers are combating this problem is
through purchasing cheaper imported goods, which has caused a major influx of these
imports into the market. Also, many retailers are turning to in-store brands and internet
retailing, which allow them to “price-down” their merchandise and increase growth. The
adoption of two competitive advantage strategies; cost leadership and differentiation,
are also allowing firms to keep afloat during this economic downturn.

12 | P a g e
Five Forces Model The Five Forces model is an implement that forms an industry and investigates
its profitability. These competitive forces help illustrate the industry’s strengths and
weaknesses. The forces can be classified into two categories: the degree of actual and
potential competition, and the bargaining power in input and output markets. The first
category includes the rivalry among existing firms, the threat of new entrants, and the
threat of substitutes. The second category consists of the bargaining power of
customers and the bargaining power of suppliers. The purpose of this section is to
depict the furniture industry’s structure and profitability.
Havertys Furniture Companies, Inc. Home Furnishing Industry
Industry Competition HIGH
Rivalry Among Existing Firms HIGH
Threat of New Entrance HIGH
Threat of Substitute Products MODERATE
Bargaining Power of Customers HIGH

13 | P a g e
Rivalry among Existing Firms
It is extremely important to evaluate the rivalry among existing firms when
investigating an industry’s profitability. The furniture industry is a highly competitive
and sensitive market. Rivalry among existing firms has many factors affecting it, such
as industry growth, level of concentration, differentiation, economies of scale, fixed and
variable costs, excess capacity, and exit barriers.
Industry Growth:
The first step to measuring the rivalry among existing firms is to determine the
industry’s growth rate. The furniture industry currently includes nearly 20,000
companies. Due to the fact that this industry relies heavily on economic conditions, the
furniture industry has a slow growth rate. The growth rate has been unstable
throughout the last five years (as indicated in the graph below). When the growth rate
is unstable or slow, it is more difficult for a company to obtain the limited market share.
The low level of growth rate highly increases the amount of competition in existing
firms. Some firms have been forced to turn to bankruptcy from the unstable economic
conditions.
Bargaining Power of Suppliers HIGH
Competitive Advantage BRAND, IMAGE, CUSTOMER SERVICE, & DISTRIBUTION

14 | P a g e
*Information from First Research
As Shown in the graph above, the highest peak of furniture sales was in 2004
and lowest in 2003. The graph includes all members of the furniture industry; including
stores such as Havertys, JC Pennys, Dillards, Crate & Barrel, Sears, Ethan Allen, Wal-
Mart, and private “mom and pop” stores. Household furniture sales are closely linked to
home sales, and office furniture sales are closely linked to the employment rate and the
development of new businesses. The industry forecast for the next five years is
expected to grow at an annual compounded rate of five percent (firstresearch.com).
Furniture Store Net Sales
2002 2003 2004 2005 2006
Havertys 703,959 744,635 784,162 827,658 859,101
Bed Bath &
Beyond
2,927,962 3,665,164 4,477,981 5,147,678 5,809,562
Pier One 1,548,556 1,754,867 1,868,243 1,897,853 1,776,701
Ethan Allen 907,264 955,107 949,012 1,066,390 1,005,312
Measured in Thousands ($)
* Information provided Company’s 10-K

15 | P a g e
The chart above shows the publicly traded stores that are strictly related to
furniture. By comparing the two charts above to each other, you’ll see how the net
sales of the stores that are strictly related to furniture compare to the growth rate of
the entire industry. The chart below compares the sales growth between Ethan Allen
and Havertys. Ethan Allen is Havertys most direct competitor.
Sales Growth (%)
2002 2003 2004 2005 2006
Havertys 3.80% 5.78% 5.31% 5.55% 3.80%
Ethan Allen 0.35% 5.27% -0.64% 12.37% -5.73%
Concentration:
Since the furniture industry has numerous firms and is price aggressive, it is a
low concentrated industry. A low concentrated industry increases the level of
competition between the existing firms. There are a total 20,000 firms in the United
States furniture retailing industry. The 50 largest companies hold only 30 percent of
market share, making it a highly fragmented industry (firstresearch.com). The large
majority of companies operate a single store. The most commonly known large
companies include Bed Bath & Beyond, Pier 1 Imports, Ethan Allen, and Havertys.

16 | P a g e
*Information provided by Company’s 10-K
The chart above provides three of the top fifty firm’s market share over the past
five years. Pier One consists most of the market, while Havertys consumes the least
amount the market share. The market share is derived for each of the company’s net
sales.
Differentiation:
There is no brand loyalty in the furniture industry, so firm’s have to differentiate
themselves from other’s to make profit and decrease the competiveness. Firms can
achieve this by having a specialty store, specialty products, high or low prices, or
certain styles or trends that attract consumers. Chains, such as Ikea, Dillard’s and Crate
& Barrel, have grown as companies because they emphasized on style rather than
price. Nearly 10 percent of the firms have license agreements to use famous names
(firstresearch.com). Firms often use these licenses or specialty products to gain profits.
House plans over the next few years are expected to include more multi-purpose

17 | P a g e
rooms, such as media rooms and exercise rooms. To decrease competiveness, firms are
deciding to specialize in a particular type of furniture. Pottery Barn has opened a
Pottery Barn Kids. This is a specialty store that obtains only to children’s needs. There
are not as many Furniture stores directly for children, so by doing this they have
differentiated themselves from other furniture stores.
Switching Costs:
Switching costs are known as the “negative costs that a consumer incurs as a
result of changing suppliers, brands or products” (investopedia.com). Switching costs
are mainly due to monetary reasons, but also can be based upon psychological and
time issues. Customers are willing to take their business to different companies, making
the furniture industry have low switching costs.
Economies of Scale:
Economies of scale is the increase in the size of a firm, which in turn decreases
the average cost of each unit of production. There are two different types of economies
of scale: external and internal. External economies of scale is when the cost per unit
depends on the industry as a whole. Internal economies of scale is when the cost per
unit depends on the firm as an individual (ivestopedia.com). An industry with high
economies of scale is highly competitive. In many industries, the size of the firm
establishes its success and profitability. In the furniture retailing industry, only 30
percent of the market share belongs to the top 50 firms, leaving 70 percent to the
smaller companies. This makes it to where smaller companies can co-exist and compete
with large firms. The furniture industry has high economies of scale and is exceedingly
competitive.
Fixed-Variable Costs:
Variable costs and fixed costs can impact the level of competition in an industry.
The furniture industry has high fixed costs. The cost of selling furniture is high itself.
Firms can experience different degrees of variable costs. The type of variable costs you

18 | P a g e
will find in this industry is things involved with the inventory, such as cost of goods sold
and gross profit. The fixed costs that you will find involved in this industry are the
operating leases and inventory. The inventory remained a consistent average 24% for
Havertys throughout 2002 to 2006. Due to the fact that most furniture stores own
distribution centers, the fixed costs increase in this industry.
Excess Capacity:
Excess capacity occurs when consumer demand is less than the supply. When
this happens, firms are recommended to cut their product prices to fill capacity. Due to
the low real estate demand, there is an excess capacity in the furniture industry. The
large quantity of stores and small demand of furniture products is also a causing factor.
This increases the level of competition in the furniture industry among all the
companies.
Sales Growth (%)
2002 2003 2004 2005 2006
Havertys 3.80% 5.78% 5.31% 5.55% 3.80%
Ethan Allen 0.35% 5.27% -0.64% 12.37% -5.73%
Pier One Imports 9.71% 13.32% 6.46% 1.58% -6.34%
Bed Bath & Beyond 22.17% 25.18% 22.19% 14.96% 12.86%
*Information provided by Company’s 10-K
The chart above shows the growth rate of the firm’s net sales. If a firm’s sales
are declining, it means that the demand is less than the supply, which creates excess
capacity. In 2005, the net sales begin to decline and continue in 2006. In cases like
this, the firms are recommended to have a sale to increase their net sales. Due to the
lack of demand, the furniture industry has high excess capacity.
Exit Barriers:
Exit barriers make it difficult to exit an industry and make it risky to enter. This
happens when companies have high cost or specialized assets that make it difficult to

19 | P a g e
leave. The furniture retailing industry does not face high exit barriers, although it is
much easier for a smaller firm to leave the industry than it is for a large firm to leave.
In September 2007, the Texas-based home furnishing chain Bombay Co, filed for
Chapter 11 bankruptcy protection (firstresearch.com). Many other small Furniture stores
have been forced to follow this trend due to the downward consistency in the Real
Estate market. Due to the fact that so many companies are going bankrupt, this shows
that the furniture industry has low exit barriers.
Conclusion:
In the furniture industry, there is a high rate of rivalry among existing firms. The
industry is extremely competitive and sensitive. The existing firms are experiencing slow
growth rate, low concentration, difficulty differentiating their products, decreases in
demand, high economies of scale, and high fixed costs.
Threat of New Entrants
The threat of new entrants is degree of harm potential firms can cause by
entering an industry. It is exceptionally high when an industry illustrates a history of
substantial profits. Firms will scramble to penetrate a high profit industry in hopes of
gaining a portion of those profits and market share. However, there are a few things
firms must consider before deciding to enter an industry. In order to gain market share,
new entrants will have to overcome many barriers of entry including: Economies of
Scale, First Mover Advantage, Access to Channels of Distribution, Relationships and
Legal Barriers. Fortunately, for those interested in the 85.3 billion dollar home
furnishings industry, there are very few barriers to entry. Although this means a
possible easy entrance for potential firms, it also results in existing firms having a high
risk of diminishing revenues and profits.
Economies of Scale

20 | P a g e
Economies of scale involve the increase in the size of a firm which in turn
decreases the average cost of each unit of production. In an industry with large
economies of scale and high competition, potential firms may not have what it takes to
compete. The furniture industry has both high economies of scale, intensely
competitive, and vastly segmented. Many firms are included under the home
furnishings industry including: Dillard’s, Ethan Allen, Havertys, CostCo and Pier One
Imports. However, not all of these firms sell just furniture causing major differences in
the amount of total assets each firm holds. However, being this segmented does break
down a barrier to entry for potential firms especially because major players in the
industry only hold a total 30% of the market share. That leaves 70% to smaller
economies of scale firms that new entrants can take advantage of.
=

21 | P a g e
The above graphs illustrate the range of total assets over the past five years of
top companies in the highly segmented furniture company. The first graph shows the
total assets of department stores, wholesale clubs and large retail chains. The second
shows total assets of retailers who only sell furniture. These graphs show that
companies with assets in the billions can coexist and successfully compete with firms
who have much smaller amounts of assets. When potential new entrants evaluate
economies of scale they would not find it difficult to compete due to the vast range of
total assets shown by existing competitors. Although the may not be able to compete
with department stores and large chains who have assets in the billions, they could
successfully take on smaller chains and local retailers.
First Mover Advantage
First mover advantage is the “advantage gained by the initial occupant of a
market segment” (about.com). The first firm to enter an industry can gain control of
resources that followers may not be able to match. This can include the ability to set
industry standards and establish exclusive selling agreements with suppliers. This could

22 | P a g e
not only lead to extreme brand loyalty with suppliers but with consumers as well. In the
past, being a first mover would not have given you a tremendous advantage in the
home furnishings industry. Consumers did not show extreme loyalty to one store or
another because not one furniture store had everything they needed. It would not be
unusual for consumers to visit multiple stores in search of the cheapest prices and the
exact style they are looking for. However, stores like Furniture Row are now gaining
notice from consumers for consolidating all types of furnishing in to one giant mega
store. Furniture Row understands that consumers don’t have time to shop for
furnishings piece by piece so they have combined specialty home furnishings, mattress
and linens all under one roof (FurnitureRow.com). Not only is this one-stop shopping for
consumers but companies like Furniture Row have tremendous buying power which
allows them to offer products at a cheaper rate. These first mover firms have the
potential to take a large portion of the market share and establish brand loyalty with
suppliers and consumers.
Channels of Distribution
Historically the high cost of developing a new channel of distribution would be a
challenge that potential entrants to the industry would have to face. However, with the
furniture industry experiencing major changes it is not impossible for potential firms to
compete. The furniture industry is showing an increased trend of shifting to the internet
to distribute their product. “Internet sales, although a still a small fraction of total sales,
are increasing rapidly because prices are discounted by 30 to 40 percent”
(firstresearch.com). These discounts are due to the elimination of showrooms and sales
staff. Acquiring stores in high traffic areas, advertising, and paying employees
commission create high operating costs for firms. The graph below shows the average
salary a firms pays to employees per hour.
Average Hourly Earnings & Annual Wage Increase
Bureau of Labor Statistics

23 | P a g e
*Provided by FirstResearch.com
Although slowly increasing employee wages is a huge operating cost firms must
face. Employees must be trained and very knowledgeable hence their almost $15.00 an
hour wage. Internet companies on the other hand, can get away with paying
employees minimum wage because consumers only contact them in the case of a
problem with an order. The high cost of a physical showroom is also eliminated in favor
of a virtual showroom for employees to browse. Overall, this new channel of distribution
opens the door for new entrants to easily gain market share.
Another factor for potential new entrants to consider is the location of their
distribution channels. Furniture companies usually offer same day or next day delivery
service. It is really important to have strategically placed distribution centers so firms
can keep costs low. Haverty’s for example just recently reconfigured their distribution
channel to a combination of three distribution centers, three home delivery centers and
approximately 14 local market cross-docks (Havertys 10k). This has significantly
decreased the cost and time involved in home deliveries of furniture. It has allowed for
lower inventory levels, less warehouse space, fewer workers, and the ability to enter
new markets without adding local market warehouses (Havertys 10K). Potential new
entrants would need to have well placed distribution centers so they can not only
significantly cut costs but compete with other firms who can ship their merchandise
quickly.

24 | P a g e
Relationships
New entrants to the home furnishing industry will not find it to difficult to create
relationships that will help them gain market share. It is undeniable that many
companies like Havertys with over 100 years of experience have an overwhelming
advantage. Over time they have been able to establish strong relationships with
manufacturers and create customer loyalty. In the past these relationships allowed
firms immense buying power and the ability to lower prices. However, with the industry
moving in to newly chartered waters such as importing goods and internet sales,
existing and potential firms will both have to create new relationships with
manufacturers.
Legal Barriers
Potential new firms must also consider the legal barriers of an industry before
trying to enter. Fortunately for firms looking to enter the home furnishings industry it is
thus far unregulated. Although, for companies who offer credit financing standard state
and federal regulations against deceptive sales practices and laws that regulate the use
of credit financing can be an issue (Firstresearch.com). Also with the industry importing
more and more goods there is a possibility of import policy having a bigger impact on
retailers in the future.
Conclusion
The threat of new entrants in to the home furnishings industry is very high
because there are very few barriers to entry. In this industry large firms can coexist
with smaller ones due to the fact that companies can be profitable without a large
amount of assets and a significant initial investment. There is also potential for new
firms to enter without worrying about not having established relationships with
suppliers and not being the first mover in the industry. There is also room for new firms
to create a channel of distribution. However, firms might have to watch out for legal
barriers in the future. Overall, the threat of new entrants is high and existing firms have
a high risk of diminishing revenues.

25 | P a g e
Threat of Substitute Products
Substitute products can be an intimidating threat to any company because it
increases the company’s susceptibility to decreased profits. Once you know the threat
of substitute products, you are able to more effectively compete in the market.
Relative Price and Performance
The threat of a substitute within an industry is determined by the similarity of
pricing and the function it serves. Within the home furnishings industry, the threat of
substitutes is moderate because all furniture generally serves the same purpose, yet it
has a wide range of pricing.
There are many specialty furniture stores which charge a hefty price tag;
however, the 25 largest retail furniture companies only account for 22% of the
industry’s total sales. The remaining 78% of the industry belongs to mixed market
companies including, “individual local market retailers, larger multiple market
operations, department stores, manufacturers’ stores, ‘lifestyle’ retailers, and wholesale
clubs” (Havertys 10-K). So why do these mixed market retailers carry the majority of
the market? Most of these mixed market companies are able to price their items at a
discount. Also, a customer shopping for shoes may not have to even go to another
store to buy that table they have been looking for.
Buyers’ Willingness to Switch
A customer’s willingness to switch depends on what the individual values. Many
of these incentives include customer service, product quality, range of styles, price,
ease of purchase, the overall experience, and special promotions. Because of the lower
price and ease of purchase, a customer’s willingness to switch among mixed market
retailers which carry furniture is high. However, the small percentage of the industry
which includes the 25 largest furniture retailers heavily depends on the repeat
customer, making their customer’s willingness to switch low. Because these furniture

26 | P a g e
retailers do not dabble in a mixed market, they are firmly established and are able to
offer their customer a quality, style, customer service, and experience which cannot be
found in many mixed market retailers. Between the 25 largest furniture retailers and
the mixed market retailers, the customer’s willingness to switch is moderate.
Conclusion
The way a firm competes is ultimately what determines the resulting danger of
substitute products. There are two ways a firm can compete in the market, low cost
leadership and differentiation. When describing their competition, Havertys explains
that their merchandise, “appeals to customers who are somewhat more affluent than
those of most other competitive price-oriented furniture store chains” (Havertys 10K).
While Havertys competes through low cost leadership, with its integrity of “everyday
low pricing”, it heavily relies on their customer service and brand name to obtain a
competitive edge. Havertys prides itself on having friendly and knowledgeable
employees, accessible financing, and easy and prompt delivery. Havertys also recently
introduced the Havertys Collections brand which carries one-of-a-kind products. This
customer service and brand name is what allows Havertys to obtain a niche within the
industry with which it can overcome the threat of substitutes.
Bargaining Power in Input and Output Markets
While the competition within an industry establishes the possibility and degree of
a firm within that specific industry to experience atypical earnings, markets determine
profitability in the industry. The bargaining power of the industry itself with respect to
the entities supplying goods and services, and the customers purchasing the finished
product are the other factors contributing to buying power. This power to bargain is the
fundamental aspect of the industry’s potential to continue to generate profits. The
home furnishings industry does not stray from this model, but depending on firm’s
place, philosophy, and target market within the industry, the route taken to generating
profits varies immensely. The furniture retailing industry generates massive amounts of

27 | P a g e
revenue $45 billion, spread among 20,000 companies nation wide.
(www.firstresearch.com)
Bargaining Power of Customers
Bargaining power of customers is the power that consumers have over firms as
far as price is concerned. It is important because if the customers of an industry have a
lot of bargaining power, they can set the price and make it hard for firms to turn a
profit. A major goal of the home furnishings industry must be to gain an accurate view
of its customer’s power over the industry as a whole. But in order to obtain an
understanding of customer’s power, the industry must know the demographics of its
customers in order to better understand their tendencies. Without a thorough
understanding of who purchases an industry’s products, the industry is helpless in
determining what customers want, as well as who they are, and what they can afford.
The home furnishings industry is an industry has two primary target markets.
According to www.firstreseacrch.com they are the Baby Boomers (ages 40-55), and
their children. The industry explains its focus on the Baby Boomers because they are
said to be at “peak earnings and have paid off their mortgages”. Likewise, their children
are a target of the home furnishings industry because they have a large proportion of
discretionary income and relatively few financial obligations (www.firstresearch.com).
Therefore any change in the economy in a downward trend would severely impair this
industry’s ability to make a profit. Also, one of their target markets, the Baby Boomers
is getting older and during this stage, fewer will continue to buy new furniture. This
could hurt the industry’s profits as well and could cause them to look elsewhere for a
new market.
There are two main aspects of the bargaining power of customers that unite to
establish the power of customers with respect to the industry. These factors are
expressed by: price sensitivity, and relative bargaining power. In the case of the U.S.
furniture retailing industry, it experiences pressure from and extends pressure to
customers. Industry analysis done by First Research® on the furniture retail industry
suggests that gross margins with respect to profit are “high” nearing 50 percent. This

28 | P a g e
suggests that customers have little power over firms on price (www.firstresearch.com).
However, many firms in the industry have chosen to enter into the market that has little
differentiation in order to compete on a low cost approach. This is an interesting
strategy because the selling expenses in the industry are extremely high due to the
amount of space needed to showcase the product, and the cost of paying sales people.
It is estimated that net income as a percentage of sales in the furniture retail
industry ranges between zero and 5 percent (www.firstresearch.com). This is true for
Havertys as well as most of its competitors. Thus, firms in this particular industry have
such a small margin for error, that selling undifferentiated products as a low cost
provider is extremely risky and requires precise and well researched financial decisions.
This approach could mean that bargaining power is slowly changing hands to the
customers and firms in this industry are risking it all in order to meet those new
demands. Or it could mean that firms in the industry are breaking the mold of the
classic furniture retailing business which involved locally owned businesses. Because
furniture sales are connected tremendously to home sales, one might contend that
customers as a whole do have some bargaining power, but that power comes at a cost
to everyone, since both are affected by the stability or the lack of stability of the
economy.
Price Sensitivity
Price sensitivity is the first factor that determines the customers bargaining
power. It is characterized by the degree to which customers will be willing to negotiate
on price. Price sensitivity occurs primarily within markets that the Industry’s products
have become undifferentiated and the switching costs for the customers are nominal.
For the firms in the home furnishings industry that sell the higher end merchandise,
price sensitivity is fairly low. However, firms in the industry that sell low end
merchandise experience relatively high price sensitivity. As stated previously, the
industry gross margin, according to www.firstresearch.com, is almost 50 percent,
primarily to cover the enormous cost of selling these items, including showroom space,
and advertising, as well as low inventory turnover. At first glance, this might seem like

29 | P a g e
price sensitivity would be low, but with further investigation it appears that firms in the
industry, especially the firm’s aspiring to be low cost leaders where brand loyalty
disappears, fight it out over price and credit terms. Furniture is a fairly big ticket item
and for companies like Havertys and Ethan Allan rely on brand loyalty and customer
service rather than pricing. Conversely, with firms such as Ikea and Bed Bath and
Beyond, price sensitivity does come into play. Therefore, price sensitivity of customers
does play a major role in this particular industry since the 50 largest firms in the
industry only account for approximately 30 percent of the revenue according to the
industry analysis done by First Research (www.firstresearch.com). A majority of the
sales are fought out by locally owned furniture stores that are trying to appeal provide
low cost leadership.
Relative Bargaining Power
Relative bargaining power may be realized only when customers of a product can
obtain a strong bargaining position against firms in an industry. This bargaining position
is established by the number of patrons relative to the firms in that specific industry.
Other factors can include, but are not limited to, volume of purchases made by a sole
client, switching costs, and the quantity of alternative products obtainable by the client.
This relative bargaining power is split between patrons and firms within the
home furnishings industry. There are over 20,000 firms competing in this industry, and
most of them are small, single store operations. Customers have many choices when
choosing furniture, but prices in general must go up across time. This is due to the
nature of the products sold in this industry. The primary raw material used in the
creation of the finished product is and will most likely continue to be wood. Moreover,
forest reserves are declining. The rate at which they can be re-planted and harvested
again cannot keep up with ever increasing demand. Thus, wood laminates and other
alternatives are becoming more prevalent because they are less costly, less harmful in
terms of the environment. This trend to be green could be a way for firms in the
industry to find cheaper, less damaging materials.

30 | P a g e
Switching costs are low for consumers, but can be high for firms, especially ones
that focus on one brand or style. However, these firms are usually insulated from price
sensitivity because of the higher end merchandise they sell. Relative bargaining power
within this industry, especially in the near future will be overshadowed by the
continuing sub-prime mortgage defaults, and the ever decreasing home sales. In the
long run relative bargaining power of customers within this industry will be fairly high
primarily due to their lower switching costs. The implications of this for firms are very
important as far as their profit drivers are concerned because the more power the
customer has, the less a firm can charge. Firms in the industry will have to take
opportunities when they present themselves and find them when they don’t in order to
be profitable in this industry.
Conclusion
Although there are a multitude of factors that effect different ends of the home
furnishings industry, it appears that the power of the buyer has become an increasingly
large factor in the industry. Firms in this industry must regain power over their buyers
to be able to withstand an economic downturn like the one being experienced right
now.
Bargaining Power of Suppliers
The home furnishings industry is supplied by a few recognizable brand names
like Havertys and Ethan Allan, and an large amount of low cost furniture producers like
Ikea. Together they make up the home furnishing industry’s suppliers. These suppliers
have gone the way of many industry suppliers over the past few years, and the
suppliers with well recognized names are attempting to enter the industry themselves.
These companies are attempting to cut out the middle man in an attempt to make
higher profits and over power smaller entities within the industry to gain market share.

31 | P a g e
In order to turn a profit, an industry must haggle with suppliers that the firm
must acquire its raw materials, labor, finances, and other miscellaneous elements.
Understanding whether the industry has the power over its suppliers, as is the case for
much of the large retail industry, is fundamental to valuing actual realizable profit
growth for the industry. The better the industry can haggle over prices, the better the
potential for higher profits industry wide. As stated previously, the buyers of the home
furnishings industry have a substantial amount of power, therefore firms in the industry
need to have power over suppliers in order to be very profitable. Unfortunately for the
firms in the industry, suppliers are deciding to enter the industry themselves. By doing
this, the suppliers are positioning themselves in direct competition to their old clients,
and are forcing them to go elsewhere for product.
Bargaining power of the supplier is considered high when there are few
companies in an industry and they have few substitutes, or because their product is
highly differentiated. Subsequently, suppliers can actually control industry prices and
possibly manipulate distribution agendas to maintain dominance. Conversely, if there
are many suppliers with low product differentiation, the firms of an industry can have
power over its suppliers. In the home furnishings industry, there are many suppliers for
low end furniture, but few for higher end merchandise. Therefore, depending on what
type of furniture a firm sells, it could experience high bargaining power, or low
bargaining power.
Within the home furnishings industry, firms are subject to the power of suppliers
like Thomasville and Stickley. There are relatively few suppliers of high quality furniture
and brand image can be very important to the customer that can afford such items.
Also, suppliers have an edge because many of the big suppliers like Ethan Allan have
decided to open their own showrooms and sell their furniture directly to the public,
effectively bypassing the middle man and driving costs down while they enjoy a much
larger profit; this new phenomenon, however, primarily only affects the higher end
furniture merchandisers.
Price Sensitivity

32 | P a g e
In this part of the model price sensitivity is again a factor that can attribute
bargaining power to one entity or the other. In this case it is suppliers and the home
furnishings industry. Price sensitivity can be very high in this industry especially with
respect to the low cost leadership side. Switching costs are low for the firms in this
arena, and that gives them power over the suppliers.
However, at the higher end side of the industry where brand name matters,
firms can have little power over their suppliers. This is especially true over the past
couple of years since the manufacturers them selves have begun to market their
products including the afore mentioned Ethan Allan example. This has hurt some
companies and caused them to think outside the box. Companies like Havertys foresaw
this phenomenon, according to their 10-K, and created their own brand name.
According to their 10-K, Havertys has competed with their main competitors by
outsourcing about 60% of the production of their goods to China.
Since the majority of the companies in this industry are small local stores we are
forced to conclude that the home furnishings industry is forced by its suppliers to pay
higher prices because most of these smaller stores can buy in the bulk like a big
corporation could and receive a lower price. Therefore, due to the large number of
small firms in this particular industry, the suppliers tend to have the upper hand and
retain bargaining power over the firms.
Relative Bargaining Power
The relative bargaining power of an industry has the potential of greatly affecting
the final price of goods to the customer. In this time of economic recession, bargaining
power is extremely important, but it is important in any economic situation. For low end
home furnishings retailers relative buying power of the supplier is fairly low because
firms have many sellers to choose from to get essentially the same product. But if a
firm conducts business in a market in which brand name is a major factor, relative
bargaining power for the supplier is high and the firm is subject to the decisions of the
supplier, on price, when getting their product. This has the potential of severely
impairing a firms profits due to the fact that they actually make so little on what they

33 | P a g e
sell. This is particularly true with suppliers who have decided to open their own show
rooms and sell their furniture directly to the customers.
The majority of the merchandise sold in the industry is lower end merchandise,
but the majority of the revenue gained in this industry is realized in high end, low
turnover type merchandise like bedroom sets and china cabinets rather than lamps and
accents. Due to this fact, it is difficult to attribute bargaining power to the industry as a
whole, because the industry is so fragmented between high and low end merchandise.
However, one could feasibly contend that the suppliers have more bargaining power
relative to firms in the home furnishings industry. For retailers focusing on high end
merchandise, switching costs are very high, while undifferentiated merchandise enjoys
low switching costs. Another reason that suppliers have higher relative bargaining
power is that due to retail consolidation, fewer styles are in production. This means that
firms are getting less and less choice in the merchandise they can purchase to sell
unless they design their own, which is impossible for a majority of the small firms who
primarily populate the industry, but lack the ability to produce their own furniture.
Conclusion
The bargaining power of suppliers in the home furnishings industry plays a major
role in the cost structure, and the ability of firms to be profitable organizations. The
furniture retail industry faces fairly high supplier bargaining power due to the fact that
most of the firms in this industry are small single store operations. Recently, suppliers
are beginning to open their own show rooms effectively cutting out the middle man.
When suppliers need the firms in this industry less, firms will be weeded out and many,
if they cannot differentiate themselves could eventually cease to exist. Some firms do
have bargaining power over their suppliers, unfortunately, their sales do not make up a
large enough portion of the revenues created by this industry to warrant it much power
over its suppliers on an industry level. Due to the fragmenting in this industry between
the high and low end furniture sales, one could contend that they make up two distinct
industries. Also, manufacturers that have entered the industry on their own could be
considered to be in their own industry. In subsequent sections the valuation the firm

34 | P a g e
will give a more definitive answer to this idea. However, as the industry is now,
depending on the type of merchandise sold buying power of suppliers will have a
possibly major impact on cost structure and the ability to make a profit.
Value Chain Analysis
The home furnishings industry is highly concentrated, and experiences high
competition among its 20,000 firms. The ability of a firm to characterize itself within the
industry by accurately recognizing its strengths and its deficiencies is crucial to survival
in this particular industry. Success is realized in this industry by a firm playing off its
strengths in order to gain market share in gain a competitive advantage. Finding this
competitive advantage and then sticking with it is the best way to continue growth at
the firm level, as well as at the industry level.
As is the case for most industries, firms in the home furnishings industry will
attempt to gain their competitive advantage by one of two strategies: cost leadership
and differentiation. Although industry tradition has focused on cost leadership, some
firms are now thriving due to their unique abilities to create differentiation even in low
end the lower end merchandising sector of the home furnishings industry. The industry
is highly fragmented, extremely competitive, and includes a diverse group of
competitors ranging from “national department stores, regional or independent
specialty stores, to dedicated franchises of furniture manufacturers” (Havertys 10-K).

35 | P a g e
Cost Leadership
Traditionally, cost leadership has been the focus of most of the home furnishings
industry. Interestingly, the top 50 firms in the industry only account for 30 percent of
the revenues generated (www.firstresearch.com). This discrepancy suggests that no
one company has a majority of the market share, and that competition is exceptionally
fierce in this particular industry. With few entrance barriers, this industry is wide open
to new competitors with new cost-cutting strategies. Moreover, industry suppliers have
noticed the low entrance barriers and concluded the same. Furniture manufacturers
such as Ethan Allan have entered the industry and have the potential to wreak havoc
on smaller firms, as well as retailers who carry their product line.
Now more than ever, cost leadership is a top priority for the home furnishings
industry because of the downturn in the economy. This industry attempts to market
luxury products and is subject to the volatility of the housing market. Thus, times will
be harder.
Low input costs
Input costs include those costs that are associated with the cost of doing
business. For the home furnishings industry, the most notable example of the lowering
of input costs is the internet. Many companies in the industry sell exclusively on the
internet and that significantly reduces costs because they don’t utilize costly showrooms
or warehouses, but order directly from the manufacturer (www.firstresearch.com). Also,
many of the traditional firms in the industry have utilized the internet to gain name
recognition and to display their products with very little cost associated, and virtually
unlimited exposure to their target markets.
Efficient Production
Efficiency has been a focus in American business for a several years, and home
furnishings industry does not break the mold. Efficiency within this industry is
imperative. The gross margin in this industry is close to 50 percent (www.first

36 | P a g e
research.com), but the high costs of maintaining a large showroom, low product
turnover, distribution costs, and advertising expenses soon take up most of the
revenue. That coupled with credit sales on the rise and price cutting to draw customers,
this industry actually has very little margin for managerial error.
Suppliers entering the industry have also done much to spur the focus on
efficient business in the home furnishings industry. Firms like the Havertys Furniture
Companies Inc., according to their 10-K, have been forced to turn to outsourcing the
manufacturing of their products to places like China in order to compete within the
industry. Subsequently, severe changes in exchange rates or tariffs have the potential
to lower gross profit on items received from overseas according to the Havertys 10-K.
Another major aspect of efficient production to be considered, especially in the
U.S., is the ability to obtain cost effective marketable products that comply with
Government standards. According to the article Safety Push Focuses on Retailers, The
Consumer Product Safety Commission is beginning to “shift “its strategy in order to
maintain safe products as the bulk of manufacturing is done overseas. The shift would
be to focusing on the quality and safety of the goods entering the U.S. and causing
firms that outsource manufacturing to be held more accountable for the quality and
safety of their products. This directly effects the home furnishings industry due to the
fact that about 30 percent of its goods are now manufactured in China
(www.firstresearch.com). Another article in the Wall Street Journal entitled Some
Stalled Safety Rules For Products May Be Enacted, suggests that The Product Safety
Commission will make several new safety rules including “tougher flammability
standards for upholstered furniture.” The ability of the industry to efficiently adhere to
the new standards is necessary to maintain profitability.
Low-cost Distribution
In order to obtain low-cost distribution at the industry level, the firms in that
industry must be capable of acquiring sufficient technology systems, supply chains,
labor forces, and warehouse capacity. The home furnishings industry’s profitability relies
much on its ability to distribute its products efficiently and at a low cost. Virtually all of

37 | P a g e
the sales in this industry require the product to be delivered to the customer’s home.
According to the Wall Street Journal, oil prices rose 45.3 percent in 2007 alone. With
demand not decreasing, it is getting harder for firms in the industry that rely so heavily
on distribution to make a profit. Companies will attempt to pass the price increases
along to the customer, but that can last only so long.
Efficient management information systems and Information Technology
infrastructure are another major component of low-cost distribution. Firstly, if the
implementation of an efficient management information system in attainable, it will cut
costs caused by unnecessary wages, and more importantly, human error. Since these
systems are used to monitor point-of-sale, credit operations and distribution systems,
the efficiency, reliability, and sharing capabilities of these systems is of utmost
importance to low-cost distribution.
Differentiation
For a majority of the home furnishings industry, the strategy taken to gain a
competitive advantage is differentiation of their product. Differentiation occurs when a
product is supplied by a single entity that is incomparable and it sold at a lower cost
than the price a premium customer will pay. Differentiation is attempted and achieved
in this particular industry via three strategies, or a combination of them. The three
strategies are Superior customer service, more flexible delivery, and investment in
brand image.
Superior Customer Service
The home furnishings industry is a customer service oriented industry. From the
research and development of the products, to the sales person on the showroom floor,
to the set-up and delivery crew, all are run with a focus on customer service. One major
way that the home furnishings industry has explicitly show its focus on customer service
emphasis within the differentiation approach is the fact that the industry as a whole is
moving from focus on their product to style (www.firstresearch.com). The industry
tries to provide experienced sales associates to customers by providing competitive

38 | P a g e
wages, schedule flexibility, and good commissions according to
(www.firstresearch.com). The sales associated are also continually trained to offer
patrons advice and accurate information about the products.
More Flexible Delivery
Value in the U.S. is assessed primarily on speed of delivery. Customers of the
home furnishings industry are no different. They require instant gratification. Therefore
many firms in the industry are focused on timely delivery. Some firms like Havertys are
continuing to make that a priority and hopefully an advantage by building more
distribution centers. In 2005 Havertys built a new distribution center effectively
ensuring the capability of overnight delivery of products to its customers (Haverty’s 10-
K). According to a slaes associate here in Lubbock, firms like Bob Mills furniture are
also trying to simplify distribution with Oklahoma City as its hub for supplying Lubbock
and Amarillo instead of trying to get warehouse space in all three cities. In our society
this is a legitimate avenue for competitive advantage and gaining market share.
Investment on Brand Image
Making one’s brand a highly recognizable and desirable one costs a firm time,
money, and marketing skills. Now that manufacturers are entering the industry, brand
image is becoming more important to the industry as a whole. In order to thwart
competitors some firms are opting to create their own brand in order to gain a brand
image advantage. Firms like Havertys, Ethan Allan, and Ashley furniture have created
their own brand to market so as not to support the suppliers who have entered the
industry. As stated previously, the industry trend is moving from emphasis on product
to an emphasis on style. This gives companies with their own brand a special
opportunity to differentiate themselves and possibly gain an advantage over other firms
in the industry.
Conclusion
39 | P a g e
Firms in the home furnishings industry use both cost leadership and
differentiation strategies in order to gain a competitive advantage. In other words this
industry uses a mix of the cost leadership and differentiation strategies. On the cost
leadership side they use lower input costs, efficient production, and low-cost
distribution to gain an advantage. On the differentiation side firms in the industry use
superior customer service, more flexible delivery, and investment in brand image to
create an advantage.
Firm Competitive Advantage Analysis For Havertys to compete in the furniture industry they must achieve and sustain
competitive advantage. To do this they must use two competitive strategies, cost
leadership and differentiation. Cost leadership is the ability of a firm to offer the same
product as its competitors but at a lower cost. Differentiation is directed more towards
providing a distinct product that will set them apart from their competitors. In order for
Havertys to be profitable they must use these strategies to accurately position
themselves in the industry. Like most high end firms in the home furnishings industry,
Havertys tends to rely on differentiation strategies to distinguish themselves. However,
they do still use cost leadership especially now with the economy going towards a
recession.
Cost Leadership
Cost Leadership is the ability of a firm to offer the same product as its
competitors but at lower cost. Firms can do this with efficient production, lower input
costs, and lower cost distribution. In a highly segmented industry, such as the home
furnishing industry, low prices are not always a major competitive advantage. While
firms like Walmart and Ikea market their furniture as good quality at low prices, others

40 | P a g e
such as Pottery Barn and Havertys sell their superior quality furniture for higher prices.
In fact Havertys clearly states that they do not market themselves as a low cost retailer.
Instead they provide their customers with a wide selection of products and styles
primarily in the middle to upper-middle price ranges (Havertys 10K).
However, with the recent changes in the economy many high end retailers will
have to reevaluate their price positions. Furniture is a discretionary spending item which
makes the stability of the economy an important factor in profits. As of now the
economy has suffered a significant downturn and consequently so has the housing
market. According to the Wall Street Journal, “declining home values can put a chill on
consumer spending, which makes up 70% of U.S. economic activity; people feel less
wealthy and spend less, analysts say.” Needless to say this decline in the housing
market has had a huge effect on the home furnishings industry. Havertys will have to
adopt a few cost leadership strategies in order to keep their net sales and profitability
from declining.
Efficient Production
One way Havertys has lowered costs is by focusing their attention on efficient
production. The production of furniture involves many costly aspects such as elaborate
technology systems, labor forces, warehouse space to hold inventory and
transportation. These high costs have led the industry to shift to importing finished
goods. Havertys has also moved toward this trend and is importing to lower their costs
of production. During 2006, approximately 60% of Havertys purchases were for goods
not produced domestically (Havertys 10K). Havertys is able to import the same quality
product at a cheaper price allowing them to price down their merchandise. They are
also currently working with select Asian manufacturers to increase the level of “direct”
import purchases in 2007 (Havertys 10K). They believe that this will allow substantial
cost savings which will be important with the economy moving towards a recession.
Establishing these relationships and using their ability to import wisely will be an
advantage for Havertys to keep their sales afloat.
Lower Input Costs

41 | P a g e
With the industry moving towards selling their merchandise on the internet lower
input costs have become available. Havertys is one of many stores that have utilized
the internet to lower input costs. Although they do not sell their merchandise over the
internet they do have a sort of “virtual showroom” for customers to browse and check if
an item is available at their local Havertys. This has significantly lowered input costs
such as advertising for the firm. Their entire product line is now only a click away for
consumers. The company hopes to bring more functionality to their website in 2008
which will allow even lower input costs (Havertys 10-K).
Low Cost Distribution
Havertys can also cut costs with lowering their cost of distribution. According to
their 10K Havertys has made “significant investments in their distribution infrastructure
by using a combination of three distribution centers, three home delivery centers and
approximately 14 local market cross-docks.” This recent change in their distribution
channel has provided many low cost distribution benefits for Havertys. It has allowed
for lower inventory levels, less warehouse space, fewer workers, and the ability to enter
new markets without adding local market warehouses (Havertys 10K). All of these
things are cost savers for the firm and allow them to be able to price down their
merchandise. This is becoming increasingly important due to the rising prices of oil.
According to an article in the Wall Street Journal, “oil prices surged from just over $10 a
barrel a decade ago to $100 January 2, 2008.” This is why firms find it so important to
strategically place distribution centers around the country. Not only does it allow them
to ship to their customer quickly but cuts down on gas prices for their delivery trucks.
Differentiation
Differentiation is a strategy that is based on the ability of a firm to offer a unique
product that will set them apart from their competitors. The home furnishings industry
creates competitive advantage mainly with the use of differentiation. In order to do this
a firm will have to identify attributes of their product that customers will value, position
themselves to meet their target customer, and achieve differentiation at a cost lower
than what customers will pay for their unique product. Havertys has done this

42 | P a g e
successfully with the use of superior customer service, more flexible delivery, and large
investments in brand image. With the economy nearing a recession retailers are finding
themselves in trouble if they don’t start to focus on competitive advantage strategies
such as differentiation. An article in the Wall Street Journal explains how “Retailers
turned in their worst monthly sales results in nearly five years, and big chains appeared
to be girding themselves for a prolonged slowdown in consumer spending.” This makes
it even more important for retail chains such as Havertys to differentiate their products
from their competitors to keep stores open and sales up.
Superior Customer Service
If Havertys could pick their strongest competitive advantage it would be their
superior customer service. With over 100 years in the industry Havertys has developed
and maintained a very knowledgeable labor force. To attract and retain qualified
personnel Havertys offers competitive salaries and also enrolls employees in their own
training program. These programs include classes on product knowledge, selling and
management skills classes (Havertys 10K). They find this necessary because they
primarily promote internally. For this reason they find that training and assessment of
their associates is essential to their growth (Havertys 10K). Large employee turnover
can be costly for firms especially if put through rigorous training programs. Havertys
has definitely found a way to maintain their labor force and educate them on the
industry and specifically their products. There is no doubt that when shopping at
Havertys customers will have a knowledgeable source available to them to assist in
their purchasing.
More Flexible Delivery
Havertys prides itself on its ability to deliver their furniture to their customers in
a short time frame. This has become increasingly easy with their recent investment in a
new distribution infrastructure. They have recently moved from five regional
warehouses and 46 local market warehouses to a combination of three distribution
centers, three home delivery centers and approximately 14 local market cross-docks

43 | P a g e
(Havertys 10k). This has significantly decreased the cost and time involved in home
deliveries of furniture. It has allowed for lower inventory levels, less warehouse space,
fewer workers, and the ability to enter new markets without adding local market
warehouses (Havertys 10K). These are all very important in distinguishing Havertys
from its competitors, especially the ability to enter new markets easier. Large costs
come with holding inventory near local markets for fast delivery. With these
warehouses strategically placed it becomes cost free to enter in to a new area which
will help the growth of the company tremendously.
Investment in Brand Image
Brand name recognition is very important in an industry that has over 20,000
firms competing for market share. In order to establish brand image Havertys has made
large investments including the introduction of their own furniture line Havertys
Collections. “These furnishings were developed initially in 2000 with manufacturers
whose names do not carry the same level of customer recognition as Havertys”
(Havertys 10K). This has given Havertys the leverage of overall brand awareness and
the ability to sell these certain manufacturer’s products exclusively.
Conclusion
Havertys has successfully used cost leadership and differentiation to gain a
competitive advantage in the home furnishings industry. They have recently used
efficient production, lower input costs, and lower cost distribution to compete on cost
leadership. This has become increasingly important due to the economy downturn.
They have also focused on customer service, more flexible delivery, and large
investments in brand image. Havertys best sums up their differentiation strategy by
stating on their 10K that they “believe that the quality of the merchandise we offer and
our knowledgeable sales associates, coupled with the ability to deliver purchases within
a short time-frame, are very important to our ability to maintain customer satisfaction.”
All of these strategies coupled together have led to greater competitive advantage and
the ability to successfully compete with other firms in their industry.

44 | P a g e
Accounting Analysis
In order to properly assess the legitimacy of a company’s stock price, analysis of
their accounting policies and procedures is necessary. Because GAAP (Generally
Accepted Accounting Principles) provides leeway for firms in their interpretation and
computation of their accounting numbers, it is essential to evaluate the accounting
policies implemented by the company that lead to the numbers one sees on their
financial statements. Publicly traded companies are required by law to issue information
to the public about is financial standing. This includes a form 10-k which houses a bulk
of the financial information and manager’s divulgence about the goals, and practices of
a company. However, some companies freely give more information than do others.
Therefore, another goal of accounting analysis assesses the degree of transparency
with which managers portray the financial standing of the company, its policies and
procedures. The overall process of accounting analysis involves six stages of evaluation
to assist in determining the quality of disclosure with respect to the accounting
practices and the financial statements. These six stages include: identifying key
accounting policies, assess accounting flexibility, evaluate accounting strategy, evaluate
the quality of disclosure, identify potential red flags, and undo accounting distortions
(Palepu & Healy).

45 | P a g e
Key Accounting Policies
Once a firm derives its industry analysis and is able to assess what business
practices will create value in their industry, it can determine its own key success factors
with respect to its core competencies in order to compete in that industry and gain
market share. The purpose of stage one of the accounting analysis is to assess the
extent to which a firm proactively creates its key accounting policies (KAPs) in order
accomplish key success factors (KSFs). The alignment of KAPs with KSFs is integral to
creating value and validity as a firm.
In a previous section, Haverty’s KSFs were expounded. The key accounting
policies are directly related to those success factors and are used to gain a competitive
advantage within their industry and add value to the company. The key success factors
for firms in the home furnishings industry are stated as: efficient production, lower
input costs, low cost distribution, superior customer service, and investment in brand
image. The implementation of key accounting policies that directly apply to the home
furnishings industry’s identified KSFs create value for the industry, as well as, for
investors.
Efficient Production
Efficient production of product has been achieved by “foreign sourcing” the
production of product to places like Asia and Mexico (Haverty’s 10-k); China being the
main country of production of out sourced furniture. In the4 past five years furniture
imports from China have doubled to $12 billion (www.firstresearch.com). Imports
currently hold about 30 percent of the U.S. furniture market. Some companies like
Ethan Allen produce their own furniture, as well as import it. Haverty’s current
purchases 70 percent of its merchandise, which is currently imported through both
domestic agents, and directly from Asian manufactures. While most companies in this
industry do not want to obtain all imported merchandise directly from foreign
manufacturers, there are significant cost reduction capabilities of decreasing

46 | P a g e
dependence on U.S. agents to acquire merchandise. Below is a chart from Haverty’s 10-
k showing how focused this firm must be in its attempts to lower cost.
Percentage of Net Sales
Percentage Change in Dollars from
Prior Year 2006 2005 2004 2006 2005 Net sales 100.0% 100.0% 100.0% 3.8% 5.5%Cost of sales 50.4 52.2 51.7 0.2 6.5 Gross profit 49.6 47.8 48.3 7.7 4.5 Credit service charge revenue 0.3 0.4 0.6 (19.5) (22.1) Provision for doubtful accounts 0.1 0.1 0.1 (35.1) 81.1 Selling, general and administrative expenses 47.1 45.6 44.5 7.2 8.3 Income before income taxes 3.0 2.9 4.6 8.8 (34.4) Net income 1.9 1.8 2.9 6.3 (33.5) With net income only being around two percent of sales, tight cost control is imperative
to the health of the company.
Lower Input Costs
Achieving lower input costs is another major success factor of firms in the home
furnishings industry. Utilization of the internet for brand awareness and e-commerce is
the most notable avenue explored by firms in the industry. Nearly all firms in the home
furnishings industry have a World Wide Web address. The internet is an extremely cost
effective advertising and direct-to-customer selling entity. This low cost advertising
vehicle has virtually unlimited marketing capabilities. While most firms in the industry
do not use the internet for direct-to-customer selling, increasing amounts of firms are
beginning to implement explore, and utilize this potential. However, internet sales
make up a very minute portion of sales in the industry.

47 | P a g e
One of the biggest costs for a firm in the home furnishings industry is showroom
floor space. It is vital to sell the merchandise, and it is very costly. Therefore, firms in
the industry must know how well their showroom floor space pays off during the year.
This helps asses how well the limited space is utilized on a profit basis. Below is a chart
of the net sales per weighted average square foot throughout the company.
2006 2005 2004 Retail square footage at December 31 (in thousands) 4,208 4,144 4,068 % Change in retail square footage 1.5% 1.9% 3.8%Annual net sales per weighted average square foot $ 206 $ 202 $ 199
(Information from Haverty’s 10-k)
Charts like these are important to firms because the help firms see on a per square foot
basis, how much merchandise they sell.
Another aspect of costs that pertain to selling costs are the costs of the buildings
housing the merchandise. These site are either own by the company, or leased. The
industry standard is to acquire most of the showroom space via operating leases. Below
is a chart from Haverty’s 10-k showing the amount of owned and leased property. This
data is in line with in with most of the industry.
Retail
Locations
Local Market Area
Cross-docks(c)
Regional Distribution
Facilities Owned(a)
47 1 3 Leased(b)
73 13 3 Total 120 14 6
(a) Includes capital leases on two retail stores and includes the four retail stores and a distribution center consolidated under FIN 46.
(b) The leases have various termination dates through 2025 plus renewal options. (c) Of the local market area cross-docks, 9 are attached to retail locations.
Because the home furnishings industry is primarily a big ticket industry, much of
the merchandise sold with in it is on credit. Some firms, like Ashley Furniture make
ridiculous financing opportunities to their customers like no interest and no payments
until 2013. This strategy is good for moving merchandise, but risky in the fact that
terms like that will bring you allowance for bad debt much higher. Firms like Haverty’s
do not offer such incentives to purchase their merchandise, but they do offer no

48 | P a g e
interest for up to 24 months. Although Haverty’s has its own financing subsidiary, they
also choose to use a third party finance company to finance some of their sales. They
have chosen to use their third party financer more in the past few years. Below is a
chart showing the choice of financing for sales of their merchandise.
Year Ended December 31, 2006 2005 2004
Credit Service Charge Revenue $ 2,823 $ 3,506 $ 4,502 Amount Financed as a % of Sales:
Havertys 16.3% 20.7% 21.1 % Third Party 26.2 18.5 20.8
42.5% 39.2% 41.8 % % Financed by Havertys:
No Interest for 12 Months 26.3% 27.8% 42.9 % No Interest for > 12 Months 49.3 47.0 29.7 No Interest for < 12 Months 10.4 11.7 14.3 Other 14.0 13.5 13.1
100.0% 100.0% 100.0 %
As is the case with many firms in the home furnishings industry, receivables accounts
for nearly half of their total sales (first research).
Low Cost Distribution
The accounting policies used attempting to achieve low cost distribution is quite
similar across the industry. One of the main concerns is of course fuel prices. While
most if this cost is passed on to the customer, some of this cost must be absorbed by
the company. Companies across the industry continue to closely monitor their regional
warehouses and distribution centers for way to cut costs. Haverty’s consolidated its
regional five warehouses and forty-six local market warehouses to three distribution
centers, three home delivery centers and fourteen local market cross-docks (Haverty’s

49 | P a g e
10-k). These must all be placed strategically so that all of firms are within a certain,
pre-determined distance of a distribution center, or local cross-dock.
Efficient management information systems and Information Technology
infrastructure are another major component of low-cost distribution. When
consolidating warehouses and creating new home delivery centers and local cross
docks, it is imperative that the information systems implemented create value by
streamlining orders and shipments and give real time information on the whereabouts
of inventory.
Superior Customer Service
The primary way to ensure good employees stay with a firm is to offer them
good benefits. Incentives for quality service are a good way for firms to encourage a
desired behavior and build a loyal workforce. Firms in the home furnishings industry are
no different. In past years, many firms like Haverty’s offered define benefit plans to
virtually all of their employees, but do to rising costs, such offerings are a rarity. At the
end of 2005 Haverty’s ended its defined benefit plan for new employees. However, any
one hired on or before December 31, 2005 was able to receive such an offer. Thus the
company must account for the payment of retired employees that no longer add value
to the company.
Investment in Brand Image
Investment in brand image often requires a relatively large portion of a firm’s
resources. For a firm selling merchandise in the medium to medium-high price range
like Haverty’s, advertising expense is substantial; requiring 7.2 percent of sales in 2006
and 2005 and 7.4 percent in 2004 (Haverty’s 10-k). This money is spent in a variety of
ways form television adds to tabloids. Companies with good brand image like Haverty’s
also put out things like a catalog to showcase their merchandise. But in order to choose
which type of product to advertise most aggressively, a firm must know which part of

50 | P a g e
their merchandise sells the best. Below is a diagram that showcases how Haverty’s
merchandise contributed to total sales. 2006 2005 2004
Merchandise: Living Room Furniture 47.6% 48.3% 48.7% Bedroom Furniture 22.1 21.6 21.8 Dining Room Furniture 12.4 13.4 13.1 Bedding 9.8 9.3 9.4 Accessories and Other
7.8 7.0 6.4 Credit Service Charges 0.3 0.4 0.6
100.0% 100.0% 100.0%
Accounting Flexibility
The ability to which a firm can pick and choose accounting policies within the
Generally Accepted Accounting Principles that best suit the bias of a firm’s management
is known as accounting flexibility. . This simply means that a firm can legally arrive at
certain accounting numbers in several different ways. Usually the method that puts the
company in the best position, at least on paper, is chosen. This flexibility is changed
regularly according to the prerogatives of the FASB, the body responsible for creating
and maintaining GAAP. For Haverty’s, the accounting flexibility resides in three main
areas: operating vs. capital leases, post retirement benefit plans, and self insurance.
Operating Leases v. Capital Leases
Arguably the largest accounting flexibility a firm has is with the classification of
its leases as operating or capital. An operating lease is a lease that offers no vested
interest in the rights of ownership of the asset to the lessee. These leases are not
capitalized. Therefore there is no ownership that appears on the balance sheet of a
firm, only the income statement where expenses are recognized. This becomes very
attractive to firms because they can show a substantially lower amount of liabilities by
creating an operating lease. This, although not a material misstatement legally
speaking, is often very misleading to uneducated investors.

51 | P a g e
On the other hand capital leases are different in nature because they are
associated with rights of ownership. These leases are used to convey certain rights
ownership of an asset of the lessee. These rights of ownership are positive because
they allow a firm to collect money back from interest expense, as well as amortization
and depreciation for each and every year of ownership. However, capital leases are also
associated with risk because of ownership. Firms within the home furnishings industry
typically use a mixture of these leases with operating leases being the most prevalent.
The accounting flexibility in the firm’s ability to choose their desired type of lease can
be either good or bad.
Haverty’s goes along with the industry standard and has about 61 percent
of its leases as operating leases (Haverty’s 10-k). This means that over half of their
showroom costs do not appear on their balance sheet. Were these operating leases
capitalized, both assets and liabilities would be approximately 240,400 than they are
stated on their current 10-k.
Post-Retirement Benefit Plans
As stated previously, until December 31, 2005 Haverty’s offer to its employees a
defined benefit compensation plan for its post-retirement benefits. This means that
each employee will receive a set amount for the remainder of his/her life after
retirement. The degree of accounting flexibility in this particular area is quite
substantial. The firm is allowed to choose the discount rate. Below is a chart describing
the choice of discount rate using a weighted average approach.
2006 2005
Discount rate 5.75% 5.75% Expected long-term return on plan assets 7.50% 7.50% Rate of compensation increase 3.50% 2.75% Source: Haverty’s 10-k
According to Havtery’s 10-k “A one-percentage-point decrease in the discount
rate would have increased 2006 expense for the defined benefit pension plan by
approximately $1.5 million, a 46% change” conversely “a one-percentage-point

52 | P a g e
increase would have decreased expense by $0.1 million, a 5% change and would
decrease the curtailment charge by $5.3 million.” In addition “a one-percentage-point
change in the expected return on plan assets would impact 2006 expense for the
defined benefit pension plan by approximately $0.6 million, an 18% change.” Now the
firm offers a 401k to employees with matching policies that vary by the amount put up
by the employee. Below is a chart that describes the net costs of the pension plans.
Defined Benefit Plan
Supplemental Plans
S l t l Pl
(In thousands) 2006
2005
2004
2006 2005 2004
Service cost-benefits earned during the period
$
3,343
$ 3,030
$
2,529
$ 74
$
68
$
57
Interest cost on projected benefit obligation
3,630 3,344 3,138
183
157
168
Expected return on plan assets (4,452) (4,119) (3,915) — — —
Amortization of prior service cost
123
142
133
34
5
5
Amortization of actuarial gain 389 15 — 15 9 8
Net periodic cost 3,033 2,412 1,885 306 239 238
Curtailment loss 208 — — — — —
Net pension costs $ 3,241 $ 2,412 $ 1,885 $ 306 $ 239 $ 238
(source: Haverty’s 10-k)
Self Insurance
Many firms in the home furnishings industry choose to insure themselves for
certain possible obligations and losses. The most notable areas a firm chooses to self
insure in are “worker’s compensation, general liability, and vehicle claims” (Haverty’s
10-k). These costs are discounted and recorded as a liability by the firm, but there is
flexibility in that again, discount rates are assumed. According to Haverty’s 10-k “a one-
percentage-point change in the actuarial assumption for the discount rate would impact
2006 expense for insurance by approximately $77,000, a 1.5% change.” A material
mistake in these assumptions might not be material, but with margins as close as they
are within this particular industry, they realistically could be.

53 | P a g e
Actual Accounting Strategy
When evaluating a firm’s actual accounting strategy, it is understandable to assume
it requires the manager to make executive estimations or assumptions within the
financial statement. Depending on management’s degree of disclosure and flexibility,
the company can either show a more favorable picture of the company or a more
realistic view of the company.
As we explain in the following paragraphs, Havertys is a high disclosure company
and employs a conservative reporting strategy, which provides investors with a more
transparent view of the firm.
Operating Leases vs. Capital Leases
Havertys financial statements provide a high level of disclosure. However, their
use of operating leases, rather than capital leases, allows them to keep leases off the
books. Instead, it is reported as an operating expense on the income statement. Also,
many companies choose to use operating leases to avoid the risk associated with
owning the property.
Over 60% of Havertys’ properties are leased, and while they fully disclose their
actions using operating leases in their 10-k, this does give the firm a more favorable
stance. If Havertys were to reclassify their operating leases into capital leases, it would
significantly increase their debt, making them look less attractive to potential and
existing investors. This reveals Haverty’s aggressive accounting flexibility regarding their
leases.
The following graph, from Havertys 10-K, summarizes their contractual obligations and
commercial commitments as of December 31, 2006 (in thousands):
Payments Due or Expected by Period
(in thousands)
Total
Less than
1 Year
1-3
Years
4-5
Years
After 5 Years
Long-term debt and lease obligations $ 37,849
$ 10,334
$ 21,441
$ 693
$ 5,381 Operating leases 304,606 30,761 59,132 47,656 167,057 Scheduled interest on long-term debt 8,082 2,626 2,866 759 1,831

54 | P a g e
Other liabilities 12,600 12,600 — — — Purchase obligations 57,700 57,700 — — —
Total contractual obligations $ 420,837 $ 114,021 $ 83,439 $ 49,108 $ 174,269
Estimating Accounts Receivable
Estimating the collectible amount of accounts receivable is another area where
management is required to use judgment. When a company estimates the accounts
receivable, a considerable difference in the estimated and actual write-offs will give the
firm an erroneous view of the firm’s profitability. Many firms might be tempted to
tamper with the appropriate discount rate in order to create a more favorable outlook
for the firms’ investors.
If write-offs for a period are underestimated, then the company would have higher
expected earnings. This increase would be reflected in an increase in stock price,
creating a more favorable view of the company. The opposite holds true if write-offs are
overstated.
While there is temptation to tamper with the expected default rate on accounts
receivable, Havertys attempts to apply a reasonable and accurate default rate.
According to Haverty’s 10-K, it reevaluates its expected default rate at the end of each
quarter based on the status of portfolio balance, portfolio quality, historical charge-offs,
and reasonable charge-off forecasts. Also, accounts are generally written off after nine
months without receiving full payment and even sooner in the case of bankruptcy.
Havertys gives full disclosure of activities regarding estimating accounts receivable in
their 10-K and uses a conservative accounting policy in estimating the expected default
rate.
Impairment of Long-term Assets
Havertys also gives full disclosure of their activities regarding impairment of long-
term assets. In general, when assets are written-off, earnings are directly charged.
Deferring write-downs, however, would not only overstate assets, but overstate

55 | P a g e
earnings. However, Havertys uses a conservative strategy in attempting to accurately
impair long-term assets.
An asset should be impaired if its realizable value falls below its book value.
Haverty’s 10-K states, “If the estimated future cash flows are less than the carrying
amount of the asset, an impairment loss calculation is prepared... An impairment loss is
recorded for the portion of the asset’s carrying value that exceeds the asset’s estimated
fair value.”
Other than this, Haverty’s reserve for impairment of long-term assets is based upon,
“general economic conditions, economic conditions in specific markets including the
impact of new competition, the fair market value of owned properties, our ability to
sublease facilities and the accuracy of our related estimates” (Haverty’s 10-K).
Pension Plans
Pension plan costs require assumptions for future wage and benefit rates, worker
retirement rates, life expectancy of retirees, and the discount rate. If these forecasts
are too low, Havertys’ benefit obligations (a liability) as well as their expenses will be
understated, resulting in overstated earnings. Havertys’ 10-K states that these
assumptions are reviewed annually and “compared with external benchmarks to ensure
that they appropriately account for our future pension and retirement benefit
obligations.” While it is difficult to determine if these are fair and accurate
assumptions, many of Havertys competitors share a similar discount rate regarding
pension plans (around 5.75%).
Self insurance
Havertys is self insured because of losses regarding worker’s compensation, general
liability, and vehicle claims, and their reserve is based on their historical claims data.
This estimate is discounted and recorded as a liability. Management might have
incentive to underestimate these reserves, which would lead to overstated earnings;
however, since the discounted estimate is based off of actual historical data, it is safe to

56 | P a g e
assume the rate is not manipulated. This shows Haverty’s conservative accounting
strategy regarding their estimate on insurance reserves.
Quality of Disclosure
All publicly traded companies are required to disclose information regarding their
finances in a report called a 10-K. Information in this 10-K will reveal the internal well-
being of the company and its quality of disclosure is crucial in determining a fair and
true evaluation of the firm. To determine the quality of disclosure within the report, we
must evaluate management’s accounting strategy. While companies must disclose
certain financial information, they hold the ability to divulge their strategic accounting
methods. Some firms choose to take advantage of their accounting flexibility and report
higher earnings, which is more favorable to potential investors, while others choose to
report with accuracy being the main goal. As we determined in the previous
paragraphs, Havertys is a high disclosure company.
Apart from strategically using operational leases over capital leases, which
reduce their debt, Havertys leans toward a more conservative accounting policy. This
conservative accounting policy, along with providing high disclosure of their accounting
information, provides the potential investor with a transparent and more comfortable
view of the firm’s operations.
Quantitative Analysis of Disclosure
There are two techniques used to analyze financial statements to determine
whether they have been manipulated. These two methods are known as the Sales
Manipulation Diagnostic and the Expense Manipulation Diagnostic. Both of these
methods have a set of ratios used to conclude if a company has tampered with their
financial statements. If there is a major change in a ratio that does not follow the
industry trend, there is speculation of manipulation and it should be further inspected.
The Sales Manipulation Diagnostic ratios consist of comparing a company’s net
sales to other accounting features found in each company’s 10-K. The features that are

57 | P a g e
used in a sales manipulation diagnostic are composed of the cash from sales, net
accounts receivables, inventory, and unearned revenues. These ratios are formulated to
determine if a company changed some factors around the net sales to embody their
performance.
The Expense Manipulation Diagnostic signifies whether a company incorrectly
reports their financial statement by understating their assets or liabilities. Some of the
features that are included in the expense manipulation diagnostic consist of the asset
turnover, accruals, and expenses.
Sales Manipulation Diagnostic
Sales manipulation diagnostics are used to compare past financial activities to
the present financial activities to depict any possible discrepancies within the company’s
accounting system. Comparing this financial information can enable investors to verify
if a company has manipulated their data. Below we have used several ratios related to
sales to compare Havertys to their top four competitors. To compute these ratios we
have received the net sales over the past five years and divided by cash from sales,
accounts receivables, inventory, and unearned revenue.
Net Sales/ Cash from Sales

58 | P a g e
*
Information provided by company’s 10-K
The net sales to cash from sales ratio shows how much cash is collected from
the sales in a period. In order to calculate the cash from sales, you need to subtract the
increase of accounts receivable from the net sales or add the decrease of accounts
receivable from the net sales. The ratio trend is around 1:1. In the chart above, you can
see Havertys has progressed towards the ratio trend each year. If a company were to
be below the average of one, it would intend that the company has received more cash
than the sales recorded. The first three years shown in the chart, Havertys’ sales have
been understated compared to the industry trend. Overall, sales are supported by the
cash collected.
Net Sales/ Accounts Receivable

59 | P a g e
*
Information provided by company’s 10-K
The net sales to net accounts receivable ratio shows the amount of accounts
receivables and/or credit a company receives from its sales. If a company’s ratio is
lower, such as Havertys, the company receives more credit and less upfront cash.
Havertys is low because they are purely a furniture store, so they receive more
accounts on credit due to the high price of furniture. On the opposing side, Pier One
has an incredibly high ratio. Pier One also sells other items rather than solely furniture,
so they collect more cash. The ratio also has a moderately steady trend that increases.
Pier One does not follow this trend though. Havertys’ sales are supported by credit
rather than cash.

60 | P a g e
*
Information provided by company’s 10-K
The chart above shows Havertys compared to their direct competitor, Ethan
Allen. Both of these companies sell furniture primarily. Havertys has a potential “red
flag” in their ratio trend. As you can see, their ratio doubled in the five years shown.
This could be from manipulation or from the possibility of Havertys increasing their
current liability term from one year to two or three years. This means that instead of
the money due within one year, it could be extended to be paid off within two to three
years. The furniture industry relies heavily upon accounts receivables supporting their
sales.
Net Sales/ Inventory

61 | P a g e
*
Information provided by company’s 10-K
The net sales to inventory ratio is a consistently steady trend. This ratio shows
how much the inventory supports the revenue. A higher ratio is preferred over a lower
ratio. When the ratio is higher, it means the company is proficiently using their
inventory to maximize their sales. As you can see above, Havertys’ ratio is one of the
highest of its competitors. The furniture industry’s ratios tend to be low in general. One
reason why these ratios are low is because furniture companies have to pay costs for
centralized storage facilities. Havertys has multiple warehouses where they store their
furniture, which makes the cost of inventory higher and the ratio lower.
Net Sales/ Unearned Revenue

62 | P a g e
*
Information provided by company’s 10-K
The net sales to unearned revenue ratio is used to obtain a companies quota.
Unearned revenue is a liability where the customer deposits money before the services
are rendered. Havertys ratio trend is sensitive but in line with the industry’s trend. The
average ratio for the furniture industry is around 30. Below are the effects of not
recording a firm’s unearned revenue:
Assets = Liabilities + Equity Revenues - Expenses = Income
N O U O N 0
Sales/ Warranty Liabilities

63 | P a g e
The net sales to warranty liability ratio does not apply to the furniture stores
provided. The products that are provided within the furniture firms have warranty
through their brand name. This makes the furniture stores not responsible for their
product’s warranty, leaving them with no liabilities.
Conclusion
After performing the sales manipulation diagnostic on Havertys and their top
competitors, we have found that Havertys could have manipulated their net sales to net
account receivables ratio. As we previously stated, it also could be caused from a
change in the time period of current accounts receivables. Other than that one potential
“red flag,” Havertys followed the industry trend and stayed consistent with its
competitors. It is important to compare net sales with other factors when examining a
company. The furniture industry heavily relies on their sales and inventory.
Expense Manipulation Diagnostic
Core expense diagnostics are a set of ratios used to determine if a firm has
manipulated their financial reports. Based on this set of ratios we are able to compare
Havertys and its competitors over a five year period. If Havertys or its competitor’s
diagnostic ratios show substantial fluctuations then it is imperative that the firm be
examined more thoroughly. By doing so investors can determine if a company has
manipulated their expenses, determine the reliability of a firm’s financial statements,
and possibly expose a trend that is being shared by the home furnishings industry.
Asset Turnover

64 | P a g e
*
Information provided by company’s 10-K
The asset turnover ratio shows a firm’s ability to efficiently use assets to acquire
sales (About.com). This ratio is found by dividing net sales by total assets. The graph
above shows Havertys and its competitors’ asset turnover for the past five years. Like
many of its competitors, Havertys’ ratio decreased slightly to 1.69 in 2003 and then
continued a steady increase until 2006 where it reached 1.83. The reason why it is so
important to evaluate a firm based on this ratio is because it is fairly simple for
managers to improperly record expenses as assets on their financial statements. In the
retail industry, it is common for firms to use operating leases. These leases are usually
recorded off the books unlike capital leases. If a firm decides to record a capital lease
when an operating lease is appropriate, then assets can be overstated. This can
significantly alter the outcome of this ratio and signal manipulation. However, Havertys’
financials properly disclose its operating leases leading us to believe it is not trying to
understate its expense and manipulate its financial statements.

65 | P a g e
Cash Flow From Operations/ Operating Income
*
Information provided by company’s 10-K
The cash flow from operations to operating income ratio illustrates the
relationship between the amounts of cash generated from operating activity and the
amount of operating income recorded on the income statement (Wikipedia.org). The
above graph illustrates this ratio for Havertys and its competitors. The retail industry
does have a tendency for this ratio to be large due to the high cost of selling the
product, including showrooms, advertising, and commissions to sales staff (First
Research). These selling, general and administrative costs all decrease operating
income which in turn increases the size of the ratio. According to the graph, Havertys’
CFFO/OI ratio has declined from 1.99 in 2002 to 1.18 in 2006. This declining ratio is a
great result for Havertys and will put the firm closer to the industry average. A possible
explanation for this is better management of its selling, general and administrative
expenses. This will allow an increase in operating income thus decreasing the ratio over

66 | P a g e
time. Overall, Havertys has struggled to support operating income by cash flow from
operations, but is showing signs of improvement. From this we have determined that
the figures shows no signs of manipulation.
Cash Flow From Operations/ Net Operating Assets
*
Information provided by company’s 10-K
The cash flow from operation to net operating assets ratio shows the return on
operating assets which include property, plant, and equipment. The graph above shows
Havertys’ ratio declining from .65 in 2002 to .12 in 2006. This decrease is consistent
with the CFFO/OI, which is a good indicator that Havertys is not manipulating its
expenses. When there is a manipulation of operating income it will most likely leave a

67 | P a g e
trail that can be tracked by looking at net operating assets. If a firms operating income
is decreasing so should its net operating assets. If not, that is a “red flag” that the
company has manipulated its financial statements. Another factor that must be
considered is operating leases which are used widely in the retail industry. If a firm
decides to record a capital lease when an operating lease is appropriate then assets can
be overstated. This manipulation would cause net operating assets to increase and the
ratio to be much smaller. Havertys reported operating leases of $304,606 thousand in
2006. If the company would have reported those as capital leases, net operating assets
would have been overstated. The proper disclosure of operating leases and the
decrease in the ratio are key indicators that they have not manipulated this part of their
financial statements
Total Accruals/Change in
Sales
* Information provided by company’s 10-K

68 | P a g e
The Total Accruals to Net Sales ratio illustrates how the total accruals of a firm
match a company’s net income. It is found by subtracting net income from cash flow
from operations and dividing it by the change in sales. The graph above shows this
ratio for Havertys and its competitors over the past five years. A large ratio is common
in the retail industry and can be explained by sales on credit. “Because furniture is often
expensive, credit availability is an important aspect of sales, especially at the lower end
of the market, where more than 50 percent of sales are financed. Many retailers offer
their own financing, but many have arrangements with third parties” (First Research).
This can lead to a high ratio because sales are on credit therefore recorded in the
accounts receivable section of the balance sheet. As you can see from the graph
Havertys’ ratio is decreasing at a very slow rate along with its competitors. From this we
can conclude that there are no signs of manipulation.
Pension Expense/ Selling, General, & Administrative Expense
*
Information provided by company’s 10-K

69 | P a g e
The pension expense ratio compares selling, general, and administrative
expenses to pension expenses incurred by a firm. The graph above illustrates this ratio
for Havertys and Pier One who are the only ones out of our study who have a defined
benefit plan. Havertys’ defined benefit pension plan covers all employees hired on or
before December 31, 2005 and are based on years of service and the employee’s final
average compensation (Havertys 10-K). This ratio has remained relatively steady
changing only from .018 to .015 from 2002-2006. Therefore, there are no signs of
expense manipulation.
Conclusion
After conducting the expense manipulation diagnostic for Havertys and its
competitors over the past five years, we found that Havertys ratios are consistent with
the industry. The company has even have outdone its competitors by steadily
decreasing cash flow from operations to operating income. This means they are using
better management skills to decease their operating costs. Overall, from the results of
the expense manipulation diagnostic we can conclude that Havertys has not
manipulated their financial statements to over or under report their earnings.
Potential Red Flags
Recognition of potential “red flags” is one of the most important steps in the
accounting analysis. These “red flags” are often the result of a firms own management
who manipulate their financial records to seem more appealing to investors. However,
this manipulation often leaves a trail or “red flags” that can be uncovered by analysts.
One of the easiest ways to discover these discrepancies is to use the sales and expense
manipulation diagnostics that were used in the previous section. These ratios will
automatically tell an analyst if a company’s financial records are distorted and where
the source of the distortion is. It is very important that firms recognize any “red flags”
because discrepancies can cause investors to doubt the reliability of a firm’s financial
reports.

70 | P a g e
Diagnostic Ratio’s
Diagnostic ratios are an easy way to determine any discrepancies of a firm’s
financial statements. After conducting both the sales and expense diagnostics we can
assume that Havertys has not intentionally manipulated there financial statements. All
of Havertys’ ratio results except one were consistent with other competitors in the
home furnishings industry. As previously stated, Havertys has a potential “red flag”
when comparing their net sales to net accounts receivable ratio. The ratio doubles
within the five year period. However, this could be from an extension in the time frame
current accounts receivables are due.
Operating Leases
A common manipulation of expenses occurs with the improper recording of
leases. If a company records a capital lease when an operating lease is appropriate
then assets can be overstated. However, if they record an operating lease when a
capital lease is appropriate then assets can be understated. It is especially important to
investigate this in the home furnishings industry where operating leases are widely
used. Havertys 10k reports $304,606,000 in operating leases in 2006 that are not
recorded on the balance sheet. Havertys initial operating lease terms are from five to
thirty years. They also require that Havertys pay all maintenance, property taxes and
insurance costs (Havertys 10K). This information would signal an investigation in to
Havertys to make sure they are not manipulating their expenses. After reevaluating
Havertys leases it is determined that in order to truly reflect the company’s financial
position the operating leases should be shown as both an asset and a liability on the
balance sheet. In the next section, undo accounting distortions, we will calculate the
amount of operating leases that should be added to the financial statements and the
impact it has on them. This same process of investigation should be used by analysts
whenever the recording of leases is involved.

71 | P a g e
Post- Retirement Benefit Plans
The disclosure of post – retirement benefit pans can often manipulate a firm’s
financial records. Havertys, however, discloses their defined benefit plan in great detail
in their 10K. Their benefit plan is for all employees who were hired before December
31, 2005 and are based on years of service and the employee’s final average
compensation. The table they provide in their 10K also discloses their current and
future benefit obligations, return on plan assets and the discount rate used. They have
also adopted FASB SFAS No. 158 which is an amendment on how employers should
account for defined benefit and other postretirement plans (Havertys 10K). This amount
of detailed disclosure is encouraged and can lead to the reduction in potential “red
flags” for a firm.
Conclusion
After a thorough investigation of Havertys diagnostic ratios, operating leases,
and post-retirement pension plan there are very few red flags for the firm. The net
sales to net accounts receivable ratio and the recording of operating leases could be a
concern for investor. However, Havertys has gone above and beyond in the disclosure
of their operating leases and defined benefit plan. They even have recently adopted
new FASB accounting standards to better disclose information on their financial records.
Undo Accounting Distortions
The final step in the accounting analysis is to undo any accounting distortions. If
an investigation determines that there is manipulation analysts must go back and
reevaluate the impact of those distortions. After conducting the sales and expense
diagnostics for Havertys and its competitors in the home furnishings industry over five
years, there are no major red flags that would indicate the need for a reevaluation. The
company has adopted many FASB accounting policies to increase its financial
statements reliability.

72 | P a g e
However, we did find that operating leases were significant enough to reevaluate
the firm and add those obligations back on to their balance sheet. Fortunately, Havertys
10-K provided us with the beginning balance, interest rate and five initial payments to
help us discount operating leases back to present value for 2003-2007. To undo the
distortion, Havertys’ financial statements will be adjusted to increase assets and
liabilities related to these operating lease obligations. Refer to the appendices which
shows our calculations.
Once the calculations were available the 2003 -2017 balance sheets, income
statement, and statement of cash flows were restated to reflect the changes. The
impact of capitalizing the lease obligations are shown on the restated financial
statement in the appendix. You will be able to see the dramatic effect on net income,
total assets, total liabilities, shareholders equity and cash flow from operations.
Financial Analysis, Forecasting Financials, and Cost of Capital Estimation
When valuing a firm it is important to collect information from the firm, its
competitors, and the industry as a whole. Using the information found in trend and
benchmark analysis of liquidity, profitability, and capital structure ratios we are able to
construct a ten year forecast for Haverty’s financial statements. Lastly, we used CAPM,
regression analysis, and information on interest rates and pricing to estimate Havertys
cost of debt and equity.
Financial Ratio Analysis
Using ratios to compute a firm’s liquidity, profitability, and capital structure can
give you crucial information when evaluating a company. These ratios help compare a
firm to its competitors and help in forecasting the firm’s financial statements. Ratios are
the key tools used when evaluating a firm’s profitability and growth to find its value.

73 | P a g e
Liquidity Analysis
Liquidity refers to the firm’s ability to its short term obligations. Liquidity ratios
measure the firm’s liquid assets used to help pay-off the firms current liabilities. If these
ratios are too low it might indicate that the company does not have enough liquid
assets to meet its short term obligations and if the ratios are too high, it might suggest
that the firm is holding too many liquid assets which is preventing them from expanding
the business.
Generally, the higher the ratios are better. However, these ratios must be
analyzed in the context of the entire industry to develop a clear picture of the firm’s
liquidity. The ratios used to evaluate Haverty’s operating efficiency include current ratio,
quick asset ratio, inventory turnover, and working capital turnover.
Current Ratio
Current Ratio 2003 2004 2005 2006 2007 Havertys 2.46 1.81 1.69 1.76 1.93 Bed Bath and Beyond 2.34 2.56 2.40 2.04 2.36 Ethan Allen 2.68 2.16 1.97 2.91 2.60 Pier One 2.72 2.49 2.33 2.68 2.23 Williams-Sonoma 1.47 1.55 1.67 1.83 1.75

74 | P a g e
Industry 2.33 2.11 2.01 2.24 2.17
The current ratio is an indication of the company’s ability to meet short-term
obligations with its short term assets. This is important because a good current ratio is
a good indicator of the firm’s health and operating efficiency.
The chart and graph above follows the current ratios for Havertys and its
competitors over the past five years. Current ratio is calculated by dividing the year’s
end current assets by the current liabilities and it is generally understood that the ratio
should be above 1.
Over the past five years, Havertys maintained an average current ratio of 1.91.
This demonstrates that Havertys was able to pay-off their short-term debts even
though it falls short of the industry average of 2.17.
Over the past five years Havertys has generally become less liquid mainly
because of its decreasing current assets. This decrease in current assets is mainly due
to decreasing inventories. However, in 2006 the current ratio begins to grow due to
decreases in current liabilities. This is largely due to decreases in customer deposits and
accounts payable and accrued liabilities.
While evaluating liquidity, it is important to take their cash flows into
consideration. Operating cash flows give a general picture of the firm’s financial health.
Analysts are not concerned with Haverty’s current ratio because they believe their
capital resources are sufficient to fund capital expenditures, working capital
requirements, scheduled debt payments, dividends to our stockholders, and stock
repurchases (Havertys 10-K).
Quick Asset Ratio

75 | P a g e
Quick Asset Ratio 2003 2004 2005 2006 2007 Havertys 1.44 0.99 0.87 0.75 0.82 Bed Bath and Beyond 0.91 1.13 1.97 0.66 1.04 Ethan Allen 1.21 0.79 0.58 1.61 1.51 Pier One 1.36 1.16 1.07 1.40 0.96 Williams-Sonoma 0.72 0.64 0.81 0.95 0.78 Industry 1.13 0.94 1.06 1.07 1.02
The chart and graph above shows the quick asset ratios for Havertys and its
competitors over the past five years. The quick asset ratio is very similar to the current
ratio, in that it evaluates the firm’s ability to meet short term obligations. However, it
only accounts for those assets which are liquid within a period of two days. These quick
assets include cash and cash equivalents, marketable securities, and accounts
receivable and exclude any inventory. To derive the quick asset ratio, subtract
inventories from current assets and divide by current liabilities.
This ratio is important because it gives the investor a more strenuous look at the
health and efficiency of a company. The assets used to compute this ratio are the asset
that would most likely be used to cover short-term obligations is case of an emergency.
Over the past five years Havertys had an average quick asset ratio of 0.97 and is
not significantly different than the competitors. However, the ratio steadily falls. In
2006, Havertys felt the pressure to increase storage space due to lack of sufficient

76 | P a g e
space which resulted in poor sales volume. This increased inventories $17.1 million. In
previous years, Havertys was cutting back on inventory volume, which accounts for the
higher quick asset ratio. The decrease in the ratio demonstrates Havertys need of
expansion and their ability to meet demand and should not alarm investors.
Inventory Turnover
Inventory T/O 2003 2004 2005 2006 2007 Havertys 3.57 3.66 4.01 3.47 3.85 Bed Bath and Beyond 2.34 2.57 2.57 2.55 2.51 Ethan Allen 2.31 2.64 2.62 2.77 2.63 Pier One 3.00 2.91 3.07 3.18 3.19 Williams-Sonoma 4.39 4.07 4.12 4.04 3.67 Industry 3.12 3.17 3.28 3.20 3.17
Inventory turnover is a measure of a firm’s operating efficiency and is calculated
by dividing cost of goods sold by inventory. Inventory turnover shows how many times
a firm’s inventory is sold and replaced over a year. Havertys has an average inventory
turnover ratio of 3.71 which is higher than the industry average of 3.19.
Generally, a high ratio implies strong sales and good inventory control. In
Haverty’s case, it means low inventories and inefficiency. As mentioned before,
Havertys had a shortage of storage space which accounts for their low inventories. In

77 | P a g e
2006, Haverty’s increased their storage space and inventories which accounts for the
dramatic decrease in their inventory ratio from 2005. Also, low inventories may in part
account for their low sales in comparison to their competitors. After increasing storage
space in 2006, the inventory turnover ratios dropped to a more efficient rate.
Although a high inventory turnover may suggest a healthy demand and liquidity,
for the most part their turnover merely suggests operating inefficiency.
Days Inventory
Days Inventory 2003 2004 2005 2006 2007 Havertys 102.24 99.73 91.02 105.19 94.81 Bed Bath and Beyond 155.68 142.00 141.99 142.95 145.42 Ethan Allen 158.01 138.26 139.31 131.77 138.78 Pier One 121.67 125.43 118.89 114.78 114.42 Williams-Sonoma 83.14 89.68 88.59 90.35 99.46 Industry 124.15 119.02 115.96 117.01 118.58
The chart and graph above demonstrates the day’s supply of inventory for
Havertys and its competitors. Day’s supply of in inventory is calculated by dividing the
number of days in a year by the inventory turnover ratio. In other words, it’s the
number of days it takes before a company can turn its inventory into revenue.

78 | P a g e
Havertys day’s supply of inventory is consistent with the industry. Between 2003
and 2007, Havertys has decreased the days in inventory by 7.43 days while the industry
has decreased by 5.57 days.
Days’ supply of inventory is inversely related to inventory turnover. Usually, a
smaller number is better and means fewer days until you sell inventories and receive
sales revenue.
In Haverty’s case, the smaller than average days’ sales of inventory represents
their small inventory space. In other words, it takes fewer days to sell there inventory
because they have a smaller amount of inventory to sell.
Working Capital Turnover
Working Capital T/O 2003 2004 2005 2006 2007 Havertys 4.89 7.16 9.16 9.07 9.12 Bed Bath and Beyond 3.75 3.73 4.21 5.65 4.26 Ethan Allen 4.23 6.01 7.28 3.84 4.28 Pier One 4.18 4.32 4.91 3.66 4.65 Williams-Sonoma 11.77 11.24 8.92 7.83 7.88 Industry 5.76 6.49 6.90 6.01 6.04

79 | P a g e
The graph and chart above shows the working capital turnover ratios for
Havertys and its competitors. Working capital turnover is derived by dividing sales by
working capital (current assets-current liabilities). It is a measure of the depletion of
working capital to the generation of sales over a given period (www.investopedia.com).
Working capital is the money used to fund operations and purchase inventory. The
higher the working capital turnover, the better, because it means that the company is
generating a lot of sales compared to the money it uses to fund the sales
(www.investopedia.com).
Over the span of five years, both the industry working capital turnover and
Havertys working capital turnover steadily increase. The reason for Haverty’s increase in
working capital turnover is explained by the steadily increasing sales and decreasing
working capital. Since working capital is invested in operations or inventory, it make
since that the more working capital is spent, the more sales revenue is generated.
Liquidity Conclusion
Overall, Havertys seems to maintain a healthy liquidity with a few problems in
operating efficiency. For the most part, Havertys also follows the industry trends, which
is a good indication of financial health. Havertys main concern lies in their small
inventory. Unreasonably low inventories can be just as damaging to a firm’s profitability
as unreasonably high inventories. Although their low inventory has not dramatically
affected their sales yet, it is a key concern in maintaining financial health in the future.
In 2006, Havertys took notice of this potential problem and increased their storage
space and inventories which allowed for a more efficient inventory turnover rate.
Overall, Havertys seems to maintain a healthy liquidity and their operating efficiency is
moving in the right direction.
Profitability Analysis
In this section we have evaluated Havertys against its competitors in the home
furnishings industry using six profitability ratios. These include gross profit margin,

80 | P a g e
operating income margin, net profit margin, asset turnover, return on equity, and
return on assets.
“A firm’s growth and profitability are influenced by its product market and
financial market strategies. The product market strategy is implemented through the
firm’s competitive strategy, operating policies, and investment decisions”
(Palepu&Healy). For us to determine if Havertys is effectively implementing their
product market strategy we will use the six profitability ratios mentioned above. This
will not only allow us to determine if Havertys will have positive growth and profitability,
but, will also allow us to see if they are able to compete with other firms in their
industry.
Gross Profit Margin
Gross Profit Margin 2003 2004 2005 2006 2007Havertys 49.10% 48.28% 47.79% 49.60% 49.67%Pier One 40.30% 40.30% 40.50% 40.60% 39.90%Williams Sonoma 40.31% 40.32% 40.52% 37.20% 39.90%Bed Bath and Beyond 41.43% 41.91% 42.47% 42.79% 42.85%Ethan Allen 49.53% 48.27% 48.58% 50.73% 52.38%

81 | P a g e
Gross Profit Margin “is an indication of the extent to which revenues exceed
direct costs associated with sales” (Palepu&Healy). It is calculated by first subtracting
the cost of goods sold from revenues to find gross profit. Then gross profit is divided by
the currents year’s revenue. The graph above shows this ratio for Havertys and its
competitors in the home furnishing industry over the past five years. According to
Investopedia.com “a high gross profit margin indicates that a business can make a
reasonable profit on sales, as long as it keeps overhead costs in control.” In other
words, firms can measure basic product profitability and determine if production costs
need to be adjusted. According to the graph Havertys and its competitors show a
definite trend of maintaining a gross profit margin between 40-50%. This indicates that
the prices of each firm’s products may slightly differ but that all of the competitors run
a relatively equal production process.
Operating Income Margin
OPERATING INCOME MARGIN 2003 2004 2005 2006 2007Havertys 4.84% 3.84% 2.19% 2.52% -0.17%Havertys Restated 1.77% 2.49% 0.41% 0.43% -2.73%Pier One 11.66% 10.30% 5.38% -2.41% -13.94%

82 | P a g e
Williams Sonoma 13.87% 14.49% 16.98% 8.94% 8.79%Bed Bath and Beyond 9.44% 14.28% 15.39% 15.13% 13.44%Ethan Allen 13.31% 13.38% 13.59% 13.38% 11.05%
The graph above illustrates Havertys and its competitors operating profit margin
over the past five years. Operating Income Margin is calculated by dividing operating
income for a given year by total revenue. This percentage will allow a firm to tell if they
are effectively controlling costs contributed to operating activities and ultimately if they
are able to cover their fixed costs. “A business that has a higher operating margin than
its industry’s average tends to have lower fixed costs and a better gross margin, which
gives management more flexibility in determining prices” (about.com). Unfortunately for
Havertys their ratio falls well below the industry average. This is due to a steep decline
in operating income with sales staying relatively constant. In 2007 selling, general and
administrative costs were higher than the firm’s operating income leading to Havertys’
operating profit margin to be negative. From this information investors are able to tell
that Havertys does not currently have control over their operating costs and may
struggle to cover their fixed costs. The graph also shows that the restated operating
income margin for Havertys has the same trend as it does before restatement. This
leads us to conclude that operating leases did not have a dramatic impact on this ratio.
Net Profit Margin

83 | P a g e
NET PROFIT MARGIN 2003 2004 2005 2006 2007Havertys 3.25% 2.63% 1.82% 2.04% 0.24%Havertys Restated 1.77% 1.10% -1.18% -2.41% -4.41%Pier One 7.37% 6.53% 3.31% -2.24% -14.02%Williams Sonoma 5.27% 5.71% 6.10% 5.57% 5.60%Bed Bath and Beyond 8.24% 8.92% 9.81% 9.86% 8.98%Ethan Allen 8.19% 8.32% 8.36% 8.04% 6.89%
Net Profit Margin illustrates the profit a firm makes on its operating activities.
This percentage is calculated by dividing net income for a given year divided by total
revenue. A high ratio therefore indicates that a firm is efficiently converting their
revenue in to profit. However, “in some cases, lower profit margins represent a pricing
strategy. Some businesses, especially retailers, may be known for their low-cost, high-
volume approach. In other cases a low net profit margin may represent a price war
which is lowering profits” (About.com). Havertys’ net profit margin is slightly under the
industry average but declining at a steady rate much like its competitors.
Although Havertys is not known for its low-cost merchandise, their low ratio
could be attributed to pricing wars. Since the home furnishings industry is directly
related to the housing market, retailers are experiencing low and even negative sales

84 | P a g e
growth. Retailers are left to come up with ways to sell their inventory including reducing
their sales prices. Havertys, PierOne, and Williams-Sonoma all sell merchandise priced
in the upper middle range. These three competitors’ net profit margins are the lowest in
the industry and have declined over the past five years. This could indicate that they
are involved in a price war to try to boost their own sales growth.
Again, Havertys restated net profit margin does not signal any signs of operating
leases having a huge impact on the ratio.
Asset Turnover
ASSET TURNOVER 2003 2004 2005 2006 2007Havertys 1.83 1.81 1.76 1.86 1.67 Havertys Restated 0.65 0.63 0.56 0.55 0.54 Pier One 2.03 1.86 1.73 1.65 1.39

85 | P a g e
Williams Sonoma 2.37 2.18 2.13 2.21 1.88 Bed Bath and Beyond 2.22 2.05 1.80 1.82 1.96 Ethan Allen 1.32 1.31 1.45 1.70 1.24
The graph above shows the Asset Turnover for Havertys and its competitors over
the past five years. This ratio is calculated by dividing sales in the current year by total
assets from the previous year. The asset turnover ratio allows manager to tell if a firm
is efficiently using their assets. “Companies with low profit margins tend to have high
asset turnover, while those with high profit margins have low asset turnover”
(investopedia.com). This is also true for Havertys whose profit margins are below the
rest of the industry, but whose asset turnover is equal if not higher than its
competitors. From the graph it is easy to determine the industry trend of an asset
turnover between 1.7 and 2.2. The graph also shows a steady decrease in the ratio by
all of the competitors over the past five years.
The asset turnover for Havertys restated does cause some concern. While it is
decreasing along with the industry, the ratio is much lower than that of its competitors.
This is largely due to the significant amount of capital lease rights that were added back
to total assets. This paired with sales staying consistent shows the dramatic impact
capitalizing Havertys operating leases has on their financial statements.
Return on Assets

86 | P a g e
ROA 2003 2004 2005 2006 2007 Havertys 6.22% 5.00% 3.19% 3.46% 0.37% Havertys Restated 2.30% 1.98% -2.07% -2.10% -7.36% Pier One 15.00% 12.13% 5.75% -3.70% -19.46% Williams Sonoma 12.50% 12.43% 13.00% 10.96% 10.54% Bed Bath and Beyond 18.34% 18.25% 17.63% 15.78% 17.57% Ethan Allen 10.78% 10.86% 12.12% 13.64% 8.52%
The graph above illustrates Asset Profitability for Havertys and its competitors
over a five year period. This ratio allows managers to determine how much profit a firm
can generate for each dollar of assets invested (pelpu&healy). This ratio is found by
dividing net income of the current year by total assets of the previous year. “The ROA
figure gives investors an idea of how effectively the company is converting the money it
has to invest into net income. The higher the ROA number, the better, because the
company is earning more money on less investment” (investopedia.com). Havertys’
ROA is noticeably smaller than its competitors in the home furnishing industry. Once
again this is largely due to their drastically decreasing operating income over the past
five years. Until Havertys can gain more control over their operating expenses they will
be unable to effectively invest their money into net income.
The restated ROA ratio for Havertys shows that the impact on net income and
total assets from adding back operating leases. Havertys was already struggling with

87 | P a g e
operating income and the capitalization of their operating leases did not help. This
capitalization has further decreased net income and increased total assets. This is main
cause for the ROA to be negative from 2005-2007.
Return on Equity
ROE 2003 2004 2005 2006 2007 Havertys 11.32% 8.96% 5.53% 5.73% 0.60% Havertys Restated 6.22% 3.06% -3.44% -2.10% -13.71% Pier One 20.10% 17.26% 9.11% 14.52% -12.00% Williams Sonoma 23.36% 24.41% 23.77% 19.97% 18.56% Bed Bath and Beyond 27.61% 27.51% 25.36% 22.91% 26.27% Ethan Allen 14.53% 14.89% 17.39% 18.28% 16.58%
The graph above illustrates the Return on Equity for Havertys and its competitors
over a five year period. This ratio allows managers to determine how well firms are
using the funds invested by their shareholders to generate returns (Pelpu & Healy).
ROE is found by dividing net income for the current year by shareholder’s equity of the
previous year. According to the text Business Analysis & Valuation, “over a long period
of time, largely publicly traded firms in the U.S generate ROE’s in the range of 11 to 13
percent.” Havertys ROE did fall in to this category in 2003 with 11.32% but was then
quickly pushed out when their ratio dropped drastically to .6% in 2007.

88 | P a g e
This decline is largely due to net income dropping from $25,331 in 2003 to
$1,758 in 2006 while stockholder’s equity remained relatively constant. PierOne
Imports, Williams-Sonoma, Bed Bath and Beyond also followed this declining ROE
trend. This is unfortunate because the higher a firms’ ROE compared to the industry the
better and the more likely that the firm can create cash internally (about.com). From
the graph Ethan Allen seems to be an example of this keeping their ROE relatively
stable and high compared to the other competitors giving them an advantage in today’s
slowing economy.
Conclusion
From these six profitability ratios we were able to determine that Havertys will
struggle to have positive growth and profitability. This is largely due to their growing
operating expenses. If they do not gain control over these expenses Havertys will
struggle to cover fixed costs and have low asset profitability. They will also have a hard
time creating cash internally due to the large amount of operating expenses that have
drastically decreased operating income.
Capital Structure Analysis
The capital structure analysis determines the way a firm finances its assets based
on its liabilities and stockholders’ equity. The ratios used for analyzing are: Debt to
Equity Ratio, Times Interest Earned, Debt Service Margin, Altman Z-Score, Internal
Growth Rate, and Sustainable Growth Rate.
Debt to Equity Ratio

89 | P a g e
Debt to Equity 2003 2004 2005 2006 2007Havertys 0.72 0.73 0.66 0.61 0.51Ethan Allen 0.36 0.49 0.45 0.95 0.96Pier One 0.51 0.54 0.62 0.98 1.54Williams-Sonoma 0.44 0.50 0.40 0.30 0.31Bed Bath & Beyond 0.51 0.44 0.45 0.49 0.50Industry Average 0.51 0.54 0.52 0.67 0.76HVT (restated) 0.64 0.70 0.69 0.70 0.68
The Debt to Equity Ratio is calculated by dividing total liabilities by total
shareholders equity. This ratio is used to indicate how much of debt and equity are
used to finance the firm’s assets. When a firm finances most of its assets through
equity, the ratio has a tendency to be lower. Firms that have a lower debt to equity
ratio are inclined to have poor credit ratings, and firms with a higher ratio are inclined
to have better credit ratings. Havertys’ debt to equity ratio is slowly declining, while the
industry trend is slowing increasing.
Times Interest Earned

90 | P a g e
Times Interest Earned 2003 2004 2005 2006 2007Havertys 10.89 10.32 17.29 -7.29 -1.49Ethan Allen 185.21 197.20 169.49 15.03 9.45Pier One 87.95 110.16 56.63 -16.40 -14.04Williams-Sonoma 140.38 116.20 178.77 176.39 145.47Bed Bath & Beyond 42.52 62.67 42.21 24.48 20.46Industry Average 93.39 99.31 92.88 38.44 31.97
Times Interest Earned is computed by dividing a firm’s earnings before interest
and taxes (EBIT) by their interest expense. This ratio shows how many times a firm can
cover its interest charges on a pretax basis (investopedia.com). A high ratio can signify
an unwanted amount of debt. The industry has a declining Times Interest Earned Ratio.
Havertys has the lowest ratio of the competing firms. Williams-Sonoma has an inverse
relationship with the industry’s trend.

91 | P a g e
Debt Service Margin
Debt Service Margin 2003 2004 2005 2006 2007Havertys 6.52 3.94 1.56 2.13 3.78Ethan Allen 112.78 128.32 21.93 54.83 282.95Pier One NA NA NA -0.67 1.08Williams-Sonoma 43.04 28.22 33.87 14.87 16.39Bed Bath & Beyond NA NA NA NA NA Industry Average 32.47 32.10 11.47 14.23 60.84
Debt Service Margin is calculated by dividing the operating cash flow of one year
by the current maturities of long term debt in the previous year. This ratio shows the
ability of a firm to repay its current portion of their long term debt. A higher ratio is
more preferable than a lower ratio. Havertys and Pier One have the lowest ratios out of
the competing firms above. Havertys debt service margin has been steady over the past
five years.

92 | P a g e
Credit Analysis
Altman Z-Score 2003 2004 2005 2006 2007Havertys 3.84 3.70 3.72 3.84 3.96Ethan Allen 5.57 5.82 6.01 4.46 4.32Pier One 4.79 4.54 4.33 2.88 2.41Williams-Sonoma 5.57 5.49 5.77 5.02 4.88Bed Bath & Beyond 9.93 8.87 8.44 8.19 7.54Industry Average 5.94 5.68 5.65 4.88 4.62
Altman Z-Score, developed by Edward Altman in 1968, was developed to predict
the chance of a firm going bankrupt (Wikipedia.com). When a firm has a score of 1.81
or lower, the model predicts bankruptcy. When the firm has a score of 2.67 to 2.9, this
warns the firm of bankruptcy (investopedia.com). A score of 3.0 or higher ensures the
firm that they are financially healthy. As seen in the chart above, we have compared
Havertys’ Altman Z-Score with their top four competing firms. Pier One Imports is in the
low risk area of possibly going bankrupt. The industry trend is slowly declining. This
could be due to the fact of the economy and low house market. Possible manipulation
takes place for firms that use Altman Z-Score. The model is computed by the following
formula:

93 | P a g e
1.2(a) + 1.4(b) + 3.3(c) + .6(d) + 1.0(e)
Where:
a = (Net Working Capital / Total Assets)
b = (Retained Earnings / Total Assets)
c = (Earnings before Interest and Taxes / Total Assets)
d = (Market Value of Equity / Book Value of Total Liabilities)
e = (Sales / Total Assets)
Conclusion
The capital structure analysis of Havertys is on-average close to the industry’s
analysis. Typically, Havertys was below the industry level for most of the ratios. Due to
the fact of the housing market’s declining economy, many firms have been forced to go
bankrupt. The Altman Z-Score graph is showing this illustration of the downward
economy.

94 | P a g e
Growth Rate Analysis
Internal Growth Rate
IGR 2003 2004 2005 2006 2007Havertys 4.97% 3.95% 1.99% 2.16% -0.89%Ethan Allen 9.06% -6.18% 9.07% 9.95% 5.47%Pier One 12.74% 9.38% 5.64% 9.89% 13.97%Williams-Sonoma NA NA NA NA 9.19%Bed Bath & Beyond NA NA NA NA NA Industry Average 5.35% 1.43% 3.34% 4.40% 5.55%Havertys (restated) 1.25% 0.70% -3.28% -3.40% -8.63%
Internal growth rate is the “highest level of growth achievable for a business
without obtaining outside financing” (invetsopedia.com). IGR is calculated by
multiplying the company’s return on assets (ROA) by one minus the dividend payout
policy. Havertys internal growth rate is declining into the negatives. Not only does
Havertys have a low return on assets, but they pay dividends too, which causes the IGR
to be low. The Havertys’ restated IGR shows a downward trend into the negatives.
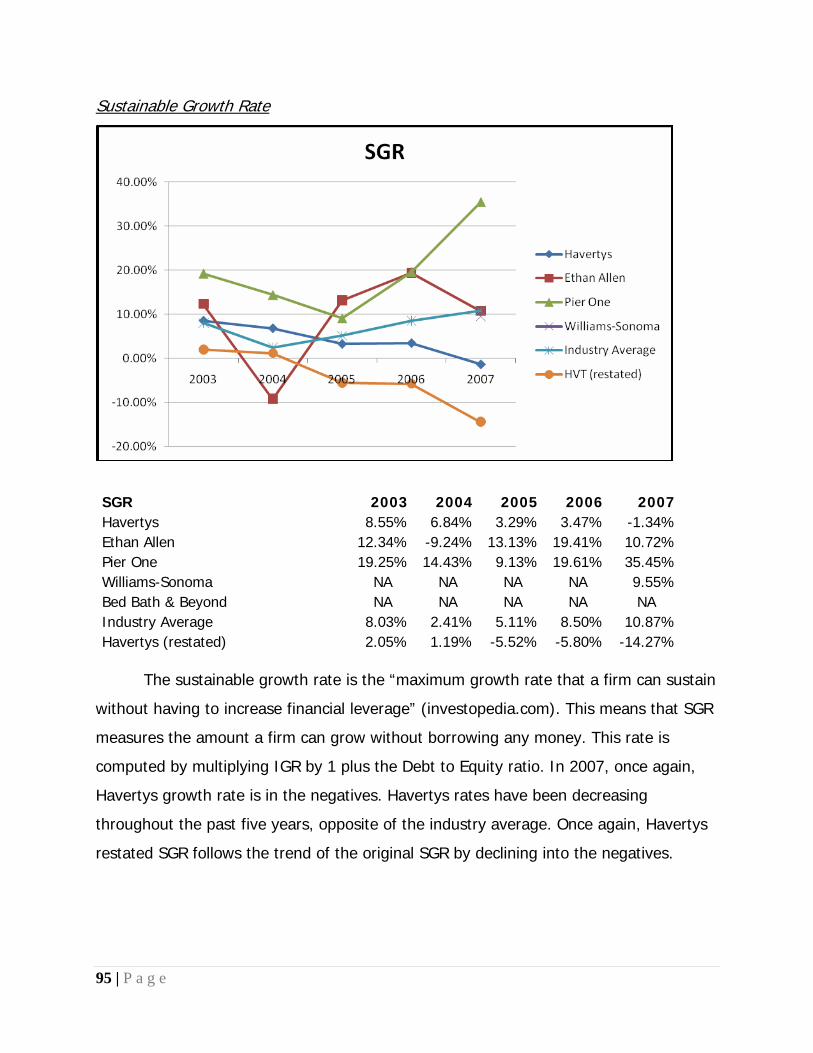
95 | P a g e
Sustainable Growth Rate
SGR 2003 2004 2005 2006 2007Havertys 8.55% 6.84% 3.29% 3.47% -1.34%Ethan Allen 12.34% -9.24% 13.13% 19.41% 10.72%Pier One 19.25% 14.43% 9.13% 19.61% 35.45%Williams-Sonoma NA NA NA NA 9.55%Bed Bath & Beyond NA NA NA NA NA Industry Average 8.03% 2.41% 5.11% 8.50% 10.87%Havertys (restated) 2.05% 1.19% -5.52% -5.80% -14.27%
The sustainable growth rate is the “maximum growth rate that a firm can sustain
without having to increase financial leverage” (investopedia.com). This means that SGR
measures the amount a firm can grow without borrowing any money. This rate is
computed by multiplying IGR by 1 plus the Debt to Equity ratio. In 2007, once again,
Havertys growth rate is in the negatives. Havertys rates have been decreasing
throughout the past five years, opposite of the industry average. Once again, Havertys
restated SGR follows the trend of the original SGR by declining into the negatives.

96 | P a g e
Financial Statement Forecasting
Accurately forecasting a firm’s financial statements is important because it will
enable you to get a glimpse of what the structure of that firm may look like in the
future. Most forecasts are done by using industry averages or ratios derived from a
firm’s past financial statements. Forecasts are not easy to compute and if not done
properly can result in high costs for a firm. This is because “managers [rely on]
forecasts to formulate business plans and provide performance targets; analysts [use]
forecasts to help communicate their view of the firm’s prospects to investors; and
bankers and debt market participants [use] forecasts to assess the likelihood of loan
repayment”(Palepu&Healy). If there are large forecasting errors, especially in the
beginning of the forecasting period, it can cause all of these people to improperly carry
out their job.
One of the most important ways to lower forecasting error is to begin with the
income statement. You must begin by carefully choosing a sales growth percentage
because this is what the rest of your forecast will be based off of. Once sales growth is
established then it is relatively easy to predict an appropriate asset turnover. With the
use of this ratio the income statement will then be able to be forecasted. Then the
statement of cash flows follows. With the use of
ratio trends and five years of Havertys past financial statements we were able to conduct a
forecast for the firm.
Havertys also has lease obligations that we discussed in the “Red Flags” section
that required us to restate their financial statements. The effect of these changes can
be seen in the appendix where we provided forecasting for both the actual reported
data and the restated data. We will discuss the impact in each of the appropriate
sections.
Income Statement
We first began by compiling Havertys’ income statements for the past five years.
Then we created a common sized income statement by dividing each line item in the
income statement by net sales. This allowed us to identify percentage trends in each

97 | P a g e
line item, such as gross profit, cost of goods sold and total expenses, which we then
used to forecast out those items for the next ten years.
The next step was to identify a relevant sales growth percentage. This
estimation is vital to a successful forecast and is especially important for this particular
industry. The home furnishing industry is directly dependent on the success of the
housing market. Unfortunately, the housing market hit an all time low in 2007 and is
expected to decline well in to 2008. Therefore, to come up with an appropriate sales
growth rate we would have to factor in the state of the housing market. To help
determine this rate we used the chart below published by the National Association of
Realtors.
% change 2006 2007 2008 2009
Existing
Home Sales
-8.5 -12.8 -4.8 4.2
New Single
Family
Home Sales
-18.1 -26.4 -23.7 7.2
With the help of this table we were able to establish a sales growth of -15% in 2008,
4.5% in 2009, 6% in 2010 and then a steady increase of 7%.
To determine a percentage trend for selling, general & administrative costs we
looked at the common size balance sheet. Even though sales decreased in 2007 these
operating expenses did not decrease. For that reason we decided to use a higher
percentage of 48% than the average 46.25%.
Next, we had to determine an appropriate asset turnover ratio. This would help
to determine total assets on the balance sheet. The tables below show the calculations
for 2008 and the Asset turnover for 2003-2007.

98 | P a g e
Asset Turnover 2008 = Forecasted Sales 2008/ Total Assets 2007
1.58= $666,921 / $421,937
Asset Turn. 2003 2004 2005 2006 2007
1.83 1.81 1.76 1.86 1.67
As you can see the asset turnover calculated for 2008 is much lower than that in
previous years. This is largely due to the decrease in sales stemming from the decline in
the housing market. Since housing sales are forecasted to increase in 2009 we decided
to slowly increase our asset turnover from 1.58 to 1.65 then to a steady 1.78 in 2010.
Doing this will allow us to include the changes in the housing industry and give us a
more accurate forecast.
On the restated income statement we added the operating lease expense and
subtracted the depreciation to give us a new operating income. Then the capital
interest expense was subtracted to give us a new net income. From the restatement
you can see a significant change in net income for years 2003-2017.
Balance Sheet
As mentioned above we were able to forecast an appropriate asset turnover ratio
for Havertys until 2017. This allowed us to forecast total assets on the balance sheet by
dividing the estimated sales by the estimated asset turnover ratio. We also created a
common size balance sheet by dividing each asset line item by total assets, each
liability line item by total liabilities, and each shareholder’s equity by total shareholder’s
equity. Just like in the income statement this allowed us to identify percentage trends
to help forecast line items.
One of these percentage trends allowed us to forecast current assets using at
estimated value of 50%. In order to forecast current liabilities we decided to calculate
out the current ratio from 2003-2007. From this set of ratios we estimated out a 1.71
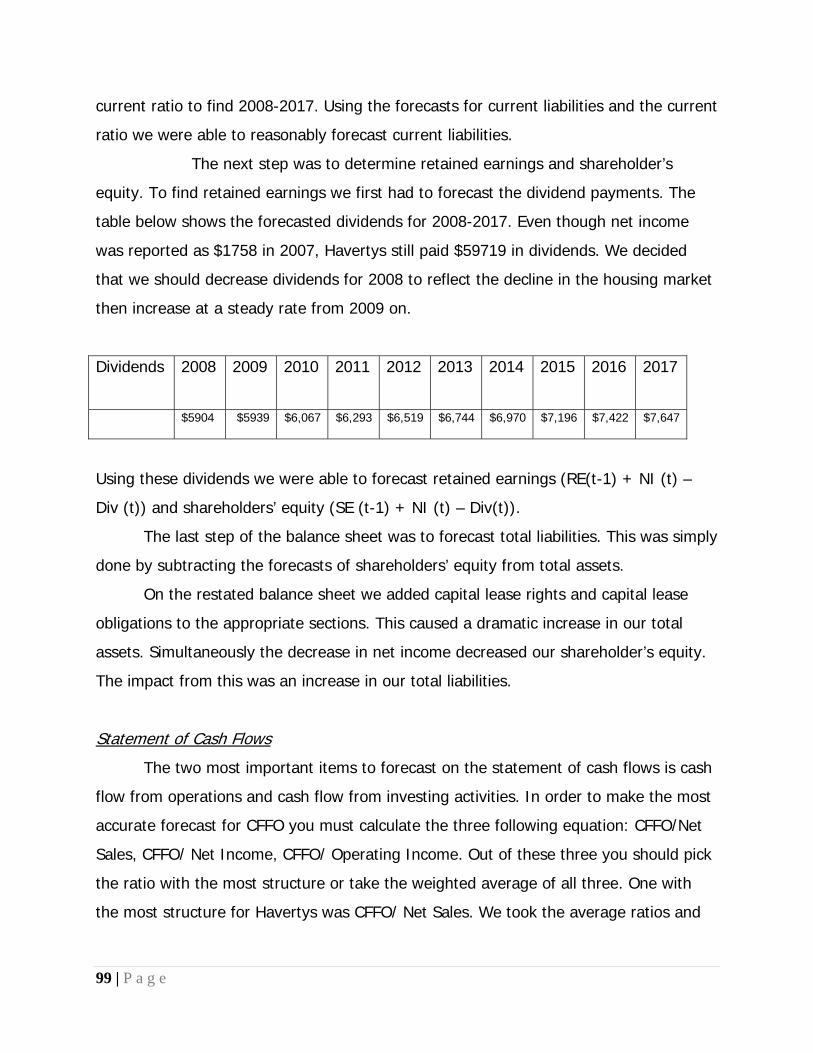
99 | P a g e
current ratio to find 2008-2017. Using the forecasts for current liabilities and the current
ratio we were able to reasonably forecast current liabilities.
The next step was to determine retained earnings and shareholder’s
equity. To find retained earnings we first had to forecast the dividend payments. The
table below shows the forecasted dividends for 2008-2017. Even though net income
was reported as $1758 in 2007, Havertys still paid $59719 in dividends. We decided
that we should decrease dividends for 2008 to reflect the decline in the housing market
then increase at a steady rate from 2009 on.
Dividends 2008 2009 2010 2011 2012 2013 2014 2015 2016 2017
$5904 $5939 $6,067 $6,293 $6,519 $6,744 $6,970 $7,196 $7,422 $7,647
Using these dividends we were able to forecast retained earnings (RE(t-1) + NI (t) –
Div (t)) and shareholders’ equity (SE (t-1) + NI (t) – Div(t)).
The last step of the balance sheet was to forecast total liabilities. This was simply
done by subtracting the forecasts of shareholders’ equity from total assets.
On the restated balance sheet we added capital lease rights and capital lease
obligations to the appropriate sections. This caused a dramatic increase in our total
assets. Simultaneously the decrease in net income decreased our shareholder’s equity.
The impact from this was an increase in our total liabilities.
Statement of Cash Flows
The two most important items to forecast on the statement of cash flows is cash
flow from operations and cash flow from investing activities. In order to make the most
accurate forecast for CFFO you must calculate the three following equation: CFFO/Net
Sales, CFFO/ Net Income, CFFO/ Operating Income. Out of these three you should pick
the ratio with the most structure or take the weighted average of all three. One with
the most structure for Havertys was CFFO/ Net Sales. We took the average ratios and

100 | P a g e
decided upon 5.98%. To forecast CFFO you simple multiply the forecasted sales for a
given yar and multiply it times the CFFO/net Sales ratio of 5.98%.
In order to calculate cash flow from investing activities you must determine the
net change in assets for each year. We were able to forecast out property, plant, and
equipment and used its percentage change to forecast the cash flow from investing
activities.
For the restatement of the statement of cash flows, we inserted out new net
income in year 2003-2007 and recalculated the cash flow from operations. This change
also changed the CFFO/Sales ratio we used to forecast out CFFO for 2008-2017. The
new ratio of .48% was then used to forecast out the new CFFO to accurately reflect the
capitalization of out lease obligations.
Cost of Capital Estimation
The most common way to measure cost of capital is by the Weighted Average
Cost of Capital (WACC). This calculation conveys each “category of capital
proportionately weighted” (investopedia.com). In order to find the cost of capital you
must compute many formulas, such cost of equity and cost of debt. These formulas are
shown below.
Cost of Equity
The first step of calculating cost of capital is to find the cost of equity. There are
two different ways to achieve this: the Capital Asset Pricing Model (CAPM) and the Back
door method.
The Capital Asset Pricing Model involves computing the cost of capital with the
following variables; risk free rate, beta, and market risk premium. We gathered
information for the risk free rates on a 3 month, 6 month, 2 year, 5 year, and 10 year
Treasury Bills. To get the market return we used the S&P 500 closing prices. The
market risk premium equals the market return minus the selected treasury risk free
rates.

101 | P a g e
After obtaining the risk free rate and the market risk premium, the next step is to
compute beta. To compute beta we ran 25 regressions using the 5 risk free rates from
the Treasury Bills over intervals of 24 months, 36 months, 48 months, 60 months, and
72 months. After running the regression, the adjusted R squared tells you the percent
of data beta covers. The larger the adjusted R square, the better. In Havertys’
regressions, the adjusted R square was under ten percent (refer to the appendix). Due
to the fact that this does not give much information, we must do the Back Door Method
to compute the Cost of Equity.
The Back Door Method consists of the following factors: Return on equity, price
to book ratio, and the growth rate on earnings. The Back Door Method is more efficient
for Havertys to compute cost of equity. According to Havertys’ 10-K; the return on
equity is .62%, the price to book ratio is .82, and the growth rate on earnings is -
48.40%. This gives us an estimation of 11.38% for our cost of equity.
Back Door Method = ROE + [(P/B)-1]g
(P/B)
Cost of Debt
The cost of debt is the firm’s long term and current debt. The cost of debt is
calculated by using various interest rates associated with Havertys’ debt found in their
10-K. To get the cost of debt, we took every liability variable and matched them with
their interest rate. We multiplied their interest rate by the weighted average, which is
each liability as an individual divided by all the liabilities as a total.
For the current liabilities without a given interest rate (accounts payable, accrued
liabilities, and customer deposits), we pulled 2.58% from a 3-month non-financial
commercial paper rate from the St. Lewis Federal Reserve website. The other interest
rates were provided for us through Havertys’ 10-K. (Refer to Appendix for
computations). The weighted average cost of debt is 4.74%

102 | P a g e
Weighted Average Cost of Capital (WACC)
The WACC shows how much interest a firm must pay for every dollar it finances
(investopedia.com). There are many factors that affect the weighted average cost of
capital. The WACC formula is shown below with all the factors that affect it:
Where: Havertys:
Re = cost of equity Re= 11.38%
Rd = cost of debt Rd= 4.74%
E = market value of the firm's equity E= 202,200
D = market value of the firm's debt D= 143,092
V = E + D V= 345,292
E/V = percentage of financing that is equity E/V= .58559
D/V = percentage of financing that is debt D/V= .414409
Tc = corporate tax rate (For after tax WACC)
*Information provided by Investopedia.com
By all the data we have collected, we can compute WACC. The problem above
shows a step by step process to compute WACC. Havertys’ weighted average cost of
capital is 8.62%.
Conclusion
Based on the data above, we have found the cost of equity (11.38%), the cost of
debt (4.47%), and the weighted average cost of capital (8.62%). We have presented
many methods to use, such as the CAPM, the back door method, and the WACC before
and after tax.

103 | P a g e
Equity Valuations
In determining a firm’s equity value, analysis as well as investors may use
several different methods, models, and theories. These tools when paired with
intellectual contributions from analysts or investors can potentially give a fairly accurate
view of a firm’s true value. However, this view is solely that of the individual and is not
the only reasonably justifiable explanation. The value of a firm’s equity can be arrived
at by the use of two distinct models; the Method of Comparables, or by use of Intrinsic
Valuation Models. The Method of Comparables utilizes ratios that are then compared to
ratios of firms throughout the industry. Using comparable ratios is an easy way to place
a firm within an industry, but it lacks explanatory power and intellectual value is difficult
to add. On the other hand, one can use theory based Intrinsic Valuation Models. These
models are more difficult to configure, and requires an understanding in finance to pull
together figures from the financial statements in order to calculate a share price.
Together, these methods can give an investors and analysts a better understanding of a
firm’s value. Both of these methods will be employed in order to determine whether
Havertys is over, under, or fairly valued.
Method of Comparables
Trailing Price to Earnings
Trailing Price Earnings
PPS EPS P/E Industry
Avg. HVT Price
HVT $11.00 $0.08 134.18 13.83 $1.13 ETH $29.43 $2.46 11.96 WSM $25.68 $1.70 15.11 BBBY $31.27 $2.17 14.41 PIR $6.90 ($1.92) -3.59
*Information for competitors was gotten form yahoo Finance
The chart above shows the Havertys share price using the trailing price to
earnings method. The industry average was computed by dividing each firm’s

104 | P a g e
Price/Share by their Earnings/Share, adding it all together and dividing by 3. We divided
by three because we dicided not to use Pier One Imports for this method due to their
negative EPS. This method suggests Havertys is overvalued, but the low share price is
due to Havertys having extremely low Earnings per Share. This method unfortunately
does not give even a remotely accurate view of the company’s value primarily due to
havertys net income being extremely volatile.
Forward Price to Earnings
Forward Price Earnings
PPS EPS P/E Industry
Avg. HVT Price
HVT $11.00 $1.06 10.38 16.06 $17.02 ETH $29.43 $2.32 12.66 WSM $25.68 $1.51 16.98 BBBY $31.27 $1.93 16.18 PIR $6.90 $0.37 18.42
*Information for competitors was gotten form yahoo Finance
This method of equity valuation is quite similar to that of the trailing price to
earnings except it is calculated using forecasted earnings data. Again we left out Pier
One because their EPS was still negative, which would have thrown off our calculation.
With the forecasted EPS of $1.06 multiplied by the forecasted industry average, this
model suggests that Havertys is undervalued. However, there are no financial theories
that suggest price (a backward looking measure) and projected earnings (a forward
looking measure) have any true ties.
Price to Book
Price to Book
PPS BPS P/B Industry
Avg. HVT Price
HVT $11.00 $13.00 0.85 2.65 $34.43 ETH $29.43 $13.14 2.24 WSM $25.68 $10.52 2.44 BBBY $31.27 $9.42 3.32 PIR $6.90 $2.66 2.59
*Information for competitors was gotten form yahoo Finance

105 | P a g e
Above is the chart explaining price to book ratios for Havertys and its
competitors. The PPS/Book Price per Share results in the P/B ratio. To get an industry
average we added all the competitors P/B ratios and divided them by four. Pier One
was used this time because its P/B was within industry standards. The industry
standard P/B of $2.39 multiplied by Havertys P/B resulted in a price of $34.43. That
suggests that Havertys is underpriced. This however, is not necessarily the case since
Havertys P/B ratio is significantly lower than the industry because its BPS is actually
higher than its PPS. The fact that Havertys P/B ratio is so different from the others
could lead one to believe that Havertys is actually not in the same industry as it’s so
called competitors.
Price Earnings Growth
Price Earnings Growth
PPS EPS P/E PEG Industry
Avg. HVT Price
HVT $11.00 $0.08 134.18 487.66 4.87 $10.98 ETH $29.43 $2.46 11.96 12.36 WSM $25.68 $1.70 15.11 1.41 BBBY $31.27 $2.17 14.41 1.44 PIR $6.90 ($1.92) -3.59 4.26
*Information for competitors was gotten form yahoo Finance
In the caption above we have calculated the price earnings growth
computations. This model is derived by finding an industry average PEG by dividing the
P/E by the growth rate for each firm then adding them all up and dividing by three
because we did not use Pier One because their P/E was negative. We then divided
Havertys P/E by the industry PEG, which was obtained from yahoo finance, then
multiplied that number by havertys EPS and got a price of $10.98 which suggests that
Havertys is fairly priced. However, since Havertys PEG ratio is so much higher than the
industry average due to a large forecasted earnings growth rate, this model is not the
best in terms of explanatory power, and since Havertys’ growth rate on earnings is so
much higher, one could contend again that Havertys is in a different industry from the
other companied featured here.

106 | P a g e
Price to EBITDA
Price to EBITDA
PPS EBITDA P/
EBITDA Industry
Avg. HVT Price
HVT $11.00 $22.18 0.50 0.10 $2.23 ETH $29.43 $137.36 0.21 WSM $25.68 $455.18 0.06 BBBY $31.27 $995.79 0.03 PIR $6.90 ($21.70) (0.32)
*Information for competitors was gotten form yahoo Finance
EBITDA is an acronym that stands for Earnings before interest, taxes,
depreciation and amortization. This calculation again pegs Havertys to the industry
average. Price divided by EBITDA renders P/EBITDA. The industry average was
calculated without Pier One because it had a negative EBITDA and would have skewed
the information. Multiplying the industry average by Havertys EBITDA give us a share
price of $2.23 which suggests that Havertys is overvalued.
Enterprise Value to EBITDA
Enterprise to EBITDA
EV EBITDA EV/
EBITDA Industry
Avg. HVT Price
HVT $224.56 $22.18 10.12 6.52 $144.60 ETH $952.50 $137.36 6.93 WSM $2,076.00 $455.18 4.56 BBBY $8,029.00 $995.79 8.06 PIR $783.47 ($21.70) (36.10)
*Information for competitors was gotten form yahoo Finance
Above is a chart showing the enterprise value to EBITDA. Enterprise value is
composed of the book value of liabilities plus the firm’s market value of equity minus
the firm’s cash and investments. The industry average was derived by averaging
competitors EV/EBITDA ratios. Pier One was not used because cause of the negative
value of its enterprise to EBITDA value. Havertys does not compare well to ther firms in
the industry with respect to enterprise value; even Pier One has a higher enterprise
value, therefore the model shows Havertys to be severely undervalued.

107 | P a g e
Dividend Yield
Dividend Yield
PPS DPS P/DPS Industry
Avg. HVT Price
HVT $11.00 0.068 161.76 182.04 $12.38 ETH $29.43 0.220 133.77 WSM $25.68 0.112 230.31 BBBY $31.27 N/A N/A PIR $6.90 N/A N/A
*Information for competitors was gotten form yahoo Finance
According to financial theory, the value of a firm is the present value of future
cash flows. Dividends are a steady cash flow stream that can be used to measure value
of a firm. With the dividend yield model, the dividends of competitors are used as a
benchmark to determine how well a stock is priced. Only two of Havertys’ competitors
pay dividends, but the average obtained from those companies multiplied by Havertys
dividends per share DPS shows that Havertys is slightly undervalued at $12.32.
However, that is well within the 20% margin used in out intrinsic valuation sensitivity
analysis.
Price to Free Cash Flow
Price to Free Cash Flow
PPS FCF P/FCF Industry
Avg. HVT Price
HVT $11.00 28.98 0.38 0.88 $25.59 ETH $29.43 50.45 0.58 WSM $25.68 18.31 1.40 BBBY $31.27 47.09 0.66 PIR $6.90 -122.80 -0.06
*Information for competitors was gotten form yahoo Finance
Free Cash Flow (FCF) is derived by adding or subtracting Cash Flows from Investing
Activity from Cash Flows from Operations. We divide the price of a stock by their FCF to
get a price to free cash flow. We take the average of Havertys competitors (excluding
Pier One because it has a negative P/FCF) and multiply that by Havertys FCF to get a
price. The price $25.59 suggests that Havertys is undervalued.

108 | P a g e
Conclusion
Careful analysis of the computations in this section does not reveal weather or
not Havertys is fairly valued or not. Only the PEG and dividend Yield models suggest
that Havertys is fairly valued, while Price to Book, Enterprise Value to EBITDA, Forward
P/E, and the Price to Free Cash Flow show Havertys to be undervalued. Still, Trailing
price to Earnings and Price to EBITDA show Havertys to be overvalued. These models
however, are only numbers that are pegged to other numbers. In order to really get an
accurate view of the value of the company, one must also look at intrinsic information.
These calculations can be done by any layperson, and numbers used are pegged to
publicly available numbers. Doing these calculations adds absolutely no intellectual
value to the hypothesis. Also it is not possible to put such diverse outputs together to
determine the value of a stock.
Intrinsic Valuations
“Valuations is the process of converting forecasts into an estimate of the value
of the firm’s assets or equity” (Palepu&Healy). The way they differ from multiples based
ratio analysis because they are done using personal estimations. Intrinsic valuations are
focused only on the firm being valued and use financial data to figure their calculations.
These models are not only used internally for capital budgeting and strategic planning,
but also by security and credit analysts outside the firm (Palepu&Healy). This is why it
is so important to accurately forecast out all three of the financial statements. If not
done accurately, it can be extremely detrimental to the firm. The five theory based
models we used to value Havertys includes: Discounted Dividends model, the Free Cash
Flow Model, the Residual Income model, the Long Run Residual Income Model, and the
Abnormal Earnings Growth Rate. Together, these models should give a fairly accurate
view of the firm’s actual value compared to the information obtained with the method
of comparables.

109 | P a g e
Discounted Dividends Model
The Discounted Dividend Model is used to value a firm because it is assumed
that the price of a stock is the present value of future earnings. Discounting dividends
to their present value will give an insight to the actual value of the firm. This model is
fairly simple and has problems. It assumes that the company will continue forever,
however all firms are subject to business and systematic risk. Therefore there is the
potential that a firm could always cease to exist at some point in time. Also, it is
incapable of valuing a company that does not pay dividends, and it only has an
adjusted R2 of about 5%. Thus, the discounted dividends model has only about 5%
explanatory power for the stock price.
In order to come up with a share price for Havertys, we took our forecasted
dividends and got forecasted DPS for each year forecasted. Then we multiplied each of
them by their respective present value factor. Getting the PV factor was accomplished
by:
PV Factor = 1/(1+ke) ^Number of periods out from base year
Then we added up all the year by year PV dividends, which totaled: $1.68
The next step was to find the terminal value perpetuity of the dividends. In order
to do this we needed a growth rate so we averaged the dividend growth rate during our
forecasted time frame.
The forecasted dividend growth for Havertys is as follows:
1 2 3 4 5 6 7 8 9 10 AVG -4% -4% 4% 4% 4% 3% 3% 3% 3% 3% 3%
The value of the dividends after the forecasted time is as follows:
Present Value Continuing Perpetuity = 1.42 = [.35/(.1138-.03)] * PV Factor
Where Ke using the Back Door Method is 11.38% and a 3% growth.
Next we added the two up to get: 1.68 + 1.42 =3.10, but that price is the value at
December 31, 2007, and we need the price as of April 1, 2008 in order to accurately
compare it to the observed price.
The time consistent price is: $3.10 * (1+.1138)^(3/12) = $3.39

110 | P a g e
The observed stock price on April 1, 2008 was $11.00. When compared to the $3.39
from the discounted dividends model, it appears that the firm is overpriced. However,
this model has the least explanatory power of all the intrinsic model valuations.
Perpetuity Growth Rate (g) 0.00% 1.50% 3.00% 4.50% 6.00%
7.00% $4.86 $5.59 $6.88 $9.70 $20.99 9.00% $3.77 $4.12 $4.65 $5.54 $7.30
10.00% $3.39 $3.65 $4.02 $4.59 $5.58 11.38% $2.98 $3.15 $3.39 $4.50 $4.26 13.00% $2.61 $2.73 $2.87 $3.08 $3.36 Co
st o
f Eq
uity
14.00% $2.43 $2.52 $2.63 $2.78 $2.99
Undervalued Greater than $12.54
Overvalued Less than $9.46
Fairly Valued Between 12.54-9.46
Actual Share Price 4/1/2008: $11.00
The chart above shows the sensitivity Analysis for Havertys using the discounted
dividends model. The chart explains how much variation in price can be achieved in
different growth rates and different costs of equity. According to the chart, a growth
rate of 4% and a Ke of 7% would suggest that Havertys observed price is appropriate.
However, any lower growth, or higher cost of equity would make the firm overvalued at
its current price. The only area that could suggest that the firm is undervalued is if the
growth and Ke were almost identical. This is a small possibility due to the amount of
dividend growth projected for the firm in the second, third, and fourth projected years
where forecast errors are still small.

111 | P a g e
Free Cash Flows Model
The Free Cash Flow Model is used to determine the value of equity by calculating
the present value of future free cash flows generated by a firm. The future cash flows
are determined through our forecasted financial statements. These free cash flows
represent the funds that a firm has to pay debt and equity holders. In order to calculate
free cash flows you must use the following equation:
Free Cash Flow = CFFO Activities +/- CFFI Activities
When determining the equity value of Havertys using the Free Cash Flow
Model, we began by forecasting the firms free cash flows and discounting them back to
the present using a present value factor. This can be done using the same formula in
the Discount Dividends Model. However, instead of using the cost of equity we used
their WACCBT of 8.62% in our calculations of each year’s present value factor.
Each year’s free cash flow values were then multiplied by their present value
factors (1/ (1+WACCBT)^t) to give us the annual present value of free cash flows.
Adding the annual present value of free cash flows gave us a total present value of free
cash flows of $226,194thousand. The continuous terminal value perpetuity and its
present value was then calculated using the following equations:
• Continuous TV Perpetuity = FCFyr 11/ (WACCBT – FCF growth rate)
$1018663= $57249 / (.0862 - .03)
• PV of Terminal Perpetuity = Cont. TV Perpetuity x PV Factoryr 10
$44559 = 1018663 x 0.4374
Havertys total firm value was determined to be $706,781 by adding the total present
value of annual free cash flows and the present value of the terminal perpetuity. Since
the book value of debt for Havertys is $143,092, we subtracted this value from our
calculated firm value to get the firms market value of equity of $563,689. This value
was then divided by 21,444 thousand shares outstanding to get a share price of $26.29.
This value was then converted into a 04/01/08 share price by multiplying it by one plus

112 | P a g e
the WACCBT raised to the remaining 3 months over 12 giving us an implied share price
of $26.84.
Perpetuity Growth Rate (g) 0.00% 1.00% 3.00% 5.00% 9.00%
4.00% $55.71 - - - - 5.00% $42.28 $51.01 - - - 7.00% $27.43 $30.85 $42.82 - -
8.62% $20.41 $22.32 $26.84 $40.46 - 10.00% $15.37 $16.54 $19.89 $27.39 - W
ACC
(BT)
12.00% $11.18 $11.85 $13.63 $17.56 $35.56 PPS as of April 1,2008 Undervalued Greater than $12.54
$11.00 Overvalued Less than $9.46
Fairly Valued Between 12.54-9.46
Actual Share Price 04/01/2008 = $11.00
The above chart is the sensitivity analysis for Havertys using the Free Cash
Flow valuation model. We decided to grow WACCBT from 4% to 12% and the growth
rate from 0% to 9%. The chart will then illustrate how much variation in price can be
achieved when using different growth rates and different WACCBT. The share prices
generated in our sensitivity analysis show that for the most part the company is being
undervalued. However, when using a 12% WACCBT, a growth rate of 0%-1% will result
in the firm being fairly valued. The chart also illustrates how vast the company will be
undervalued if given a low WACCBT and a high growth rate.
Residual Income Model
Another intrinsic valuation method that can be used is the Residual Income
Model. One of the reasons analysts use this particular model is because of how little
impact an estimation error has on the equity valuation. For our equity valuation of
Havertys using the Residual Income Model, we began by compiling the future book

113 | P a g e
value of equity values, forecasted earnings, and forecasted dividends. In order to derive
a share price, residual income needed to be calculated and discounted back to the
current time period.
The first thing we had to determine was the benchmark income. This is found by
taking the beginning book value in a given year and multiplying it by the derived cost of
equity. Then you take the benchmark income and subtract it from the same year’s
actual net income for each year. The formulas shown below are how to calculate
normal and residual income:
Normal Income = BVE(t-1) x Cost of Equity
Residual Income = Earnings(t) – Actual Net Income(t)
2009 2010 2011 2012 2013 2014 2015 2016
RI 25078 23431 21262 22173 22686 21872 20182 21010 20726
Change
in RI
2169 -940 513 813 576 463 -178 284
The present value of each year’s residual income was then determined by
calculating the present value factor equation that was used in the previous models
(using a cost of equity of 11.38). Once the present value of each year’s annual residual
income was determined, they were added to give us a present value of annual residual
incomes of $64,466. We then calculated the continuous terminal value perpetuity and
its present value. The formulas below are what we used to determine the continuous
perpetuity and the present values of the perpetuity
Continuous TV Perpetuity = Residual Incomeyr 11/ (Ke – RI Growth Rate)
PV of Terminal Perpetuity = Cont. TV Perpetuity x PV Factoryr 10
The total present value of annual residual income and the present value were then
added to Havertys book value of equity and divided by 22,328 of the firms outstanding

114 | P a g e
shares. This gave us an estimated price per share of $5.14 which we multiplied by
1+.1138 ^ 3/12. This generated a share price of $5.28 for Havertys on 04/01/08. This
is almost $6.00 under the implied share price so we conducted a sensitivity analysis to
further investigate.
Growth Rate
0.00% -10.00% -20.00% -30.00% -45.00% 7.00% $7.01 $8.51 $8.90 $9.08 $9.22 9.00% $5.17 $6.76 $7.25 $7.49 $7.69
10.00% $4.55 $6.07 $6.58 $6.83 $7.04 11.38
% $3.90 $5.28 $5.79 $6.05 $6.26 Cost
of
Equi
ty
13.00% $3.22 $4.53 $5.01 $5.27 $5.48 14.00% $3.04 $4.15 $4.60 $4.85 $5.07
Undervalue
d Greater than $12.54
Overvalued Less than $9.46
Fairly Valued Between 12.54-9.46
The diagram above shows cost of equity and residual income growth rates that
were used to determine different share prices for Havertys. After conducting the
sensitivity analysis for the Residual Income Model, we noticed that share prices were
overvalued for any given cost of equity or growth rate. However, these prices only
range from $9.22 to $3.04, showing that there is little volatility. As described above,
this is exactly why analysts use this model to value firms. The estimations of the two
variables cause very little change showing that estimation error does not significantly
impact the model.
Long Run Return on Equity Residual Income Model

115 | P a g e
The Long Run Residual Income Model is used to calculate a firm’s equity value
by using information found in the Residual Income Model. Analysts use this model to
determine the present value of a firm’s equity. In order to begin this model we
determined our book value of equity to be $278,845 thousand which was found on the
balance sheet. Using this we were able to forecast out our BV or Equity for the
remaining years. Then we computed the long run return on equity and growth rate
numbers. This was done by using the following formulas:
ROE = Net Income in current year / Book Value of Equity in previous year
Growth = (Current year’s equity – previous year’s equity) / Previous year
ROE 2% 3% 4% 3% 3% 4% 4% 4% 4% 5%% change in BVE
-2% 1% 1% 1% 1% 1% 2% 2% 2% 2%
Shown above is Havertys’ long run return on equity and growth rates over a ten year
period. Using this table we established a ROE of 4% and a growth rate of 2%.
We then used BV of equity, long run ROE rate, ROE growth rate and the Cost of Equity
to determine the estimated market value of equity. This is illustrated in the equation
below.
Value of Firm= BVE (1+ ((LR ROE – Ke / (Ke – LR Growth of Equity))
From this formula we were able to calculate that the value of the firm to be $59,445
thousand. To get an estimated price per share we divided the MVE by the 22328 shares
outstanding. This value was then multiplied by (1+ke) ^ 93/12) to give us a share price
of $2.74 as of April 1, 2008.
Long Run Return on Equity

116 | P a g e
2.00% 3.00% 4.00% 6.00% 8.00%
7.00% - $ 2.54 $ 5.08 $10.16 $15.24
9.00% - $ 1.78 $ 3.65 $ 7.29 $10.94
10.00% - $ 1.60 $ 3.12 $ 6.39 $ 9.37
11.38% - $ 1.37 $ 2.74 $ 5.47 $ 8.21
Cost
of
Equi
ty
13.00% - $ 1.17 $ 2.34 $ 4.68 $ 7.02
14.00% - $ 1.08 $ 2.15 $11.00 $ 6.45
Undervalued Greater than $12.54
Overvalued Less than $9.56
Fairly Valued Between
12.54-9.56
Long Run Growth Rate in Equity
0.00% 1.00% 2.00% 4.00% 5.00% 0.00% - - - - -
2.00% - $ 1.24 - - -
3.00% - $ 2.47 $ 1.37 - -
4.00% - $ 3.71 $ 2.74 - -
Long
Run
Ret
urn
on E
quity
6.00% - $ 6.18 $ 5.33 $ 3.48 $ 2.01
8.00% - $ 8.65 $ 8.21 $ 6.95 $ 6.03
Undervalued Greater than $12.54
Overvalued Less than $9.56
Fairly Valued Between
12.54-9.56
Cost of Equity

117 | P a g e
7.00% 9.00% 11.38% 13.00% 14.00% 0.00% $7.26 $5.67 $4.51 $3.96 $3.69 1.00% $6.35 $4.79 $3.71 $3.12 $2.98 2.00% $5.08 $3.65 $2.74 $2.34 $2.15
4.00% - - - - -
Long
Run
Gro
wth
Rat
e in
Equ
ity
5.00% - - - - -
7.00% - - - - -
Undervalued Greater than $12.54
Overvalued Less than $9.56
Fairly Valued Between
12.54-9.56
Actual Share Price 04/01/08 = $11.00
The above charts are sensitivity analyses for the Long Run Return on Equity Residual
Income Model for Havertys. In this particular sensitivity analysis, we used had to use
three different variables to evaluate the fluctuations in share prices. These included
long run return on equity, long run equity growth rate, and cost of equity. As you can
see from all three graphs, the share price of Havertys is significantly overvalued.
Abnormal Earnings Growth Model
The Abnormal Earnings Growth Model (AEG) consists of finding the future
utilized earnings and the above normal earnings experienced by a firm. It is very similar
to the Residual Income model; however, you do not use previous year’s data to
compute your share price. You can find Abnormal Earnings Growth by taking the
difference between the cum-dividend earnings and normal income. This value then
needs to be discounted back to the present for the share price calculation. This model is
also considered a very accurate valuation because it is not as sensitive to cost of capital
and growth rates.
In our equity valuation of Havertys using the Abnormal Earnings Growth
Model, we began by implementing our forecasted earnings. From this we used the
following equations to find out AEG YBY.
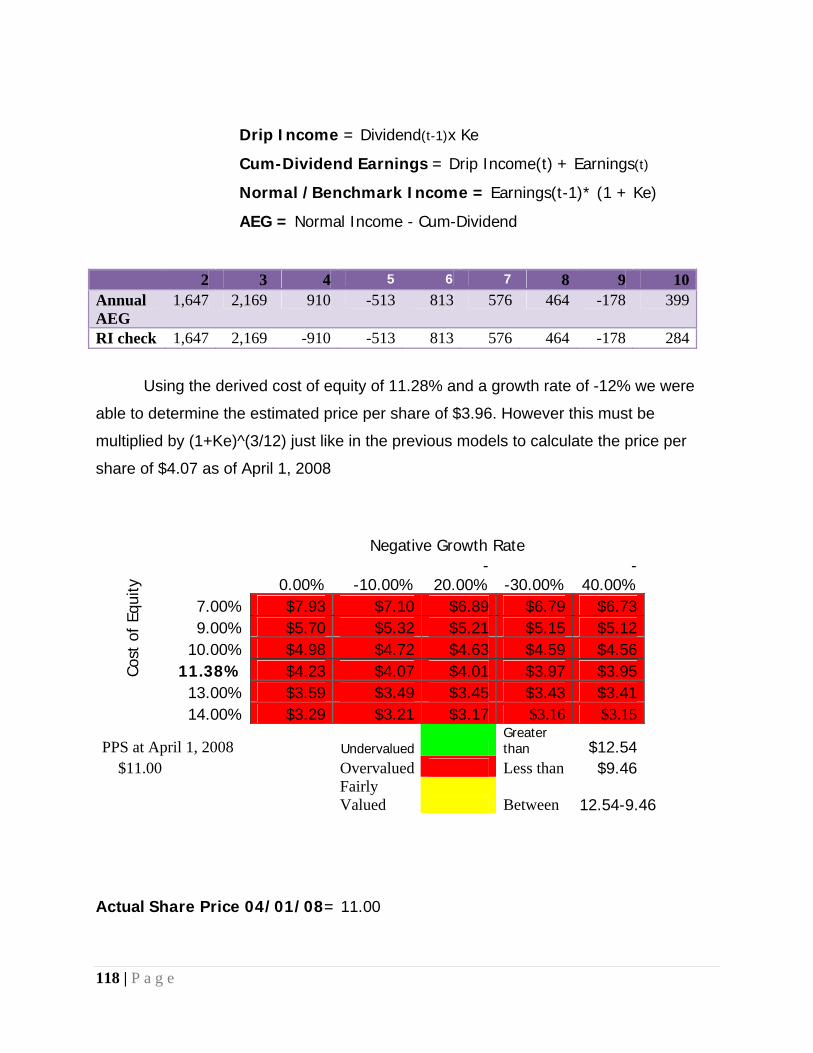
118 | P a g e
Drip Income = Dividend(t-1)x Ke
Cum-Dividend Earnings = Drip Income(t) + Earnings(t)
Normal /Benchmark Income = Earnings(t-1)* (1 + Ke)
AEG = Normal Income - Cum-Dividend
2 3 4 5 6 7 8 9 10Annual AEG
1,647 2,169 910 -513 813 576 464 -178 399
RI check 1,647 2,169 -910 -513 813 576 464 -178 284
Using the derived cost of equity of 11.28% and a growth rate of -12% we were
able to determine the estimated price per share of $3.96. However this must be
multiplied by (1+Ke)^(3/12) just like in the previous models to calculate the price per
share of $4.07 as of April 1, 2008
Negative Growth Rate
0.00% -10.00%-
20.00% -30.00%-
40.00% 7.00% $7.93 $7.10 $6.89 $6.79 $6.73 9.00% $5.70 $5.32 $5.21 $5.15 $5.12
10.00% $4.98 $4.72 $4.63 $4.59 $4.56 11.38% $4.23 $4.07 $4.01 $3.97 $3.95 Co
st o
f Eq
uity
13.00% $3.59 $3.49 $3.45 $3.43 $3.41 14.00% $3.29 $3.21 $3.17 $3.16 $3.15
PPS at April 1, 2008 Undervalued Greater than $12.54
$11.00 Overvalued Less than $9.46
Fairly Valued Between 12.54-9.46
Actual Share Price 04/01/08= 11.00

119 | P a g e
The chart above is a sensitivity analysis for the Abnormal Earnings Growth Model in our
equity valuation of Havertys. As discussed before, this model is very reliable because of
the insignificant impact of changing costs of equity and growth rates. The sensitivity
analysis also illustrates that Kroger’s share price is overvalued regardless of the changes
in costof equity and growth rates. Much like the Residual Income Value, the change in
price from 7.93 – 3.15 is very small showing why this is such an accurate model to use.
Conclusion
After calculating all of the Valuation Models an analyst should be able to tell if a
firm is undervalued, overvalued, or fairly valued. In the case of Havertys, we have
concluded that their share price of $11.00 on April 1, 2008 was significantly overvalued.
The Free Cash Flow model was the only valuation model that showed Havertys share
price to be undervalued. However, the Free Cash Flow Model does have significant
flaws to consider. Therefore, we based our assumption after conducting the AEG and RI
Models which are much more reliable.
Analyst’s Recommendation

120 | P a g e
The consensus is that Havertys is overvalued. This conclusion is based off of
industry analysis, accounting analysis, financial analysis, equity analysis, method of
comparables, and intrinsic valuation models.
When conduction our industry, financial, and equity valuations we heavily relied
upon Havertys’ competitors. Ethan Allen, Pier One, and Williams-Sonoma were chosen
as Havertys’ competition because of customer base and the fact they only sell home
furnishings.
Havertys operating leases raise concern about discrepancies in accounting
policies. Significant operating leases should be added back to the financial statements
to depict the firm in a more accurate light. Although most of Havertys’ competitors use
operating leases, it still causes discrepancies which negatively affect out valuation
models. Expense manipulation ratios were restated as well as the financial statements.
Suring our equity valuation, we calculated liquidity ratios, profitability ratios, and capital
structure ratios which allow us to compare Havertys’ financial performance to its
competitors and the industry. Most of these ratios point out that Havertys is performing
under the industry and competitors. One concern raised was inefficient inventory
handling. Havertys insufficient storage space accounts for their inefficiency in inventory
handling. This inefficiency negatively affects sales. Operating income is another area in
which Havertys is struggling. From the profitability ratios we were able to determine
that Havertys might struggle with covering their fixed costs if they do not get control of
their operating income.
When forecasting out ten years of financials, we were forced to make several
assumptions about Havertysfinancial data. The home furnishings industry is closely
related to the housing market. Due to the current housing slump we used conservative
estimates to forecast sales growth, asset turnover, and the current ratio.
The method of comparables used in evaluating Havertys’ equity shows varied
results. Havertys was shown to be fairly values, undervalued, and overvalued. However,
the method of comparables alone cannot accurately judge the validity of Havertys’ stock
price. Intrinsic valuations were also necessary in order to judge the value of the firm.

121 | P a g e
Four of the five intrinsic models illustrated that Havertys was overvalued. Therefore, we
humbly suggest that current stockholders consider selling their share of Havertys Inc.

122 | P a g e
Reference Page
1. First Research Industry Profile: Furniture Stores http://www.firstresearch.com
2. Havertys Furniture Companies, Inc.
2002-2006 Annual Reports http://www.havertys.com
3. Yahoo! Finance
http://www.finance.yahoo.com
4. MSN Money http://moneycentral.msn.com
5. Business Analysis and Valuations: Using Financial Statements 4th Ed Palepu and
Healy 6. Wikipedia.com 7. Investopedia.com 8. about.com
Wall Street Journal Articles: 1. (2007, Dec. 26). Home Prices Fall, Homeowners in a Bind. Wall Street Journal.
Retrieved February 3, 2008 from the Wall Street Journal Online Web site: http://blogs.wsj.com/developments/2007/12/26/home-prices-fall-homeowners-in-a-bind/
2. Bater, Jeff. (2008, Jan. 2). Home Sales Rise, But Gaines Aren’t Likely to Continue.
Wall Street Journal. p. A2. Retrieved February 2, 2008, from the Wall Street Journal Online Web site: http://online.wsj.com/article/SB119910662197259261.htm
3. Campoy, Ana. (2007, Dec.4). Pricey Diesel Compounds Worries. Wall Street Journal.
p. A12. Retrieved Jan 25, 2008 from the Wall Street Journal Online Web site: http://online.wsj.com/article/SB119672854525012439.html
4. Cummins, Chip, Neil King Jr. and Russell Gold. (2008, Jan. 3). Oil Hits $100, Jolting

123 | P a g e
Markets. Wall Street Journal. p. A1. Retrieved February 6, 2008 from the Wall Street Journal Online Web site: http://online.wsj.com/article/SB119932015772763671.html
5. Kingsbury, Kevin and Amy Merrick. (2008, Feb. 8). Retail Squeeze Felt Far Beyond
Malls. Wall Street Journal. p. B1. Retrieved February 10, 2008 from the Wall Street Journal Online Web Site: http://online.wsj.com/article/SB120238618499550605.html
6. McQueen, M.P. (2008, Jan. 8). Safety Push Focuses on Retailers. Wall Street Journal.
p. A3. Retrieved February 8, 2008, from the Wall Street Journal Online Web site: http://online.wsj.com/article/SB119976060860973901.html
7. McQueen, M.P. (2008, Jan. 12). Some Stalled Safety Rules For Products May be
Enacted. Wall Street Journal. p. A2. Retrieved February 3, 2008, from the Wall Street Journal Online Web site: http://online.wsj.com/article/SB120011105356285949.html