An eprentise white paper … · Oracle, Oracle Applications, ... Prepare and issue automated checks...
15
Show Me the Money Reduce the Costs of Running ERP An eprentise white paper By Helene Abrams
Transcript of An eprentise white paper … · Oracle, Oracle Applications, ... Prepare and issue automated checks...

Show Me the Money Reduce the Costs of Running ERP
An eprentise white paper By Helene Abrams

Author: Helene Abrams
Published: January 2010
www.eprentise.com
© 2010 eprentise, LLC. All rights reserved.
eprentise is a registered trademark of eprentise, LLC.
FlexField Express and FlexField are registered trademarks of Sage Implementations, LLC.
Oracle, Oracle Applications, and E-Business Suite are registered trademarks of Oracle Corporation.
All other company or product names are used for identification only and may be trademarks of their respective owners.

Table of Contents
CALCULATING THE COST OF OPERATIONS ......................................................................................................................................... 1
EXAMPLE COST CALCULATION................................................................................................................................................................ 2
REDUCING COSTS ACROSS THE ENTERPRISE ...................................................................................................................................... 8
FROM DISTRIBUTED OPERATIONS TO SHARED SERVICES ................................................................................................................ 10
PREPARATION FOR AN ERP SOFTWARE UPGRADE........................................................................................................................... 12
Table of Figures Figure 1: Organization Chart of $4 Billion Company ......................................................................................................... 2
Figure 2: General Accounting Cost Calculation ................................................................................................................ 3
Figure 3: Accounts Payable Cost Calculation .................................................................................................................... 4
Figure 4: Accounts Receivable Cost Calculation ................................................................................................................ 5
Figure 5: Purchasing Cost Calculation .............................................................................................................................. 6
Figure 6: Basic Finance Activities ..................................................................................................................................... 7
Figure 7: Calculating Savings ............................................................................................................................................ 9
Figure 8: General Accounting Costs and Improvement Opportunities ..............................................................................10
Figure 9: Assess Degree of Automation ..........................................................................................................................11

©2010 eprentise, LLC. All rights reserved. 1
Show Me the Money
Reduce the Costs of Running ERP
Reducing costs is the major strategic focus for most companies. An often-overlooked cost is the general
operation of financial operations. This paper details a methodology for calculating the costs of running
financial modules in ERP systems. The costs are compared against both internal and external benchmarks.
After calculating the costs, the paper shows how to reduce costs in two ways: first, by eliminating work that is
duplicated across different business units or divisions, and second by determining which operations that are
currently distributed across the organization can be consolidated into a shared services center. Together these
changes, both to the organization and the ERP system, can generate significant cost savings. The paper
discusses how a $4 billion company using Oracle E-Business Suite (EBS) consolidated its distributed accounting
departments, one for each European country, into a shared services organization supporting all European
operations. The cost savings realized and the streamlining of operations prepared for the organization for a
major ERP software upgrade.
Calculating the Cost of Operations The cost of operations is calculated by breaking down how much time is spent on an activity during the year
by each person doing that activity, how many items were processed, and then calculating the cost using a
baseline cost of FTE. As an example, for AP, each department would calculate the number of hours in a year
spent on each of the following tasks or activities:
Maintain policies and procedures
Enter, code, match, and correct payment documents
Prepare and issue automated checks
Certify checks
Process manual checks and special payment requests
Respond to vendor and internal inquiries
Perform Reconciliations
Perform corporate and government reporting
Create Corporate Chargebacks
Other A/P Activities The hours would be translated to a number of Full-Time Equivalents (FTEs) by dividing the hours by 2080 (the
number of hours for a person working full time per year). A baseline average burdened (including benefits
and expenses) salary is then multiplied by the number of FTEs to calculate the annual cost of that activity. To
obtain the cost of an operation, multiply the number of items processed (i.e. number of checks) by the cost of
the activity. For each of the finance areas, costs are calculated to measure the performance of each activity.
For example, General Accounting would calculate the number of journal entries processed per FTE per year
and compare those to an internal benchmark. Travel and Entertainment would calculate the number of
expense reports processed per FTE per year. Fixed Assets would calculate the number of unique fixed assets or
line items per FTE per year. Accounts Receivable would calculate the number of bills issued per FTE per year.
To access the free
eprentise Show Me the
Money Cost Savings
Calculator click here.

©2010 eprentise, LLC. All rights reserved. 2
In other words, each area would develop its own internal key performance metric and a way to calculate that
metric against FTEs contributing to the process. In aggregate these calculations may uncover significant
additional cost savings that could be realized quickly and relatively painlessly by migrating from a distributed
services model to a shared services model.
Example Cost Calculation
In the following example (actual data from a $4 billion company), the company had one set of books for each
European country in which they were operating. The example looks at costs for six of those sets of books. The
company had been on Oracle EBS for 4 years prior to the adoption of the Euro, so a different set of books was
established for each currency. All examples have been translated to USD. The General Manager had
responsibilities for all the financial activities with Directors from each country reporting to her. The
organization looked like this:
Figure 1: Organization Chart of $4 Billion Company
CEO
Corp HQ
General Manager
Sales MarketingFinance
Accounting
France
Germany
Spain
Austria
Italy
Ireland
HR R&D Production

©2010 eprentise, LLC. All rights reserved. 3
The costs were calculated as follows:
France Italy Germany Austria Ireland Spain Summary/Average
General Accounting (GL) FTEs
Average Burdened Cost per FTE $ 111,200 $ 54,631 $ 56,061 $ 56,870 $ 82,500 $ 68,603 $ 71,644
Maintain GA policy and procedures, and Chart of Accounts 0.1 1.2 0.25 0.2 0.36 0.25 2.36
Perform closing and reporting 0.25 4.2 5.45 1.35 1.33 4 16.58
Prepare/ setup recurring and automated JEs. 0.05 1 1.4 0.1 0.2 0.1 2.85
Prepare and enter manual JEs 0.1 3.7 4 0.4 0.73 0.5 9.43
Perform account and other detailed reconciliations 0.2 3.1 9.25 1 0.38 1.65 15.58
Intercompany accounting and reconciliation 0.1 0.6 3 0.5 0.6 2.5 7.3
Respond to requests and restatements 0.2 0.5 5.55 0.4 1 1 8.65
Other GA activities 0 2.7 4.1 1.8 7 1.25 16.85
Total FTE 1 17 33 5.75 11.6 11.25 79.6
General Accounting (GL) Volumes
Number of accounts (prime + subaccounts) 10,000 16,000 104,925 1,000 1,957 3,699 137,581
Number of manual closing entries 120 0 1 400 8,508 0 9,029
Number of recurring / repetitive/allocation journal entries 120 2,424 2,676 55 5,448 2,448 13,171
Number of JEs posted via automated subsystem interfaces 12,000 650 15,600 4,200 448 312 33,210
Number of manual journal entries 600 10,450 10,500 400 19,044 5,600 46,594
Number of intercompany JE transactions 120 1,200 1,644 300 12 2,000 5,276
General Accounting (GL) Costs Averages
Maintenance per account $ 1.11 $ 4.10 $ 0.13 $ 11.37 $ 15.18 $ 4.64 $ 6.09
Cost of closing and reporting $ 231.67 NA $ 305,532.45 $ 191.94 $ 12.90 NA $ 50,994.82
Cost per recurring / repetitive/allocation journal entry $ 46.33 $ 22.54 $ 29.33 $ 103.40 $ 3.03 $ 2.80 $ 34.57
Cost per reconciliation with subsystems $ 1.85 $ 260.55 $ 33.24 $ 13.54 $ 69.98 $ 362.80 $ 123.66
Cost of manual transactions, requests, restatements $ 55.60 $ 21.96 $ 50.99 $ 113.74 $ 7.49 $ 18.38 $ 44.69
Cost of intercompany transactions $ 92.67 $ 27.32 $ 102.30 $ 94.78 $ 4,125.00 $ 85.75 $ 754.64
Figure 2: General Accounting Cost Calculation

©2010 eprentise, LLC. All rights reserved. 4
France Italy Germany Austria Ireland Spain Summary/Average
Accounts Payable (AP) FTEs
Average Burdened Cost per FTE $47,500 $84,015 $42,714 $68,256 $59,748 $68,603 $61,806
Enter, code, match and correct invoices 1.5 18.5 1.75 19.62 0.75 7.5 49.62
Prepare and issue automated checks 0.25 3.3 1.35 1.2 2.5 1.8 10.4
Certify checks 0 0 0 0.05 0 0.1 0.15
Process manual checks and special payment requests 0.2 1.5 1.4 4.85 1.2 0.75 9.9
Perform Reconciliations 0.2 3.1 2.25 2.75 0.3 1.2 9.8
Perform corporate and government reporting 0.1 0.1 0.2 1.6 0 0.3 2.3
Corporate Chargebacks 0.1 0.15 0 0 0 0 0.25
Respond to vendor and internal inquiries 0.4 2.5 1.75 1.81 0.3 1.25 8.01
Total FTE 2.75 29.15 8.7 31.88 5.05 12.9 90.43
Accounts Payable (AP) Volumes Number of invoices processed 50,000 1,305,000 59,000 1,225,000 25,000 430,000 3,094,000
Number of automated checks printed 10,400 214,500 45,000 80,000 114,173 92,000 556,073
Number of checks corrected, voided, manual 700 13,500 4,000 32,315 5,430 2,500 58,445
Number of intercompany transactions/chargebacks 750 1,560 0 521 0 75 2,906
Number of vendor inquiries 1,000 8,100 3,400 4,450 1,050 2,000 20,000
Accounts Payable (AP) Costs Averages
Cost per invoice $1.62 $1.39 $2.90 $1.25 $2.51 $1.39 $1.84
Cost per automated check $1.14 $1.29 $1.28 $1.07 $1.31 $1.42 $1.25
Cost per manual check $13.57 $9.34 $14.95 $10.24 $13.20 $20.58 $13.65
cost for corporate chargebacks and intercompany $6.33 $8.08 NA NA NA NA 7.21
Cost per Vendor Inquiry $19.00 $25.93 $21.99 $27.76 $17.07 $42.88 $25.77
Figure 3: Accounts Payable Cost Calculation

©2010 eprentise, LLC. All rights reserved. 5
France Italy Germany Austria Ireland Spain Summary/Average
Accounts Receivable (AR) FTEs
Average Burdened Cost per FTE $ 76,872 $ 36,111 $ 63,245 $ 103,052 $ 34,235 $ 57,487 $ 61,834
Prepare and send customer statements/invoices 0.1 0 1 2 1.31 10 14.41
Record and account for transactions 0.1 0 0.2 0 0.29 11 11.59
Process credit memos and refund checks 0 0 0.2 0 0.43 0.2 0.83
Maintain pricing information 0 0 0.1 0 0 0 0.1
Perform reconciliations, investigate discrepancies and correction of posting
0.2 0.1 1 2.5 2.68 2.15 8.63
Maintain customer account records, respond to customer inquiries
0.1 0 0.6 1.7 1.91 1.85 6.16
Post cash to customer accounts, deposit checks in bank, reconcile bank statements
0.3 0.1 1.05 1.75 1.21 0.8 5.21
Provide credit and collection support, other cash and collections activity
0.1 0 2.6 12.5 1.93 0.9 18.03
Total FTE 0.9 0.2 6.75 20.45 9.76 26.9 64.96
Accounts Receivable (AR) Volumes
Number of payments received 600,000 480 15,000 103,740 8,931 43,200 771,351
Number of invoices, bills, statements 650 636 70,584 50,232 31,109 30,600 183,811
Number of credit memos, refund checks 50 0 2,000 7,632 5,725 520 15,927
Number of active customers 450 29 800 16,000 493 900 18,672
Days sales outstanding at end of period 45 5 55 17 9 53 184
Accounts Receivable (AR) Costs Averages
Cost per statement/invoice $ 0.01 NA $ 4.22 $ 1.99 $ 5.02 $ 13.31 $ 4.91
Cost per credit memo/refund check NA NA $ 6.32 NA $ 2.57 $ 22.11 $ 10.34
Cost per transaction $ 0.04 $ 7.52 $ 5.06 $ 2.48 $ 11.38 $ 17.50 $ 7.33
Cost per customer $ 17.08 NA $ 47.43 $ 10.95 $ 132.63 $ 118.17 $ 65.25
Cost of Collections $ 170.83 NA $ 2,989.76 $ 75,773.53 $ 7,341.51 $ 976.19 $ 17,450.36
Cost of posting cash, bank reconciliation, other banking activities
$ 23,061.60 $ 3,611.10 $ 66,407.25 $180,341.00 $41,424.35 $45,989.60 $ 60,139.15
Figure 4: Accounts Receivable Cost Calculation

©2010 eprentise, LLC. All rights reserved. 6
France Italy Germany Austria Ireland Spain Summary/Average
Expense Processing FTE
Average Burdened Cost per FTE $ 65,500 $ 122,284 $ 144,117 $ 33,333 $ 40,000 $ 25,966 $ 71,867
Process purchase requisitions/purchase orders/ and RFI/RFQ quotations
1 3 3 0 0 0 7
Process and file time sheets 0.5 0 0 36 0 1.16 37.66
Audit expense reports and receipts 0.25 6 0 7.5 0 0.25 14
Maintain vendor relations/maintain vendor list. Reconcile vendor billing reports/ endure quality levels
45.3 45.2 47.25 45 45 45 272.75
Other PO activities 0.6 3.5 5.35 0 0.4 4.15 14
Total FTE 47.65 57.7 55.6 88.5 45.4 50.56 345.41
Expense Processing Volumes
Number of requisitions/purchase orders 3,763,250 16,000 11,000 0 0 16,000 3,806,250 Number of hourly and salaried timesheets 1,156 0 0 0 0 940 2,096 Number of expense reports processed 1,000 0 0 0 0 1,212 2,212 Number of Active Vendors 460 5,245 3,172 0 0 3,250 12,127
Expense Processing Costs
Cost per purchase requisition/order $ 0.02 $ 22.93 $ 39.30 NA NA NA $ 20.75 Cost for processing timesheets $ 28.33 NA NA NA NA $ 32.04 $ 30.19 Cost per expense report $ 16.38 NA NA NA NA $ 5.36 10.87 Cost per active vendor $ 6,450.33 $ 1,053.81 $ 2,146.76 NA NA $ 359.53 $ 2,502.61
Figure 5: Purchasing Cost Calculation
A similar organizational structure might exist for any organization with different operating divisions or different lines of business. A technology
company, for example, that sells both products and services and is organized along those two different lines of business may have different sets of
books for each, one that takes into account revenue recognition rules around warranties or software maintenance licenses for the products it sells
and licenses, and another that handles billing for projects or other services provided on a time and materials basis.
But this organizational structure by design, although set up to be effective and efficient for a particular country or division, is grossly inefficient
overall. All of the work performed by the teams supporting each division is replicated in each other division by a dedicated team with its own set of
policies and procedures. When it comes to consolidating information from the various systems for period end reports, the consolidation takes
place off line in countless spreadsheets that are prone to unintended errors or omissions. And when it comes to training staff, each unique system
will require its own training protocols, each separately documented, which only puts further strain on already meager training budgets.
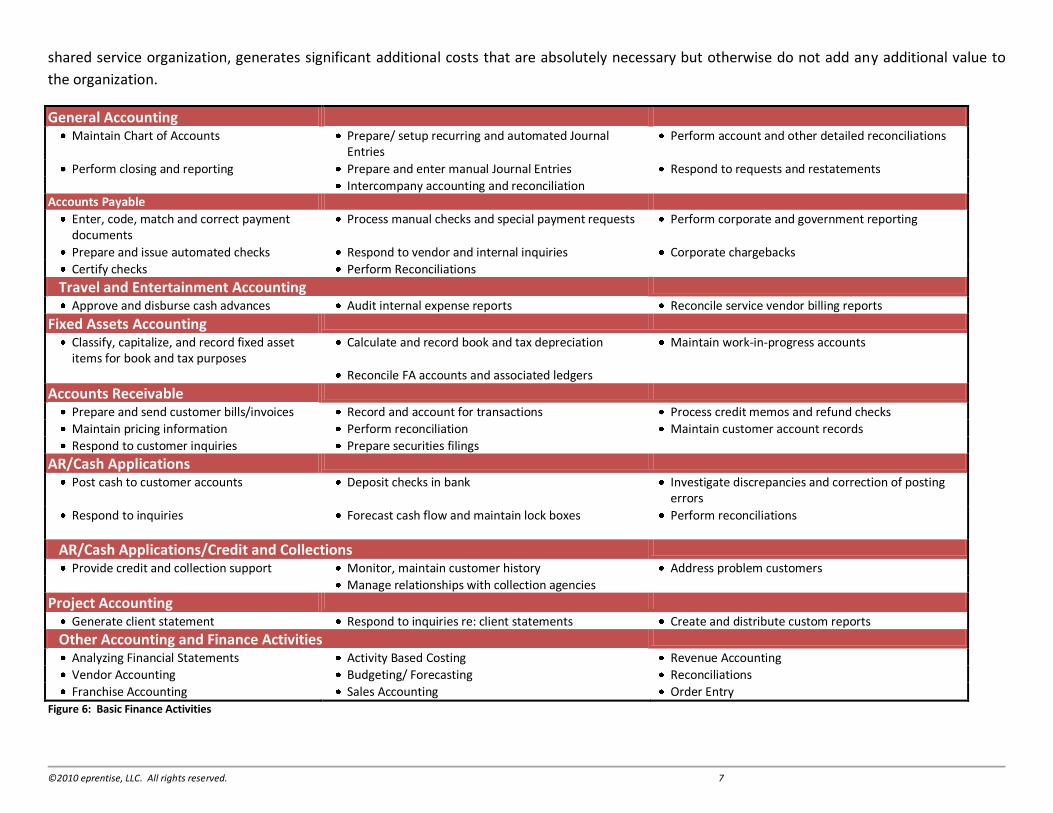
Furthermore, the sheer number of finance and accounting functions, as shown in Figure 6, requires a significant investment in human resources. In
addition to the work performed as shown in Figure 6, each organization will also be responsible for maintaining policies and procedures, ensuring
that these are appropriately reflected in the ERP system and preparing reports for either internal or external use by various regulatory bodies.
Replicating the work effort in each division simply because the ERP systems are set up that way, rather than consolidating the function into a
©2010 eprentise, LLC. All rights reserved. 7
shared service organization, generates significant additional costs that are absolutely necessary but otherwise do not add any additional value to
the organization.
General Accounting Maintain Chart of Accounts Prepare/ setup recurring and automated Journal
Entries Perform account and other detailed reconciliations
Perform closing and reporting Prepare and enter manual Journal Entries Respond to requests and restatements Intercompany accounting and reconciliation
Accounts Payable
Enter, code, match and correct payment documents
Process manual checks and special payment requests Perform corporate and government reporting
Prepare and issue automated checks Respond to vendor and internal inquiries Corporate chargebacks
Certify checks Perform Reconciliations
Travel and Entertainment Accounting
Approve and disburse cash advances Audit internal expense reports Reconcile service vendor billing reports
Fixed Assets Accounting
Classify, capitalize, and record fixed asset items for book and tax purposes
Calculate and record book and tax depreciation Maintain work-in-progress accounts
Reconcile FA accounts and associated ledgers
Accounts Receivable
Prepare and send customer bills/invoices Record and account for transactions Process credit memos and refund checks
Maintain pricing information Perform reconciliation Maintain customer account records
Respond to customer inquiries Prepare securities filings
AR/Cash Applications
Post cash to customer accounts Deposit checks in bank Investigate discrepancies and correction of posting errors
Respond to inquiries Forecast cash flow and maintain lock boxes Perform reconciliations
AR/Cash Applications/Credit and Collections
Provide credit and collection support Monitor, maintain customer history Address problem customers Manage relationships with collection agencies
Project Accounting
Generate client statement Respond to inquiries re: client statements Create and distribute custom reports
Other Accounting and Finance Activities
Analyzing Financial Statements Activity Based Costing Revenue Accounting
Vendor Accounting Budgeting/ Forecasting Reconciliations
Franchise Accounting Sales Accounting Order Entry
Figure 6: Basic Finance Activities

©2010 eprentise, LLC. All rights reserved. 8
Reducing Costs Across the Enterprise Once a company realizes the costs of an activity, there are several ways to reduce cost. The first method uses the lowest cost as the desired cost of
performing the activity. In order to calculate the savings, the outlier costs for each activity should be removed and then the lowest cost identified
as the Best Cost. To calculate the Current Expenditure for the activity, multiply the average cost times the volume of objects processed in that
activity. To calculate the New Cost, multiply the lowest processing cost for the activity by the volume of objects. To calculate the potential Annual
Savings, subtract the New Cost from the Current Expenditure. Figure 7: Calculating Savings eliminates the outliers in red, and uses the Best Cost in
green for the calculation of the best cost. With this example, the company could recognize over $61 million dollars in Annual Savings.
Other savings can be recognized by streamlining the processes. Operating a Shared Services Center centralizes the processing for an entire
organization into a central location. Since France, Italy, Germany, Austria, Ireland and Spain now all use the Euro as a functional currency, there is
no need to have separate sets of books or a separate chart of accounts. As Figure 2 shows, the average cost in the example company for
maintaining a single account value is $6.09 per year1. With many companies who have been live on EBS for many years, the number of code
combinations often tops 500,000 per chart of accounts. Adopting a single global chart of accounts will translate into hundreds of thousands of
dollars, if not millions in maintenance cost savings. An analysis of the burdened FTE costs for each activity shows that there are huge variances in
the cost of labor. Operating a centralized Shared Services Center can leverage the inexpensive labor costs in many parts of the world. However, if
EBS is set up with separate sets of books, then many of the efficiencies of consolidating operations will not be recognized. With separate sets of
books, there would need to be separate teams or, at a minimum, separate training for each set of books because the processing instructions would
be different. Consolidating to a single set of books with a single global chart of accounts reduces costs in the following ways:
No logging into and out of each set of books
A shared chart of accounts eliminates the costly maintenance of separate charts of accounts and the separate training required to provide
posting instructions for each data entry person
The processing can be done by a single team of people
A well-designed chart of accounts eliminates much of the maintenance of cross-validation rules, security rules, auto-accounting rules, and
reports
Information is shared across the enterprise allowing for consistent reporting, reduced reconciliation, standard terms for suppliers, standard
credit limits for customers, better (and less expensive) customer service, and standard processing across the organization.
1 This is not the code combination, and does not reflect the cost of maintaining cross-validation and security rules, rollup groups, or the values in the other segments of the accounting flexfield.

©2010 eprentise, LLC. All rights reserved. 9
France Italy Germany Austria Ireland Spain Summary/ Average
Total Volume used in Cost
Current Expenditure (Ave Cost * Volume)
Best Cost (Outliers removed)
New Cost (Volume*Lowest Cost)
Annual Savings
Outliers
Best Cost
General Accounting (GL) Costs
Maintenance per account $ 1.11 $ 4.10 $ 0.13 $ 11.37 $ 15.18 $ 4.64 $ 5.53 137,581 $ 761,161.11 $ 4.10 $ 563,714.07 $ 197,447.04
Cost of closing and reporting
$ 231.67 NA $305,532.45 $ 191.94 $ 12.90 NA $ 109.12 9,029 $ 985,288.73 $ 12.90 $ 116,444.17 $ 868,844.55
Cost per recurring / repetitive/allocation journal entry
$46.33 $ 22.54 $ 29.33 $ 103.40 $ 3.03 $ 2.80 $ 20.81 13,171 $ 274,039.23 $ 2.80 $ 36,910.54 $ 237,128.68
Cost per reconciliation with subsystems
$ 1.85 $ 260.55 $ 33.24 $ 13.54 $ 69.98 $ 362.80 $ 75.83 33,210 $ 2,518,384.92 $ 1.85 $ 61,549.20 $ 2,456,835.72
Cost of manual transactions, requests, restatements
$ 55.60 $ 21.96 $ 50.99 $ 113.74 $ 7.49 $ 18.38 $ 30.88 46,594 $ 1,438,972.39 $ 7.49 $ 349,198.10 $ 1,089,774.29
Cost of intercompany transactions
$ 92.67 $ 27.32 $ 102.30 $ 94.78 $ 4,125.00 $ 85.75 $ 80.56 5,276 $ 425,056.03 $ 27.32 $ 144,116.58 $ 280,939.45
Accounts Payable (AP) Costs
Cost per invoice $ 1.62 $ 1.39 $ 2.90 $ 1.25 $ 2.51 $ 1.39 $ 1.84 3,094,000 $ 5,695,706.36 $ 1.25 $3,856,479.60 $ 1,839,226.75
Cost per automated check $ 1.14 $ 1.29 $ 1.28 $ 1.07 $ 1.31 $ 1.42 $ 1.25 556,073 $ 695,773.76 $ 1.07 $ 593,051.85 $ 102,721.91
Cost per manual check $ 13.57 $ 9.34 $ 14.95 $ 10.24 $ 13.20 $ 20.58 $ 13.65 58,445 $ 797,632.18 $9.34 $545,584.08 $252,048.11
Cost for corporate chargebacks and intercompany
$ 6.33 $ 8.08 NA NA NA NA $ 7.21 2,906 $20,940.20 $6.33 $18,404.67 $2,535.53
Cost per Vendor Inquiry $19.00 $ 25.93 $ 21.99 $ 27.76 $ 17.07 $ 42.88 $ 22.35 20,000 $446,996.45 $17.07 $341,417.14 $ 105,579.31
Cost per statement/invoice $ 0.01 NA $ 4.22 $ 1.99 $ 5.02 $ 13.31 $ 2.34 183,811 $ 430,187.67 $ 1.99 $ 365,783.89 $ 64,403.78
Cost per credit memo/refund check
NA NA 6.32 NA $ 2.57 $ 22.11 $ 4.45 15,927 $ 70,842.20 $ 2.57 $ 40,954.09 $ 29,888.11
Cost per transaction $ 0.04 $ 7.52 $ 5.06 $ 2.48 $ 11.38 $ 17.50 $ 6.61 771,351 $ 5,100,747.24 $ 2.48 $1,912,950.48 $ 3,187,796.76
Cost per customer $ 17.08 NA $ 47.43 $ 10.95 $ 132.63 $118.17 $ 60.89 18,672 $ 1,137,026.08 $ 17.08 $ 318,917.76 $ 818,108.32
Cost of Collections $ 170.83 NA $ 2,989.76 $75,773.53 $ 7,341.51 $ 976.19 $5,165.63 184 $ 950,476.77 $ 976.19 $ 179,618.96 $ 770,857.81
Expense Processing Costs
Cost per purchase requisition/order
$ 0.02 $ 22.93 $ 39.30 NA NA NA $ 31.12 3,806,250 $118,436,961.86 $ 22.93 $87,277,312.50 $ 31,159,649.36
Cost for processing timesheets
$ 28.33 NA NA NA NA $ 32.04 $ 30.19 2,096 $ 63,271.53 $ 28.33 $ 59,380.62 $ 3,890.91
Cost per expense report $ 16.38 NA NA NA NA $ 5.36 10.87 2,212 $24,034.51 $ 5.36 $ 11,847.52 $ 12,186.99
Cost per active vendor $ 6,450.33 $1,053.81 $ 2,146.76 NA NA $ 359.53 $2,502.61 12,127 $30,349,114.18 $1,053.81 $ 12,779,561.62 $ 17,569,552.56
Total Savings $61,049,415.94
Figure 7: Calculating Savings

©2010 eprentise, LLC. All rights reserved. 10
From Distributed Operations to Shared Services To further illustrate the potential cost savings in establishing a shared services financial organization we will
look into the cost of the General Accounting function. Logic dictates that if the processes used are automated,
the cost will be lower than if the processes are manual; but the question is just how much less costly will the
process be, and what should be included in the cost/benefit assessment.
Business Unit 1
Business Unit 2
Business Unit 3
Business Unit 4
Business Unit 5
Business Unit 6
Summary/Average
FTE / Cost Data
# of FTE’s that contribute to GA 0.6 9.4 13.8 1.8 7.3 1.3 34.2
Annual Labor cost for GA 44,000 500,000 1,175,000 101,000 688,000 106,000 2,614,000
Annual system cost for GA 0 45,000 0 0 0 45,000
All other annual costs for GA 3,000 47,000 69,000 9,000 37,000 15,000 180,000
Total Cost for GA (Labor + System + Other) 47,000 547,000 1,289,000 110,000 725,000 121,000 2,839,000
Average Labor Cost 73,333 53,191 85,145 56,111 94,247 81,538 76,433
Average Other Cost 5,000 5,000 5,000 5,000 5,068 11,538 5,263
Key Metrics
# of manual journal entries 108 235 3,200 60 975 1,080 5,658
# of automated journal entries 0 40 600 45 25 168 878
Total # journal entries 108 275 3,800 105 1,000 1,248 6,536
Cost of Creating Journal Entries
Total number of journal entries per FTE 180 29 275 58 137 960 191
Benchmarks / Improvement Opportunities
Internal Benchmark: journal entries per FTE 960 960 960 960 960 960 960
# of FTE’s to reduce by 0 9 10 2 6 0 27
Labor cost savings, annual 35,750 484,763 837,968 94,863 589,826
NA 2,043,170 Figure 8: General Accounting Costs and Improvement Opportunities
First, organizations should assess the extent to which the systems used for General Accounting are automated.
If the answer to all of the questions in Figure 9 is ‘High’, then the system is automated and functioning
efficiently. On the other hand, if the interface between GL and its feeder systems is missing or if it turns out
that journal entries and reconciliations are manual, or if the answer to the questions are more often than not
‘low’ or even ‘not at all’, then there may be room for improvement.
To access the free
eprentise Show Me the
Money Cost Savings
Calculator click here.

©2010 eprentise, LLC. All rights reserved. 11
Wherever potential inefficiencies occur, the next step is to quantify the cost of the manual work that is being
performed. For GA the question to ask is how many total journal entries are made, how many of those are
automated, how many are manual, and what are all of the costs, labor and otherwise, that contribute to the
cost of entering. This calculation will provide a key metric: cost per journal entry.
The cost per journal entry can them be compared to an internal or external benchmark. If the cost is higher
than the benchmark then the next step is determining the cost of improving the system to automate the
process against the cost of operating with the system as is.
The labor costs should include salaries and benefits of all FTE’s contributing to the process. The goal is to find
the total costs from labor, systems, and overhead, including the cost of the facility which can be computed in
terms of average cost per square foot. Facilities management, IT, and HR should be able to provide targets or
estimates, if not actual numbers.
The number of journal entries in Oracle EBS can be found by doing a count on the GL_JE_LINES table and
filtering by operating unit. Those posting manual journal entries should be able to come up with their totals
for this category. Once the values for these items are determined, calculating the total number of journal
entries per FTE is a simple division problem.
Assessing General Accounting Automation
1. To what extent is the interface between the general ledger and its feeder systems automated?
2. To what extent is a common chart of accounts used?
3. To what extent do all feeder systems/subledgers close on the same day (e.g., last day of the month)?
4. To what extent is a different department/process responsible for the quality of information entered into the
G/L?
5. To what extent does your system allow for the electronic transmission of remote site data?
6. To what extent are soft closes utilized?
7. To what extent are account reconciliations automated?
8. To what extent are the controls/clerical functions automated?
9. To what extent are recurring journal entries automated?
10. To what extent are distribution sets defined?
11. To what extent are materiality levels set for reconciliation tolerance?
12. To what extent are the financial and operational databases integrated?
13. To what extent are the accounting processes integrated (e.g., data captured at the source)?
14. To what extent are corporate overhead charges allocated to Business Units?
Figure 9: Assess Degree of Automation

©2010 eprentise, LLC. All rights reserved. 12
One multinational organization learned that it would be able to save over $2 million in annual labor costs after
it performed the FTE journal entry analysis. Updating the systems to accommodate the changes then became
a much easier decision, and once senior leadership was aware of the cost savings, establishing a shared
services organization for the finance team became a realistic goal.
Preparation for an ERP Software Upgrade After streamlining the operation to cut costs significantly, the company realized that it would be able to take
advantage of new functionality available in the new release of their ERP Software, Oracle EBS R12. First, and
most importantly, the cost savings alone justified the upgrade and allowed for a quicker ROI. Second, the
process of consolidating the sets of books, implementing a global Chart of Accounts, and merging unneeded
operating units allowed usage of Oracle’s Multi Organization Access Control (MOAC) to run a shared services
center efficiently without logging into and out of multiple ledgers. Create Accounting rules was used to
implement reporting and tax ledgers to facilitate compliance with multiple statutory and regulatory
requirements without having to re-enter the same information over and over. Finally, interfaces, data
warehouse queries, and reports were much easier to create and maintain because there was a single source of
truth, better access to critical financial information, enterprise standards, and an easier, more cost-effective
way to manage overall operations.
To access the free eprentise Show Me the Money Cost Savings Calculator click here.