AN ENGINEERED CLAY SOIL SYSTEM USING FUNCTIONAL …
140
The Pennsylvania State University The Graduate School Department of Civil and Environmental Engineering AN ENGINEERED CLAY SOIL SYSTEM USING FUNCTIONAL POLYMERS A Dissertation in Civil Engineering by Sungho Kim © 2011 Sungho Kim Submitted in Partial Fulfillment of the Requirements for the Degree of Doctor of Philosophy December 2011
Transcript of AN ENGINEERED CLAY SOIL SYSTEM USING FUNCTIONAL …

The Pennsylvania State University
The Graduate School
Department of Civil and Environmental Engineering
AN ENGINEERED CLAY SOIL SYSTEM USING FUNCTIONAL
POLYMERS
A Dissertation in
Civil Engineering
by
Sungho Kim
copy 2011 Sungho Kim
Submitted in Partial Fulfillment
of the Requirements
for the Degree of
Doctor of Philosophy
December 2011
ii
The dissertation of Sungho Kim was reviewed and approved by the following
Angelica Maria Palomino
Assistant Professor of Civil and Environmental Engineering
Dissertation Advisor
Chair of Committee
Mian C Wang
Professor Emeritus of Civil and Environmental Engineering
James H Adair
Professor of Material Science and Engineering
Coray M Colina
Associate Professor of Material Science and Engineering
Peggy A Johnson
Professor of Civil and Environmental Engineering
Head of the Department of Civil and Environmental Engineering
Signatures are on file in the Graduate School
iii
ABSTRACT
Soil modification is widely accepted to improve soil properties in the field of
geotechnical and geoenvironmental engineering In the case of clay soil it is well known that the
clay fabric determines properties of the soil such as permeability shear strength and
compressibility Although clay fabric has successfully been modified using polymers they are
typically utilized as a static modification That is no further structural modification is expected
due to the irreversible interactions between the polymer and clay particles In this study
responsive polymers those for which conformational behavior is affected by the surrounding
environment such as pH and ionic strength are used as a clay fabric modifier such that the final
structures are ldquotunablerdquo Three studies were conducted to investigate (1) composite synthesis of
clay and responsive polymer (2) tunability of the composites at the meso-scale and (3)
computational studies of the tunability
First synthesis of bentonite-polyacrylamide nanocomposites was performed by
investigating variables such as synthesizing temperature clay content polymer molecular weight
pH and clay-to-polymer volume ratio X-ray diffraction was used to characterize effects of each
variable on the synthesis of nanocomposites with intercalated structure Optimum conditions for
the greatest quantity of intercalated structure were found at clay content of 0001 synthesis with a
low molecular weight polymer and clay-to-polymer volume ratio of 2
Second tunability of the synthesized nanocomposites was investigated using step-by-step
laboratory experiments (1) dynamic light scattering was used to confirm pH-responsiveness of
polyacrylamide in a bulk solution (2) spectroscopic ellipsometry was used to explore validity of
the pH-responsiveness after adsorption on a surface and (3) meso-scale characterization such as
specific surface area measurement swelling tests and pressurized permeability tests were
iv
performed to investigate whether the micro-scale conformational changes of the polymer lead to
modification of meso-scale engineering properties of clay-polymer composites
Thirdly a computational study on tunable behavior of the nanocomposites was performed
Since the conducted laboratory tests provide indirect insight into the behavior of the
nanocomposites a computational study provides further evidence supporting the tunable
characteristics of the nanocomposites Results from dissipative particle dynamics were in a good
qualitative agreement with experimental data
v
TABLE OF CONTENTS
LIST OF FIGURES viii
LIST OF TABLES xi
ACKNOWLEDGEMENTS xii
INTRODUCTION 1
11 Motivation 3
12 Objectives 4
13 Hypothesis 5
14 Expected Contributions 5
LITERATURE REVIEW 7
21 Nature of Montmorillonite 7
22 Responsive Polymers 14
23 Polyacrylamide-Montmorillonite Interactions and Associations 18
24 Synthesis of Clay-Polymer Nanocomposites 22
25 Characterization of Clay-Polymer Nanocomposites 24
251 X-ray Diffraction 24
252 Spectroscopic Ellipsometry 24
26 Computer Simulation 25
261 Overview 25
262 Dissipative Particle Dynamics 28
SYNTHESIS OF TUNABLE CLAY-POLYMER NANOCOMPOSITES 32
31 Introduction 32
32 Experimental Study 33
321 Materials 33
322 Synthesis of Clay-Polymer Nanocomposites ndash Solution Intercalation 36
323 Mixing and Drying Temperatures 37
324 Analysis Techniques 38
vi
33 Results and Discussion 39
331 Influence of Mixing and Drying Temperatures 40
332 Mineral Dissolution 43
333 Nanocomposite Synthesis Optimization 45
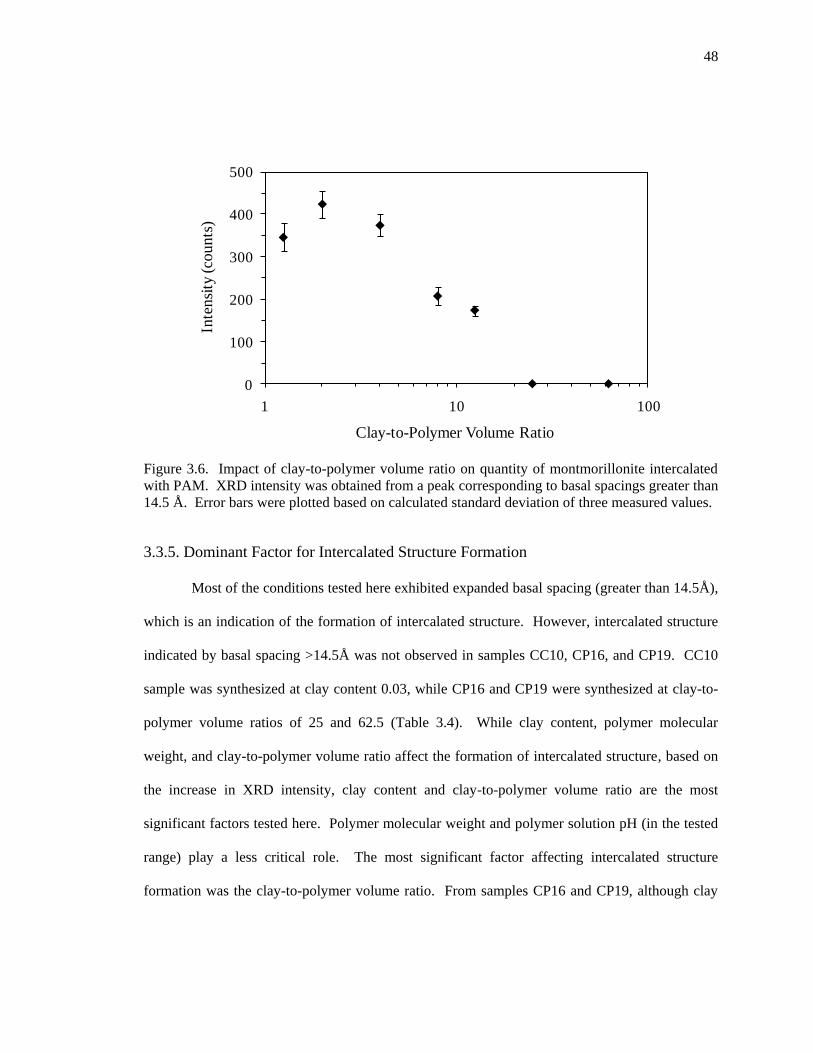
335 Dominant Factor for Intercalated Structure Formation 48
34 Conclusions 49
MANUPULATION OF SYNTHESIZED CLAY-POLYMER NANOCOMPOSITES 51
41 Introduction 51
42 Materials 53
421 Clay Minerals 53
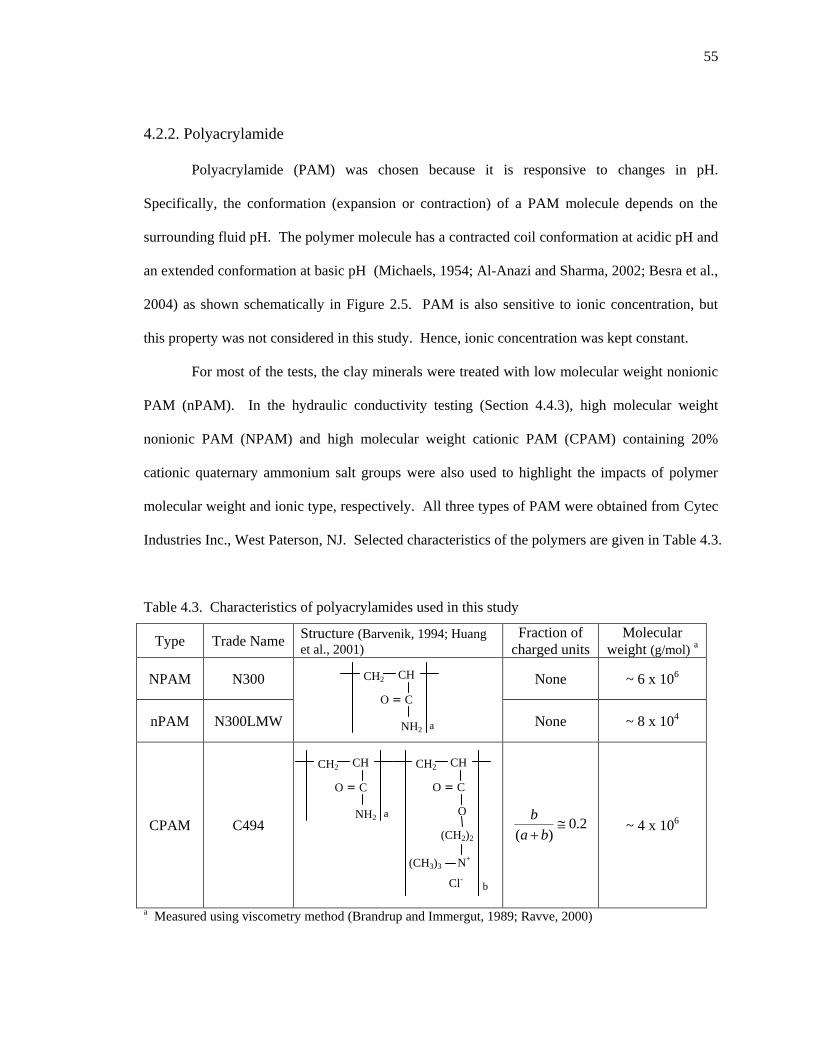
422 Polyacrylamide 55
423 Synthesis of CPN and Microcomposites 56
43 Micro-Scale Characterization 57
431 Dynamic Light Scattering 58
432 Spectroscopic Ellipsometry 60
44 Meso-Scale Characterization 65
441 Specific Surface Area 66
442 Swelling Test 69
443 Hydraulic Conductivity Measurement 73
45 Linkage of Micro-Scale Behavior to Meso-Scale Property 79
46 Conclusions 82
COMPUTER SIMULATION 84
51 Introduction 84
52 Mapping of Length- and Time Scales 85
53 Polyacrylamide in an Aqueous Solution 87
54 Polyacrylamide Adsorbed on a Clay Particle 92
55 Interlayer Spacing Manipulation 95
56 Linkage of Micro-Scale Behavior to Meso-Scale Property 101
vii
57 Conclusions 103
CONCLUSIONS 105
Future Work 107
REFERENCES 109
Appendix A Example Calculation for Clay-to-Polymer Volume Ratio 123
Appendix B Pressurized Permeability 124
Appendix C DPD Equilibration 125
Appendix D Scaling of Simulated system 127
VITA 128
viii
LIST OF FIGURES
Figure 21 Mineral composition of dry Na+-montmorillonite used in the study Violet-colored
circles denote an exchangeable cation Na+ Basal spacing in the absence of the exchangeable
cations is 0913 nm for dry clay (van Olphen 1977) The thickness of a layer is 0654 nm
obtained using X-ray diffraction (Brindley and Brown 1980) 9
Figure 22 Electrical potential (Vx) of double layer compiled from Israelachvili (1991) Stumm
(1992) Santamarina et al (2001) and Mitchell (1993) 11
Figure 23 Hydrolysis reaction of polyacrylamide under basic conditions Compiled from
Barvenik (1994) Kurenkov (1997) and Myagchenkov and Proskurina (2004) 16
Figure 24 Hydrolysis reaction of cationic polyacrylamide under basic conditions Compiled
from Aksberg and Wagberg (1989) 17
Figure 25 Conformations for nonionic PAM under various pH and ionic strength conditions
(Michaels 1954 Klenina and Lebedeva 1983 Al-Anazi and Sharma 2002 Besra et al 2004)
Cyan and red monomers denote neutral monomer and charged monomer respectively Images
obtained from computer simulations (dissipative particle dynamics) 18
Figure 26 Schematic of various clay-polymer composites (a) phase-separated (b) intercalated
and (c) exfoliated structures 21
Figure 27 Time-length scale plot illustrating various computational methods at relevant time
and length scales Also shown are the basic interaction units in each method 26
Figure 28 Schematic of coarse-graining on (a) a polyacrylamide chain and (b) a Mt particle
The smaller spheres represent atoms the larger yellow and blue spheres are coarse-grained beads
Bond length (L) and bond angle (A) of the coarse-grained beads are also shown 28
Figure 31 Basal spacings for bentonite-nPAM nanocomposites synthesized at (a) 20degC (b)
60degC and (c) 85degC mixing temperatures 41
Figure 32 Basal spacings for bentonite-nPAM nanocomposites synthesized at 20degC and 110degC
drying temperatures with (a) low molecular weight PAM and (b) high molecular weight PAM 42
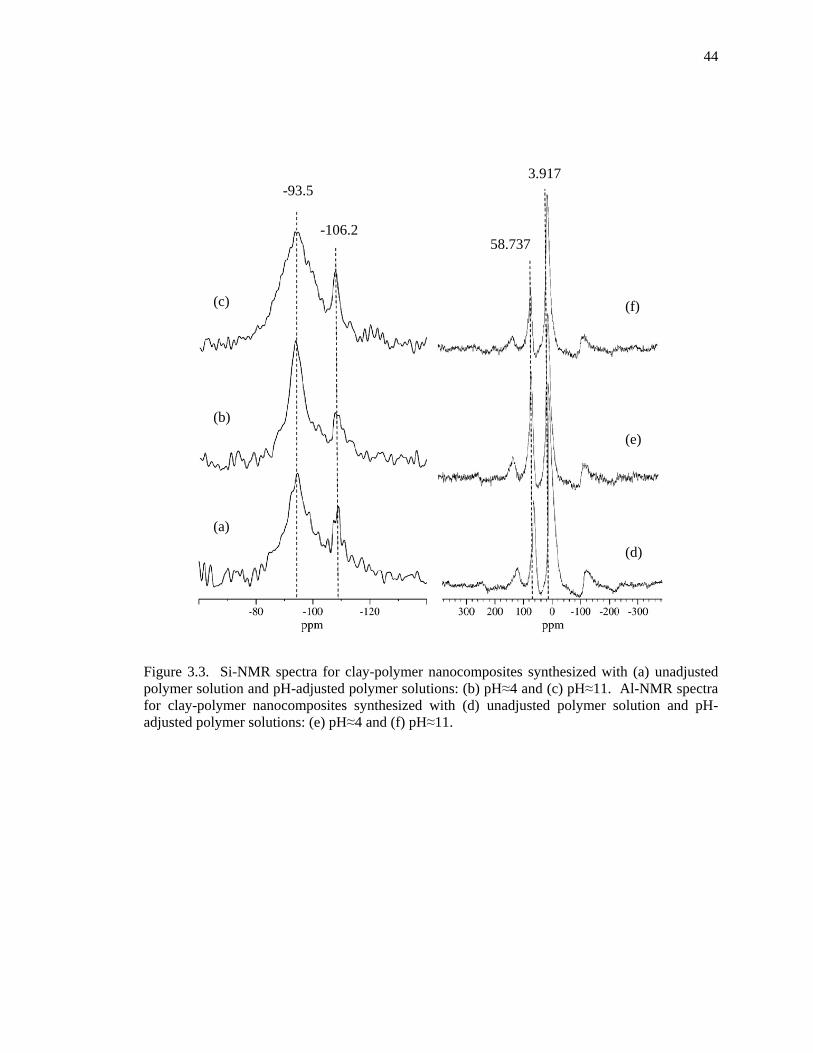
Figure 33 Si-NMR spectra for clay-polymer nanocomposites synthesized with (a) unadjusted
polymer solution and pH-adjusted polymer solutions (b) pHasymp4 and (c) pHasymp11 Al-NMR spectra
for clay-polymer nanocomposites synthesized with (d) unadjusted polymer solution and pH-
adjusted polymer solutions (e) pHasymp4 and (f) pHasymp11 44
Figure 34 XRD diffractogram for clay-polymer nanocomposites synthesized with (a)
unadjusted polymer solution and pH-adjusted polymer solutions (b) pH 4 and (c) pH 11 M
denotes a typical peak for Mt 45
ix
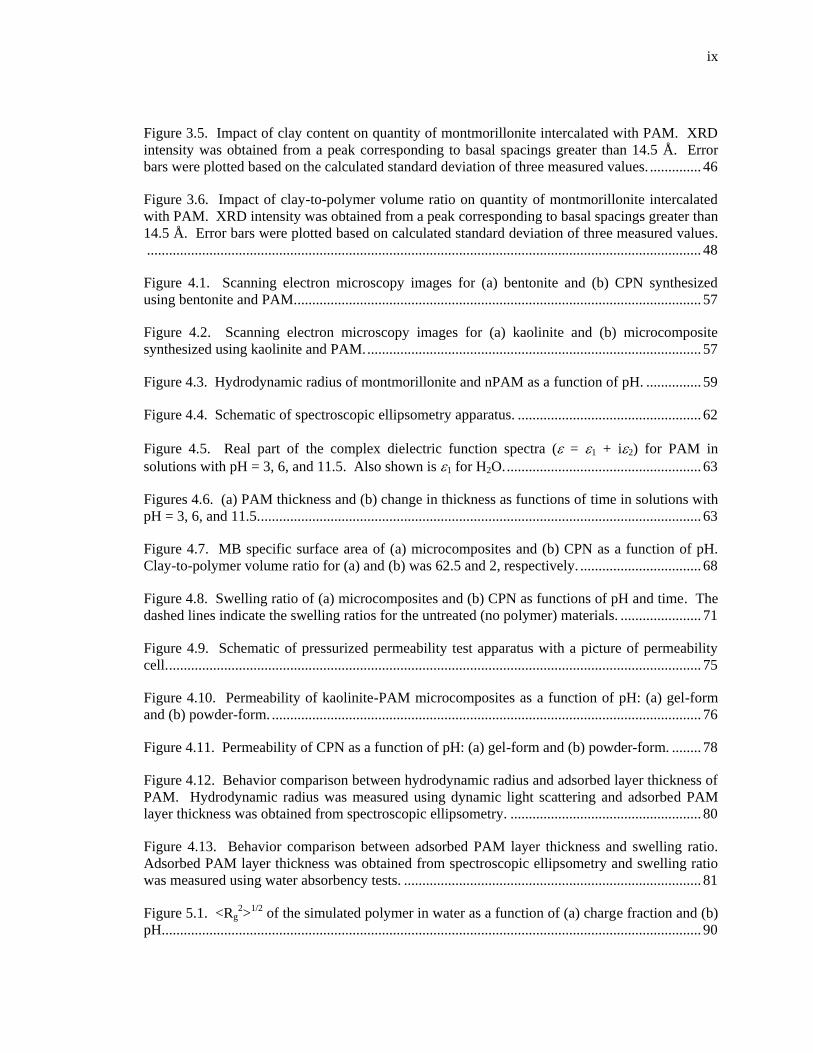
Figure 35 Impact of clay content on quantity of montmorillonite intercalated with PAM XRD
intensity was obtained from a peak corresponding to basal spacings greater than 145 Aring Error
bars were plotted based on the calculated standard deviation of three measured values 46
Figure 36 Impact of clay-to-polymer volume ratio on quantity of montmorillonite intercalated
with PAM XRD intensity was obtained from a peak corresponding to basal spacings greater than
145 Aring Error bars were plotted based on calculated standard deviation of three measured values
48
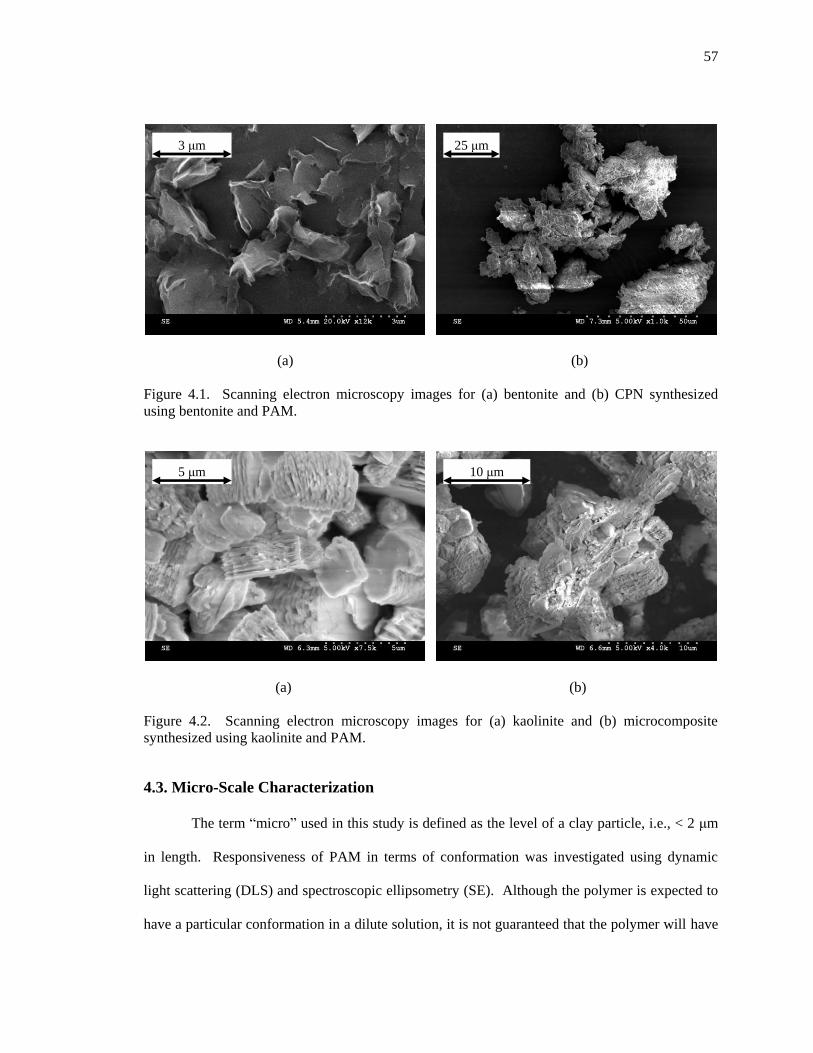
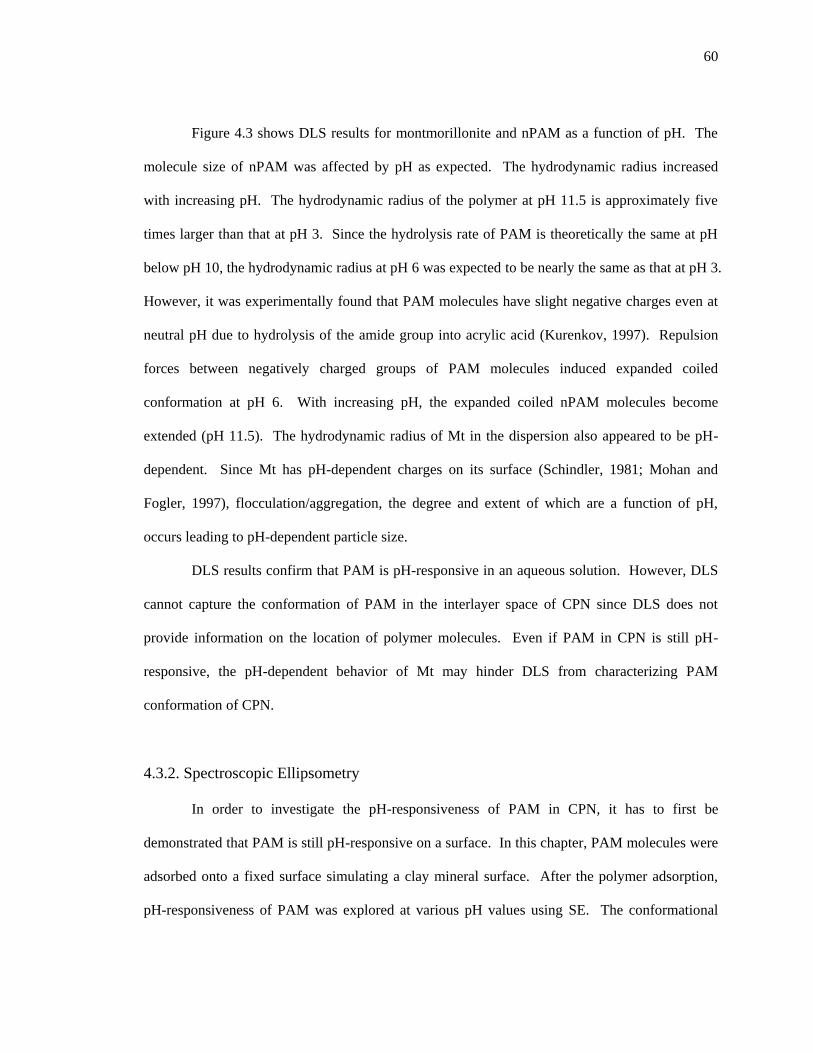
Figure 41 Scanning electron microscopy images for (a) bentonite and (b) CPN synthesized
using bentonite and PAM 57
Figure 42 Scanning electron microscopy images for (a) kaolinite and (b) microcomposite
synthesized using kaolinite and PAM 57
Figure 43 Hydrodynamic radius of montmorillonite and nPAM as a function of pH 59
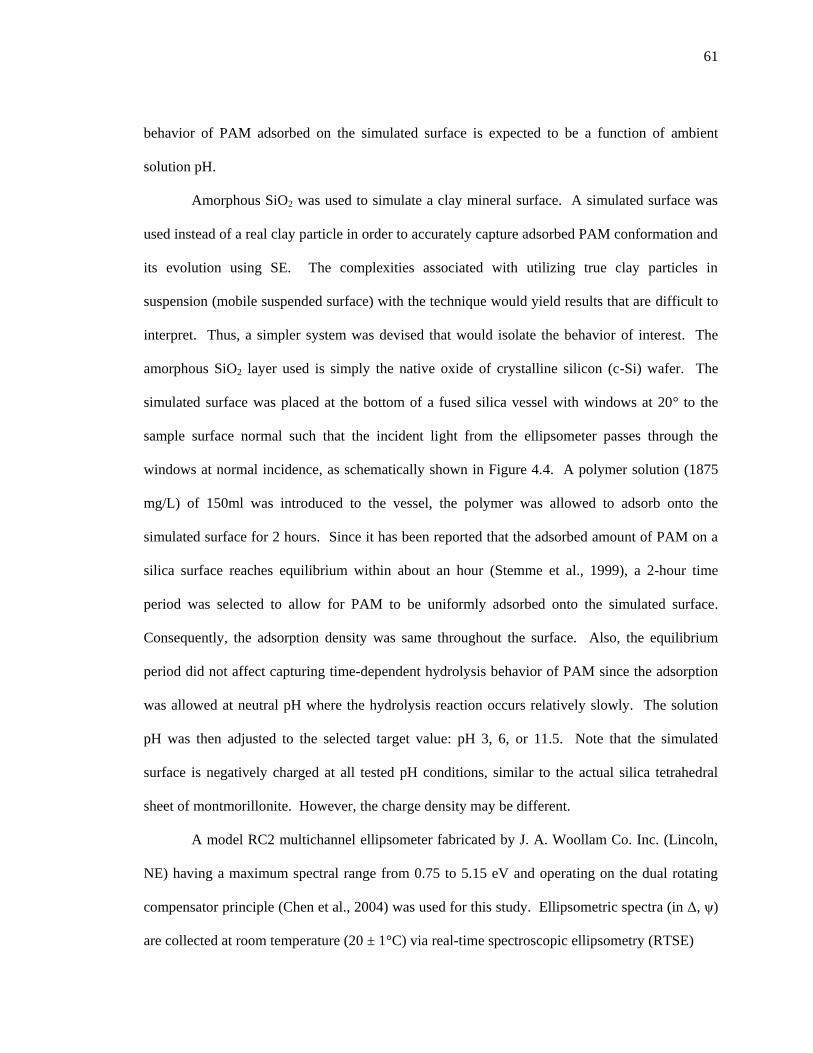
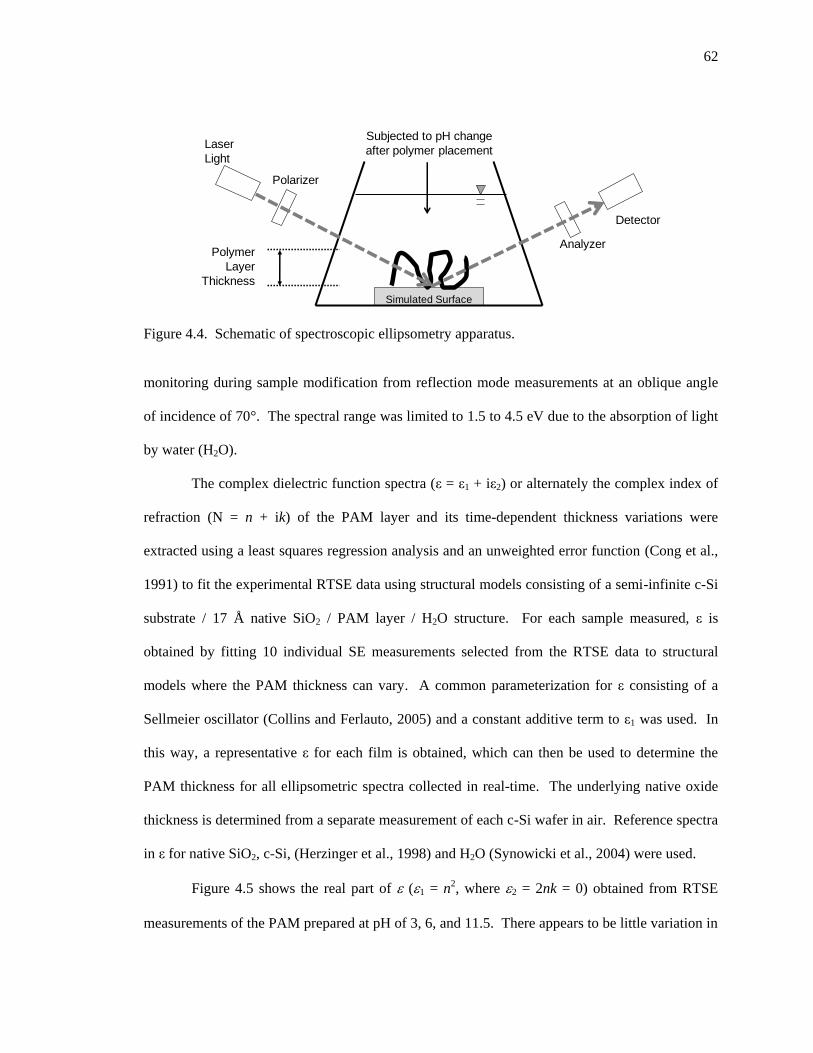
Figure 44 Schematic of spectroscopic ellipsometry apparatus 62
Figure 45 Real part of the complex dielectric function spectra ( = 1 + i2) for PAM in
solutions with pH = 3 6 and 115 Also shown is 1 for H2O 63
Figures 46 (a) PAM thickness and (b) change in thickness as functions of time in solutions with
pH = 3 6 and 115 63
Figure 47 MB specific surface area of (a) microcomposites and (b) CPN as a function of pH
Clay-to-polymer volume ratio for (a) and (b) was 625 and 2 respectively 68
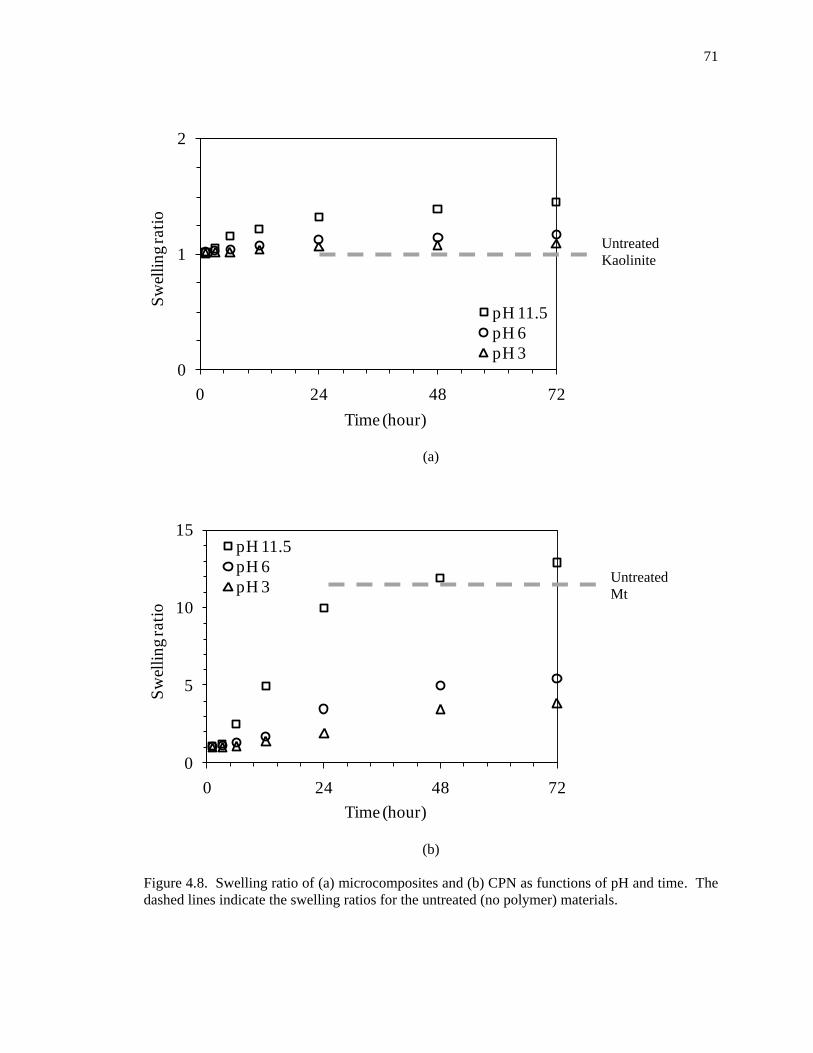
Figure 48 Swelling ratio of (a) microcomposites and (b) CPN as functions of pH and time The
dashed lines indicate the swelling ratios for the untreated (no polymer) materials 71
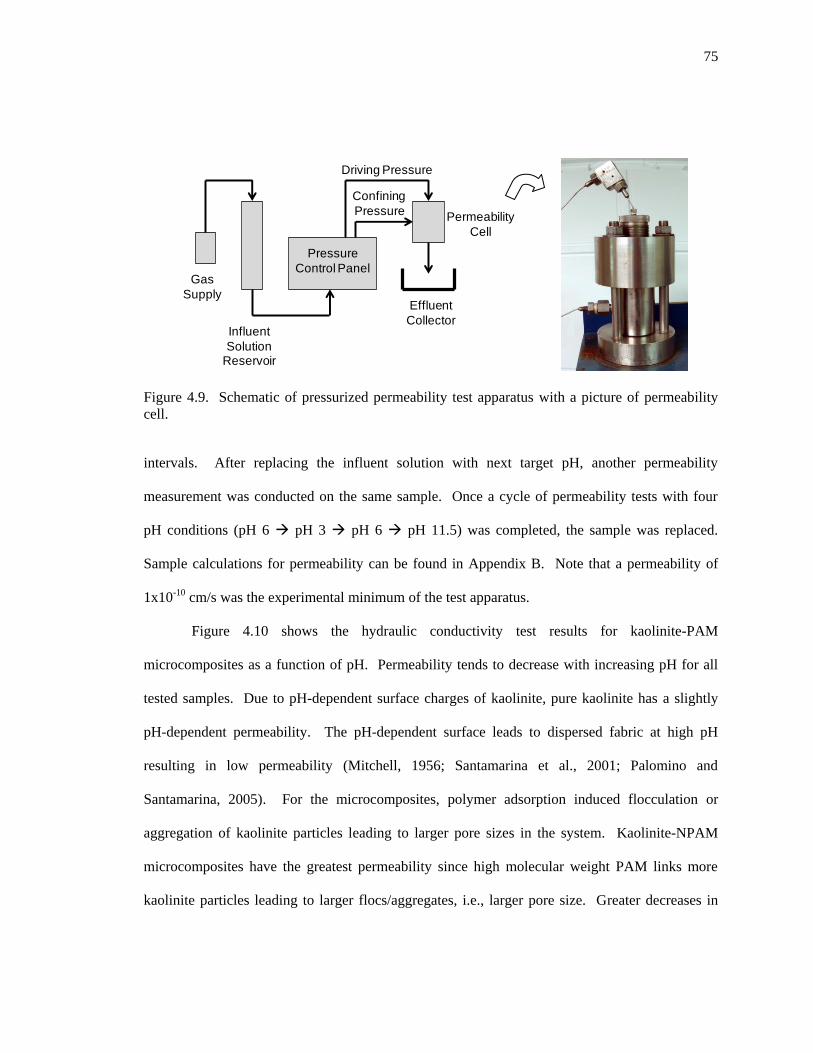
Figure 49 Schematic of pressurized permeability test apparatus with a picture of permeability
cell 75
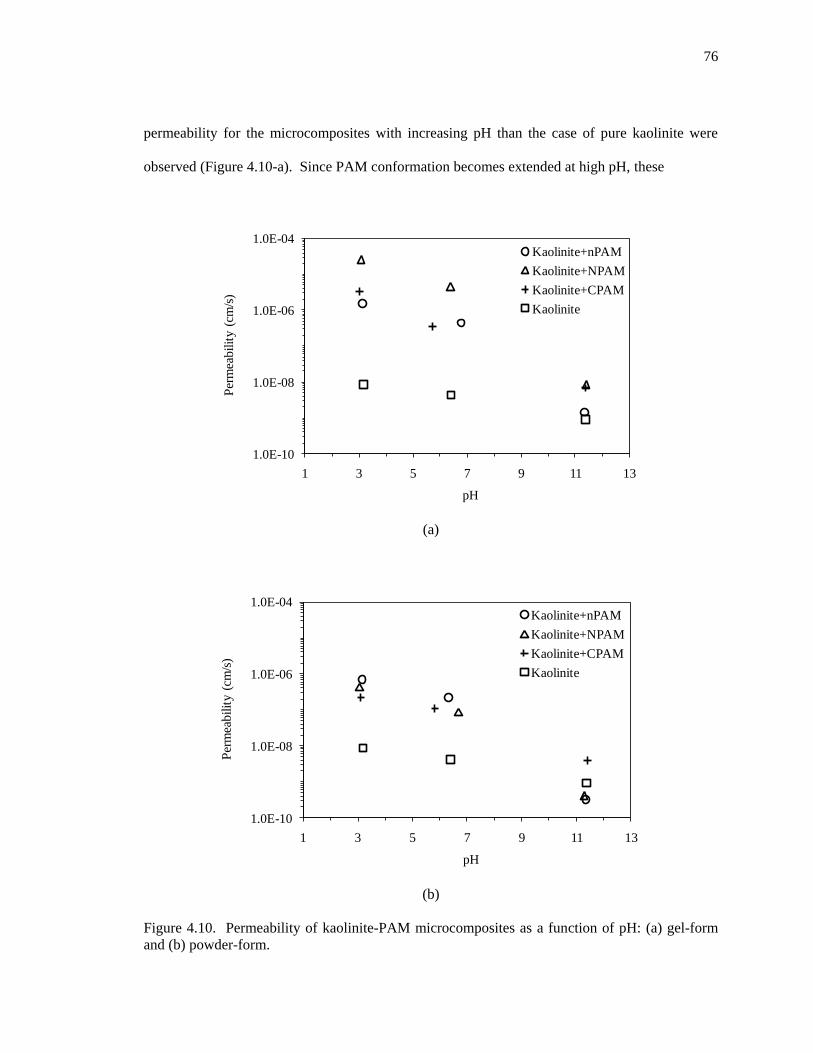
Figure 410 Permeability of kaolinite-PAM microcomposites as a function of pH (a) gel-form
and (b) powder-form 76
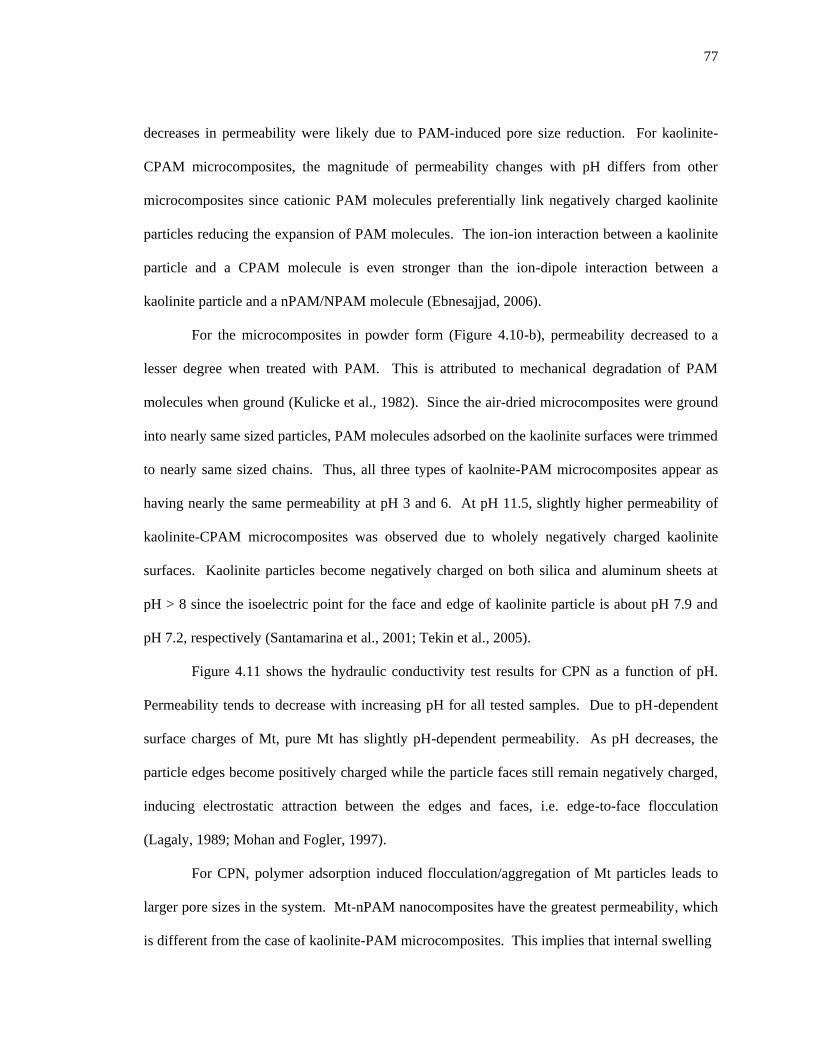
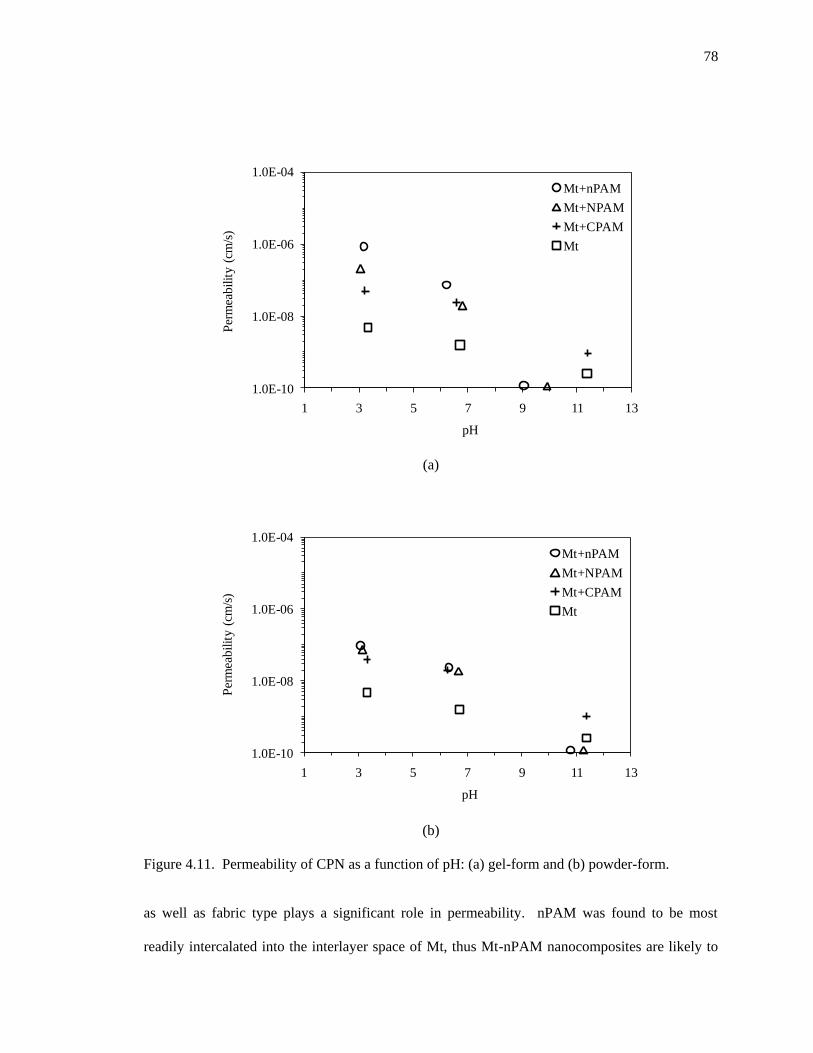
Figure 411 Permeability of CPN as a function of pH (a) gel-form and (b) powder-form 78
Figure 412 Behavior comparison between hydrodynamic radius and adsorbed layer thickness of
PAM Hydrodynamic radius was measured using dynamic light scattering and adsorbed PAM
layer thickness was obtained from spectroscopic ellipsometry 80
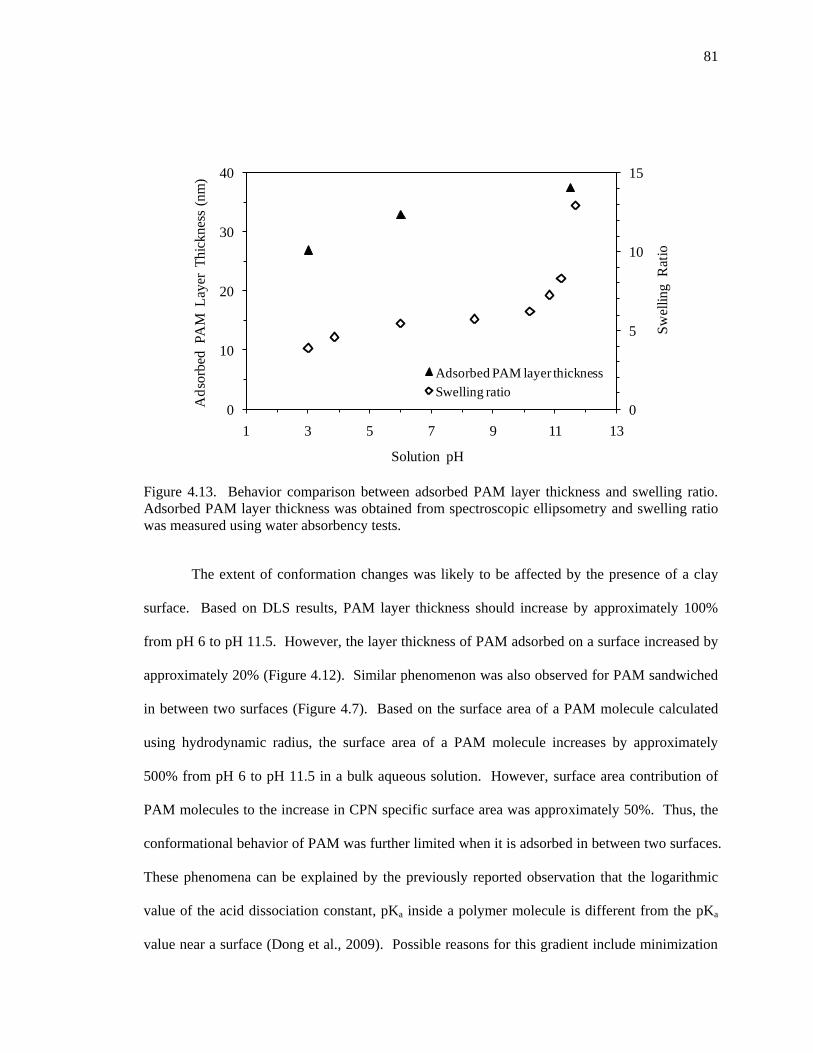
Figure 413 Behavior comparison between adsorbed PAM layer thickness and swelling ratio
Adsorbed PAM layer thickness was obtained from spectroscopic ellipsometry and swelling ratio
was measured using water absorbency tests 81
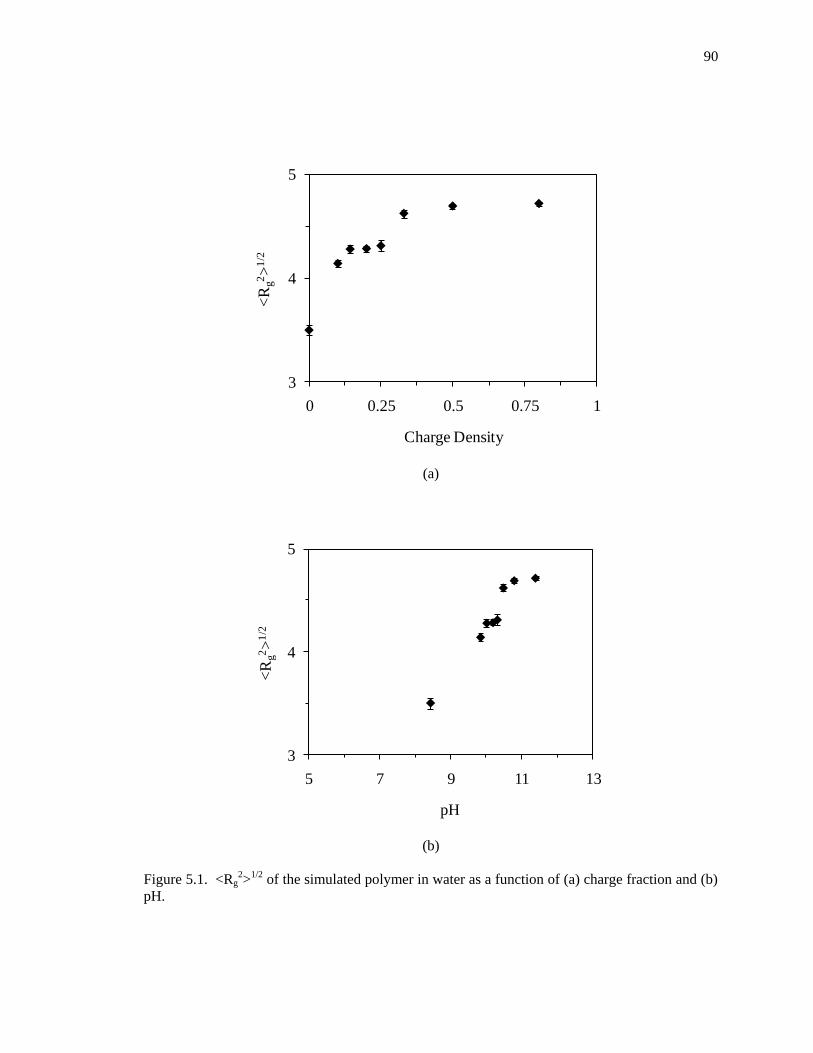
Figure 51 ltRg2gt12 of the simulated polymer in water as a function of (a) charge fraction and (b)
pH 90
x
Figure 52 ltRg2gt12 vs simulation time for PAM with charge density of (a) 025 and (b) 033 91
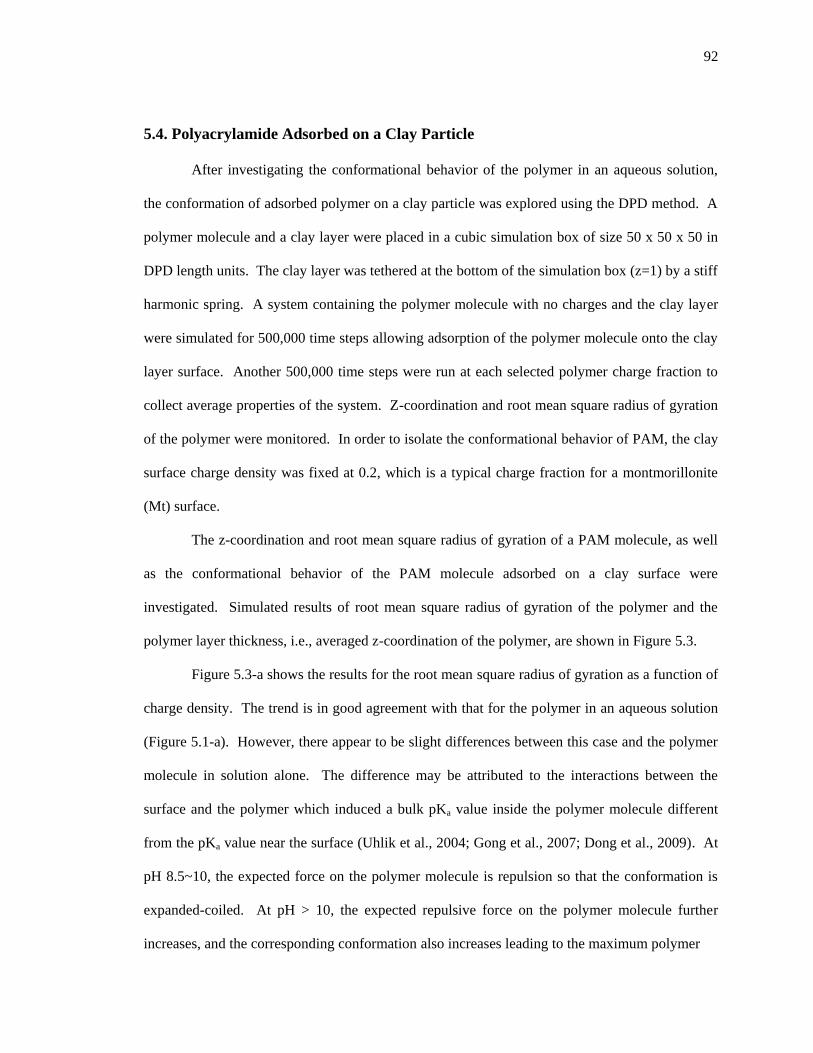
Figure 53 (a) ltRg2gt12 of the simulated polymer adsorbed on a clay surface and (b) the polymer
layer thickness as a function of pH 93
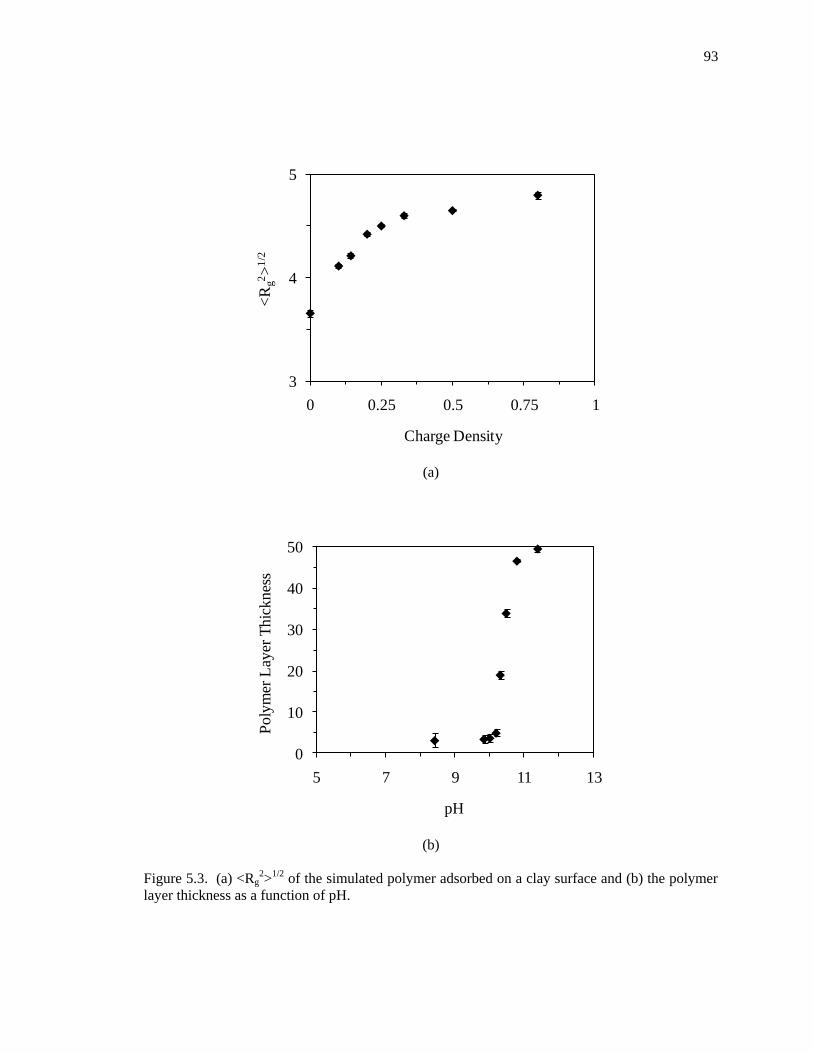
Figure 54 Trajectories of the polymer and the clay surface (a) initial configuration and final
configurations with charge density of (b) 00 (c) 01 (d) 0143 (e) 02 (f) 025 (g) 033 (h)
05 and (i) 08 Cyan red yellow and black beads denote neutral monomer charged monomer
neutral clay and charged clay 94
Figure 55 (a) ltRg2gt12 of the simulated polymer sandwiched between two clay layers and (b) the
interlayer spacing as a function of pH at clay-to-polymer volume ratio 4 96
Figure 56 Trajectories of the polymer and the clay surfaces at clay-to-polymer volume ratio 4
(a) initial configuration containing two clay surfaces a PAM molecule and water and final
configurations with charge density of (b) 00 (c) 01 (d) 0143 (e) 02 (f) 025 (g) 033 (h)
05 and (i) 08 Cyan red yellow and black beads denote neutral monomer charged monomer
neutral clay and charged clay 98
Figure 57 (a) ltRg2gt12 of the simulated polymer sandwiched between two clay layers and (b)
the interlayer spacing as a function of pH at clay-to-polymer volume ratio 2 100
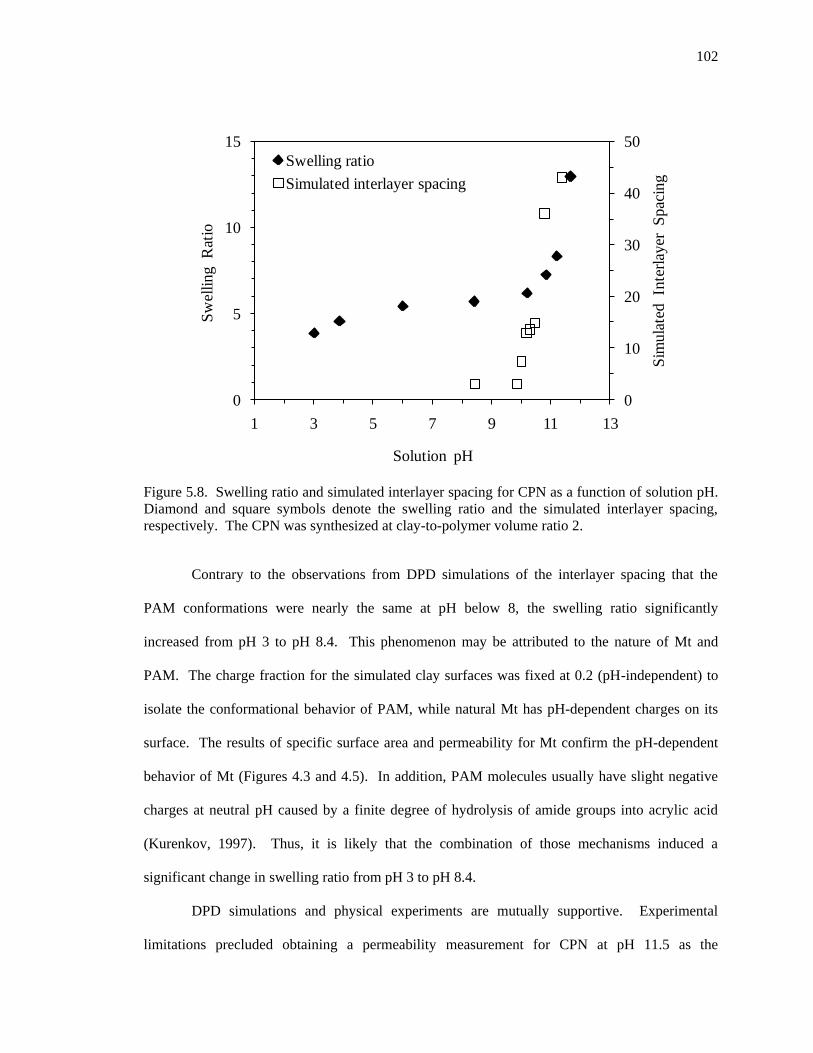
Figure 58 Swelling ratio and simulated interlayer spacing for CPN as a function of solution pH
Diamond and square symbols denote the swelling ratio and the simulated interlayer spacing
respectively The CPN was synthesized at clay-to-polymer volume ratio 2 102
Figure C1 ltRg2gt12 vs simulation time for PAM with charge density of (a) 00 (b) 01 (c)
0143 (d) 02 (e) 025 (f) 033 (g) 05 and (h) 08 at clay-to-polymer volume ratio 4 126
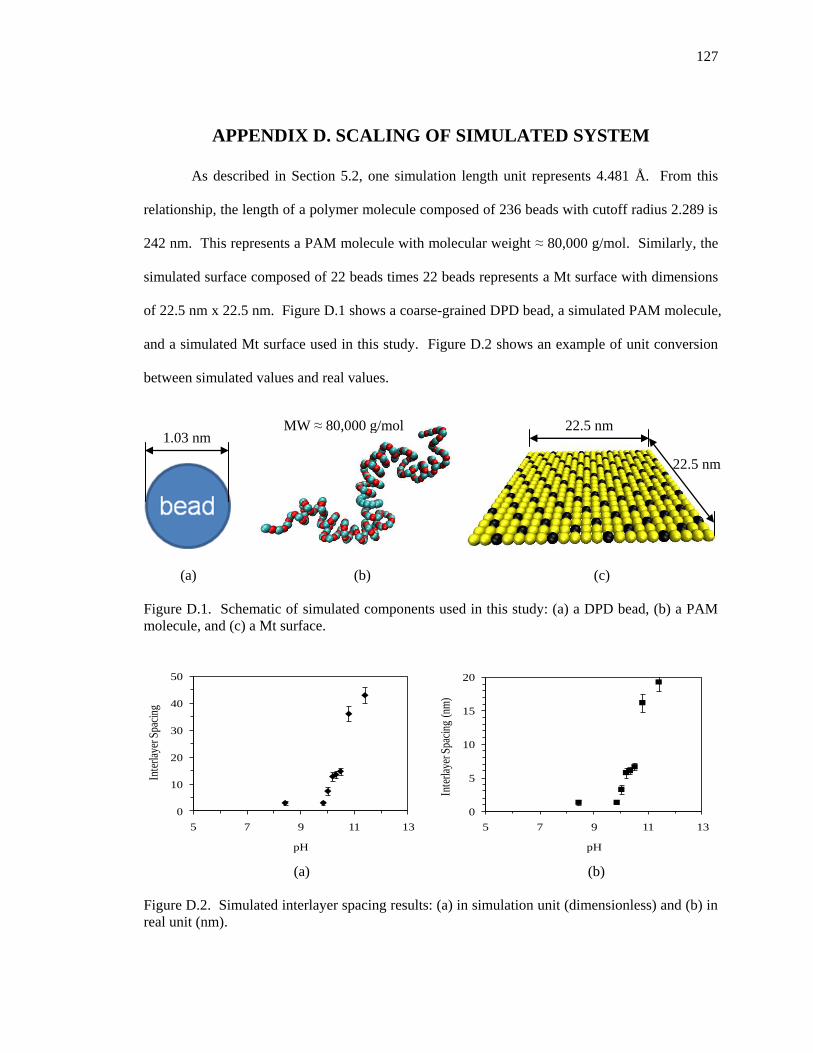
Figure D1 Schematic of simulated components used in this study (a) a DPD bead (b) a PAM
molecule and (c) a Mt surface 127
Figure D2 Simulated interlayer spacing results (a) in simulation unit (dimensionless) and (b) in
real unit (nm) 127
xi
LIST OF TABLES
Table 31 Chemical composition of the sodium bentonite used in this study (Supplier data) 35
Table 32 Properties of the sodium bentonite used in this study 35
Table 33 Characteristics of polyacrylamides used in this study 35
Table 34 Test matrix and resulting basal spacing with XRD intensity 40
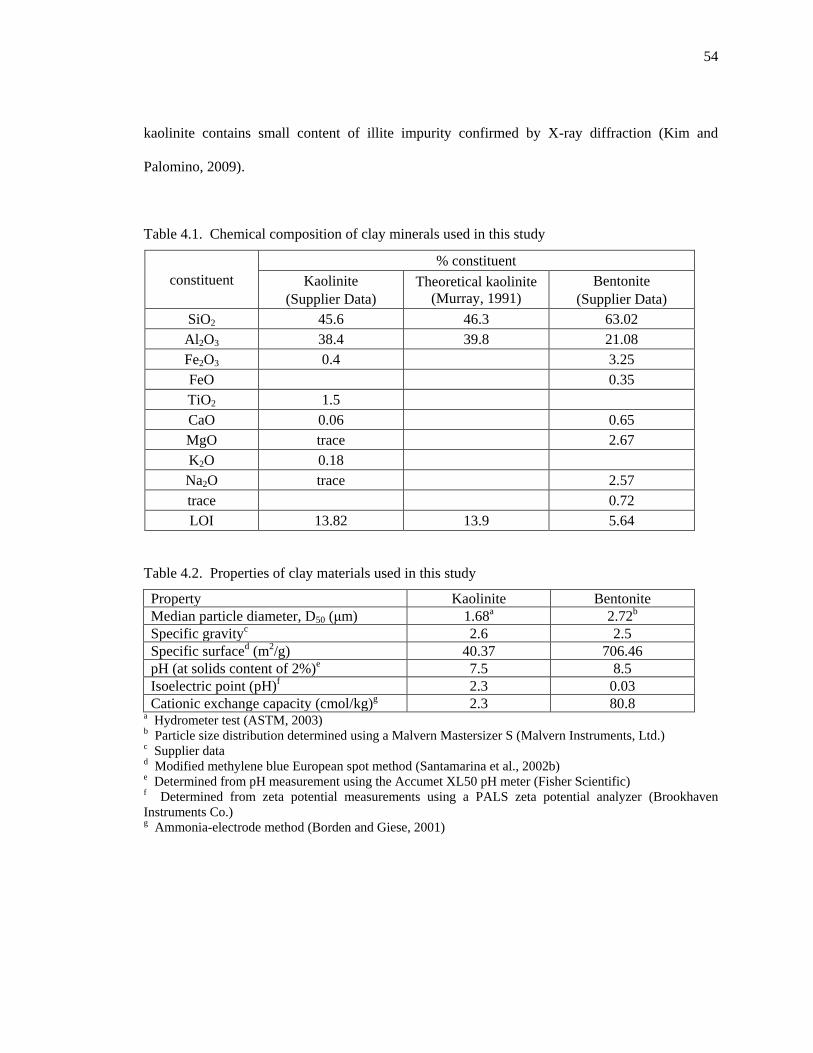
Table 41 Chemical composition of clay minerals used in this study 54
Table 42 Properties of clay materials used in this study 54
Table 43 Characteristics of polyacrylamides used in this study 55
Table 51 Scaling relations used in this study (Fuchslin et al 2009) 86
Table 52 DPD parameters used in this study 88
Table 53 Force constants α used in this study 88
xii
ACKNOWLEDGEMENTS
Throughout my work on this PhD research I have been fortunate to have been helped by
many people making the completion of this research possible Of these people the first I would
like to appreciate is my advisor Dr Angelica Palomino She gave me the flexibility in selecting
any topic which I was interested in allowing me to in-depth study the fundamental study I have
spent the last 3 years working on I would like to thank her also for her support guidance
availability and insights Since I met Dr Palomino my advice to students looking for a graduate
advisor has simply been ldquoFind someone like Dr Palominordquo
I would like to thank all of my committee members Dr Mian Wang Dr James Adair
and Dr Coray Colina who helped guide me when I needed extra assistance They have spent a
great deal of time discussing ideas with me and keeping me on the right track
I owe many thanks to the following people who helped me accomplish this research Dr
Nicholas Podraza and Mr Michael Motyka helped me conduct spectroscopic ellipsometry
Professor Evangelos Manias helped me develop idea of this research and shared his expertise on
clay-polymer nanocomposites and computer simulations Dr Martin Lisal Dr Gregory Larsen
and Ms Kristin Patterson shared their knowledge on computer simulations Ms Nicole
Wondering with an expertise of X-ray diffraction shared a lot of knowledge and techniques with
me Ms Maria Klimkiewicz helped me do scanning electron microscopy Mr Daniel Fura a
technical support supervisor of CITEL helped me perform all laboratory experiments
I acknowledge the National Science Foundation (NSF) that provided funding for a part of
this study This work is as a result of partial support from the NSF under grant 1041995
My family has provided me with unconditional support and advice which have made my
completion of this work possible My wife Soojin Ahn has always been willing to lend an ear
Thank you all for all of your help and friendship
Chapter 1
INTRODUCTION
Not all soils inherently have desirable geotechnical and geoenvironmental engineering
properties Physical andor chemical processes are often manipulated to obtain a target
performance of soil systems For example grains can be added to grains with different
morphologies as in diatom-kaolin clay mixtures to influence the mixture flocculation liquid
limit and plasticity water retention and even solubility (Palomino et al 2011) It is well known
that clay particle arrangement the so-called clay fabric varies with the bulk fluid chemistry such
as pH ionic concentration and temperature (van Olphen 1977 Theng 1979 Mitchell 1993
Lagaly 2006) Clay fabric alteration leads to changes in macro-scale clay properties such as
permeability (Mitchell 1956 Suarez et al 1984) shear strength (Sridharan and Prakash 1999)
compressive strength (Nasser and James 2006) and compressibility (Gajo and Maines 2007) In
addition the use of polymer at different concentrations molecular weights andor ionic types
alters the bulk fluid chemistry manipulating clay fabric (Kim and Palomino 2009) Polymer-
treated clay composites so-called clay-polymer composites may lead to enhancements of overall
clay material characteristics such as shear strength permeability clay swelling and contaminant
barrier properties (van Olphen 1977 Theng 1979 Hjelmstad 1990 Lo et al 1997 Inyang and
Bae 2005) While each of these approaches improves the soil properties these methods are
essentially permanent that is irreversible Irreversible interactions of polymer molecules with
clay mineral surface limits further modifications of the clay-polymer composites (Nadler et al
1992)
The use of responsive polymers in which the conformation varies with external
environment triggers will lead to a new family of clay-polymer composites Since the
conformation of a given responsive polymer varies with the external environment for example
2
bulk solution pH responsive polymers may provide the capacity to modify in-situ properties of
resulting clay-polymer composites after polymer placement That is the interlayer andor
interparticle spacing of composites synthesized from responsive polymers can be manipulated
through changes in the surrounding fluid pH ionic concentration temperature and electric field
For example clay-polymer composites synthesized using a pH responsive polymer may be
capable of further modification by exposing the composites to alternate pH conditions
Furthermore the use of water-soluble responsive polymer can have the potential for large-scale
in-situ modification due to minimum energy demand In order to maximize the potential for
interlayer andor interparticle spacing modification the optimized design of these composites is
an intercalated structure in which polymer molecules are adsorbed onto both the particle surface
and interlayer surface Thus both interparticle and interlayer distances of the final composite
have the ability to be modified through exposure to various pH
Although soil modification using polymers or surfactants have been previously
investigated (Gardner and Arias 2000 Bhardwaj et al 2007 Story et al 2009 Young et al
2009) thus far responsive polymers have not been addressed for this purpose Efforts to produce
a material with controllable morphology have recently been reported with the use of responsive
polymers ie polymers which are responsive to external environmental conditions such as pH
(Feil et al 1992 Xia et al 2006) ionic strength (Wu and Shanks 2003) temperature (Bae et al
1990) and electrical potential (Kim et al 2006) Some pH-responsive polymers such as
polyacrylamide and poly(acrylic acid) have the added benefit of high solubility in water The
combination of pH- or ionic concentration responsiveness and high solubility is advantageous for
producing large-scale quantities of clay-polymer composite material with the ability to be
ldquotunablerdquo in-situ thus creating a novel type of engineered soil
In spite of the considerable number of studies of clay-polymer composites clay
intercalation by polymer is not yet fully understood Due to many factors affecting the process
3
and difficulties of developing tools capable to monitor the process quantifying final morphology
and properties of the final clay-polymer composite is very challenging In addition
characteristics of clay minerals and the interactions responsible for meso-scale properties
occurring at the length scales of monomers approximately a billionth of a meter limit probing
with current experimental techniques Thus computer simulation and modeling may play an
ever-increasing role in designing and predicting material properties and designing such
experimental work For clay-polymer composites computer simulation and modeling are
especially useful in addressing the thermodynamics and kinetics of the formation of composites
the hierarchical characteristics of the structure and dynamics the dependence of polymer
rheological behavior on the addition of clay particles and the molecular origins of the
reinforcement mechanisms
11 Motivation
The motivation for this study can be summarized as follows
(1) Irreversible interactions of polymer with clay limits further modifications of clay-
polymer composites
(2) Commonly used techniques including melt intercalation and in-situ intercalation to
produce clay-polymer composites with intercalated structure demands extra energy
thus limits large-scale production which is necessary for geotechnical and
geoenvironmental applications
(3) With current experimental technologies it is very challenging to quantitatively
characterize polymer molecules in the interlayer space of clay minerals
4
12 Objectives
Although many studies of soil modification with the use of polymers and efforts to
produce a material with controllable morphology have been previously addressed a study of
large-scale clay modification with the use of responsive polymers has not been reported Micro-
andor nano-level conformational changes of responsive polymers as a function of external
environment triggers may result in changes in micro- and meso-scale properties In addition the
use of water-soluble polymers may provide the potential for in-situ large-scale production This
work includes the use of water-soluble responsive polymers as a viable tool for creating a new
family of clay-polymer composites The optimum condition for creating clay-polymer
composites while maximizing the amount of intercalated structure formation was investigated
experimentally Once the optimum conditions were found further experimental and
computational investigations were conducted to determine whether or not the controllable
characteristics of the responsive polymer results in changes in micro- and meso-scale properties
of the clay-polymer composites ie ldquotunablerdquo clay-polymer nanocomposites
The objectives of this study are (1) to create ldquotunablerdquo clay-polymer nanocomposites
using an expandable clay (montmorillonite) and a water-soluble responsive polymer
(polyacrylamide) and to develop an optimized procedure for the future large-scale production of
in-situ modifiable engineered clay soils (2) to link the micro-scale response of the polymer in
the synthesized clay-polymer composites to the meso-scale properties of the system such as
specific surface area swelling potential and permeability and (3) to perform a computational
analysis supporting the experimental findings X-ray diffraction will be used to investigate the
formation of intercalated structure Nuclear magnetic resonance will be used to explore the
effects of strong acidic and basic solutions on the mineral dissolution Dynamic light scattering
and spectroscopic ellipsometry will be used to characterize the controllable morphology of the
clay-polymer composites at the micro-scale Specific surface area swelling potential and
5
hydraulic conductivity will be measured to characterize the controllable morphology at the meso-
scale Coarse-grained atomistic computer simulation technique will be utilized to support the
experimental findings
13 Hypothesis
This study is about synthesizing a new family of clay-polymer composites characterizing
and exploring micro- and meso-scale behavior of the composite material The specific questions
to be addressed in this study are
(1) Is it possible to synthesize a new family of clay-polymer composites ldquotunablerdquo clay-
polymer nanocomposite using an expansive clay and a responsive polymer If so
what is the optimum condition for the synthesis
(2) Can tunability of the new clay-polymer composite be characterized using current
experimental techniques such as spectroscopic ellipsometry
(3) Does the tunability at the micro-scale result in property changes at the meso-scale
(4) Can computer simulation support the experimental findings
14 Expected Contributions
Clay-polymer composites have proven effective for improving material properties
However the use of polymer has been limited in the field of geotechnical and geoenvironmental
engineering for many reasons including cost inefficiency and difficulties in handling Since this
study shows a way to solve the aforementioned problems it is expected that the use of polymer
materials in the geotechnical and geoenvironmental engineering will become more common In
particular it was found that an engineered clay soil with an ability for further modification has
the potential for many state-of-the-art applications by showing cost-effective procedures for
6
synthesis micro- and meso-scale characterizations and a way of overcoming limitations of
quantitative characterization ie introduction of computer simulation
7
Chapter 2
LITERATURE REVIEW
Much can be learned from the existing literature about the nature of clays and clay
surfaces polymers and even the interaction between the two materials Yet very little is known
about the behavior of responsive clay-polymer composites Systematic studies will be carried out
to investigate clay-polymer composite swelling behavior the conformational behavior of a
selected polymer interactions between the clay and polymer composite synthesizing techniques
and meso-scale computer simulation techniques Topics addressed in this chapter include (1) the
nature of montmorillonite (2) the concept of responsive polymers (3) polyacrylamide-
montmorillonite interactions and associations (4) preparation and (5) characterization of clay-
polymer composites and (6) meso-scale computer simulation
21 Nature of Montmorillonite
Montmorillonite (Mt) is a member of the smectite mineral group It has a crystalline
structure consisting of two silica tetrahedral sheets and one aluminummagnesium octahedral
sheet (21 layered phyllosilicate) The tetrahedral sheets and octahedral sheet are strongly held
together by shared oxygen atoms ndash covalent bonds ndash forming a single layer The thickness of the
layers is on the order of 1 nm and aspect ratios are typically 100 to 1500 Various cation
substitutions such as Si4+ by Al3+ in tetrahedral sheets and Al3+Fe3+ by Mg2+Fe2+ in octahedral
sheets ie isomorphic substitution can occur leading to a net negative charge on the layers (van
Olphen 1977 Brindley and Brown 1980 Newman 1987) The resulting charges are
counterbalanced by exchangeable cations such as Na+ K+ Ca2+ Mg2+ and organic ions While
some charge balancing cations are located on the external crystallite surface the majority of
exchangeable cations are found in the interlayer space (Giannelis et al 1999 Luckham and Rossi
1999)
8
Mt has the idealized structural formula My+∙nH2O(Al2-yMgy)Si4O10(OH)2 where M is a
monovalent charge compensating cation in the interlayer and y is the degree of isomorphic
substitution ranging from 50 to 130 represented as the cation exchange capacity (CEC cmolkg)
(van Olphen 1977 Brindley and Brown 1980 Giannelis et al 1999 Ray and Okamoto 2003)
The mineral composition of Mt compensated with sodium ions Na033[(Al167Mg033)Si4O10(OH)2]
is shown in Figure 21 Weak van der Waals attraction forces as well as a high repulsive potential
on the layer surface induced by isomorphic substitution allow water molecules and cations to
penetrate such that the interlayer spacing expands This is the basis for swelling behavior (van
Olphen 1977 Israelachvili 1991 Mitchell 1993)
Swelling behavior consists of two stages (van Olphen 1977) (1) crystalline or short-
range swelling and (2) osmotic or long-range swelling When dry Mt is first exposed to moist
conditions the interlayer cations become hydrated with water molecules The layers may
separate from 96Aring up to 22Aring (Theng 1979) The adsorption energy of the water layers on the
clay surface is the driving force in this stage of swelling The swelling behavior depends on the
nature of the interlayer cations such as the capacity of cations to retain the polar molecules within
the interlayer space and the location of the layer charge (van Olphen 1977 Newman 1987
Berend et al 1995 Whitley and Smith 2004 Ferrage et al 2005 Meunier 2005 Douillard et
al 2007) For example the interlayer spacing for Na+-montmorillonite increases from 96 Aring to
125 Aring when hydrated with one water layer under low water content to 156 Aring when hydrated
with two water layers and to 188 Aring when hydrated with three water layers under high water
content (Berend et al 1995 Chang et al 1995 Ferrage et al 2005)
On the other hand swelling does not occur when the layer charge is zero where no
cation-hydration occurs or when the layer charge is too high resulting in large electrostatic
attraction forces which prevent the penetration of water molecules (Meunier 2005)
9
Figure 21 Mineral composition of dry Na+-montmorillonite used in the study Violet-colored
circles denote an exchangeable cation Na+ Basal spacing in the absence of the exchangeable
cations is 0913 nm for dry clay (van Olphen 1977) The thickness of a layer is 0654 nm
obtained using X-ray diffraction (Brindley and Brown 1980)
Mt saturated with polyvalent cations typically swells less than when saturated with monovalent
cations because electrostatic attraction between a polyvalent cation and layer surface is large
enough to offset the double layer repulsion (Berend et al 1995 Luckham and Rossi 1999 Salles
Si
O
Al
Mg
Na
basal
spacing
096 nm
to ~ infin
Octahedral
sheet
Tetrahedral
sheet
Interlayer
space
Tetrahedral
sheet
10
et al 2007) In addition the electrostatic forces between the divalent cations and the layer
surface are greater than hydration forces of the divalent cations (Ashmawy et al 2002)
Mt saturated with small monovalent cations such as Li+ and Na+ can absorb more water
Osmotic forces derived from the relatively high ionic concentrations between the layers allow
water molecules to keep penetrating and thus leads to osmotic swelling (Swartzen-Allen and
Matijevic 1974 van Olphen 1977) Due to the difference in hydration energy swelling
increases for Mt containing counterions in the order of Li+ gt Cs+ Na+ gt Rb+ gt K+ (Newman
1987 Berend et al 1995 Hensen et al 2001 Salles et al 2007) This osmotic stage of swelling
is accompanied by large volume changes ndash in excess of 40Aring ndash of the interlayer spacing and is
limited by frictional forces of the particle surface due to the formation of edge-to-face particle
associations (van Olphen 1977 Theng 1979) As water content increases the layers swell
laterally as well as longitudinally (Fukushima 1984)
Near the mineral surface hydrated counterions are attracted to the net charge of the layer
surface according to Coulombic attraction These counterions diffuse away from the mineral
surface due to water polarity and thermal agitation The diffusion range is limited by the
attraction force between the particle or layer surface and the hydrated counterion and by the
electrical potential of the particle or layer The counterion concentration decreases to the bulk
fluid concentration as a function of distance from the surface The electrical double layer consists
of the Stern layer and the Gouy-Chapman diffuse layer as shown in Figure 22 The outer
boundary of the Gouy-Chapman diffuse layer is not well-defined (van Olphen 1977 Stumm
1992) The magnitude of surface charge is represented as the Stern potential and zeta potential
The Stern potential is represented by the pH value at which the total net surface charge is zero
while the zeta potential is depicted as zero electrophoretic mobility of a particle in an electric
field (Sposito 1998) The difference between Stern potential and zeta potential implies the
amount of diffuse ions entrapped within the shear plane of the electric double layer For example
11
Figure 22 Electrical potential (Vx) of double layer compiled from Israelachvili (1991) Stumm
(1992) Santamarina et al (2001) and Mitchell (1993)
the experimentally determined value of surface potential for one type of Mt is approximately 128
mV the zeta potential is found to be 78 mV and the distance from the surface to the shear plane
is 05 nm (Theng 1979) The thickness of the double layer (1κ in meters) depends on
(2)
(3)
(1)
Surface potential
Vst (Stern potential)
ζ (zeta potential)
Vst e Vx = Vstmiddote-x
κ (double layer thickness) distance x
(1) inner sphere complexes
(2) outer sphere complexes
(3) diffuse ion swarm
shear
plane
Stern
layer
Gouy-Chapman diffuse layer
12
permittivity of the surrounding fluid temperature bulk fluid concentration and ionic valence
(Stumm 1992 McBride 1994)
2
0
2
0
2
1
zc
T
Ne
k
av
B
where kB is Boltzmannrsquos constant (138 x 10-23 JK) ε0 is the permittivity of free space (8854 x
10-12 C2J-1m-1) e is the electron charge (1602 x 10-19 C) Nav is Avogadrorsquos number (6022 x 1023
mol-1) ε is the dielectric constant of the bulk fluid (785 for water at 25degC) T is absolute
temperature (K) c0 is bulk fluid (electrolyte) concentration (molm3) and z is the ion valence
Random movements of hydrated counterions in and out of the double layer induces a change in
the thickness as a function of thermal agitation and the availability of counterions (van Olphen
1977 Hunter 1993 Santamarina et al 2001)
Clay surface charge density consists of (Sposito 1989 Stumm 1992 Sposito 1998) (1)
permanent structural charges (σ0) resulting from isomorphic substitution or broken bonds in the
clay lattice (2) net proton charges (σH) due to protonationdeprotonation ie pH-dependent (3)
inner-sphere surface complex charges (σIS) and outer-sphere surface complex charges (σOS) and
(4) adsorbed ions in the diffuse double layer (σD) which have a similar mobility to the ions in the
bulk fluid The inner-sphere surface complexes include no water molecules between the clay
surface and the cation while the outer-sphere surface complexes contain at least one water
molecule in between Protonation and deprotonation of the mineral surface occurs through
potential determining ions such as H+ and OH- Other ions may form inner- and outer-sphere
complexes through adsorption Cation adsorption is especially significant because it alters the
surface charge on O2- termination sites depending on the concentration valence and size of the
ions Charge on a silica tetrahedral basal face (Si4O10) of smectite minerals can vary
approximately from 03 to 065 ie one O2- termination site every 028 ~ 06 nm2 (Meunier
2005) The charge can be calculated as (Zelazny et al 1996 Meunier 2005)
13
Charge = CEC (cmolkg) x mass of half unit cell (g) x 10-5
For example if a Mt has half unit cell formula Na033[(Al167Mg033)Si4O10(OH)2] and CEC=808
cmolkg layer charge of the mineral is 03
In 21 minerals such as Mt the permanent structural charge (σ0) is significant due to a
large amount of isomorphic substitution Since the permanent structural charges are pH-
independent all pH-dependent charges are typically on the particle edges where hydroxyl groups
such as Al-OH12- and Si-OH are dominant due to broken bonds of the tetrahedral and octahedral
layers While Mt theoretically has pH-dependent charges at the particle edges these charges
represent less than 5 of the total surface charge (Borchardt 1989) In addition to the particle
edges particle faces were also reported to be pH-dependent representing as much as 20 of the
face surface charge (Schindler 1981 Mohan and Fogler 1997)
The point of zero charge (PZC) is defined as pH value where total net surface charge (σP
= σ0 + σH + σIS + σOS) is zero (ie Stern potential is zero) The isoelectric point (IEP) is reached
when the electrophoretic mobility of a particle in an electric field is zero (ie zeta potential is
zero) Due to the diffuse nature of the ion swarm the PZC is typically not equal to the IEP
(Sposito 1998) Both PZC and IEP of a clay particle depend on the availability of OH-
termination sites along the particle surface fluid pH and the dominant counterion valence and
concentration in the fluid (Stumm 1992 Santamarina et al 2001) The presence of significant
permanent structural charges in Mt results in IEP less than pH 25 (Parks 1967 Drever 1997) or
even undetected IEP (Nishimura et al 1994 Tombacz et al 2001) Therefore the surface
charge of 21 mineral particles may remain negative even at very low pH
In general pore fluid chemistry such as pH and ionic concentration significantly affects
Mt particle arrangement (van Olphen 1977 Lagaly 1989 Mitchell 1993 Santamarina et al
2002a) In pH ranging from 4 to 11 edge-to-edge flocculation is observed at NaCl
concentrations greater than 5x10⁻³ molL and face-to-face aggregation is observed at NaCl
14
concentration greater than 025~03 molL (Rand et al 1980 Chen et al 1990) At pH below 4
the particle edges become positively charged while the particle faces still remain negatively
charged inducing electrostatic attraction between the edges and faces ie edge-to-face
flocculation (Lagaly 1989 Mohan and Fogler 1997) The edge-to-face flocs remain unsettled in
Mt suspensions which differs from that in kaolinite suspensions
When exposed to extreme pH conditions clay particles are subjected to irreversible
dissolution affecting the structure and structural charges (σ0) (Carroll and Starkey 1971 Shinoda
et al 1995 Zysset and Schindler 1996 Santamarina et al 2002a Steudel et al 2009) At low
pH the protonation of OH- in the octahedral layer and of O2- in the tetrahedral layer results in a
release of SiO2 At high pH the deprotonation of Si-OH and the formation of Si-O- in the
tetrahedral layer results in a release of Si The dissolution behavior is mainly observed at the
edge sites and the dissolution rate depends on both pH and ionic concentration Si dissolution
rates range from 3x10⁻⁷ to 2x10⁻⁶ molgmiddoth at pH 1 (Zysset and Schindler 1996) In addition to the
dissolution behavior a solution with high pH and ionic concentration may convert smectite into
illite at room temperature (Whitney 1990 Bauer and Velde 1999)
22 Responsive Polymers
Polymers are large molecules macromolecules composed of smaller units called
monomers Polymer characteristics vary with the arrangement of those monomer units andor the
various types of functional groups resulting in unique properties (Painter and Coleman 1997)
For example the chain conformation of a pH-responsive polymer such as poly(acrylic acid) or
polyacrylamide containing either an acidic (COOH) or a basic (NH2) functional group in the
polymer network varies with bulk solution pH (Michaels and Morelos 1955 Feil et al 1992
Chen and Hoffman 1995 Al-Anazi and Sharma 2002 Liu et al 2008)
15
Responsive polymers are the result of efforts to produce a material with controllable
morphology Responsive polymers are responsive to external environmental conditions such as
pH (Siegel and Firestone 1988 Brannon-Peppas and Peppas 1991 Feil et al 1992 Gudeman
and Peppas 1995 Al-Anazi and Sharma 2002 Xia et al 2006) ionic strength (Flory 1953
Gudeman and Peppas 1995 Al-Anazi and Sharma 2002 Wu and Shanks 2003) temperature
(Bae et al 1990 Park and Hoffman 1992) electric potential (Tanaka et al 1982 Kim et al
2006) and photo-irradiation (Suzuki and Tanaka 1990) Clay-polymer composites synthesized
with expansive clay (montmorillonite) and responsive polymer (polyacrylamide) were also
reported to show such controllable morphologies due to the responsiveness of polymer (Gao and
Heimann 1993)
The conformation of such responsive polymers varies with external environment triggers
Polyacrylamide polymer chains tend to have coiled conformation at pH below 105 and to have
extended conformation at pH above 105 (Besra et al 2004) Poly(acrylic acid) polymer chains
tend to have coiled conformation at pH below 425 and to have extended conformation at pH
above 425 (Al-Anazi and Sharma 2002) These pH-responsive polymers have the added benefit
of high solubility in water The combination of pH- or ionic concentration responsiveness and
high solubility is advantageous for producing large-scale quantities of clay-polymer composite
material with the ability to be ldquotunablerdquo in-situ thus creating a novel type of engineered soil
Polyacrylamide (PAM) is a widely used water-soluble polymer which is synthesized by
free radical polymerization of acrylamide derived from acrylonitrile by either bioconversion or
catalytic hydrolysis (Kulicke et al 1982 Brandrup and Immergut 1989 Barvenik 1994
Kurenkov 1997 Huang et al 2001 Wu and Shanks 2004) Polyacrylamide is a linear
amorphous odorless hard glassy white polymer with a very low toxicity The preferential
reactivity ratios of acrylamide allow a wide range of molecular weights further functionalizations
and charge densities A colorless crystalline acrylamide contains two functional groups a
16
a
CH
NH2
O = C
CH2
reactive double bond and an amide group The amide group is reactive in changing the ionic
character or in cross-linking the polymer A polyacrylamide solution generally undergoes
reaction characteristics of an aliphatic amide group most importantly hydrolysis
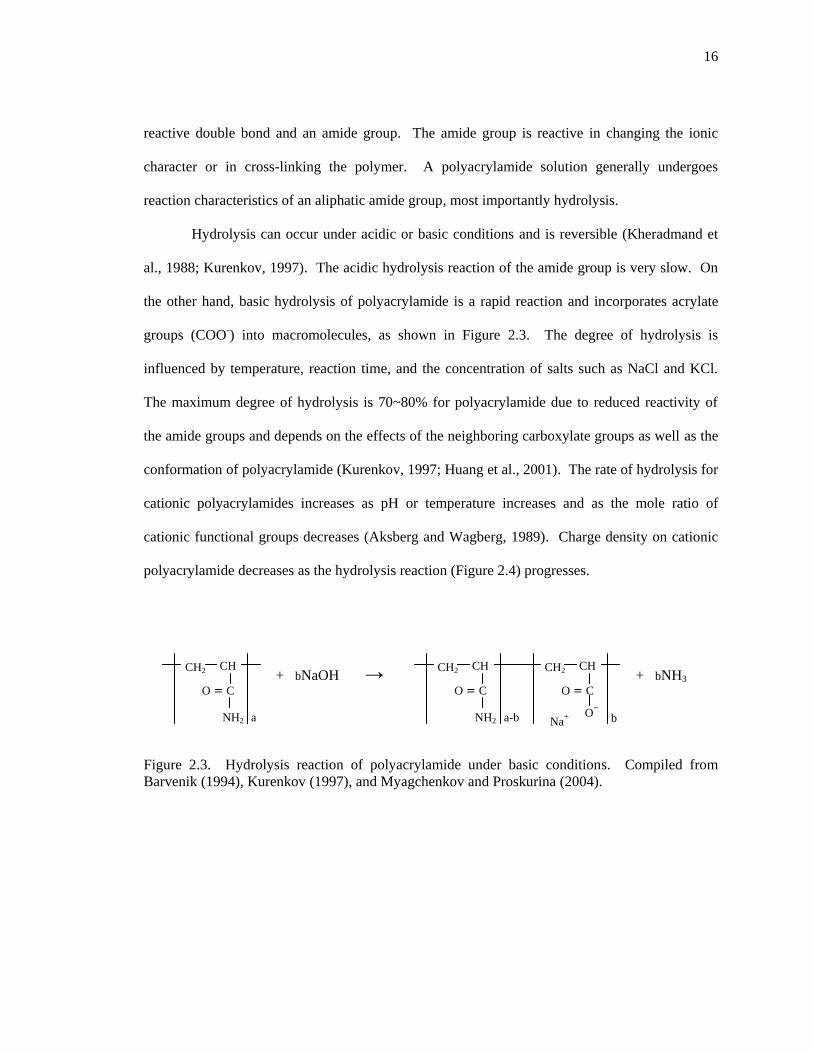
Hydrolysis can occur under acidic or basic conditions and is reversible (Kheradmand et
al 1988 Kurenkov 1997) The acidic hydrolysis reaction of the amide group is very slow On
the other hand basic hydrolysis of polyacrylamide is a rapid reaction and incorporates acrylate
groups (COO-) into macromolecules as shown in Figure 23 The degree of hydrolysis is
influenced by temperature reaction time and the concentration of salts such as NaCl and KCl
The maximum degree of hydrolysis is 70~80 for polyacrylamide due to reduced reactivity of
the amide groups and depends on the effects of the neighboring carboxylate groups as well as the
conformation of polyacrylamide (Kurenkov 1997 Huang et al 2001) The rate of hydrolysis for
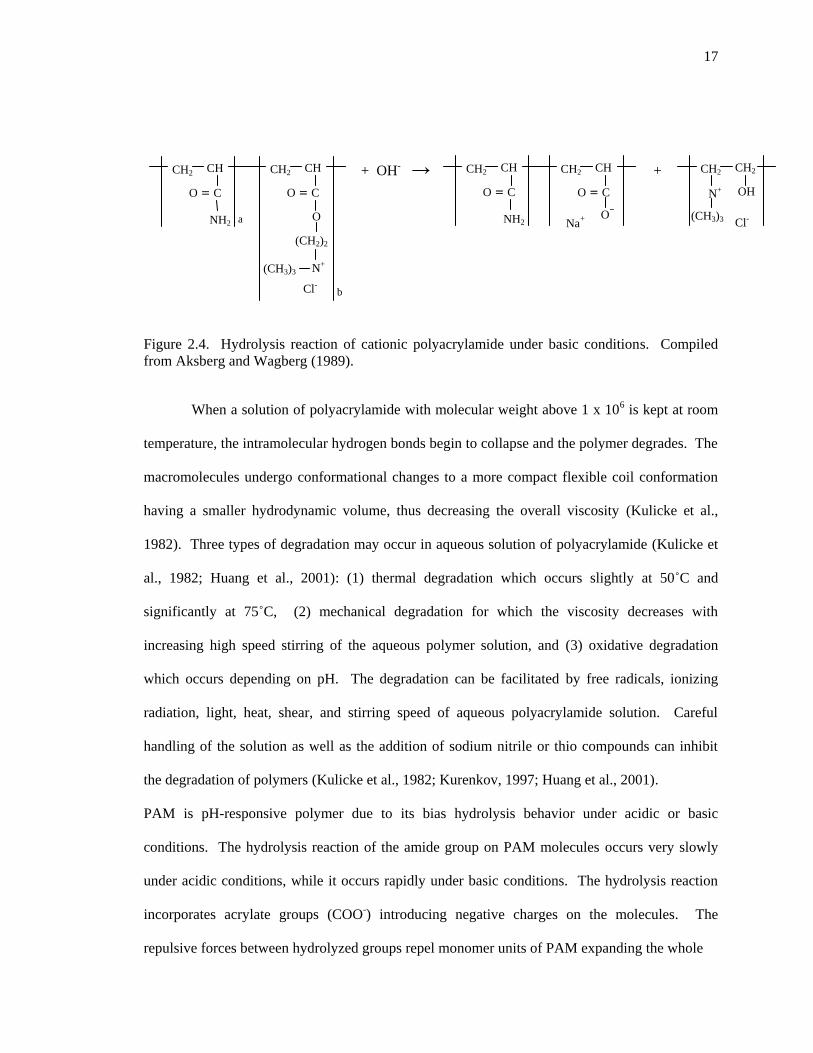
cationic polyacrylamides increases as pH or temperature increases and as the mole ratio of
cationic functional groups decreases (Aksberg and Wagberg 1989) Charge density on cationic
polyacrylamide decreases as the hydrolysis reaction (Figure 24) progresses
+ bNaOH rarr + bNH3
Figure 23 Hydrolysis reaction of polyacrylamide under basic conditions Compiled from
Barvenik (1994) Kurenkov (1997) and Myagchenkov and Proskurina (2004)
CH2
a-b
CH
NH2
O = C
CH2
b
CH
Na+
O = C
O-
17
a
CH
NH2
O = C
CH2 CH2
b
CH
N+
O = C
O
(CH2)2
(CH3)3
Cl-
+ OH- rarr +
Figure 24 Hydrolysis reaction of cationic polyacrylamide under basic conditions Compiled
from Aksberg and Wagberg (1989)
When a solution of polyacrylamide with molecular weight above 1 x 10⁶ is kept at room
temperature the intramolecular hydrogen bonds begin to collapse and the polymer degrades The
macromolecules undergo conformational changes to a more compact flexible coil conformation
having a smaller hydrodynamic volume thus decreasing the overall viscosity (Kulicke et al
1982) Three types of degradation may occur in aqueous solution of polyacrylamide (Kulicke et
al 1982 Huang et al 2001) (1) thermal degradation which occurs slightly at 50˚C and
significantly at 75˚C (2) mechanical degradation for which the viscosity decreases with
increasing high speed stirring of the aqueous polymer solution and (3) oxidative degradation
which occurs depending on pH The degradation can be facilitated by free radicals ionizing
radiation light heat shear and stirring speed of aqueous polyacrylamide solution Careful
handling of the solution as well as the addition of sodium nitrile or thio compounds can inhibit
the degradation of polymers (Kulicke et al 1982 Kurenkov 1997 Huang et al 2001)
PAM is pH-responsive polymer due to its bias hydrolysis behavior under acidic or basic
conditions The hydrolysis reaction of the amide group on PAM molecules occurs very slowly
under acidic conditions while it occurs rapidly under basic conditions The hydrolysis reaction
incorporates acrylate groups (COO-) introducing negative charges on the molecules The
repulsive forces between hydrolyzed groups repel monomer units of PAM expanding the whole
CH2
n-m
CH
NH2
O = C
CH2
m
CH
Na+
O = C
O- n-m
CH2 CH2
OH N+
(CH3)3 Cl-
18
Figure 25 Conformations for nonionic PAM under various pH and ionic strength conditions
(Michaels 1954 Klenina and Lebedeva 1983 Al-Anazi and Sharma 2002 Besra et al 2004)
Cyan and red monomers denote neutral monomer and charged monomer respectively Images
obtained from computer simulations (dissipative particle dynamics)
chain leading to extended conformation Therefore the polymer molecule has a contracted coil
conformation at acidic pH and an extended conformation at basic pH as shown schematically in
Figure 25 In addition to pH-responsive behavior PAM is responsive to ionic concentration
(Klenina and Lebedeva 1983 Brondsted and Kopecek 1992 Samanta et al 2010) With
decreasing ionic strength the conformation varies from extended to coiled Note that the Flory-
Huggins parameter (χ) for PAM is 048plusmn001 in water at 30degC (Huang et al 2001)
23 Polyacrylamide-Montmorillonite Interactions and Associations
Polymers have been observed to adsorb onto clay mineral surfaces via van der Waals
forces electrostatic interactions and hydrogen bonding interactions (van Olphen 1977 Theng
1979) Polymer adsorption on a clay particle surface alters the surface properties of the particle
such as surface charge and hence interparticle forces Polymer characteristics at the solid-liquid
Contracted coiled
conformation at pH lt 4
Partially coiled
conformation at pH asymp 6
Extended conformation
at pH gt 105
Increasing extended conformation with increasing pH and with decreasing ionic strength
19
interface play an important role The interaction with clay particles can be complex due to
electrostatic forces chemical bonding and other forces operating simultaneously Understanding
the interplay and relative significance of each of these phenomena is critical to the interpretation
of a given polymerrsquos affect on a clay system
Polyacrylamide (PAM) has been observed to irreversibly adsorb onto clay mineral
surfaces and external surfaces of soil aggregates (Stutzmann and Siffert 1977 Gao and Heimann
1993 Lochhead and McConnell Boykin 2002) Interactions between clay particles and polymer
molecules result from (1) polymer bridging (2) charge neutralization or compensation (3)
complex formation between clay particle surfaces and polymer molecules or (4) a combination of
these mechanisms (Mortland and Brady 1970 van Olphen 1977 Pefferkorn et al 1987 Lee et
al 1991 Gao and Heimann 1993 Laird 1997 Dobias et al 1999 Mpofu et al 2003 Deng et
al 2006) Polymer bridging plays a major role in the presence of nonionic polymers (Theng
1982 Laird 1997 Hogg 1999 Deng et al 2006) while charge neutralization plays a major role
in the presence of cationic polymers
A nonionic polyacrylamide molecule strongly interacts with the clay surface via polymer
bridging reducing the overall negative charge through alteration of the electrical double layer
repulsive force (Fleer et al 1972 Carasso et al 1997 Besra et al 2002) A polymer molecule
can be adsorbed onto clay particles simultaneously bridging more than one particle The amide
group specifically the carbonyl oxygen (C=O) of PAM bonds to the edge site (Al-Al-OH or Al-
Mg-OH group) through hydrogen bonding Hydrogen bonding between the carbonyl group and
the face site is favored under acidic pH (Lochhead and McConnell Boykin 2002) Hydrogen
bonding also occurs between the oxygen atoms of clay and the protons of the amide group
(Haraguchi and Takehisa 2002) Hydrophobic bonding occurs between the hydrophobic
backbone (CH2-CH) of PAM and the hydrophobic basal face (ie uncharged sites on the siloxane
face) Exchangeable cations on the clay surface are bridged to the carbonyl oxygen of PAM
20
through ion-dipole interaction ie complex formation (Mortland and Brady 1970 Haraguchi and
Takehisa 2002 Ruiz-Hitzky and van Meerbeek 2006) Water molecules can bridge the
exchangeable cation together with the carbonyl oxygen through hydrogen bonding between the
water molecule and the carbonyl group and ion-dipole interaction between the water molecule
and the exchangeable cation
Polymer bridging can be modified by the molecular weight of the polymer the
conformation (ie coiled or extended) of polymer molecules and preexisting exchangeable
cations on the clay particle surface The conformation of PAM molecules in aqueous systems is
pH-dependent At pH = 6 both cationic and nonionic PAM molecules are neither fully extended
nor fully coiled that is intermediate conformation (Besra et al 2004) The importance of the
exchangeable cations in terms of ion-dipole interaction increases in the order Na+ K+ lt Ca2+
Mg2+ lt Al3+ lt Cu2+ Ni2+ (Deng et al 2006)
Coulombic attraction is the dominating bonding mechanism between the clay surface and
cationic PAM molecules (van Olphen 1977 Theng 1979 Laird 1997 Mpofu et al 2003) The
positively charged trimethyl ammonium groups (NR3) of cationic PAM are attracted to the
negatively charged sites along clay particle surface At the critical coagulation concentration
(CCC) of PAM all charges on the mineral surface are compensated Once the CCC is exceeded
aggregation occurs through van der Waals attraction The charged groups of cationic PAM may
also adsorb onto more than one particle and so may also contribute to polymer bridging
Cationic PAM molecules may also form an adsorption complex when a concentration of PAM
greater than the critical coagulation concentration is used The hydrophobic backbones (CH2-
CH) of the excess cationic PAM molecules link together through van der Waals attraction
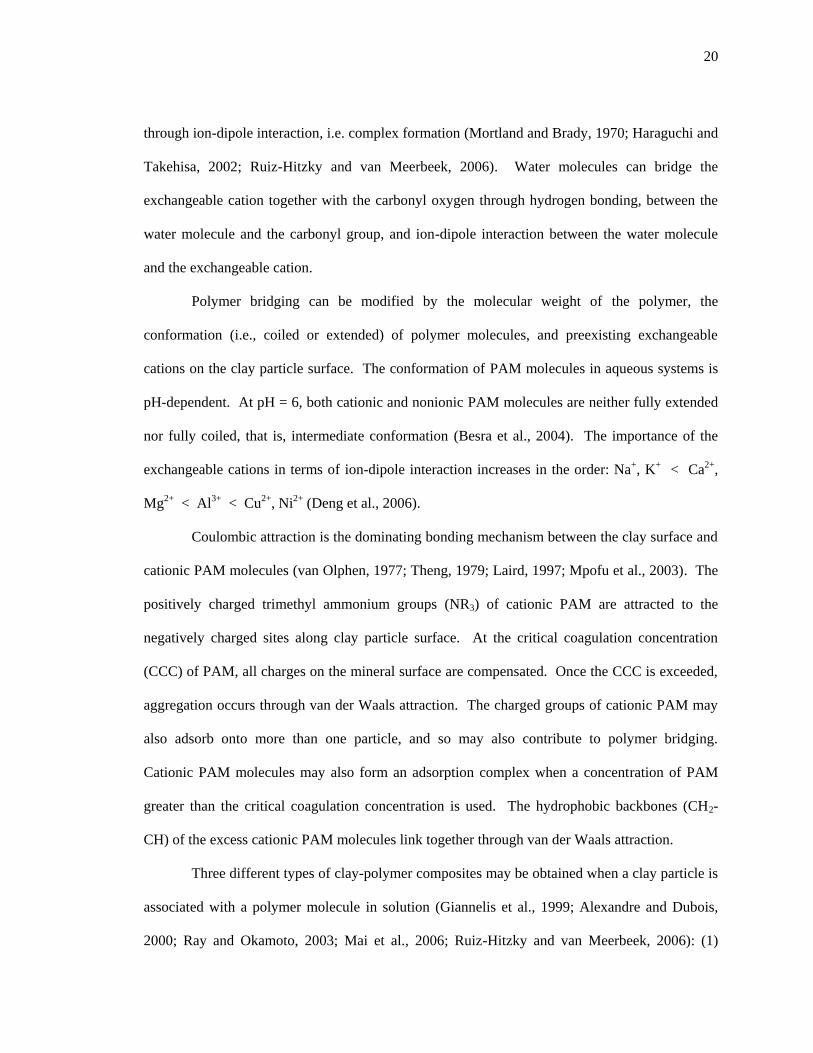
Three different types of clay-polymer composites may be obtained when a clay particle is
associated with a polymer molecule in solution (Giannelis et al 1999 Alexandre and Dubois
2000 Ray and Okamoto 2003 Mai et al 2006 Ruiz-Hitzky and van Meerbeek 2006) (1)
21
phase-separated (microcomposite or conventional composite) (2) intercalated and (3) exfoliated
structures as shown in Figure 26 The phase-separated structure does not include polymer
intercalation into the interlayer space and thus interactions between a clay particle and a polymer
molecule lead to particle-level composites or microcomposites Properties of the phase-separated
composites are nearly the same as a traditional clay-polymer mixture Intercalated structure
develops when an extended polymer molecule is inserted between the particle layers The pattern
repeats every few nanometers maintaining a well-defined spatial relationship to each other ie
layered structure (Figure 26-b) Intercalation of clays by polymer is attributed to ion-exchange
reaction and ion-dipole interaction (Pospisil et al 2002 Pospisil et al 2004 Ruiz-Hitzky and
van Meerbeek 2006) Exchangeable cations in the interlayer space either replace with inorganic
andor organic cations or interact with polar neutral molecules intercalated between silicate
layers In an exfoliated structure which normally occurs with high polymer content the layers
are completely separated and the individual layers are distributed throughout the system
Exfoliation is identified by X-ray diffractograms with no diffraction peaks since the particle
layers have separated far from one another (gt 8 nm) Since the intercalated and exfoliated
structures result in layer-level composites or nanocomposites properties of the nanocomposites
may totally differ from the microcomposite This study focuses on the development and
manipulation of clay-polymer nanocomposites with intercalated structures
(a) (b) (c)
Figure 26 Schematic of various clay-polymer composites (a) phase-separated (b) intercalated
and (c) exfoliated structures
22
Polymer treatment alters the properties of Mt (van Olphen 1977 Theng 1979) For
example hydraulic conductivity of Mt increases with cationic polyacrylamide addition
(Ashmawy et al 2002) The mechanism of this phenomenon includes polymer bridging through
(1) the replacement of the adsorbed Na+ or Ca2+ in the clay by the cationic polymer molecules
(this process is likely to be irreversible since a number of cations on a single polymer chain
would need to be displaced simultaneously) and (2) a relatively weak dipole bond between the
cationic polymer molecule and Na+ In this case the replacement of Na+ is not likely since the
clay sheets are coated with the polymer
24 Synthesis of Clay-Polymer Nanocomposites
Clay-polymer nanocomposites (CPN) can be synthesized through four main techniques
(Gao and Heimann 1993 Vaia et al 1993 Yano et al 1993 Ray and Okamoto 2003 Gao
2004 Koo 2006 Mai et al 2006) (1) in-situ polymerization (2) solution exfoliation (3) melt
intercalation and (4) solution intercalation In-situ polymerization involves the construction of
polymer chains from monomers in solution within the clay particle interlayer space and
polymerization is initiated with heat radiation pre-intercalated initiators or catalysts (Zeng et al
2005) Extrapolating these extra steps to the macro-scale may inhibit the economic feasibility of
producing large quantities of intercalated materials especially when added heat or radiation is
required Solution exfoliation requires a solvent to exfoliate layered particles into single platelets
to which the polymers adsorb However this technique results in a polymer matrix ldquostuddedrdquo
with individual platelets In addition there are accompanying health and safety concerns due to
the organic solvent (Gao 2004) Melt intercalation requires heating the polymer matrix to a
molten state and then adding small quantities of clay material This process leads to a polymer
enhanced with clay rather than clay enhanced with a polymer
23
The intercalation of polymer molecules into clay particle interlayers without exfoliation
can be attained using solution intercalation (Yano et al 1993 Ray and Okamoto 2003 Gao
2004 Koo 2006 Mai et al 2006) which utilizes water-soluble polymers such as
polyacrylamide and swelling clay such as bentonite Intercalation by polymer molecules takes
place from a bulk polymer solution The interlayer water molecules are spontaneously displaced
with a polymer molecule due to negative variation in the Gibbs free energy (Theng 1979 Mai et
al 2006) The entropy obtained by desorption of water molecules from exchangeable cations in
the interlayer space compensates for the decrease in the overall entropy of the intercalated
polymer molecules leading to the polymer intercalation (Vaia et al 1993) Therefore the
reaction occurs without providing an external energy source implying better cost-efficiency than
other intercalation techniques In addition low health and safety risks can be expected due to the
use of water as a solvent
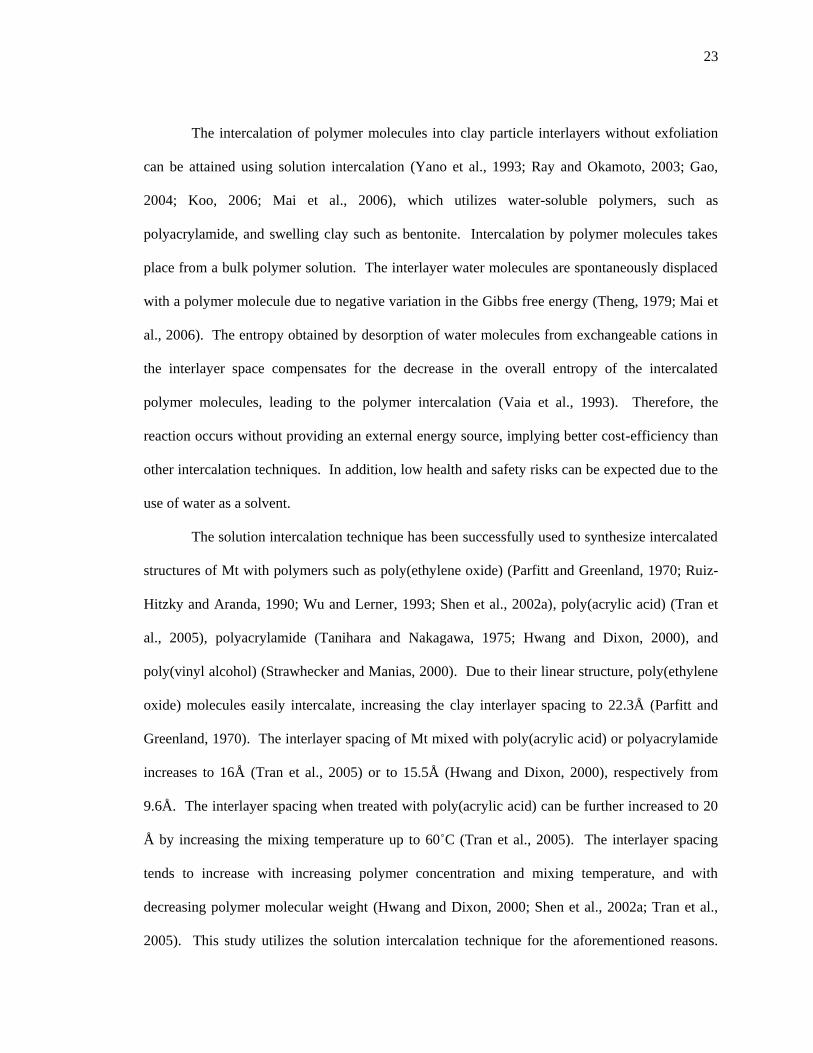
The solution intercalation technique has been successfully used to synthesize intercalated
structures of Mt with polymers such as poly(ethylene oxide) (Parfitt and Greenland 1970 Ruiz-
Hitzky and Aranda 1990 Wu and Lerner 1993 Shen et al 2002a) poly(acrylic acid) (Tran et
al 2005) polyacrylamide (Tanihara and Nakagawa 1975 Hwang and Dixon 2000) and
poly(vinyl alcohol) (Strawhecker and Manias 2000) Due to their linear structure poly(ethylene
oxide) molecules easily intercalate increasing the clay interlayer spacing to 223Aring (Parfitt and
Greenland 1970) The interlayer spacing of Mt mixed with poly(acrylic acid) or polyacrylamide
increases to 16Aring (Tran et al 2005) or to 155Aring (Hwang and Dixon 2000) respectively from
96Aring The interlayer spacing when treated with poly(acrylic acid) can be further increased to 20
Aring by increasing the mixing temperature up to 60˚C (Tran et al 2005) The interlayer spacing
tends to increase with increasing polymer concentration and mixing temperature and with
decreasing polymer molecular weight (Hwang and Dixon 2000 Shen et al 2002a Tran et al
2005) This study utilizes the solution intercalation technique for the aforementioned reasons
24
The solution intercalation technique has not attracted enormous interest because of its sensitivity
to experimental conditions such as polymer concentration (Shen et al 2002a) Thus it is
important to first understand the factors that control the extent of intercalation by the polymer in
order to develop a large-scale production technique
25 Characterization of Clay-Polymer Nanocomposites
251 X-ray Diffraction
Changes in the basal spacing of the synthesized clay-polymer composites is typically
characterized using X-ray diffraction (XRD) This is technique most often used to characterize
clay-polymer nanocomposites particularly with intercalated structures (van Olphen 1977 Koo
2006 Mai et al 2006) Intercalation of polymer molecules into the layer space increases the
interlayer spacing resulting in a shift of the diffraction peak towards lower angle values Thus
resulting interlayer spacing is calculated based on the Braggrsquos equation λ=2dmiddotsinθ where λ
denotes the wave length of the X-ray radiation (typically CuKa where λ=1541Aring ) d denotes the
interlayer spacing and θ denotes the measured diffraction angle
252 Spectroscopic Ellipsometry
Ellipsometry has previously been utilized to measure the thickness of the double layer
and adsorbed polymer layer on a surface (Lee and Fuller 1984 Irene 1993 Filippova 1998
Schwarz et al 1999 Russev et al 2000 Fan and Advincula 2002 Fan et al 2002 Wang et al
2004 Schmidt et al 2009) The technique detects the change in the polarization state of the light
modified by a sample surface Among the many techniques such as nuclear magnetic resonance
vibrational spectroscopy ellipsometry and neutron scattering that can be used to characterize
adsorbed polymer layers (Cohen Stuart et al 1986) ellipsometry illuminates in-situ
characteristics of adsorbed polymer molecules on a nearly flat surface such that effects of the
surface properties including roughness and curvature can be negligible Other benefits of using
25
ellipsometry are that the method is non-destructive non-invasive highly accurate requires only
small sample sizes and can be used on wet samples (Irene 1993 Russev et al 2000 Fan et al
2002) The achievable resolution can be lt 1 Aring but sensitivity to film thickness can be
maintained to tens of microns Changes in the polarization state result in different values of the
relative phase change Δ and the relative amplitude change which are characteristic angles of
the surface reflecting the polarized light perpendicularly (s-wave) and parallel (p-wave) to the
incidence plane The fundamental relationship between and is given as a complex reflection
coefficient (Irene 1993)
)exp()tan( i
||
||)tan(
s
p
r
r
sp
where p and s are the phase angles and rp and rs represent the complex amplitude reflection or
Fresnel coefficients The properties of the sample ndash optical properties in the form of the complex
refractive index (N = n +ik) or complex dielectric function (ε = ε1 + iε2 = N2) spectra and
microstructural factors such as film thickness ndash affect the measured spectra (Δ ψ) Thus the pH-
and time-dependent conformational changes of adsorbed polymer molecules onto a simulated
mineral surface may be captured through measurement of the spectroscopic ellipsometric angles
26 Computer Simulation
261 Overview
One important goal of simulation and modeling in material science is the accurate and
rapid prediction of materials and their properties and features Computer simulation may provide
a molecular level understanding of the mechanisms responsible for the behavior of clay-polymer
26
systems All forces and interactions occurring at a nano- andor micro-level can easily be
modeled by mathematical equations Such a technique not only complements experimental
results with a detailed atomistic level picture of the relevant phenomena but also illuminates
systems unaccessible via experimental methods Computer simulation and modeling of clays and
polymers based on theories and computational methods have long been used to study and
understand their complex behavior (Chang et al 1995 Skipper et al 1995 Boek et al 1996
Groot and Warren 1997 Sposito et al 1999 Balazs et al 2000 Bourg et al 2003 Cygan et al
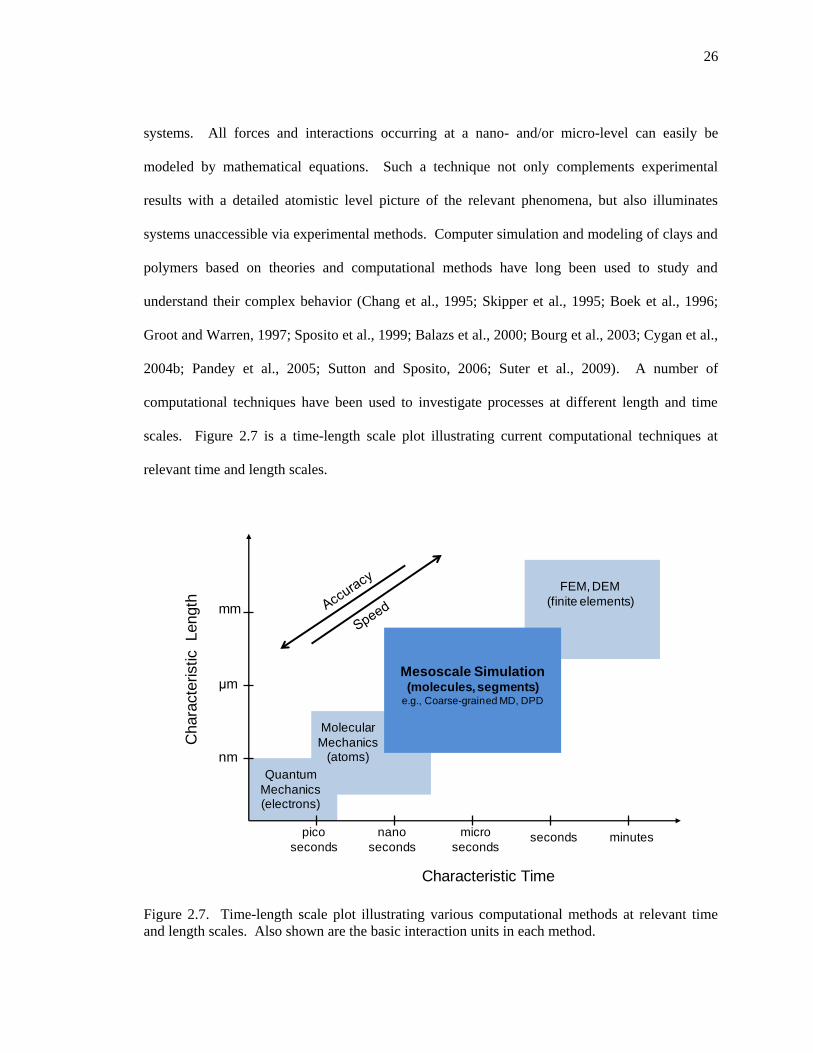
2004b Pandey et al 2005 Sutton and Sposito 2006 Suter et al 2009) A number of
computational techniques have been used to investigate processes at different length and time
scales Figure 27 is a time-length scale plot illustrating current computational techniques at
relevant time and length scales
Quantum
Mechanics(electrons)
Mesoscale Simulation (molecules segments)
eg Coarse-grained MD DPD
Molecular
Mechanics(atoms)
Chara
cte
ristic
Length
Characteristic Time
mm
μm
nm
pico
seconds
nano
seconds
micro
seconds seconds minutes
FEM DEM
(finite elements)
Figure 27 Time-length scale plot illustrating various computational methods at relevant time
and length scales Also shown are the basic interaction units in each method
27
Since atomistic simulation and modeling methods such as molecular dynamics (MD) and
Monte Carlo (MC) approach a realistic description of the system they are commonly used to
understand the behavior and properties of clays electrolytes and polymers (Skipper et al 1995
Sposito et al 1999 Chodanowski and Stoll 2001 Bourg et al 2003 Boulet et al 2004 Cygan
et al 2004b Laguecir and Stoll 2005 Katti et al 2006 Sutton and Sposito 2006 Ulrich et al
2006 Rotenberg et al 2007 Mazo et al 2008 Pagonabarraga et al 2010) However extreme
care must be taken in interpreting the results from such atomistic simulations since they can only
probe extremely small spatial dimensions and very limited time scales compared to experiments
In addition atomistic simulations take a significant amount of time and cost for predicting the
behavior of full-scale complex systems such as clay-polymer composites due to the restricted
length (~102 nm) and time scale (~102 ns) (Rotenberg et al 2007) For example a clay particle
with a width of 05μm and 100 layers would have about 01 billion atoms If such particles are
associated with a polymer molecule to form clay-polymer composites the system would
comprise too many atoms for atomistic simulation to equilibrate microscopic properties such as
radius of gyration or end-to-end distance
On the other hand the basic idea of coarse-grained atomistic computer simulation such
as coarse-grained molecular dynamics (CGMD) and dissipative particle dynamics (DPD) is to
decrease the system size These meso-scale computer simulations are based on spring-connected
particles so-called beads representing groups of atoms Thus the coarse-grained atomistic
technique has advantages in simulating and modeling large andor complex systems at a longer
timescale with current computer performance (Kremer and Grest 1990 Groot and Warren 1997
Goddard et al 2001 Muller-plathe 2002 Nieminen 2002 Kroger 2004 Boek et al 2005
Daivis et al 2007 Depa 2007 Fermeglia and Pricl 2007 Scocchi et al 2007 Zeng et al
2008 Luo and Sommer 2009 Suter et al 2009 Gruenert et al 2010) Figure 28 illustrates a
28
L AL
A
(a) (b)
Figure 28 Schematic of coarse-graining on (a) a polyacrylamide chain and (b) a Mt particle
The smaller spheres represent atoms the larger yellow and blue spheres are coarse-grained beads
Bond length (L) and bond angle (A) of the coarse-grained beads are also shown
schematic of coarse-graining a polymer chain and a clay particle where a monomer and a unit cell
of the clay particle respectively are replaced with a single bead
262 Dissipative Particle Dynamics
DPD was introduced by Hoogerbrugge and Koelman (1992) for addressing
hydrodynamic behavior of fluids While DPD is similar to molecular dynamics (MD) it has one
major difference in that a group of atoms a so-called coarse-grained bead is the basic unit of
DPD simulation Thus DPD has several advantages over the traditional MD technique For
example hydrodynamic behavior of a DPD system can be observed with fewer particles than that
required in an MD simulation which allows larger time steps to be taken than those in MD DPD
can simulate both Newtonian and non-Newtonian fluids including polymer solutions on
microscopic length and time scales
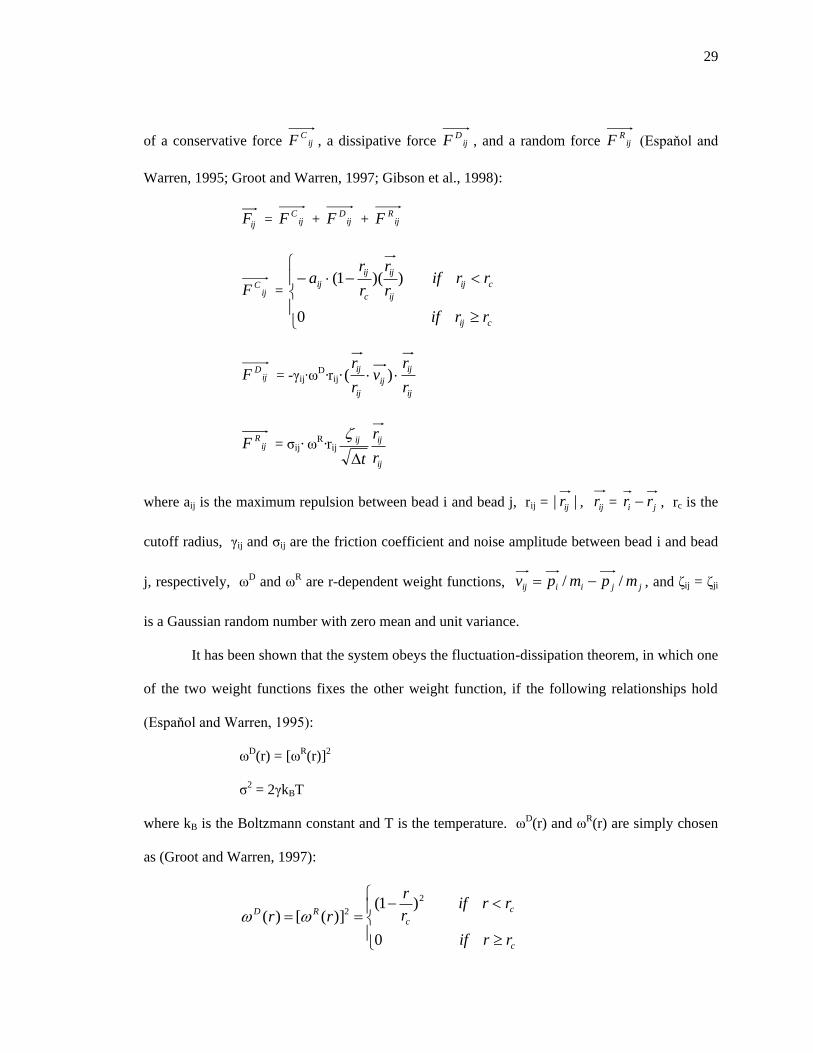
In the DPD approach all beads are defined by their mass mi position ir and momentum
ip Particles interact through a pairwise two-body short-ranged force ijF describing the sum
29
of a conservative force ijCF a dissipative force ij
DF and a random force ijRF (Espaňol and
Warren 1995 Groot and Warren 1997 Gibson et al 1998)
ijF = ijCF + ij
DF + ijRF
ijCF =
cij
cij
ij
ij
c
ij
ij
rrif
rrifr
r
r
ra
0
))(1(
ijDF = -γij∙ω
Dmiddotrijmiddotij
ij
ij
ij
ij
r
rv
r
r )(
ijRF = σijmiddot ω
Rmiddotrij
ij
ijij
r
r
t
where aij is the maximum repulsion between bead i and bead j rij = || ijr ijr = ji rr rc is the
cutoff radius γij and σij are the friction coefficient and noise amplitude between bead i and bead
j respectively ωD and ωR are r-dependent weight functions jjiiij mpmpv and ζij = ζji
is a Gaussian random number with zero mean and unit variance
It has been shown that the system obeys the fluctuation-dissipation theorem in which one
of the two weight functions fixes the other weight function if the following relationships hold
(Espaňol and Warren 1995)
ωD(r) = [ωR(r)]2
σ2 = 2γkBT
where kB is the Boltzmann constant and T is the temperature ωD(r) and ωR(r) are simply chosen
as (Groot and Warren 1997)
c
c
cRD
rrif
rrifr
r
rr
0
)1()]([)(
2
2
30
Neighboring beads in a polymer chain link together through a harmonic spring with the spring
constant ks and equilibrium bond length r0 (Groot and Warren 1997)
Fsij = ksmiddot(r ndash r0)
2
The spring constant for polymers ranges from 4 to 10 (Groot 2003 Qian et al 2007) The
equilibrium bond length ranging from 0 to 085rc has been adopted for a polymer molecule
(Gibson et al 1998 Gibson et al 1999 Rekvig et al 2003 Gonzalez-Melchor et al 2006)
This harmonic spring can also be used as a bond in a rigid particle For a rigid particle including
clay particles the spring constant varies from 50 to 100 (Rekvig et al 2003 Gonzalez-Melchor
et al 2006 Knauert et al 2007)
Electrostatic interactions play a key role in understanding the phenomena of a complex
system such as colloidal suspensions polymeric solutions and their mixtures Thus the
inclusion of electrostatic interactions in DPD simulations is essential to capture the micro-scale
phenomena including charged polymer adsorption on a clay particle clay intercalation by a
charged polymer and conformation of a charged polymer adsorbed on a surface Electrostatic
interactions in DPD simulations can be solved using a grid method modified Ewald sum method
or modified particle-particle particle-mesh (PPPM) technique (Groot 2003 Gonzalez-Melchor et
al 2006 Ibergay et al 2009) The grid method in which the electrostatic field is solved locally
on a grid efficiently captures the most important features of electrostatic interactions in a
reasonable manner Polyelectrolyte-surfactant systems were successfully simulated using this
method (Groot 2003) The modified Ewald sum method is a combination of the standard Ewald
method with some charge distribution on a particle that avoids the formation of nondesirable
ionic pairs due to soft repulsion of DPD beads The modified PPPM method in which charges
are distributed over a particle has also been successfully used to study charged polymer systems
(Ibergay et al 2009 Ibergay et al 2010) The standard Ewald method is known for accurately
describing Coulombic forces (Ewald 1921 Essmann et al 1995 Cygan et al 2004a Suter et
31
al 2007) However since computational efficiency is more important in a very complex system
the modified PPPM method was used in this study
DPD simulations usually operate in reduced units that are dimensionless Length mass
and energy are measured in units of a force cutoff radius the mass of a single DPD bead and kBT
where kB is Boltzmannrsquos constant and T is absolute temperature
32
Chapter 3
SYNTHESIS OF TUNABLE CLAY-POLYMER NANOCOMPOSITES
The purpose of the study described in this chapter is to develop an optimized procedure
for synthesizing clay-polymer nanocomposites using an expansive clay mineral (bentonite) and a
responsive polymer (polyacrylamide) for the future production of ldquotunablerdquo clay soils The
nanocomposites were produced using a solution intercalation technique that has potential for
large-scale production in situ Variables investigated include clay content polymer molecular
weight pH and clay-to-polymer volume ratio Changes in the basal spacing of bentonite were
characterized using X-ray diffraction
31 Introduction
In order to enhance engineering properties clay soils are often manipulated by physical
andor chemical processes including polymer addition However polymer treatment limits
further modification of the clay-polymer nanocomposites due to their irreversible interactions A
responsive polymer can be used to synthesize clay-polymer nanocomposites (CPN) the properties
of which vary with external environment triggers That is interlayer andor interparticle spacing
of the CPN can be manipulated through changes in the surrounding fluid pH ionic concentration
temperature or electric field For example CPN synthesized from a pH responsive polymer may
be further modifiable by exposing the CPN to alternate pH conditions Since the conformation of
pH-responsive polymers varies with pH the interlayer andor interparticle spacing may also vary
with pH By altering the fabric of the clay system at the particle level the meso-scale properties
such as void ratio permeability swelling potential and strength will also be affected For
example when the conformation of the polymer becomes coiled the interlayer andor
interparticle spacing decreases This leads to a dense fabric and a subsequent decrease in void
ratio Once the polymer is adsorbed in the interlayer space of swelling clays the swelling
33
behavior may also be controlled via the reversible conformational change of the responsive
polymer
In order to maximize the potential for interlayer and interparticle spacing modification
the optimized design of nanocomposites is CPN with intercalated structures in which polymer
molecules are adsorbed onto both the particle surface and interlayer surface Hence both
interparticle and interlayer spacing of the CPN are capable of further modification through
exposure to alternating pH conditions ie ldquotunablerdquo CPN
The purpose of this study is to develop an optimized procedure for synthesizing ldquotunablerdquo
CPN using an expansive clay mineral (montmorillonite) and a responsive polymer
(polyacrylamide) for the future production of in-situ modifiable clay soils Furthermore the CPN
should be created such that the potential for structure modification is maximized The CPN were
synthesized using a solution intercalation technique which has potential for in-situ large-scale
production The significance of this approach is that the optimized procedure found through this
study can be utilized to synthesize a new type of CPN which is tunable as well as feasible for in-
situ large-scale production The variables investigated in this study include clay content polymer
molecular weight pH and clay-to-polymer volume ratio Changes in the basal spacing of
montmorillonite were characterized using X-ray diffraction (XRD) Nuclear magnetic resonance
(NMR) spectroscopy was used to monitor mineral dissolution under the tested pH conditions
The effects of nanocomposite synthesizing temperature were also investigated
32 Experimental Study
321 Materials
3211 Bentonite
Montmorillonite (Mt) was chosen due to its large swelling capacity which provides the
greatest opportunity for polymer molecule adsorption onto both the particle surface as well as the
34
interlayer surfaces The clay mineral used in this study is an untreated Mt a dioctahedral
smectite with the chemical formula (NaCa)033(Al167Mg033)Si4O10(OH)2middotnH2O A sodium
bentonite from American Colloid Company (Arlington Illinois) designated commercially as
AEG powder was used as the sour of Mt The sodium bentonite comprises principally of Mt and
minor amounts of feldspar and quartz The chemical composition obtained from the supplier is
listed in Table 31 Selected properties of the clay material are given in Table 32 The Mt was
oven-dried for 24 hours at 105˚C prior to testing
3212 Polyacrylamide (PAM)
Polymer intercalation into the interlayer space of Mt was attempted using
polyacrylamides obtained from Cytec Industries Inc (West Paterson NJ) Polyacrylamide was
chosen because it is responsive to pH changes Specifically the conformation (expansion or
contraction) of a PAM molecule depends on the surrounding fluid pH The polymer molecule has
a contracted coil conformation at acidic pH and an extended conformation at basic pH (Michaels
1954 Al-Anazi and Sharma 2002 Besra et al 2004) as shown schematically in Figure 25
Therefore PAM molecules are expected to be more easily adsorbed onto the interlayer space at
basic pH leading to more intercalated structure formation than that at acidic pH PAM is also
sensitive to ionic concentration but this property was not considered in this study Hence ionic
concentration was kept constant The two types of polyacrylamides used in this study were high
molecular weight nonionic (NPAM) and low molecular weight nonionic (nPAM) These polymer
types were chosen to highlight the impacts of molecular weight difference on the formation of
intercalated structure Selected characteristics of the polymers are given in Table 33
35
Table 31 Chemical composition of the sodium bentonite used in this study (Supplier data)
component component
SiO2 6302
Al2O3 2108
Fe2O3 325
FeO 035
CaO 065
MgO 267
Na2O 257
trace 072
LOI 564
Table 32 Properties of the sodium bentonite used in this study
Property Values Methods
Median particle diameter D50 (μm) 272
Particle size distribution determined using a
Malvern Mastersizer S (Malvern Instruments
Ltd)
Specific gravity 25 Supplier data
Specific surface (m2g) 706 Modified methylene blue European spot
method (Santamarina et al 2002b)
pH (at solids content of 2) 85 Determined from pH measurement using the
Accumet XL50 pH meter (Fisher Scientific)
Isoelectric point (pH) 003
Determined from zeta potential
measurements using a PALS zeta potential
analyzer (Brookhaven Instruments Co)
Cationic exchange capacity
(cmolkg) 808
Ammonia-electrode method (Borden and
Giese 2001)
Table 33 Characteristics of polyacrylamides used in this study
Type Trade Name Structure (Barvenik 1994
Huang et al 2001) Molecular weight
(gmol) a
High molecular
weight N300
~ 6 x 10⁶
Low molecular
weight N300LMW ~ 8 x 10⁴
aMeasured using viscometry method (Brandrup and Immergut 1989 Ravve 2000)
n
CH
NH2
O = C
CH2
36
322 Synthesis of Clay-Polymer Nanocomposites ndash Solution Intercalation
The solution intercalation technique is a CPN synthesizing method in which clay
dispersions and polymer solutions are separately prepared and then mixed together Due to
negative variation in the Gibbs free energy polymer molecules are spontaneously intercalated
into the interlayer space of Mt (Theng 1979 Vaia et al 1993) Thus energy demand is minimal
implying cost efficiency and contributing to the capability of large-scale production for
geotechnical and geoenvironmental applications In addition in-situ production as well as low
health and safety risks can be expected due to the use of water as a solvent
Since Mt intercalation by a polymer molecule is affected by clay content (Shen et al
2002b Perez-Santano et al 2005) polymer concentration (Hwang and Dixon 2000 Shen et al
2002a) polymer molecular weight (Hwang and Dixon 2000 Heinz et al 2007) and pH (Besra
et al 2004 Perez-Santano et al 2005) selected variables investigated in this study using the
solution intercalation technique include clay content polymer molecular weight pH and clay-to-
polymer volume ratio The clay content is defined as the proportion of clay volume with respect
to the total dispersion volume Dispersions were prepared at clay contents of 0001 0005 001
and 003 representing a broad range of clay content in geotechnical and environmental
applications The high molecular weight polymer has MW ~ 6x10⁶ gmol and MW of the low
molecular weight polymer is ~ 8x10⁴ gmol The polymer solution pH was modified to target
acidic (pH asymp 4) neutral (pH asymp 6) and basic (pH asymp 11) conditions The polymer molecule
conformational change results from hydrolysis and reaction on the amino functional group
(Barvenik 1994 Kurenkov 1997 Bruice 2001) Hydrolysis and the amino group reactions
occur very slowly at pH below 9 and below 45 respectively Since the conformational change is
insignificant at pH below 45 the acidic target pH used was pH 4
The clay-to-polymer volume ratio is defined as the proportion of clay volume with
respect to polymer volume and is used to consider both clay content and polymer concentration
37
simultaneously An example calculation for clay-to-polymer volume ratio can be found in
Appendix A A broad range of clay-to-polymer volume ratios were considered in this study
125 2 4 8 125 25 and 625
Clay dispersions were prepared at the specified clay contents by mixing the appropriate
mass of oven-dried clay in deionized water The dispersion was placed on a magnetic stirrer and
stirred for 24 hours to provide enough separation of interlayers ie swelling This step is herein
referred to as the swelling stage
Polymer solutions were prepared according to the designated clay-to-polymer volume
ratio by mixing the appropriate mass of each polymer in deionized water The solution was
stirred for 24 hours The pH of the solution was adjusted to the target pH by using 01M HCl or
01M NaOH buffer solutions After adjusting the pH the polymer solution was mixed thoroughly
with the prepared clay dispersion for 24 hours This step is herein referred to as the mixing stage
During mixing the dispersion was covered to prevent evaporation The mixture of clay and
polymer was then air-dried and pulverized using a pestle and mortar The solution intercalation
process was performed a total of three times per test condition
323 Mixing and Drying Temperatures
Mixing temperature has been reported as a factor affecting changes in basal spacing of
Mt treated with a polymer (Tran et al 2005 Filippi et al 2007) The basal spacing of Mt treated
with poly(acrylic acid) was further expanded at a mixing temperature of 60˚C compared to room
temperature (Tran et al 2005) However analogous information is not available for Mt treated
with polyacrylamide In addition determining the optimum composite synthesis conditions is the
first step in designing future feasibility studies for large-scale production especially in terms of
additional energy consumption In order to investigate the effect of mixing temperature samples
were prepared at clay content of 002 pH 11 and clay-to-polymer volume ratio of 8 These
synthesis conditions were randomly chosen within the boundaries for intercalated structure
38
formation ie clay content lt 003 and clay-to-polymer volume ratio lt 25 The samples were
mixed at room temperature (21 plusmn 2˚C) 60˚C and 85˚C and then air-dried Samples to
investigate the effect of drying temperature (post mixing stage) were prepared at clay content of
001 pH 11 and clay-to-polymer volume ratio of 125 These synthesis conditions were
randomly chosen as above The samples were then dried at 110˚C and room temperature and
then ground into powder form
324 Analysis Techniques
3241 X-ray Diffraction (XRD)
Changes in the basal spacing of the synthesized clay-polymer composites were
characterized using X-ray diffraction (XRD) This technique is most often used to characterize
clay-polymer composites particularly intercalated structures (van Olphen 1977 Koo 2006 Mai
et al 2006) Intercalation of polymer molecules into the clay particle increases the interlayer
spacing resulting in a shift of the diffraction peak towards lower diffraction angle values (2θ lt
7˚)
The pulverized clay-polymer composites ie powder form (approximately 05 g by
weight) were placed in a zero-background holder consisting of a quartz crystal cut polished 6deg of
the c-axis The holder filled with the sample was introduced to the XRD instrument XRD
spectrums for the treated samples were obtained with a Scintag Pad V (Scintag Inc Cupertino
CA) operated at 35 kV voltage and 30 mA current with Cu Kα radiation (λ = 154178 Aring )
Quantitatively analyzing XRD results of clay samples is theoretically possible using Rietveld
XRD quantification (Rietveld 1967 Ufer et al 2008) However quantification of XRD results
for clay-polymer nanocomposites presents its own challenge since particles may not be aligned
and no database on clay-polymer complexes exists In addition the XRD peaks from this study
are low-angle (2θ lt 10˚) This diffraction angle range is not ideal for obtaining reliable
39
diffraction signatures due to distorted reflections (Moore and Reynolds 1997) Therefore for the
purpose of this study it is assumed that particles are oriented in the same direction and the
relative degree of intercalation is compared using XRD intensity data Note that the XRD peak
position for each diffractogram was determined using Jade 9+ software (Materials Data Inc
Livermore CA)
3242 Nuclear Magnetic Resonance (NMR) Spectroscopy
The effects of mineral dissolution at pH 4 and pH 11 were investigated using nuclear
magnetic resonance (NMR) spectroscopy coupled with X-ray diffraction (XRD) NMR spectra
are used to identify the structural and dynamic properties of solids including clay minerals and
clay-based materials (Sanz and Serratosa 2002) NMR spectra provide information on whether
or not layer distortions have occurred XRD patterns provide information on whether or not the
layered structure of the tested clay minerals remains intact Thus XRD patterns as well as solid-
state 29Si 27Al MAS NMR spectra can be used as indicators of the final structure of CPN
High-resolution 29Si 27Al MAS NMR spectra of the sample (approximately 02 g by
weight) in powder form were recorded using a Bruker Avance 300 spectrometer and 5 mm Doty
MAS probes spun at 6 kHz for Si and 15 kHz for Al respectively A 1 μs (π10) pulse with 30 s
delay was used for 29Si and a 1 μs (π10) pulse with 1 s delay was used for 27Al
33 Results and Discussion
The characteristic basal spacings obtained using XRD for the synthesized
nanocomposites are summarized in Table 34 and plotted in Figures 31 and 32 Sample
numbers in Table 34 beginning with CC MW PH and CP indicate the corresponding variables
clay content polymer molecular weight pH and clay-to-polymer volume ratio respectively
Sample numbers beginning with N represent a clay sample without polymer treatment XRD
intensity represented as counts indicates the relative amount of a structure with a particular basal
40
Table 34 Test matrix and resulting basal spacing with XRD intensity
Sample
numbera
Clay
content
Polymer
type
pH of
polymer
solution
Clay-to-
polymer
volume ratio
Basal spacing
(nm)b
XRD intensity
at peak
(counts)
N1 0001 na na na
1227 150
N2 001 1166 160
CC1 0001 nPAM 109 8 1526 225
CC4 0005 nPAM 109 8 1509 280
CC7 001 nPAM 1094 8 1515 200
CC10 003 nPAM 111 8 1215 210
MW1 001 nPAM 1094 125 1527 1211 180 180
MW4 001 NPAM 1096 125 1558 1151 130 115
PH1 001 nPAM 41 8 1515 1289 230 180
PH4 001 nPAM 565 8 1515 1308 210 175
PH7 001 nPAM 1094 8 1515 200
CP1 0001 nPAM 109 125 1557 310
CP4 0001 nPAM 11 2 1541 460
CP7 0001 nPAM 1104 4 1504 400
CP10 001 nPAM 111 8 1515 1289 230 180
CP13 001 nPAM 1094 125 1527 1211 180 180
CP16 001 nPAM 109 25 1108 310
CP19 001 nPAM 1092 625 1164 225 a For clarity iterations under each condition are not tabulated but still found in text or in plots
b All XRD peaks within 2θ below eight degrees (basal spacing greater than approximately 11nm) are
tabulated
spacing (Moore and Reynolds 1997) Thus the intensity corresponding to basal spacings greater
than 145Aring is directly related to the quantity of intercalated structures Results of the mineral
dissolution study are shown in Figures 33 and 34
331 Influence of Mixing and Drying Temperatures
Mixing temperature appeared to have no impact on the formation of intercalated structure when
using the low molecular weight polyacrylamide over the range of temperatures tested (Figure
31) Note that basal spacings larger than 145Aring indicate the formation of intercalated structure
since the height of the PAM monomer is approximately 51Aring (Bruice 2001) For
nanocomposites formed with nPAM (Figure 32-a) and nanocomposites formed with NPAM
41
0
100
200
300
400
Inte
nsi
ty (
cou
nts
)
1479nm1278nm
0
100
200
300
400
Inte
nsi
ty (
cou
nts
)
1495nm1192nm
0
100
200
300
400
2 7 12 17 22 27
Inte
nsi
ty (
cou
nts
)
2θ˚ (CuKα)
1494nm1253nm
Figure 31 Basal spacings for bentonite-nPAM nanocomposites synthesized at (a) 20degC (b)
60degC and (c) 85degC mixing temperatures
(Figure 32-b) drying temperature did not significantly influence intercalation Furthermore the
difference between the second basal spacings (room-temperature vs oven-temperature) was
approximately the size of a water molecule (approximately 2 ~ 34Aring ndash Skipper et al 1995) This
observation was confirmed by comparing these results (Figure 32) with samples of hydrated
clay N1 and N2 (Table 34) which were prepared following the same synthesizing procedures
except without polymer addition The comparison of basal spacings at different drying
(a)
(b)
(c)
42
0
100
200
300
400
Inte
nsi
ty (
cou
nts
)
1527nm1211nm
21plusmn2˚C
0
100
200
300
400
2 7 12 17 22 27
Inte
nsi
ty (
cou
nts
)
2θ˚ (CuKα)
1509nm
1005nm
110˚C
(a)
0
100
200
300
400
Inte
nsi
ty (
cou
nts
)
1558nm1151nm
21plusmn2˚C
0
100
200
300
400
2 7 12 17 22 27
Inte
nsi
ty (
cou
nts
)
2θ˚ (CuKα)
1511nm
1005nm
110˚C
(b)
Figure 32 Basal spacings for bentonite-nPAM nanocomposites synthesized at 20degC and 110degC
drying temperatures with (a) low molecular weight PAM and (b) high molecular weight PAM
43
temperatures indicated that the drying temperature did not influence the intercalation and
confirmed that the clay particle was intercalated by the polymer molecule Thus all remaining
attempts at forming nanocomposites were completed at room temperature for both the mixing and
drying stages
332 Mineral Dissolution
NMR and XRD results to investigate the impact of pH on mineral dissolution are shown
in Figures 33 and 34 Figure 33 presents typical NMR characteristics of Mt Tetrahedral
silicon corresponds to -935 ppm on the Si-NMR spectra and tetrahedral and octahedral
aluminum peak at 58737 and 3917 ppm respectively on the Al-NMR spectra (Kinsey et al
1985) The lack of shifting in the NMR peak positions for nanocomposites synthesized with pH-
adjusted (Figure 33-b and 33-c) and unadjusted (Figure 33-a) polymer solutions indicated that
the acid or base added during the polymer solution pH-adjustment step did not impact mineral
dissolution when the polymer solution was mixed with the clay dispersion This result was
confirmed in the XRD diffractogram which showed that the typical characteristics of Mt
remained for nanocomposites synthesized with pH-adjusted and unadjusted polymer solutions
(Figure 34) Figures 33 and 34 indicate that the amount of mineral dissolution of the CPN due
to exposure to the pH-adjusted solutions (pH asymp 4 and pH asymp 11) did not differ significantly from a
nanocomposite synthesized with unadjusted polymer solution Figure 34 also indicates that
PAM treatment increased the interlayer spacing due to the formation of intercalated structure
44
Figure 33 Si-NMR spectra for clay-polymer nanocomposites synthesized with (a) unadjusted
polymer solution and pH-adjusted polymer solutions (b) pHasymp4 and (c) pHasymp11 Al-NMR spectra
for clay-polymer nanocomposites synthesized with (d) unadjusted polymer solution and pH-
adjusted polymer solutions (e) pHasymp4 and (f) pHasymp11
(c)
(b)
(a)
(f)
(e)
(d)
-935
-1062
3917
58737
45
2 7 12 17 22 27
Rel
ativ
e In
ten
sity
2θ˚ (CuKα)
15 nm
Figure 34 XRD diffractogram for clay-polymer nanocomposites synthesized with (a)
unadjusted polymer solution and pH-adjusted polymer solutions (b) pH 4 and (c) pH 11 M
denotes a typical peak for Mt
333 Nanocomposite Synthesis Optimization
The characteristic basal spacings obtained using XRD for the synthesized
nanocomposites are summarized in Table 34 and plotted in Figures 35 and 36 as a function of
the variables considered in this study
(a)
(b)
(c)
M M
M M
M M
46
0
100
200
300
400
500
0001 001 01
Inte
nsi
ty (
cou
nts
)
Clay content
Figure 35 Impact of clay content on quantity of montmorillonite intercalated with PAM XRD
intensity was obtained from a peak corresponding to basal spacings greater than 145 Aring Error
bars were plotted based on the calculated standard deviation of three measured values
The relationship between clay content and XRD intensity for intercalated structure is
plotted in Figure 35 The clay content was defined as the proportion of clay volume with respect
to the total dispersion volume With respect to clay content intercalated structure occurred at
clay contents of 0001 0005 and 001 but not at clay content of 003 As clay content increased
less intercalated CPN formed Polymer molecules tend to be adsorbed first onto particle surface
due primarily to accessibility thus more clay particles may hinder the interlayer adsorption of
polymer At clay content of 003 no intercalated structure formation implies that the polymer
adsorption takes place on the particle surface first
Intercalated structure occurred in the presence of both low molecular weight PAM and
high molecular weight PAM However the difference in molecular weight led to slight
differences in basal spacing and amount of intercalated structure (Table 34) When all other
nanocomposite synthesis conditions were held constant the low molecular weight PAM
nanocomposites resulted in a higher XRD intensity than the nanocomposite synthesized with high
47
molecular weight PAM The slightly lower quantity of intercalated structures with high
molecular weight PAM is consistent with its larger size This observation is similar to that of
other researchers in that smaller molecules penetrate more easily into interlayer spaces (Aranda
and Ruiz-Hitzky 1992 Hwang and Dixon 2000 Inyang and Bae 2005)
The effect of polymer conformation was insignificant XRD intensity and basal spacing
at all tested pH ranges were nearly constant The polyacrylamide used in this study has extended
conformation at basic pH while it has contracted coil conformation at acidic pH (Figure 25)
Thus PAM molecules were expected to be more easily adsorbed onto the interlayer space at basic
pH leading to more intercalated structure formation than that at acidic pH However the results
indicate that the polymer solution pH did not significantly influence the formation of intercalated
structure One possible reason for this observation is due to pH neutralization during mixing with
clay dispersion Since pH adjustment was performed for the polymer solution only it is very
likely that adjusted pH of polymer solution was neutralized when added to the clay dispersion
(pH not adjusted) diminishing the effect of polymer conformation This was confirmed with pH
values measured after mixing that ranged from pH 75 to pH 9
The formation of intercalated structure tends to increase with decreasing clay-to-polymer
volume ratio (Figure 36) The quantity of intercalated structures was maximized at a clay-to-
polymer volume ratio of 2 Beyond this apparent maximum XRD intensity decreased with
decreasing clay-to-polymer volume ratio At the lowest tested clay-to-polymer volume ratio of
125 the reduction in intensity suggests exfoliation of the clay particles (Wang and Pinnavaia
1994 Alexandre and Dubois 2000 Biswas and Ray 2001) As exfoliated structures form the
XRD intensity corresponding to the quantity of intercalated structures decreases On the other
hand the lowest quantity of intercalated structures corresponded to the clay-to-polymer volume
ratio of 125 These results indicate that the formation of intercalated structure in part is
determined by the applied clay-to-polymer volume ratio
48
0
100
200
300
400
500
1 10 100
Inte
nsi
ty (
coun
ts)
Clay-to-Polymer Volume Ratio
Figure 36 Impact of clay-to-polymer volume ratio on quantity of montmorillonite intercalated
with PAM XRD intensity was obtained from a peak corresponding to basal spacings greater than
145 Aring Error bars were plotted based on calculated standard deviation of three measured values
335 Dominant Factor for Intercalated Structure Formation
Most of the conditions tested here exhibited expanded basal spacing (greater than 145Aring )
which is an indication of the formation of intercalated structure However intercalated structure
indicated by basal spacing gt145Aring was not observed in samples CC10 CP16 and CP19 CC10
sample was synthesized at clay content 003 while CP16 and CP19 were synthesized at clay-to-
polymer volume ratios of 25 and 625 (Table 34) While clay content polymer molecular
weight and clay-to-polymer volume ratio affect the formation of intercalated structure based on
the increase in XRD intensity clay content and clay-to-polymer volume ratio are the most
significant factors tested here Polymer molecular weight and polymer solution pH (in the tested
range) play a less critical role The most significant factor affecting intercalated structure
formation was the clay-to-polymer volume ratio From samples CP16 and CP19 although clay
49
content was expected to form intercalated structures the measured basal spacings did not exceed
145Aring due to the high clay-to-polymer volume ratio (gt 125)
34 Conclusions
The purpose of this study is to develop an optimized procedure for synthesizing clay-
polymer nanocomposites (CPN) using an expansive clay and a pH-responsive polymer for the
goal of creating ldquotunablerdquo nanocomposites Factors such as clay content polymer molecular
weight pH and clay-to-polymer volume ratio that influence the formation of intercalated
structure were investigated The solution intercalation technique was found to be appropriate for
synthesizing CPN using bentonite and polyacrylamide a responsive polymer
When synthesizing CPN the mixing and drying temperatures do not appear to affect the
formation of intercalated structure for nanocomposites of bentonite and polyacrylamide
Synthesizing these nanocomposites at high temperatures provides no advantage over synthesizing
at room temperature In the tested temperature range the solution intercalation technique is
promising for synthesizing bentonite-polyacrylamide nanocomposites with no additional energy
consumption
Nuclear magnetic resonance spectra and X-ray diffraction indicate that the mineral
dissolution due to pH-adjusted polymer solutions is insignificant It is likely that mixing the pH-
adjusted polymer solution with the clay dispersion (not pH-adjusted) results in pH neutralization
Such pH neutralization also affects conformational behavior of polyacrylamide molecules
minimizing the pH effect on the synthesis of intercalated structure
The formation of intercalated structure is maximized by the appropriate clay content
polymer molecular weight and clay-to-polymer volume ratios Intercalation was successful at
clay content below 003 and clay-to-polymer volume ratio below 25 While clay content
polymer molecular weight and clay-to-polymer volume ratio affect the formation of intercalated
50
structure the most significant factor is the clay-to-polymer volume ratio The formation of
intercalated structure is expected only when appropriate clay-to-polymer volume ratio of less than
25 is applied At clay-to-polymer volume ratios below 25 intercalated structure formation
increases with decreasing clay content and polymer molecular weight The quantity of
intercalated material tends to increase with decreasing clay-to-polymer volume ratio and has an
apparent maximum at the ratio of 2 Using low molecular weight polyacrylamide was slightly
more efficient in forming CPN compared to high molecular weight polyacrylamide The smaller
size of the low molecular weight polyacrylamide molecule allows for easier insertion into the
interlayer space of the particle
51
Chapter 4
MANUPULATION OF SYNTHESIZED CLAY-POLYMER
NANOCOMPOSITES
The purpose of this chapter is to investigate the responsiveness or tunability of clay-
polymer composite materials with controllable micro-scale properties such as interlayer and
interparticle spacing and with controllable meso-scale properties including specific surface area
swelling potential and permeability Descriptions of experimental methods and their
interpretation are provided verifying that the micro-scale conformational changes of polymer lead
to meso-scale property changes
41 Introduction
Soils are often modified with the use of polymers or surfactants in the fields of material
science geotechnical and geoenvironmental engineering (Gardner and Arias 2000 Bhardwaj et
al 2007 Story et al 2009 Young et al 2009) Polymer additions alter soil fabric enhancing
engineering properties such as swelling behavior (Hjelmstad 1990 Inyang et al 2007) water
permeability (Young et al 2009) contaminant barrier properties (Inyang and Bae 2005) water
retention (Bhardwaj et al 2007) and material properties such as thermal resistance toughness
and water permeability (Strawhecker and Manias 2006) The use of responsive polymers has an
additional benefit of controllable morphologies Morphologies of pH- ionic strength-
temperature- and electrical potential-responsive polymers are tunable with each environmental
trigger inducing controllable system properties (Bae et al 1990 Feil et al 1992 Wu and Shanks
2003 Kim et al 2006 Xia et al 2006)
Many studies have focused on the investigation of conformation of polymers adsorbed on
a clay mineral surface using ellipsometry nuclear magnetic resonance scanning probe
52
microscopy diffuse reflectance Fourier transform infrared spectroscopy and Monte Carlo
simulation (Bottero et al 1988 Takahashi 1991 Chodanowski and Stoll 2001 Brotherson et
al 2007 Blachier et al 2009) Only a few studies have attempted to characterize polymer
conformation adsorbed in the interlayer space of a clay mineral (Glinel et al 2001) However
conformational behavior of a responsive polymer after adsorption has not been studied since
current experimental technologies limit the ability to characterize the conformation of the
polymer adsorbed on a mobile suspended surface ie clay particle in water Understanding the
conformational behavior of a responsive polymer adsorbed on a surface is critical to predicting
the behavior of tunable CPN
This study utilizes a pH-responsive polymer since the high solubility of a pH-responsive
polymer is advantageous for large-scale production necessary for in-situ engineering applications
pH-responsive polymers may have various conformations as a function of the surrounding fluid
chemistry which could lead to changes in CPN properties Therefore the objective of this
chapter is to link micro-scale conformational behavior of a pH-responsive polymer to meso-scale
properties of CPN Micro-scale tests such as dynamic light scattering and spectroscopic
ellipsometry were used to investigate micro-scale conformational behavior of the pH-responsive
polymer The polymer conformation in a bulk aqueous solution was investigated using dynamic
light scattering Spectroscopic ellipsometry was used to explore the polymer conformation on a
surface Meso-scale tests including specific surface area measurement swelling potential
measurement and hydraulic conductivity tests were conducted to explore meso-scale properties
of CPN corresponding to micro-scale polymer conformations A linkage between the micro-scale
polymer conformation and the meso-scale properties of CPN will be made For example CPN
synthesized using polyacrylamide is expected to have greater interlayer and interparticle spacings
ie open fabric at pH above 11 than that at pH below 10 Thus the swelling potential of the
CPN would be maximized at pH above 11 resulting in minimal permeability
53
42 Materials
421 Clay Minerals
Montmorillonite (Mt) was chosen due to its large swelling capacity which provides the
greatest opportunity for polymer molecule adsorption onto both the particle surface as well as the
interlayer surfaces The clay mineral used in this study was an untreated Mt a dioctahedral
smectite with the chemical formula (NaCa)033(Al167Mg033)Si4O10(OH)2middotnH2O The source of Mt
is a sodium bentonite from American Colloid Company (Arlington Illinois) designated
commercially as AEG powder This bentonite comprises principally of Mt and minor amounts of
feldspar and quartz The chemical composition obtained from the supplier is listed in Table 41
Selected properties of the clay material are given in Table 42 The Mt was oven-dried for 24
hours at 105˚C prior to testing
Kaolinite was also used to investigate effects of interlayer spacing modification
Kaolinite has little swelling potential and cannot easily be intercalated by a polymer while Mt
has a high swelling potential and is easily intercalated by a polymer providing the ability for
interlayer spacing modification Thus only interparticle spacing can be modified in the case of
kaolinite treated with polymer The kaolinite used in this study was an untreated kaolin from
Wilkinson Kaolin Associates LLC (Gordon Georgia) The kaolinite designated commercially as
Wilklay SA-1 is a dioctahedral kaolinite with the chemical formula Al2O3middot2SiO2middot2H2O The
chemical composition is nearly the same as theoretical kaolinite indicating a high level of purity
(Table 41) The kaolinite was converted to a monoionic sodium kaolin using a conversion
method modified after van Olphen (1977) and Palomino and Santamarina (2005) The method
consists of mixing the kaolin in a 2M NaCl solution for 48 hours and a 1M NaCl solution twice
for 24 hours each time After the final salt wash the excess salt is removed by replacing the
supernatant fluid with deionized water until the supernatant conductivity measures less than 100
microScm The converted clay slurry is oven-dried and ground using a pestle and mortar The
54
kaolinite contains small content of illite impurity confirmed by X-ray diffraction (Kim and
Palomino 2009)
Table 41 Chemical composition of clay minerals used in this study
constituent
constituent
Kaolinite
(Supplier Data)
Theoretical kaolinite
(Murray 1991)
Bentonite
(Supplier Data)
SiO2 456 463 6302
Al2O3 384 398 2108
Fe2O3 04 325
FeO 035
TiO2 15
CaO 006 065
MgO trace 267
K2O 018
Na2O trace 257
trace 072
LOI 1382 139 564
Table 42 Properties of clay materials used in this study
Property Kaolinite Bentonite
Median particle diameter D50 (μm) 168a 272b
Specific gravityc 26 25
Specific surfaced (m2g) 4037 70646
pH (at solids content of 2)e 75 85
Isoelectric point (pH)f 23 003
Cationic exchange capacity (cmolkg)g 23 808 a Hydrometer test (ASTM 2003) b Particle size distribution determined using a Malvern Mastersizer S (Malvern Instruments Ltd)
c Supplier data
d Modified methylene blue European spot method (Santamarina et al 2002b) e Determined from pH measurement using the Accumet XL50 pH meter (Fisher Scientific)
f Determined from zeta potential measurements using a PALS zeta potential analyzer (Brookhaven
Instruments Co) g Ammonia-electrode method (Borden and Giese 2001)
55
422 Polyacrylamide
Polyacrylamide (PAM) was chosen because it is responsive to changes in pH
Specifically the conformation (expansion or contraction) of a PAM molecule depends on the
surrounding fluid pH The polymer molecule has a contracted coil conformation at acidic pH and
an extended conformation at basic pH (Michaels 1954 Al-Anazi and Sharma 2002 Besra et al
2004) as shown schematically in Figure 25 PAM is also sensitive to ionic concentration but
this property was not considered in this study Hence ionic concentration was kept constant
For most of the tests the clay minerals were treated with low molecular weight nonionic
PAM (nPAM) In the hydraulic conductivity testing (Section 443) high molecular weight
nonionic PAM (NPAM) and high molecular weight cationic PAM (CPAM) containing 20
cationic quaternary ammonium salt groups were also used to highlight the impacts of polymer
molecular weight and ionic type respectively All three types of PAM were obtained from Cytec
Industries Inc West Paterson NJ Selected characteristics of the polymers are given in Table 43
Table 43 Characteristics of polyacrylamides used in this study
Type Trade Name Structure (Barvenik 1994 Huang
et al 2001) Fraction of
charged units
Molecular
weight (gmol) a
NPAM N300
None ~ 6 x 10⁶
nPAM N300LMW None ~ 8 x 10⁴
CPAM C494
20)(
ba
b ~ 4 x 10⁶
a Measured using viscometry method (Brandrup and Immergut 1989 Ravve 2000)
a
CH
NH2
O = C
CH2
a
CH
NH2
O = C
CH2 CH2
b
CH
N+
O = C
O
(CH2)2
(CH3)3
Cl-
56
Degree of hydrolysis τ = b (a+b) was determined by acid-base titration (Anthony et al 1975)
τ = 1 defines the chemical formula of poly(acrylic acid) The degree of hydrolysis employed in
this study is a statistical quantity thus it does not correlate with the conformation of the polymer
molecule (Michaels 1954)
423 Synthesis of CPN and Microcomposites
Clay-polymer nanocomposites were synthesized through a solution intercalation
technique using bentonite and PAM The clay content and clay-to-polymer volume ratio were
0001 and 2 respectively which were the optimum conditions for the greatest quantity of
intercalated structure (Kim and Palomino 2011) Figure 41 shows scanning electron microscopy
images for bentonite and the synthesized CPN The synthesized CPN was (1) used in gel-form
or (2) air-dried and ground using pestle and mortar ie powder-form Gel-form CPN is the
synthesized CPN prior to air-drying and grinding
Kaolinite-PAM microcomposites were synthesized by mixing kaolinite slurry with PAM
solution for 24 hours The microcomposites were used to highlight affects of interlayer spacing
modification when compared to montmorillonite-PAM composites The concentration of PAM
was 240 mgL ie clay-to-polymer volume ratio = 625 which was the optimum condition for
the formation of microcomposites (Kim and Palomino 2009) Figure 42 shows scanning
electron microscopy images for kaolinite and the synthesized microcomposite Two types of
composites gel-form and powder-form were prepared as above
57
(a) (b)
Figure 41 Scanning electron microscopy images for (a) bentonite and (b) CPN synthesized
using bentonite and PAM
(a) (b)
Figure 42 Scanning electron microscopy images for (a) kaolinite and (b) microcomposite
synthesized using kaolinite and PAM
43 Micro-Scale Characterization
The term ldquomicrordquo used in this study is defined as the level of a clay particle ie lt 2 μm
in length Responsiveness of PAM in terms of conformation was investigated using dynamic
light scattering (DLS) and spectroscopic ellipsometry (SE) Although the polymer is expected to
have a particular conformation in a dilute solution it is not guaranteed that the polymer will have
3 μm 25 μm
5 μm 10 μm
58
the same conformation when adsorbed onto a clay mineral surface since the properties of a
surface play a critical role in the conformational behavior (Michaels 1954 Fleer 1993) Thus it
is important to characterize conformational behavior of the polymer not only in a dilute solution
but also on a clay mineral surface The polymer conformation in a dilute solution was
investigated using DLS while SE was used to explore conformational behavior of the polymer
adsorbed on a clay mineral surface
431 Dynamic Light Scattering
In a dilute solution where a conventional viscometer does not have enough sensitivity
dynamic light scattering (DLS) has been proven to be a powerful method to study the
morphology of clay particles polymer molecules and their complexes (Berne and Pecora 1976
Francois et al 1979 Kulicke et al 1982 Muzny et al 1996 Pignon et al 1996 Peng and Wu
1999 Nelson and Cosgrove 2004 Wu et al 2006 Connal et al 2008) Dynamic light
scattering offers many advantages speed versatility small sample size and measurement time
independent of particle density It is also a non-destructive technique For sub-micron sizes it is
sometimes the only viable technique
If a laser beam falls on a polymer solution and impinges upon the molecular particles the
electrons of the particles are induced to vibrate such that they interfere with the transmission of
light and cause scattering in various directions The fluctuations in the scattered light which are
related to the motion of the particles are measured For a dilute monodispersed suspension of
noninteracting particles the relaxation of the fluctuations (Г) is described by
Dn 2
0
))2
sin(4
(
where n is the refractive index of the suspending liquid λ0 is the wavelength of the laser in
vacuum α is the scattering angle and D is the particle diffusion coefficient For spherical
59
particles the Stokes-Einstein relationship relates the particle diameter d and the diffusion
constant D
Dt
Tkd B
)(3
where kB is the Boltzmannrsquos constant T is the absolute temperature and η(t) is the viscosity of
the liquid in which the particle is moving
A Mt dispersion and an nPAM solution were prepared at clay content of 4x10⁻⁵ and
polymer concentration of 15 mgL respectively The samples were then treated with 01M HCl
and NaOH solutions to reach the target pH (pH 3 6 and 115) DLS was performed using a nano
zeta potential and submicron particle size analyzer Beckman Coulter Delsa 400SX (Brookhaven
Instruments Corporation Holtsville NY) The wavelength of the laser light is 635nm
Measurements were conducted at 25 degC and the scattering angle was set at 90deg DLS was carried
out a total of two times per test condition PAM molecules were expected to have pH-dependent
hydrodynamic radius since PAM expands with increasing pH
10
100
1000
1 3 5 7 9 11 13
Hy
dro
dy
nam
ic R
adiu
s (
nm
)
pH
Mt
nPAM
Figure 43 Hydrodynamic radius of montmorillonite and nPAM as a function of pH
60
Figure 43 shows DLS results for montmorillonite and nPAM as a function of pH The
molecule size of nPAM was affected by pH as expected The hydrodynamic radius increased
with increasing pH The hydrodynamic radius of the polymer at pH 115 is approximately five
times larger than that at pH 3 Since the hydrolysis rate of PAM is theoretically the same at pH
below pH 10 the hydrodynamic radius at pH 6 was expected to be nearly the same as that at pH 3
However it was experimentally found that PAM molecules have slight negative charges even at
neutral pH due to hydrolysis of the amide group into acrylic acid (Kurenkov 1997) Repulsion
forces between negatively charged groups of PAM molecules induced expanded coiled
conformation at pH 6 With increasing pH the expanded coiled nPAM molecules become
extended (pH 115) The hydrodynamic radius of Mt in the dispersion also appeared to be pH-
dependent Since Mt has pH-dependent charges on its surface (Schindler 1981 Mohan and
Fogler 1997) flocculationaggregation the degree and extent of which are a function of pH
occurs leading to pH-dependent particle size
DLS results confirm that PAM is pH-responsive in an aqueous solution However DLS
cannot capture the conformation of PAM in the interlayer space of CPN since DLS does not
provide information on the location of polymer molecules Even if PAM in CPN is still pH-
responsive the pH-dependent behavior of Mt may hinder DLS from characterizing PAM
conformation of CPN
432 Spectroscopic Ellipsometry
In order to investigate the pH-responsiveness of PAM in CPN it has to first be
demonstrated that PAM is still pH-responsive on a surface In this chapter PAM molecules were
adsorbed onto a fixed surface simulating a clay mineral surface After the polymer adsorption
pH-responsiveness of PAM was explored at various pH values using SE The conformational
61
behavior of PAM adsorbed on the simulated surface is expected to be a function of ambient
solution pH
Amorphous SiO2 was used to simulate a clay mineral surface A simulated surface was
used instead of a real clay particle in order to accurately capture adsorbed PAM conformation and
its evolution using SE The complexities associated with utilizing true clay particles in
suspension (mobile suspended surface) with the technique would yield results that are difficult to
interpret Thus a simpler system was devised that would isolate the behavior of interest The
amorphous SiO2 layer used is simply the native oxide of crystalline silicon (c-Si) wafer The
simulated surface was placed at the bottom of a fused silica vessel with windows at 20deg to the
sample surface normal such that the incident light from the ellipsometer passes through the
windows at normal incidence as schematically shown in Figure 44 A polymer solution (1875
mgL) of 150ml was introduced to the vessel the polymer was allowed to adsorb onto the
simulated surface for 2 hours Since it has been reported that the adsorbed amount of PAM on a
silica surface reaches equilibrium within about an hour (Stemme et al 1999) a 2-hour time
period was selected to allow for PAM to be uniformly adsorbed onto the simulated surface
Consequently the adsorption density was same throughout the surface Also the equilibrium
period did not affect capturing time-dependent hydrolysis behavior of PAM since the adsorption
was allowed at neutral pH where the hydrolysis reaction occurs relatively slowly The solution
pH was then adjusted to the selected target value pH 3 6 or 115 Note that the simulated
surface is negatively charged at all tested pH conditions similar to the actual silica tetrahedral
sheet of montmorillonite However the charge density may be different
A model RC2 multichannel ellipsometer fabricated by J A Woollam Co Inc (Lincoln
NE) having a maximum spectral range from 075 to 515 eV and operating on the dual rotating
compensator principle (Chen et al 2004) was used for this study Ellipsometric spectra (in Δ ψ)
are collected at room temperature (20 plusmn 1degC) via real-time spectroscopic ellipsometry (RTSE)
62
Detector
Polarizer
Analyzer
Simulated Surface
Polymer
Layer
Thickness
Subjected to pH change
after polymer placementLaser
Light
Figure 44 Schematic of spectroscopic ellipsometry apparatus
monitoring during sample modification from reflection mode measurements at an oblique angle
of incidence of 70deg The spectral range was limited to 15 to 45 eV due to the absorption of light
by water (H2O)
The complex dielectric function spectra (ε = ε1 + iε2) or alternately the complex index of
refraction (N = n + ik) of the PAM layer and its time-dependent thickness variations were
extracted using a least squares regression analysis and an unweighted error function (Cong et al
1991) to fit the experimental RTSE data using structural models consisting of a semi-infinite c-Si
substrate 17 Aring native SiO2 PAM layer H2O structure For each sample measured ε is
obtained by fitting 10 individual SE measurements selected from the RTSE data to structural
models where the PAM thickness can vary A common parameterization for ε consisting of a
Sellmeier oscillator (Collins and Ferlauto 2005) and a constant additive term to ε1 was used In
this way a representative ε for each film is obtained which can then be used to determine the
PAM thickness for all ellipsometric spectra collected in real-time The underlying native oxide
thickness is determined from a separate measurement of each c-Si wafer in air Reference spectra
in ε for native SiO2 c-Si (Herzinger et al 1998) and H2O (Synowicki et al 2004) were used
Figure 45 shows the real part of (1 = n2 where 2 = 2nk = 0) obtained from RTSE
measurements of the PAM prepared at pH of 3 6 and 115 There appears to be little variation in
63
the PAM due to the pH of the solution and no absorption originating from the PAM is observed
in this spectral range 2= 0 1 for H2O is also shown to highlight the optical contrast present
between it and the PAM Figure 46-a shows the time-dependent PAM thickness for each
solution pH in this series over the span of one day The initial thickness d0 of the PAM layers
are different but range from 290 to 390 Aring The error on all thickness values is 4 Aring Figure 46-
b shows the percentage difference in the thickness for each layer as a function of time
determined by d = (d d0)d0 where d is the PAM thickness at a given time
Figure 45 Real part of the complex dielectric function spectra ( = 1 + i2) for PAM in
solutions with pH = 3 6 and 115 Also shown is 1 for H2O
225
275
325
375
425
0 400 800 1200
Th
ick
nes
s (
Aring)
Time (minutes)
pH asymp 6
pH asymp 3
pH asymp 115
-30
-20
-10
0
10
20
30
0 400 800 1200
Th
ick
nes
s C
han
ge
Δd
d0
()
Time (minutes)
pH asymp 6
pH asymp 3
pH asymp 115
Δd = d - d0
(a) (b)
Figures 46 (a) PAM thickness and (b) change in thickness as functions of time in solutions with
pH = 3 6 and 115
64
It appears that the PAM in the basic solution pH 115 swells by approximately 27 of
its initial value by the end of one day while the PAM in the acidic solutions pH 3 and 6 contract
by 26 and 17 respectively Closer investigation of the time dependent PAM layer thickness
show that the sample in pH 115 appears to initially decrease in the first 15 minutes by 7 then
subsequently increase throughout the remainder of RTSE monitoring The thickness of the PAM
in pH 115 saturates at about 600 minutes (10 hours) PAM in acid decreases monotonically with
time although PAM in the more acidic solution (pH 3) contracts more rapidly The contraction
rate for PAM in the pH 6 solution may be stabilizing after 900 minutes (15 hours) indicating that
a steady state may be reached PAM in the pH 3 solution does not appear to stabilize over the
measurement time
The initial difference in the layer thickness can be explained by a difference in ionic
strength due to the addition of 01M NaOH and HCl solution as a pH modifier The
concentration of Na+ at pH 115 was approximately 0006M while that of Cl- at pH 3 was
approximately 0001M which are large enough to limit expansion of PAM molecules resulting in
contracted coil conformation (Klenina and Lebedeva 1983 Aulich et al 2010 Bittrich et al
2010) Thus PAM in the absence of added ions ie at pH 6 has the maximum initial layer
thickness Assuming that no additional PAM attaches to the surface during this time for the pH
115 solution the PAM is expected to have initially contracted on the SiO2 surface but later
uncoiled resulting in the increased layer thickness After 15 minutes expansion of the PAM
molecules started to offset the initial decrease The PAM in pH 3 and 6 solutions begin
constricted and coiled near the SiO2 surface and continues to contract For the pH 6 case
however the changes in the layer thickness will stabilize over 15 hours while the PAM thickness
for the pH 3 case continues to decrease Since the layer thickness was expected to remain nearly
constant at pH 3 and 6 this unexpected time-dependent phenomenon at those pH values can be
considered with the concept of surface coverage It is well-known that adsorbed polymer layer
65
thickness decreases with increasing surface coverage and high molecular weight polymer
adsorbed on a surface slowly covers the surface (Leermakers et al 1996 Filippova 1998
Samoshina et al 2005) At all tested pH the same behavior of covering the surface occurs to
different degree due to pH-dependent charges on the PAM molecules Since surface coverage
increases with decreasing intermolecular repulsion (Leermakers et al 1996) the surface
coverage at pH 3 is the maximum leading to the minimum polymer layer thickness In theory the
surface coverage at pH 6 should be nearly the same as pH 3 However in reality PAM molecules
usually have slight negative charges at neutral pH caused by a finite degree of hydrolysis of
amide groups into acrylic acid (Kurenkov 1997) such that PAM molecules remain slightly
expanded coiled conformation
These RTSE results on the micro-scale PAM conformations were in reasonable
agreement with theory and previously found experimental results of PAM that PAM
conformation evolves from contracted coiled to extended as pH increases More importantly the
RTSE results confirm that PAM responsiveness to pH is still valid in the presence of a surface
44 Meso-Scale Characterization
The term ldquomesordquo used in this study is defined as the level of a significant number of clay-
polymer interactions ie 2 μm lt meso lt a few cm in length PAM appeared to have pH-
dependent conformational behavior even on a clay mineral surface evidenced by micro-scale
characterizations of PAM conformation at various pH values using dynamic light scattering and
spectroscopic ellipsometry In this section effects of such micro-scale conformational changes
on meso-scale CPN properties were investigated using specific surface area measurement
swelling test and hydraulic conductivity measurement These meso-scale characterizations may
reveal whether the controllable PAM conformation at the micro-scale is valid at the scale of
engineering applications
66
441 Specific Surface Area
Specific surface area is an important property of a clay mineral that determines amount of
accessible sites for polymer adsorption (Theng 1979 Liu and Zhang 2007) Specific surface
area measurements can be used as an indirect indicator of interlayer spacing of a clay mineral as
well as of polymer conformation The conformation of PAM molecules adsorbed onto particles
and interlayer surfaces varies with pH Thus a variation in specific surface area indicates a
change in the interlayer spacing resulting from the changing polymer molecule conformation
Gas adsorption and methylene blue (MB) adsorption are often used to measure specific surface
area Contrary to gas adsorption which utilizes dry samples the MB adsorption technique can be
applied to wet samples which is viable for characterization of tunable CPN synthesized using a
pH-responsive polymer and an expansive clay mineral Hence MB adsorption was used in this
study to measure the specific surface area of the synthesized CPN
The chemical formula of MB is C16H18N3SCl with a molecular weight of 31987 gmol
The thickness of a MB molecule is about 325Aring (Santamarina et al 2002b) Since the interlayer
spacing of Mt is about 22Aring only in the first stage of swelling ie short-range swelling (Theng
1979) MB molecules are readily adsorbed onto the interlayer surface and onto PAM molecules
previously adsorbed on the interlayer surface ie intercalated Therefore interlayer spacing
varying with PAM conformation was investigated through MB specific surface measurements
CPN and microcomposites were synthesized as aforementioned (Section 423) Clay
alone samples were also prepared as a comparison at the same clay content used for each system
The samples were then treated with 01M HCl and NaOH solutions to reach the target pH (pH 3
6 and 115) MB specific surface area measurement was carried out following the modified
European spot method (Kandhal and Parker 1998 Santamarina et al 2002b)
67
Interlayer spacing of clay minerals varying with PAM conformation was investigated
through specific surface area measurements The specific surface area was influenced by pH
(Figure 47) Since kaolinite has pH-dependent charges on its surface (van Olphen 1977 Ma and
Eggleton 1999) pH-dependent specific surface area for pure kaolinite dispersion was expected
Due to protonation and deprotonation the pH-dependent sites become positively charged with
decreasing pH inducing a decrease in MB adsorption (Ghosh and Bhattacharyya 2002) Two
important observations in Figure 47-a are (1) the specific surface area of kaolinite-nPAM
microcomposites is pH-dependent and (2) the extent of the changes in specific surface area of the
microcomposites varying with pH is greater than that of pure kaolinite dispersion This is likely
due to the pH-dependent charges of kaolinite as well as the pH-dependent conformational
behavior of PAM This observation confirms the ellipsometric observation that PAM is still pH-
responsive on a clay mineral surface (Figure 47) Note that the specific surface area of the
microcomposites was smaller than that of pure kaolinite dispersion at all tested pH ranges It was
previously reported that polymer adsorption onto kaolinite decreases specific surface area since
polymer molecules induce flocculationaggregation of clay particles (Nabzar and Pefferkorn
1985)
While Mt theoretically has pH-dependent charges at the particle edges these charges
represent less than 5 of the total surface charge In addition to the particle edges particle faces
were also reported to be pH-dependent representing as much as 20 of the face surface charge
(Schindler 1981 Mohan and Fogler 1997) Due to protonation and deprotonation the pH-
dependent sites become positively charged with decreasing pH and negatively charged with
increasing pH MB molecules are positively charged in aqueous solution and thus are more easily
adsorbed onto the mineral surface with increasing pH (Chen et al 1999 Ghosh and
Bhattacharyya 2002) Such a contribution to the overall surface charge could explain the
apparent increase in specific surface area from pH 3 to pH 115 (Raymahashay 1987)
68
10
20
30
40
50
1 3 5 7 9 11 13
Surf
ace
area
(m
2g
)
pH
Kaolinite
Kaolinite+nPAM
(a)
400
600
800
1000
1200
1 3 5 7 9 11 13
Surf
ace
area
(m
2g
)
pH
Mt+nPAM
Mt
(b)
Figure 47 MB specific surface area of (a) microcomposites and (b) CPN as a function of pH
Clay-to-polymer volume ratio for (a) and (b) was 625 and 2 respectively
69
In contrast to the kaolinite-PAM microcomposites an even greater increase in MB
specific surface area for CPN was observed with increasing pH It is likely attributable to the
difference in clay-to-polymer volume ratio The clay-to-polymer volume ratio for the CPN is
much smaller than that for the microcomposites ie 2 vs 625 Thus polymer molecules became
a dominant factor to determine the specific surface area of the CPN The specific surface area
increased with increasing pH For pure Mt specific surface area increased by approximately 10
from pH 6 to pH 115 while that for CPN increased by approximately 50 in the same pH range
In addition to the pH-dependency of the mineral surface it is also likely that the extended
conformation of PAM at high pH provides more available surface sites for MB adsorption
This result implies that interlayer spacings increase with extended PAM conformation at
basic pH When the polymer conformation becomes extended both the increased interlayer
spacing and the extended polymer molecules allow more MB molecules to be adsorbed onto the
interlayer surface and onto the polymer surface This increases the apparent specific surface area
Nevertheless further testing is required to demonstrate which factor(s) determines the behavior
since clay surface charge MB adsorption and PAM conformation vary simultaneously with pH
Specifically the increase in MB specific surface area at pH 115 is due possibly to (1) negatively
charged clay surfaces (2) negatively charged polymer surfaces (hydrolyzed to COO-) (3)
cationic MB molecules (C16H18N3S+) in water and (4) fully extended conformation of the
polymer
442 Swelling Test
Swelling behavior of clay minerals in the presence of moisture is often a problem in the
development and maintenance of geotechnical and geoenvironmental engineering applications
The swelling behavior depends on factors such as mineral composition grain size aggregate size
cationic exchange capacity chemical composition and concentration of the bulk fluid
70
(Shackelford et al 2000 Ashmawy et al 2002) Polymer treatment was reported to limit
swelling behavior of clay minerals (Inyang et al 2007) Therefore tunable CPN cannot only
limit the swelling behavior but also provide an additional benefit due to its controllable swelling
property For example a tunable CPN synthesized using a pH-responsive polymer and an
expansive clay can be used to filtrate waste water corresponding to its pH such that extremely
high pH or low pH waste water can be separated protecting a natural ecology Thus quantitative
understanding of swelling behavior of tunable CPN is important for engineered soil applications
Comparing swelling behavior of the microcomposites with that of CPN effects of
internal swelling can be investigated As mentioned previously kaolinite has little swelling
potential Thus only the interparticle spacing of PAM-treated kaolinite is affected
(microcomposite as in Figure 26-a) On the other hand polymer intercalation into the interlayer
space of Mt was achieved through a solution intercalation technique leading to nanocomposite
with intercalated structure (Figure 26-b) Kaolinite-PAM microcomposites and CPN were
synthesized as described in Section 423 Swelling ratio was determined by measuring water
absorbency (Vazquez et al 1997 Bajpai and Giri 2003 Mahdavinia et al 2004) The
synthesized composites in dry powder form (1g) was placed into a weighed filter bag and
immersed in 250 ml deionized water The water pH was adjusted to the target pH (pH 3 6 and
115) using 01M HCl or 01M NaOH solution The sample was allowed to hydrate with water at
room temperature At consecutive time intervals the filter bag containing the swollen sample
was allowed to drain by hanging until water drops no longer fell from the sample (~20 minutes)
The bag was then weighed to determine the mass of the swollen gel The swelling ratio was
calculated by dividing the mass of the swollen sample by the mass of the dry sample
71
0
1
2
0 24 48 72
Sw
elli
ng r
ati
o
Time (hour)
pH 115
pH 6
pH 3
(a)
0
5
10
15
0 24 48 72
Sw
elli
ng r
ati
o
Time (hour)
pH 115
pH 6
pH 3
(b)
Figure 48 Swelling ratio of (a) microcomposites and (b) CPN as functions of pH and time The
dashed lines indicate the swelling ratios for the untreated (no polymer) materials
Untreated
Kaolinite
Untreated
Mt
72
The swelling ratio determined by measuring water absorbency is shown in Figure 48
The swelling ratio tends to increase with time at all tested pH until reaching equilibrium but the
magnitude differs significantly After 72 hours the microcomposites and the CPN at pH 115
have swelling ratio of 145 and 129 respectively while those at pH 3 have swelling ratio of
approximately 11 and 38 respectively As expected the PAM hydrolysis rate was greater under
a basic condition (Kheradmand et al 1988 Kurenkov 1997) The measured degree of
hydrolysis for the polymer at pH 115 was 081 which is in good agreement with reported
experimental values of maximum degree of hydrolysis (Kurenkov 1997 Huang et al 2001)
The difference in swelling ratio between samples at pH 3 and 6 was expected to be insignificant
since little ionization occurs at pH below pH 85 ie about 2 units lower than the pKa value
However PAM hydrolysis at neutral pH as well as the addition of 01M HCl solution to adjust
the solution pH may have contributed to the observed difference seen in both the microcomposite
and the CPN
In spite of previously reported results that polymer treatment limits swelling behavior
(Inyang et al 2007) this result implies that conformational changes of PAM adsorbed in the
interlayer space lead to interlayer spacing changes However the magnitude of internal swelling
and external swelling due to PAM conformation change cannot be separated since the surface
characteristics of kaolinite and Mt are different from each other Nevertheless these results
indicate that both interlayer and interparticle spacings can be modified by a pH-responsive
polymer Another important finding from the results is that the swelling property of clay-polymer
composites synthesized with a pH-responsive polymer can be controlled by altering the pH
condition such that the swelling is either less than or greater than that of the untreated material
Note that swelling ratios for untreated clay minerals were obtained from swell index
(ASTM D5890) (2006) The swelling ratio for untreated clay minerals was volumetric ratio of
the soil sample before and after the sample is immersed in deionized water for 72 hours
73
Equilibrium swelling ratios for untreated clay minerals was reached after 24 hours The swelling
ratio for untreated kaolinite was 1 at all tested pH conditions while that for untreated Mt was
117 12 and 115 at pH 3 6 and 115 respectively It was previously reported that Mt swelling
decreased with increasing ionic strength (Herbert et al 2008) Thus the slightly pH-dependent
swelling ratio for pure Mt is likely attributed to increased ionic concentration by adding 01M
HCl or NaOH solution as a pH-modifier Expansion of polymer conformation is also limited by
high ionic strength at highlow pH (Aulich et al 2010 Bittrich et al 2010) Thus the same
effect likely occurred in the swelling ratio measurement for the microcomposites and the CPN
However when comparing the extent of PAM conformation changes the effect of increased ionic
strength was insignificant after equilibrium is reached
443 Hydraulic Conductivity Measurement
Hydraulic conductivity (permeability) which is one of most important characteristics in
the field of geotechnical and geoenvironmental engineering is affected by fabric anisotropy pore
fluid chemistry mineral type including particle size size distribution and chemical composition
internal swelling saturation and compaction method of a soil system (Mitchell 1993) Different
fabric types for kaolinite and Mt lead to different permeability values (Mitchell 1956 Suarez et
al 1984) For example open fabric (eg edge-to-face and edge-to-edge) systems have two
orders of magnitude greater permeability than closed fabric (eg face-to-face and dispersed)
systems Internal swelling of clay soil systems decreases permeability (Jo et al 2001) and can be
limited by treating with a polymer (Inyang et al 2007) Polymer adsorption onto clay particles
occurs at the external surface and internal surface (ie intercalation) altering the fabric type and
the interlayer spacing Thus the effect of fabric type and internal swelling is of concern in this
study
74
Hydraulic conductivity tests were conducted to investigate pH-dependent meso-scale
behavior of kaolinite-PAM microcomposite and CPN materials Permeability of the
microcomposites and the CPN should decrease with increasing pH since PAM extends under high
pH conditions resulting in swelling of the composites Consequently the surrounding pore size
reduces A reduction in the pore size prevents water flow through the system thus decreasing
permeability (Gardner and Arias 2000 Shackelford et al 2000 El-Hajji et al 2001 Jo et al
2001) Effects of sample type polymer molecular weight (MW) and ionic type of polymer were
also investigated Two different sample types ndash gel-form and powder-form ndash were used Three
different PAM ndash low MW nonionic PAM high MW nonionic PAM and high MW cationic PAM
ndash were used
A pressurized permeameter was used for this study The permeability test apparatus
included a confining pressure cell and equipment for supplying a driving pressure greater than
ambient pressure to the sample (Figure 49) This pressurized permeability test (Plaks 2010) was
adopted to minimize the measurement time and preferential flow The permeability cell consists
of a hollow metal cylinder which holds a Tygon tube with an inner diameter of 254 cm Clay-
polymer composites of 23 g were synthesized in either gel-from or powder-form using three
different PAM ie low MW PAM high MW nonionic PAM and high MW cationic PAM Thus
total number of samples was 16 including untreated (no polymer) kaolinite and Mt The
synthesized materials were placed in the Tygon tube and then compacted using a tamping rod
until the packed sample length is 4 cm so the void ratio of the sample is 05 A confining
pressure of 50 lbin2 and a driving pressure of 25 lbin2 were applied though high pressure
permeant lines connected to the permeability cell The permeant solution was pH-adjusted
deionized water The pH was adjusted to pH 3 6 or 115 using 01M HCl or 01M NaOH
solution A test at one pH condition was run until the effluent pH and electrical conductivity
reached equilibrium Effluent pH and electrical conductivity were monitored at consecutive time
75
Pressure
Control PanelGas
Supply
Influent
Solution Reservoir
Driving Pressure
Confining
PressurePermeability
Cell
Effluent
Collector
Figure 49 Schematic of pressurized permeability test apparatus with a picture of permeability
cell
intervals After replacing the influent solution with next target pH another permeability
measurement was conducted on the same sample Once a cycle of permeability tests with four
pH conditions (pH 6 pH 3 pH 6 pH 115) was completed the sample was replaced
Sample calculations for permeability can be found in Appendix B Note that a permeability of
1x10⁻¹⁰ cms was the experimental minimum of the test apparatus
Figure 410 shows the hydraulic conductivity test results for kaolinite-PAM
microcomposites as a function of pH Permeability tends to decrease with increasing pH for all
tested samples Due to pH-dependent surface charges of kaolinite pure kaolinite has a slightly
pH-dependent permeability The pH-dependent surface leads to dispersed fabric at high pH
resulting in low permeability (Mitchell 1956 Santamarina et al 2001 Palomino and
Santamarina 2005) For the microcomposites polymer adsorption induced flocculation or
aggregation of kaolinite particles leading to larger pore sizes in the system Kaolinite-NPAM
microcomposites have the greatest permeability since high molecular weight PAM links more
kaolinite particles leading to larger flocsaggregates ie larger pore size Greater decreases in
76
permeability for the microcomposites with increasing pH than the case of pure kaolinite were
observed (Figure 410-a) Since PAM conformation becomes extended at high pH these
10E-10
10E-08
10E-06
10E-04
1 3 5 7 9 11 13
Per
mea
bil
ity
(cm
s)
pH
Kaolinite+nPAM
Kaolinite+NPAM
Kaolinite+CPAM
Kaolinite
(a)
10E-10
10E-08
10E-06
10E-04
1 3 5 7 9 11 13
Per
mea
bil
ity
(cm
s)
pH
Kaolinite+nPAM
Kaolinite+NPAM
Kaolinite+CPAM
Kaolinite
(b)
Figure 410 Permeability of kaolinite-PAM microcomposites as a function of pH (a) gel-form
and (b) powder-form
77
decreases in permeability were likely due to PAM-induced pore size reduction For kaolinite-
CPAM microcomposites the magnitude of permeability changes with pH differs from other
microcomposites since cationic PAM molecules preferentially link negatively charged kaolinite
particles reducing the expansion of PAM molecules The ion-ion interaction between a kaolinite
particle and a CPAM molecule is even stronger than the ion-dipole interaction between a
kaolinite particle and a nPAMNPAM molecule (Ebnesajjad 2006)
For the microcomposites in powder form (Figure 410-b) permeability decreased to a
lesser degree when treated with PAM This is attributed to mechanical degradation of PAM
molecules when ground (Kulicke et al 1982) Since the air-dried microcomposites were ground
into nearly same sized particles PAM molecules adsorbed on the kaolinite surfaces were trimmed
to nearly same sized chains Thus all three types of kaolnite-PAM microcomposites appear as
having nearly the same permeability at pH 3 and 6 At pH 115 slightly higher permeability of
kaolinite-CPAM microcomposites was observed due to wholely negatively charged kaolinite
surfaces Kaolinite particles become negatively charged on both silica and aluminum sheets at
pH gt 8 since the isoelectric point for the face and edge of kaolinite particle is about pH 79 and
pH 72 respectively (Santamarina et al 2001 Tekin et al 2005)
Figure 411 shows the hydraulic conductivity test results for CPN as a function of pH
Permeability tends to decrease with increasing pH for all tested samples Due to pH-dependent
surface charges of Mt pure Mt has slightly pH-dependent permeability As pH decreases the
particle edges become positively charged while the particle faces still remain negatively charged
inducing electrostatic attraction between the edges and faces ie edge-to-face flocculation
(Lagaly 1989 Mohan and Fogler 1997)
For CPN polymer adsorption induced flocculationaggregation of Mt particles leads to
larger pore sizes in the system Mt-nPAM nanocomposites have the greatest permeability which
is different from the case of kaolinite-PAM microcomposites This implies that internal swelling
78
10E-10
10E-08
10E-06
10E-04
1 3 5 7 9 11 13
Per
mea
bilit
y (
cms
)
pH
Mt+nPAM
Mt+NPAM
Mt+CPAM
Mt
(a)
10E-10
10E-08
10E-06
10E-04
1 3 5 7 9 11 13
Per
mea
bilit
y (
cms
)
pH
Mt+nPAM
Mt+NPAM
Mt+CPAM
Mt
(b)
Figure 411 Permeability of CPN as a function of pH (a) gel-form and (b) powder-form
as well as fabric type plays a significant role in permeability nPAM was found to be most
readily intercalated into the interlayer space of Mt thus Mt-nPAM nanocomposites are likely to
79
have the greatest ability for permeability modification by pH changes Greater decreases in
permeability for CPN with increasing pH than the case of pure Mt were observed (Figure 411-a)
Since PAM conformation becomes extended at high pH the greater decreases in permeability
were likely due to PAM-induced pore size reduction For Mt-CPAM nanocomposites the
different magnitudes of the pH-dependent permeability changes from other CPN is because
cationic PAM molecules preferentially link negatively charged Mt particles hindering an
expansion of PAM molecules
For the CPN in powder form (Figure 411-b) permeability decreased to a lesser degree
All three types of CPN appeared to have nearly the same permeability at pH 3 and 6 Like to the
microcomposites this is attributed to mechanical degradation of PAM molecules when ground
(Kulicke et al 1982) At pH 115 higher permeability of Mt-CPAM nanocomposites was due to
the higher affinity of cationic PAM molecules to the negatively charged Mt surfaces
45 Linkage of Micro-Scale Behavior to Meso-Scale Property
It was observed that the micro-scale polymer conformation influenced meso-scale CPN
properties including specific surface area swelling potential and permeability From the
evidence of DLS and SE measurements the coiled polymer conformation at pH 3 becomes
expanded coiled at pH 6 and further extended with increasing pH (pH 115) Meso-scale CPN
properties were affected by the pH-dependent PAM conformation Specific surface area
increased with extended conformation of PAM while it decreased with coiled conformation of
PAM Swelling potential also increased with increasing pH ie extended conformation of PAM
The increase in swelling potential of CPN induced a decrease in pore size in the CPN system
resulting in decreased permeability
In comparing hydrodynamic radius measurements obtained from DLS to adsorbed PAM
layer thickness measurements obtained from SE a qualitative agreement was found that both
80
hydrodynamic radius and adsorbed PAM layer thickness increase with increasing pH (Figure
412) According to scaling law theory (de Gennes 1987) the maximum possible hydrodynamic
thickness for PAM is 12181 nm assuming one layer adsorption of PAM on the surface However
the adsorbed thickness at pH 115 was approximately 375 nm Such a discrepancy may result
from many factors affecting the polymer comformation including ionic strength due to the
addition of pH modifiers crosslinking effect and intra-interactions of the polymer and
interactions between polymers and surfaces (Klenina and Lebedeva 1983 de Gennes 1987
Askadskii 1990 Fleer 1993 Lee et al 1999 Wu et al 2001 Aulich et al 2010 Bittrich et al
2010) Note that the scaling law theory does not provide any insight into the conformation of the
polymer adsorbed on a surface (Campbell et al 2002) The same discrepancy was observed
when comparing conformational behavior of the polymer at two different scales ie adsorbed
PAM layer thickness vs swelling ratio (Figure 413) However a qualitative agreement was
found between the adsorbed PAM layer thickness and the swelling ratio
0
10
20
30
40
0
20
40
60
80
100
1 3 5 7 9 11 13
Ad
sorb
ed P
AM
Lay
er T
hic
kn
ess
(nm
)
Hy
dro
dy
nam
ic R
adiu
s (n
m)
Solution pH
Hydrodynamic radius of PAM
Adsorbed PAM layer thickness
Figure 412 Behavior comparison between hydrodynamic radius and adsorbed layer thickness of
PAM Hydrodynamic radius was measured using dynamic light scattering and adsorbed PAM
layer thickness was obtained from spectroscopic ellipsometry
81
0
5
10
15
0
10
20
30
40
1 3 5 7 9 11 13
Sw
elling
R
atio
Ad
sorb
ed P
AM
Lay
er T
hic
knes
s (n
m)
Solution pH
Adsorbed PAM layer thickness
Swelling ratio
Figure 413 Behavior comparison between adsorbed PAM layer thickness and swelling ratio
Adsorbed PAM layer thickness was obtained from spectroscopic ellipsometry and swelling ratio
was measured using water absorbency tests
The extent of conformation changes was likely to be affected by the presence of a clay
surface Based on DLS results PAM layer thickness should increase by approximately 100
from pH 6 to pH 115 However the layer thickness of PAM adsorbed on a surface increased by
approximately 20 (Figure 412) Similar phenomenon was also observed for PAM sandwiched
in between two surfaces (Figure 47) Based on the surface area of a PAM molecule calculated
using hydrodynamic radius the surface area of a PAM molecule increases by approximately
500 from pH 6 to pH 115 in a bulk aqueous solution However surface area contribution of
PAM molecules to the increase in CPN specific surface area was approximately 50 Thus the
conformational behavior of PAM was further limited when it is adsorbed in between two surfaces
These phenomena can be explained by the previously reported observation that the logarithmic
value of the acid dissociation constant pKa inside a polymer molecule is different from the pKa
value near a surface (Dong et al 2009) Possible reasons for this gradient include minimization
82
of the systemsrsquo free energy and inhomogeneous polymer volume distribution or the formation of
a double layer at the polymer-solution interface reducing the ion transport into the polymer
molecule (Uhlik et al 2004 Gong et al 2007)
Yet a quantitative linkage between the micro-scale PAM conformation and the meso-
scale properties cannot be made due to (1) many factors affecting the behavior simultaneously
and (2) experimental limitations of characterizing the location of polymer molecules in CPN ndash
either in the interlayer spacing or on the particle surface Computer simulation providing a
molecular level understanding of the mechanisms responsible for the behavior of clay-polymer
systems can be an alternative to capture the PAM behavior in the interlayer spacing of CPN
Such a technique is expected not only to complement experimental results with a detailed micro
level picture of the relevant phenomena but also to illuminate systems inaccessible via current
experimental methods
46 Conclusions
In this chapter micro-scale conformational behavior of a pH-responsive polymer was
qualitatively linked to meso-scale properties of clay-polymer nanocomposites (CPN) including
specific surface area swelling potential and permeability The micro-scale polymer
conformation studied by dynamic light scattering (DLS) and real-time spectroscopic ellipsometry
(RTSE) was in a reasonable agreement with the measured specific surface area swelling potential
and permeability of the CPN
The conformation of polyacrylamide (PAM) in an aqueous solution varied with pH from
coiled (pH 3) to extended (pH 115) Corresponding to the conformational changes layer
thickness of PAM adsorbed on a surface meso-scale properties of the synthesized clay-polymer
composites including specific surface area swelling potential and permeability were modified by
altering the pH condition The layer thickness specific surface area and swelling potential
83
increased significantly with increasing pH corresponding to the extended conformation of PAM
at basic pH The increase in swelling potential reduced the pore size leading to a decrease in
permeability In the presence of a surface the conformational changes were limited However a
quantitative linkage was not made due to experimental limitations and complex pH-dependencies
of clay surface charge and PAM conformation
Nevertheless the effectiveness of the use of a pH-responsive polymer has been
established in this chapter Understanding the kinetics of PAM conformational behavior on a
simulated surface verified by specific surface area swelling potential measurements and
permeability tests on real CPN will assist in developing strategies for designing CPN with tunable
engineering properties
84
Chapter 5
COMPUTER SIMULATION
The purpose of this chapter is to computationally investigate responsiveness or tunability
of clay-polymer nanocomposites (CPN) with controllable micro-scale interlayer and interparticle
spacing since quantification is limited with current experimental techniques The quantitatively
found computer simulation results will be linked to an experimentally measured property of the
CPN Descriptions of computational procedures and their interpretation are provided
quantitatively verifying that the micro-scale conformational changes of polymer lead to meso-
scale property changes
51 Introduction
In spite of the considerable number of studies of CPN clay intercalation by polymer is
not yet fully understood Due to many factors affecting the process and difficulties of developing
tools capable of monitoring the process quantifying final morphology and properties of the final
CPN is very challenging In addition nearly amorphous characteristics of clay minerals and the
interactions responsible for meso-scale properties occurring at the length scales of monomers
approximately a billionth of a meter limit probing with current experimental techniques
Understanding the conformational behavior of a responsive polymer adsorbed on a surface is
critical to predicting the behavior of tunable CPN Thus computer simulation may play an ever-
increasing role in designing and predicting material properties and designing such experimental
work
Computer simulation can provide insight into the molecular level understanding of the
mechanisms responsible for the behavior of clay-polymer systems All forces and interactions
occurring at the micro-level can be simulated through mathematical equations Such a technique
not only complements experimental results with a detailed atomistic level picture of the relevant
85
phenomena but also illuminates systems unaccessible via experimental methods Computer
simulation of clays and polymers based on theories and computational methods have long been
used to study and understand their complex behavior (Chang et al 1995 Skipper et al 1995
Boek et al 1996 Groot and Warren 1997 Sposito et al 1999 Balazs et al 2000 Bourg et al
2003 Cygan et al 2004b Pandey et al 2005 Sutton and Sposito 2006 Suter et al 2009) The
purpose of this study is to investigate pH-dependent conformational behavior of a polyacrylamide
(PAM) in an aqueous solution and to link the micro-scale conformational changes to a meso-scale
CPN property Dissipative particle dynamics (DPD) a coarse-grained atomistic computer
simulation technique was used to simulate micro-scale CPN behavior Three different conditions
were simulated (1) polymer in an aqueous solution (2) polymer adsorbed on a clay layer surface
and (3) polymer sandwiched between two clay layers An attempt was made to link the
composite response predicted with DPD to the experimentally measured CPN properties under
similar pH conditions
52 Mapping of Length- and Time Scales
In a DPD simulation it is necessary to map physical length and time scales with reduced
units in order to match the simulated system behavior with actual system conditions Groot and
co-authors (Groot and Warren 1997 Groot and Rabone 2001) report that the distance beyond
which all forces become zero the so-called cutoff radius is always unity Thus when
representing more than a single water molecule with a single DPD bead Groot et alrsquos
parameterization often fails For example an increase in the repulsion parameter led to freezing
of a DPD liquid This represents an upper limit of coarse-graining (CG) (Pivkin and Karniadakis
2006) An alternative CG method was developed such that the cutoff radius can be adjusted
(Fuchslin et al 2009) This method prescribes enlarging the interaction radius of DPD beads
while decreasing the number of DPD beads in a system Using this method a simple monomeric
86
DPD system with a CG level of up to 125 was simulated without changing the pressure or mass
density of the system This alternative method of coarse-graining was adopted for this study
The scaling relations for the CG level number mass and cutoff radius of DPD beads DPD force
constants and energy and time units are listed in Table 51
The density and the number of atoms to be coarse-grained into a DPD bead influence the
mapping between physical and reduced length- and time scales In this study =1 represents a
system in which one water molecule is coarse-grained into a DPD bead Thus simulation
parameters for =1 are rc=1 m=1 α=25 γ=45 σ=3 and ε=1 (Groot and Warren 1997) These
parameters imply that each DPD bead has a volume equal to the volume of a water molecule (asymp
30 Aring 3) hence rc = 4481 Aring at mass density ρ=3 (Groot 2003) These parameters are scaled
according to the described scaling relations for other coarse-graining levels For example for
=12 simulation parameters should be rc=12 m=12 α=131037 γ=23587 σ=23792 and ε=12
Table 51 Scaling relations used in this study (Fuchslin et al 2009)
Scaling ratio = 1 Scaling ratio =
Total number of DPD beads N -1 N
Mass m m
Cutoff radius rc 1d rc
Force constant α 1-1d α
Friction coefficient γ 1-1d γ
Noise amplitude σ 1-1(2d) σ
Energy unit ε ε
Time unit τ 1d τ
d is the number of dimensions of the system
87
53 Polyacrylamide in an Aqueous Solution
The first step in this study was to investigate the polymer conformation with various
charge fractions in an aqueous solution The DPD method has been successfully used to simulate
the conformation of charged polymers (Gonzalez-Melchor et al 2006) Gonzalez-Melchor et al
found that the root mean square radius of gyration which represents the morphology of polymer
molecules increases with increasing charge fraction on the polymer chain in an aqueous solution
Thus the root mean square radius of gyration was used to monitor the conformation of the
polymer with eight different charge fractions 0 01 0143 02 025 033 05 and 08 The
charge fraction was defined as the number of charged beads with respect to the total number of
beads composing the polymer molecule Hence the difference in charge fraction was simulated
by increasing the number of charged beads on a polymer chain The maximum charge fraction
was set to 08 since the maximum degree of hydrolysis of polyacrylamide is 80 (Kurenkov
1997 Huang et al 2001) In order to remove the effect of ionic strength which has been reported
to influence polymer conformation (Fleer 1993) the ionic concentration was kept at zero by not
adding any salts beads
The system considered here includes a long chain of polymer molecules with charges
counterions and water molecules Each of these components was modeled explicitly A cubic
simulation box of size 50 x 50 x 50 in DPD length units was employed The DPD parameters
used in this study are found in Tables 52 and 53 The overall mass density of the system was
held constant at ρm = 3 For a system with 1 the force constant between like beads was
determined as αii = 75ρm (Groot and Warren 1997) The force constant between unlike beads
αij was determined as (Groot 2000)
αij = αii + 3268middotχij
where αii is the force constant between like beads and χij is the Flory-Huggins parameter which is
048plusmn001 for the given polymer in water at 30degC (Huang et al 2001) The force constant was
88
Table 52 DPD parameters used in this study
= 1 = 12
Mass 1 12
Mass density 3 3
Number density 3 025
Cutoff radius 1 2289
γ 45 23587
σ 3 23792
ε 1 12
τ 1 2289
Table 53 Force constants α used in this study
water
Non-
charged
PAM
Charged
PAM
Non-
charged
clay
Charged
Clay Counterion
water 13104 13261 10483 13261 4717 13104
Non-charged
PAM 13104 13104 4717 1048 13261
Charged PAM 13104 1048 13261 13261
Non-charged
clay 13104 13104 13261
Charged Clay 13104 13261
Counterion 13104
also calculated based on the solvency of each component as (Kong et al 1997 Gibson et al
1998)
αij = αii (1 + ζ)
89
where ζ is the solvency of the solvent The theta-solvent condition (random coil conformation)
occurs at ζ=0 The solvency between water and polyacrylamide was set to -002 to reflect the
water-soluble nature of the polymer (Gibson et al 1998)
DPD parameters for a system with 12 were calculated according to Fuchslinrsquos scaling
relations shown as above (Fuchslin et al 2009) This scaling ratio was selected in the
consideration of efficiency and accuracy At this scaling ratio a 236-bead polymer corresponds
to mapping polyacrylamide (PAM) with molecular weight Mw=80000
A constant time step of Δt = 004 was used so that the investigation of the equations of
motion remained stable and the average temperature of the system did not exceed a system
temperature plusmn2 All simulations were performed using the LAMMPS molecular dynamics
simulator (Plimpton 1995) A simulation was run for 500000 time steps to reach equilibrium
followed by another 500000 time steps to calculate average properties of the system
One polyacrylamide molecule in water was simulated at eight different charge fractions
The main result of this type of simulation is the root mean square radius of gyration ltRg2gt12 of
the polymer in the solution as a function of charge fraction The radius of gyration is a key
property that varies with polymer conformation which has been studied both theoretically and
experimentally (Francois et al 1979 Medjahdi et al 1990 Stigter and Dill 1995 Griffiths et
al 2004) The root mean square radius of gyration was calculated by
i
cmiig rrmM
R 2212)(
1
where M is the total mass of polymer molecule mi and ri are the mass and position of ith
monomer and rcm is the center-of-mass position of the molecule Since the conformation of
polyacrylamide varies with pH the radius of gyration should also vary with pH pH of the
simulated solution was calculated with the Henderson-Hasselbalch equation (Katchalsky and
Spitnik 1947)
90
3
4
5
0 025 05 075 1
ltR
g2gt
12
Charge Density
(a)
3
4
5
5 7 9 11 13
ltR
g2gt
12
pH
(b)
Figure 51 ltRg2gt12 of the simulated polymer in water as a function of (a) charge fraction and (b)
pH
91
apKc
cpH
)
1(log10
where c is charge density and pKa is the logarithmic value of the acid dissociation ndash acidity ndash
constant (108 for polyacrylamide) Simulated root mean square radius of gyration results of the
polymer are shown in Figure 51
Figure 51-a shows the results for the root mean square radius of gyration as a function of
charge density The trend is in good agreement with experimental results (Stigter and Dill 1995)
Figure 51-b shows the pH-dependent root mean square radius of gyration The radius of gyration
abruptly changed around the pH value of the polymerrsquos pKa which qualitatively corresponds to
experimental results (Griffiths et al 2004) Note that pH values of 1 and 14 correspond
theoretically to the fully coiled and fully extended polymer conformation respectively (Stigter
and Dill 1995) In order to confirm that the apparent increase in the root mean square radius of
gyration between charge density 025 and 033 plots of ltRg2gt12 vs simulation time intervals are
displayed in Figure 52 Figure 52 also demonstrates that the used time step of 500000 for
equilibrium was appropriate for the studied system
35
45
55
0 5 10 15
ltR
g2gt
12
Time (μs)
35
45
55
0 5 10 15
ltR
g2gt
12
Time (μs)
(a) (b)
Figure 52 ltRg2gt12 vs simulation time for PAM with charge density of (a) 025 and (b) 033
92
54 Polyacrylamide Adsorbed on a Clay Particle
After investigating the conformational behavior of the polymer in an aqueous solution
the conformation of adsorbed polymer on a clay particle was explored using the DPD method A
polymer molecule and a clay layer were placed in a cubic simulation box of size 50 x 50 x 50 in
DPD length units The clay layer was tethered at the bottom of the simulation box (z=1) by a stiff
harmonic spring A system containing the polymer molecule with no charges and the clay layer
were simulated for 500000 time steps allowing adsorption of the polymer molecule onto the clay
layer surface Another 500000 time steps were run at each selected polymer charge fraction to
collect average properties of the system Z-coordination and root mean square radius of gyration
of the polymer were monitored In order to isolate the conformational behavior of PAM the clay
surface charge density was fixed at 02 which is a typical charge fraction for a montmorillonite
(Mt) surface
The z-coordination and root mean square radius of gyration of a PAM molecule as well
as the conformational behavior of the PAM molecule adsorbed on a clay surface were
investigated Simulated results of root mean square radius of gyration of the polymer and the
polymer layer thickness ie averaged z-coordination of the polymer are shown in Figure 53
Figure 53-a shows the results for the root mean square radius of gyration as a function of
charge density The trend is in good agreement with that for the polymer in an aqueous solution
(Figure 51-a) However there appear to be slight differences between this case and the polymer
molecule in solution alone The difference may be attributed to the interactions between the
surface and the polymer which induced a bulk pKa value inside the polymer molecule different
from the pKa value near the surface (Uhlik et al 2004 Gong et al 2007 Dong et al 2009) At
pH 85~10 the expected force on the polymer molecule is repulsion so that the conformation is
expanded-coiled At pH gt 10 the expected repulsive force on the polymer molecule further
increases and the corresponding conformation also increases leading to the maximum polymer
93
3
4
5
0 025 05 075 1
ltR
g2gt
12
Charge Density
(a)
0
10
20
30
40
50
5 7 9 11 13
Poly
mer
Lay
er T
hic
knes
s
pH
(b)
Figure 53 (a) ltRg2gt12 of the simulated polymer adsorbed on a clay surface and (b) the polymer
layer thickness as a function of pH
94
(a) (b) (c)
(d) (e) (f)
(g) (h) (i)
Figure 54 Trajectories of the polymer and the clay surface (a) initial configuration and final
configurations with charge density of (b) 00 (c) 01 (d) 0143 (e) 02 (f) 025 (g) 033 (h)
05 and (i) 08 Cyan red yellow and black beads denote neutral monomer charged monomer
neutral clay and charged clay
95
layer thickness The adsorbed polymer layer thickness also varies with solution pH (Figure 53-
b) The results shown in Figure 53-b confirm that PAM molecules remain pH-responsive when
adsorbed on a clay surface Figure 54 graphically shows that the polymer layer thickness varied
according to conformational changes of the polymer due to different charge densities The
polymer layer thickness increases near the pKa value of the polymer
55 Interlayer Spacing Manipulation
Interlayer spacing between two clay layers was monitored with varying polymer charge
fraction A polymer molecule and two clay layers were placed in a cubic simulation box of size
50 x 50 x 50 in DPD length units One clay layer was tethered at the bottom of the simulation
box (z=1) by a stiff harmonic spring and the other clay layer was placed at z=10 so that the initial
interlayer spacing was approximately 40Aring which is the experimental maximum interlayer
spacing of montmorillonite (van Olphen 1977) A system containing the polymer molecule with
no charges was sandwiched between the clay layers and simulated for 500000 time steps
allowing adsorption of the polymer molecule onto the two clay layer surfaces Another 500000
time steps were run at each polymer charge fraction to collect average properties of the system
The z-coordination of the top clay layer and root mean square radius of gyration of the polymer
were monitored The clay surface charge density was fixed at 02 The effect of clay-to-polymer
volume ratio was also simulated by increasing the number of polymer molecules One and two
polymer molecules represent clay-to-polymer volume ratio of 4 and 2 respectively
Z-coordination of the top clay layer and root mean square radius of gyration of the
polymer were monitored to investigate interlayer spacing manipulation Interlayer spacing was
calculated by averaging the z-coordination of the top clay layer Simulated results of the root
mean square radius of gyration of the polymer and the interlayer spacing are shown in Figure 55
96
3
4
5
0 025 05 075 1
ltR
g2gt
12
Charge Density
(a)
0
10
20
30
40
50
5 7 9 11 13
Inte
rlay
er S
pac
ing
pH
(b)
Figure 55 (a) ltRg2gt12 of the simulated polymer sandwiched between two clay layers and (b) the
interlayer spacing as a function of pH at clay-to-polymer volume ratio 4
Figure 55-a shows results for root mean square radius of gyration as a function of charge
density The trend is in good agreement with that for the polymer in an aqueous solution (Figure
97
51-a) while a slight difference appeared due to the presence of two clay layer surfaces Interlayer
spacing tends to increase with pH (Figure 55-b) showing the tunability of the clay-polymer
nanocomposites The polymer layer thickness with only one clay layer surface (Figure 53-b) was
greater than the case with two clay layers In other words the polymer layer thickness ie
interlayer spacing decreased with the two clay layer surfaces Interactions between the surfaces
and the polymer induced a difference in the pKa value between inside the polymer molecule and
near the surface (Uhlik et al 2004 Gong et al 2007 Dong et al 2009) The extent of the
difference in pKa value further increased with the two clay layer surfaces Figure 56 graphically
shows final trajectories of the polymer and the clay layers The interlayer spacing varied
according to conformational changes of the polymer due to different charge densities An abrupt
change occurs in the interlayer spacing near the pKa value of the polymer ie charge density 05
(Figure 56-h)
98
(a) (b) (c)
(d) (e) (f)
(g) (h) (i)
Figure 56 Trajectories of the polymer and the clay surfaces at clay-to-polymer volume ratio 4
(a) initial configuration containing two clay surfaces a PAM molecule and water and final
configurations with charge density of (b) 00 (c) 01 (d) 0143 (e) 02 (f) 025 (g) 033 (h)
05 and (i) 08 Cyan red yellow and black beads denote neutral monomer charged monomer
neutral clay and charged clay
99
Clay-to-polymer volume ratio has been reported to be a critical factor for the intercalated
structure formation (Kim and Palomino 2011) The quantity of intercalated structure increases
with decreasing clay-to-polymer volume ratio enhancing the ability for further modification
Effects of clay-to-polymer volume ratio were investigated with clay-to-polymer volume ratios of
2 and 4 Simulated results of the root mean square radius of gyration of the polymer and the
interlayer spacing at clay-to-polymer volume ratio 2 are shown in Figure 57 The trend is nearly
the same as at clay-to-polymer volume ratio 4 However an increase in the interlayer spacing
was observed at charge density greater than 033 It is well-known that crosslinking polymer
molecules affects polymer conformation in dilute solutions (Askadskii 1990 Fleer 1993 Lee et
al 1999 Wu et al 2001) Thus the observation is likely due to the relative increase in the
number of polymer molecules At high charge density the repulsion forces generated by two
polymer molecules ndash clay-to-polymer volume ratio 2 ndash are greater than those with one polymer
molecule ndash clay-to-polymer volume ratio 4 ndash such that the interlayer spacing further increased
This phenomenon is in good agreement with previously reported experimental results and that
the potential for further modification increases with decreasing clay-to-polymer volume ratio
(Kim and Palomino 2011)
100
1
2
3
4
5
6
0 025 05 075 1
ltR
g2gt
12
Charge Density
(a)
0
10
20
30
40
50
5 7 9 11 13
Inte
rlay
er S
pac
ing
pH
(b)
Figure 57 (a) ltRg2gt12 of the simulated polymer sandwiched between two clay layers and (b)
the interlayer spacing as a function of pH at clay-to-polymer volume ratio 2
101
56 Linkage of Micro-Scale Behavior to Meso-Scale Property
It was quantitatively found that PAM conformation becomes extended with increasing
pH inducing an increase in the interlayer spacing of a clay mineral However this result for one
PAM-molecule system cannot be quantitatively linked to the experimental findings described in
Chapter 4 since in reality it is difficult to test with one PAM molecule For example 17x1014
PAM molecules are theoretically contained even at a very small concentration of PAM (eg 15
ml of 15 mgL PAM solution which was used in the DLS tests) In addition crosslinking
polymer molecules affects polymer conformation in dilute solutions (Askadskii 1990 Fleer
1993 Lee et al 1999 Wu et al 2001) Hence a quantitative linkage between computer
simulation results and experimental results often fail Yet it is still worth attempting to
qualitatively link the computational results to the experimental findings
In addition to the measurement conducted in Chapter 442 the same test was carried out
at five different pH values to match with simulated pH intervals The additionally tested pH
values were pH 112 108 102 84 and 38 Results of swelling ratio at 72 hours as well as the
simulated interlayer spacing are presented in Figure 58 The simulated results of interlayer
spacing is in a good qualitative agreement with the experimental swelling ratio In other words
PAM conformation changes to extended with increasing pH However a significant change in
the swelling ratio occurs around pH 113 On the other hand the simulated results show that such
a significant change in the interlayer spacing occurs near the pKa value of the polymer (ie pH
108) This is attributed to not only the change in the pKa value of the polymer near the surface
but also the lowered pH value near the surface (Michaels and Morelos 1955 Uhlik et al 2004
Gong et al 2007 Dong et al 2009)
102
0
10
20
30
40
50
0
5
10
15
1 3 5 7 9 11 13
Sim
ula
ted
Inte
rlay
er
Spac
ing
Sw
elling R
atio
Solution pH
Swelling ratio
Simulated interlayer spacing
Figure 58 Swelling ratio and simulated interlayer spacing for CPN as a function of solution pH
Diamond and square symbols denote the swelling ratio and the simulated interlayer spacing
respectively The CPN was synthesized at clay-to-polymer volume ratio 2
Contrary to the observations from DPD simulations of the interlayer spacing that the
PAM conformations were nearly the same at pH below 8 the swelling ratio significantly
increased from pH 3 to pH 84 This phenomenon may be attributed to the nature of Mt and
PAM The charge fraction for the simulated clay surfaces was fixed at 02 (pH-independent) to
isolate the conformational behavior of PAM while natural Mt has pH-dependent charges on its
surface The results of specific surface area and permeability for Mt confirm the pH-dependent
behavior of Mt (Figures 43 and 45) In addition PAM molecules usually have slight negative
charges at neutral pH caused by a finite degree of hydrolysis of amide groups into acrylic acid
(Kurenkov 1997) Thus it is likely that the combination of those mechanisms induced a
significant change in swelling ratio from pH 3 to pH 84
DPD simulations and physical experiments are mutually supportive Experimental
limitations precluded obtaining a permeability measurement for CPN at pH 115 as the
103
permeability was too low to measure However DPD simulation results provide insight into the
permeability at pH 115 The expected permeability would further decrease due to more extended
interlayer spacing (Figure 55-b) On the other hand a system is often simplified for the
efficiency of computer simulation so some characteristics are not captured In this study the use
of simplified clay surfaces and polymer molecules did not capture pH-dependent behavior of Mt
and the hydrolysis behavior of PAM at neutral pH
57 Conclusions
In this study the coarse-grained atomistic computer simulation technique of dissipative
particle dynamics was used to quantitatively explore the effect of micro-scale pH-responsive
polymer conformation on the interlayer spacing of clay-polymer nanocomposites (CPN)
Polyacrylamide (PAM) and montmorillonite (Mt) surface were modeled as a bead and harmonic
spring The pH-responsiveness of the polymer was simulated by using various charge fractions
The polymer conformation became extended with increasing pH The same trend was observed
with clay surfaces to a lesser degree A quantitative relationship between the PAM conformation
and the interlayer spacing of the simulated clay was found for a system containing one PAM
molecule sandwiched in between two Mt layers
Swelling ratio was measured to link the micro-scale PAM conformation to meso-scale
CPN properties The swelling ratio results were in qualitative agreement with the simulated PAM
conformation in that the swelling ratio increased with increasing pH The computer simulation
results confirmed that micro-scale changes in polymer conformation of tunable CPN affect meso-
scale CPN behaviors
Although it is still challenging to quantitatively link computational findings to
experimental results computer simulation was demonstrated to be a viable tool providing a good
qualitative agreement with experimental findings In addition computer simulation provided the
104
insight to overcome experimental limitations On the other hand experimental results provided
information that computer simulation did not capture such as pH-dependent behavior of
montmorillonite crosslinking effects of the polymer and hydrolysis behavior of PAM at neutral
pH
105
Chapter 6
CONCLUSIONS
A new technique of soil modification with the use of a responsive polymer ndash tunable
clay-polymer nanocomposites (CPN) ndash was developed and demonstrated in this study The
tunable CPN were proven to have controllable system properties by means of further
modifications post synthesis The tested soil was montmorillonite (Mt) and polyacrylamide
(PAM) was used as a soil modifier Micro-scale conformational behavior of PAM in a bulk
solution and in the CPN was characterized using dynamic light scattering (DLS) and
spectroscopic ellipsometry (SE) respectively Corresponding meso-scale property changes of the
CPN were characterized by measuring specific surface area swelling potential and permeability
A coarse-grained computer simulation technique dissipative particle dynamics (DPD) was used
to investigate the effects of the micro-scale PAM conformation on the meso-scale CPN properties
An optimized procedure was developed for synthesizing tunable CPN using an expansive
clay (Mt) and a water-soluble responsive polymer (PAM) The optimum condition for the
maximum quantity of intercalated structure formation was found with low molecular weight
nonionic PAM at clay-to-polymer volume ratio 2 and clay content 0001 With the use of a
water-soluble polymer large-scale production of in-situ modifiable engineered clay soils is
feasible
Corresponding to pH-dependent conformation of PAM in a bulk solution PAM in the
synthesized CPN also had pH-dependent conformation to lesser degree due to the presence of
surfaces Layer thickness of PAM adsorbed on a surface specific surface area and swelling
potential increased with increasing pH corresponding to extended PAM conformation at basic
pH The increase in the swelling potential resulted in pore size reduction leading to a decrease in
permeability
106
With the use of DPD technique a quantitative linkage between PAM conformation and a
CPN property ndash interlayer spacing ndash was made for a system containing one PAM molecule
sandwiched between two Mt layers Although it is still challenging to quantitatively link
computational findings to meso-scale experimental results computer simulation was
demonstrated to be a viable tool providing good qualitative agreement with experimental
findings In addition computer simulation provided the insight to overcome experimental
limitations On the other hand experimental results provided information that computer
simulation did not capture such as pH-dependent behavior of Mt and hydrolysis behavior of PAM
at neutral pH
This study indicates that the use of pH-responsive polymer is a viable tool for soil
modification The conformation of a pH-responsive polymer varies with ambient solution pH
leading to system property changes due to changes in soil fabric ie interlayer and interparticle
spacings Thus this study may offer a new outlook for a purpose of creating engineered soil
systems A responsive polymer can be widely utilized in the fields of geotechnical and
geoenvironmental engineering to build an engineered soil system which has tunable system
properties
107
Future Work
Strength and Deformation of Clay-Polymer Nanocomposites
Since geotechnical applications typically include supporting the load imposed by
buildings or structures mechanical properties such as shear strength compressive strength and
deformation are of interest Polymer introduction may affect mechanical properties of the
system thus effects of polymer are required to be investigated by means of laboratory testing
used in the field of geotechnical engineering
Polymer molecules provide additional bonding between clay particles or between clay
layers thus better mechanical properties may be obtained Polymer molecules are typically
flexible while clay particles are relatively rigid and hence better toughness may be expected for
clay-polymer systems Thus mechanical properties for polymer-treated clay soil systems will be
investigated by means of geotechnical testing such as direct shear test consolidation test and
triaxial tests Variables such as sample type molecular weight and ionic type of polymer and
ionic strength can be used to explore effects of each variable If current experimental techniques
are not suitable for the new material to investigate such an effect of interest a new technique can
be developed considering both characteristics of clays and polymers
Geoenvironmental Applications of Clay-Polymer Nanocomposites
In contrast to the geotechnical applications chemistry and biology are important in the
field of geoenvironmental engineering When clay-polymer composites are applied in field
interactions of the composites with preexisting ions and microorganisms may be of concern since
such interactions may affect the clay-polymer system
For example as found in this study a clay-polymer system can have lower permeability
than pure clay systems Thus it can be used for an environmental barrier or filter that prevents
108
contaminants from exposure to nature However preexisting cations andor microorganisms can
neutralize negatively charged groups of polyacrylamide leading to an increase in permeability
Preexisting cations andor microorganisms can also provide additional adsorption sites for
contaminants improving the barrier properties of the system Therefore such factors need to be
investigated prior to introducing polymers into clay soil systems Laboratory testing including
adsorption test for contaminants on the clay-polymer composites can be performed in the
presence of different ions andor microorganisms to explore effects of each factor on the barrier
property of the clay-polymer composites
Expansion of the Use of Computer Simulation for Investigation of Clay-Polymer Nanocomposites
With current experimental technologies it is very challenging to characterize clay-
polymer nanocomposites since it is a very small complex system As shown in this study
dissipative particle dynamics is a viable tool to characterize such a small complex system Thus
the technique can be used to explore unknown or controversial issues of clay-polymer systems
since computer simulation has the advantage of isolating a factor of interest
For example the most dominant factor in the behavior of the ldquotunablerdquo clay polymer
nanocomposites and complex pH-dependencies observed in specific surface area measurement
can be demonstrated with the use of computer simulation techniques Each factor affecting the
behavior can be isolated during simulation to find degree of influence Comparing the found
degree of influence the most dominant factor(s) can be determined
109
REFERENCES
Aksberg R and Wagberg L 1989 Hydrolysis of cationic polyacrylamides Journal of Applied
Polymer Science 38(2) 297-304
Al-Anazi H A and Sharma M M 2002 Use of a pH Sensitive Polymer for Conformance
Control International Symposium and Exhibition on Formation Damage Control
Lafayette Louisiana
Alexandre M and Dubois P 2000 Polymer-layered silicate nanocomposites Preparation
properties and uses of a new class of materials Materials Science and Engineering R
Reports 28(1-2) 1-63
Anthony A J King P H and Randall C W 1975 The effects of branching and other
physical properties of anionic polyacrylamides on the flocculation of domestic sewage
Journal of Applied Polymer Science 19(1) 37-48
Aranda P and Ruiz-Hitzky E 1992 Poly(ethylene oxide)-silicate intercalation materials Chem
Mater 4(6) 1395-1403
Ashmawy A K El-Hajji D Sotelo N and Muhammad N 2002 Hydraulic performance of
untreated and polymer-treated bentonite in inorganic landfill leachates Clays and Clay
Minerals 50(5) 546-552
Askadskii A A 1990 Influence of crosslinking density on the properties of polymer networks
Polymer Science USSR 32(10) 2061-2069
ASTM 2003 D422-63 Standard Test Method for Particle-Size Analysis of Soils American
Society for Testing and Materials (ASTM)
ASTM 2006 D5890 Standard Test Method for Swell Index of Clay Mineral Component of
Geosynthetic Clay Liners American Society for Testing and Materials (ASTM)
Aulich D Hoy O Luzinov I Brucher M Hergenroder R Bittrich E Eichhorn K-J
Uhlmann P Stamm M Esser N and Hinrichs K 2010 In Situ Studies on the
Switching Behavior of Ultrathin Poly(acrylic acid) Polyelectrolyte Brushes in Different
Aqueous Environments Langmuir 26(15) 12926-12932
Bae Y H Okano T and Wan Kim S 1990 Temperature dependence of swelling of
crosslinked poly(NN prime -alkyl substituted acrylamides) in water Journal of Polymer
Science Part B Polymer Physics 28(6) 923-936
Bajpai A K and Giri A 2003 Water sorption behaviour of highly swelling (carboxy
methylcellulose-g-polyacrylamide) hydrogels and release of potassium nitrate as
agrochemical Carbohydrate Polymers 53(3) 271-279
Balazs A Ginzburg v v Lyatskaya Y Singh C and Zhulina E 2000 Modeling the Phase
Behavior of Polymer-Clay Nanocomposites In T J Pinavaia and G W Beall (eds)
Polymer-clay nanocomposites John Wiley amp Sons Ltd
Barvenik F W 1994 Polyacrylamide characteristics related to soil applications Soil Science
158 235-243
Bauer A and Velde B 1999 Smectite transformation in high molar KOH solutions Clay
Minerals 34(2) 259-273
Berend I Cases J-M Franccedilois M Uriot J-P Michot L Masion A and Thomas F 1995
Mechanism of Adsorption and Desorption of Water Vapor by Homoionic
Montmorillonites 2 The Li+ Na+ K+ Rb+ and Cs+-Exchanged Forms Clays and
Clay Minerals 43(3) 324-336
Berne B J and Pecora R 1976 Dynamic light scattering John Wiley amp Sons Inc New York
110
Besra L Sengupta D K Roy S K and Ay P 2002 Flocculation and dewatering of kaolin
suspensions in the presence of polyacrylamide and surfactants International Journal of
Mineral Processing 66(1-4) 203-232
Besra L Sengupta D K Roy S K and Ay P 2004 Influence of polymer adsorption and
conformation on flocculation and dewatering of kaolin suspension Separation and
Purification Technology 37(3) 231-246
Bhardwaj A K Shainberg I Goldstein D Warrington D N and JLevy G 2007 Water
Retention and Hydraulic Conductivity of Cross-Linked Polyacrylamides in Sandy Soils
Soil Sci Soc Am J 71(2) 406-412
Biswas M and Ray S S 2001 Recent Progress in Synthesis and Evaluation of Polymer-
Montmorillonite Nanocomposites Advances in Polymer Science 155 167-221
Bittrich E Kuntzsch M Eichhorn K-J and Uhlmann P 2010 Complex pH- and
temperature-sensitive swelling behavior of mixed polymer brushes Journal of Polymer
Science Part B Polymer Physics 48(14) 1606-1615
Blachier C Michot L Bihannic I Barr O Jacquet A and Mosquet M 2009 Adsorption
of polyamine on clay minerals Journal of Colloid and Interface Science 336(2) 599-606
Boek E S Coveney P V and Lekkerkerker H N W 1996 Computer simulation of
rheological phenomena in dense colloidal suspensions with dissipative particle dynamics
Journal of Physics Condensed Matter 8(47) 9509-9512
Boek E S Padding J T den Otter W K and Briels W J 2005 Mechanical Properties of
Surfactant Bilayer Membranes from Atomistic and Coarse-Grained Molecular Dynamics
Simulations The Journal of Physical Chemistry B 109(42) 19851-19858
Borchardt G 1989 Smectites In J B Dixon S B Weed and R C Dinauer (eds) Minerals in
soil environments Soil Science Society of America Madison Wisconsin USA 675-727
Borden D and Giese R F 2001 Baseline studies of the clay minerals society source clays
Cation exchange capacity measurements by the ammonia-electrode method Clays and
Clay Minerals 49(5) 444-445
Bottero J Y Bruant M Cases J M Canet D and Fiessinger F 1988 Adsorption of
nonionic polyacrylamide on sodium montmorillonite Relation between adsorption [xi]
potential turbidity enthalpy of adsorption data and 13C-NMR in aqueous solution
Journal of Colloid and Interface Science 124(2) 515-527
Boulet P Coveney P V and Stackhouse S 2004 Simulation of hydrated Li+- Na+- and K+-
montmorillonitepolymer nanocomposites using large-scale molecular dynamics
Chemical Physics Letters 389(4-6) 261-267
Bourg I C Bourg A C M and Sposito G 2003 Modeling diffusion and adsorption in
compacted bentonite A critical review Journal of Contaminant Hydrology 61(1-4)
293-302
Brandrup J and Immergut E H 1989 Polymer handbook 3rd ed Wiley New York
Brannon-Peppas L and Peppas N A 1991 Equilibrium swelling behavior of dilute ionic
hydrogels in electrolytic solutions Journal of Controlled Release 16(3) 319-329
Brindley G W and Brown G 1980 Crystal structures of clay minerals and their X-ray
identification Mineralogical Society London
Brondsted H and Kopecek J 1992 pH-Sensitive Hydrogels Polyelectrolyte Gels American
Chemical Society 285-304
Brotherson B Bottomley L A Ludovice P and Deng Y 2007 Cationic Polyacrylamide
Conformation on Mica Studied by Single Molecule Pulling with Scanning Probe
Microscopy Macromolecules 40(13) 4561-4567
Bruice P Y 2001 Organic chemistry 3rd ed Prentice Hall Upper Saddle River NJ
111
Campbell A M Pan Z and Somasundaran P 2002 Monitoring of Adsorbed Polymer
Conformation in Concentrated Suspensions In V A Hackley P Somasundaran and J
A Lewis (eds) Polymers in particulate systems Properties and applications Marcel
Dekker Inc New York Basel 135-156
Carasso M L Rowlands W N and OBrien R W 1997 The Effect of Neutral Polymer and
Nonionic Surfactant Adsorption on the Electroacoustic Signals of Colloidal Silica
Journal of Colloid and Interface Science 193(2) 200-214
Carroll D and Starkey H C 1971 Reactivity of Clay Minerals with Acids and Alkalies Clays
and Clay Minerals 19(5) 321-333
Chang F R C Skipper N T and Sposito G 1995 Computer simulation of interlayer
molecular structure in sodium montmorillonite hydrates Langmuir 11(7) 2734
Chen C An I Ferreira G M Podraza N J Zapien J A and Collins R W 2004
Multichannel Mueller matrix ellipsometer based on the dual rotating compensator
principle Thin Solid Films 455-456 14-23
Chen G and Hoffman A S 1995 Graft copolymers that exhibit temperature-induced phase
transitions over a wide range of pH Nature 373(6509) 49-52
Chen G Pan J Han B and Yan H 1999 Adsorption of Methylene Blue on Montmorillonite
Journal of Dispersion Science and Technology 20(4) 1179-1187
Chen J S Cushman J H and Low P F 1990 Rheological Behavior of Na-Montmorillonite
Suspensions at Low Electrolyte Concentration Clays and Clay Minerals 38(1) 57-62
Chodanowski P and Stoll S 2001 Polyelectrolyte Adsorption on Charged Particles in the
Debye-Huckel Approximation A Monte Carlo Approach Macromolecules 34 2320-
2328
Cohen Stuart M A Cosgrove T and Vincent B 1986 Experimental aspects of polymer
adsorption at solidsolution interfaces Advances in Colloid and Interface Science 24
143-239
Collins R W and Ferlauto A S 2005 Optical Properties of Materials In H G Tompkins and
E A Irene (eds) Handbook of Ellipsometry William Andrew Pub Springer Norwich
NY 125-129
Cong Y An l Vedam K and Collins R W 1991 Optical characterization of a four-medium
thin film structure by real time spectroscopic ellipsometry amorphous carbon on
tantalum Applied Optics 30(19) 2692-2703
Connal L A Li Q Quinn J F Tjipto E Caruso F and Qiao G G 2008 pH-Responsive
Poly(acrylic acid) Core Cross-Linked Star Polymers Morphology Transitions in Solution
and Multilayer Thin Films Macromolecules 41(7) 2620-2626
Cygan R T Guggenheim S and Koster van Groos A F 2004a Molecular Models for the
Intercalation of Methane Hydrate Complexes in Montmorillonite Clay The Journal of
Physical Chemistry B 108(39) 15141-15149
Cygan R T Liang J-J and Kalinichev A G 2004b Molecular Models of Hydroxide
Oxyhydroxide and Clay Phases and the Development of a General Force Field The
Journal of Physical Chemistry B 108(4) 1255-1266
Daivis P J Matin M L and Todd B D 2007 Nonlinear shear and elongational rheology of
model polymer melts at low strain rates Journal of Non-Newtonian Fluid Mechanics
147(1-2) 35-44
de Gennes P G 1987 Polymers at an interface a simplified view Advances in Colloid and
Interface Science 27(3-4) 189-209
Deng Y Dixon J B White G N Loeppert R H and Juo A S R 2006 Bonding between
polyacrylamide and smectite Colloids and Surfaces A Physicochemical and Engineering
Aspects 281(1-3) 82-91
112
Depa P K 2007 Multiscale Modeling of Polymeric Materials PhD Dissertation Penn State
University University Park USA
Dobias B Qiu X and Rybinski W v 1999 Solid-liquid dispersions Marcel Dekker New
York
Dong R Lindau M and Ober C K 2009 Dissociation Behavior of Weak Polyelectrolyte
Brushes on a Planar Surface Langmuir 25(8) 4774-4779
Douillard J M Salles F Devautour-Vinot S Manteghetti A and Henry M 2007 Study of
the surface energy of montmorillonite using PACHA formalism Journal of Colloid and
Interface Science 306(1) 175-182
Drever J I 1997 The Geochemistry of Natural Waters Surface and Groundwater
Environments 3rd ed Prentice Hall Upper Saddle River NJ
Ebnesajjad S 2006 Surface treatment of materials for adhesion bonding William Andrew Pub
New York
El-Hajji D Ashmawy A K Darlington J and Sotelo N 2001 Effect of inorganic leachate
on polymer treated GCL material Proceedings of the Geosynthetics 2001 Conference
Portland Oregon 663-670
Espaňol P and Warren P 1995 Statistical Mechanics of Dissipative Particle Dynamics
Europhysics Letters 30(4) 191-196
Essmann U Perera L Berkowitz M L Darden T Lee H and Pedersen L G 1995 A
smooth particle mesh Ewald method The Journal of Chemical Physics 103(19) 8577-
8593
Ewald P 1921 Die Berechnung optischer und elektrostatischer Gitterpotentiale Ann Phys 64
253-287
Fan X and Advincula R C 2002 Nanostructured ultrathin films of silicate clay and
polyelectrolytes deposition parameters and mechanical properties by nanoindentation
Materials Research Society Symposium Proceedings Boston MA USA 335-340
Fan X Park M-k Xia C and Advincula R 2002 Surface structural characterization and
mechanical testing by nanoindentation measurements of hybrid polymerclay
nanostructured multilayer films Journal of materials research 17(7) 1622-1633
Feil H Bae Y H Feijen J and Kim S W 1992 Mutual influence of pH and temperature on
the swelling of ionizable and thermosensitive hydrogels Macromolecules 25(20) 5528-
5530
Fermeglia M and Pricl S 2007 Multiscale modeling for polymer systems of industrial interest
Progress in Organic Coatings 58(2-3) 187-199
Ferrage E Lanson B Sakharov B A and Drits V A 2005 Investigation of smectite
hydration properties by modeling experimental X-ray diffraction patterns Part I
Montmorillonite hydration properties American Mineralogist 90(8-9) 1358-1374
Filippi S Mameli E Marazzato C and Magagnini P 2007 Comparison of solution-blending
and melt-intercalation for the preparation of poly(ethylene-co-acrylic acid)organoclay
nanocomposites European Polymer Journal 43(5) 1645-1659
Filippova N L 1998 Adsorption and Desorption Kinetics of Polyelectrolytes on Planar
Surfaces Langmuir 14(5) 1162-1176
Fleer G J 1993 Polymers at interfaces 1st ed Chapman amp Hall London New York
Fleer G J Koopal L K and Lyklema J 1972 Polymer adsorption and its effect on the
stability of hydrophobic colloids Colloid amp Polymer Science 250(7) 689-702
Flory P J 1953 Principles of polymer chemistry Cornell University Press Ithaca
Francois J Sarazin D Schwartz T and Weill G 1979 Polyacrylamide in water molecular
weight dependence of ltR2gt and [eta] and the problem of the excluded volume exponent
Polymer 20(8) 969-975
113
Fuchslin R M Fellermann H Eriksson A and Ziock H-J 2009 Coarse graining and
scaling in dissipative particle dynamics The Journal of Chemical Physics 130(21)
214102-8
Fukushima Y 1984 X-ray diffraction study of aqueous montmorillonite emulsions Clays and
Clay Minerals 32(4) 320-326
Gajo A and Maines M 2007 Mechanical effects of aqueous solutions of inorganic acids and
bases on a natural active clay Geotechnique 57(8) 687-99
Gao D and Heimann R B 1993 Structure and mechanical properties of superabsorbent poly
(acrylamide)-montmorillonite composite hydrogels Polymer Gels and Networks 1(4)
225-246
Gao F 2004 Claypolymer composites the story Materials Today 7(11) 50-55
Gardner K H and Arias M S 2000 Clay swelling and formation permeability reductions
induced by a nonionic surfactant Environmental Science and Technology 34(1) 160-166
Ghosh D and Bhattacharyya K G 2002 Adsorption of Methylene Blue on Kaolinite Applied
Clay Science 20 295-300
Giannelis E P Krishnamoorti R and Manias E 1999 Polymer-silicate nanocomposites
Model systems for confined polymers and polymer brushes Advances in Polymer
Science 138 107-147
Gibson J B Chen K and Chynoweth S 1998 Simulation of Particle Adsorption onto a
Polymer-Coated Surface Using the Dissipative Particle Dynamics Method Journal of
Colloid and Interface Science 206(2) 464-474
Gibson J B Zhang K Chen K Chynoweth S and Manke C W 1999 Simulation of
colloid-polymer systems using dissipative particle dynamics Molecular Simulation 23
1-41
Glinel K Laschewsky A and Jonas A M 2001 Ordered Polyelectrolyte multilayers 3
Complexing Clay Platelets with Polycations of Varying Structure Macromolecules
34(15) 5267-5274
Goddard W A Cagin T Blanco M Vaidehi N Dasgupta S Floriano W Belmares M
Kua J Zamanakos G Kashihara S Iotov M and Gao G 2001 Strategies for
multiscale modeling and simulation of organic materials polymers and biopolymers
Computational and Theoretical Polymer Science 11(5) 329-343
Gong P Wu T Genzer J and Szleifer I 2007 Behavior of Surface-Anchored Poly(acrylic
acid) Brushes with Grafting Density Gradients on Solid Substrates 2 Theory
Macromolecules 40(24) 8765-8773
Gonzalez-Melchor M Mayoral E Velazquez M E and Alejandre J 2006 Electrostatic
interactions in dissipative particle dynamics using the Ewald sums Journal of Chemical
Physics 125(22)
Griffiths P C Paul A Khayat Z Wan K-W King S M Grillo I Schweins R Ferruti P
Franchini J and Duncan R 2004 Understanding the Mechanism of Action of
Poly(amidoamine)s as Endosomolytic Polymers Correlation of Physicochemical and
Biological Properties Biomacromolecules 5(4) 1422-1427
Groot R D 2000 Mesoscopic Simulation of Polymer-Surfactant Aggregation Langmuir
16(19) 7493-7502
Groot R D 2003 Electrostatic interactions in dissipative particle dynamics - simulation of
polyelectrolytes and anionic surfactants The Journal of Chemical Physics 118(24)
11265-11277
Groot R D and Rabone K L 2001 Mesoscopic Simulation of Cell Membrane Damage
Morphology Change and Rupture by Nonionic Surfactants Biophysical Journal 81(2)
725-736
114
Groot R D and Warren P B 1997 Dissipative particle dynamics Bridging the gap between
atomistic and mesoscopic simulation The Journal of Chemical Physics 107(11) 4423-
4435
Gruenert G Ibrahim B Lenser T Lohel M Hinze T and Dittrich P 2010 Rule-based
spatial modeling with diffusing geometrically constrained molecules BMC
Bioinformatics 11 307
Gudeman L F and Peppas N A 1995 Preparation and characterization of pH-sensitive
interpenetrating networks of poly(vinyl alcohol) and poly(acrylic acid) Journal of
Applied Polymer Science 55(6) 919-928
Haraguchi K and Takehisa T 2002 Nanocomposite Hydrogels A Unique OrganicndashInorganic
Network Structure with Extraordinary Mechanical Optical and SwellingDe-swelling
Properties Advanced Materials 14(16) 1120-1124
Heinz H Vaia R A Krishnamoorti R and Farmer B L 2007 Self-Assembly of
Alkylammonium Chains on Montmorillonite Effect of Chain Length Head Group
Structure and Cation Exchange Capacity Chemistry of Materials 19(1) 59-68
Hensen E J M Tambach T J Bliek A and Smit B 2001 Adsorption isotherms of water in
Li-- Na-- and K--montmorillonite by molecular simulation The Journal of Chemical
Physics 115(7) 3322-3329
Herbert H-J Kasbohm J Sprenger H Fernandez A M and Reichelt C 2008 Swelling
pressures of MX-80 bentonite in solutions of different ionic strength Physics and
Chemistry of the Earth 33(SUPPL 1) S327-S342
Herzinger C M Johs B McGahan W A Woollam J A and Paulson W 1998
Ellipsometric determination of optical constants for silicon and thermally grown silicon
dioxide via a multi-sample multi-wavelength multi-angle investigation Journal of
Applied Physics 83(6) 3323-3336
Hjelmstad K E 1990 Cationic polymers prevent permeability loss during leaching Minerals
and Metallurgical Processing 7(1) 30-35
Hogg R 1999 Role of polymer adsorption kinetics in flocculation Colloids and Surfaces A
Physicochemical and Engineering Aspects 146(1-3) 253-263
Hoogerbrugge P J and Koelman J M V A 1992 Simulating Microscopic Hydrodynamic
Phenomena with Dissipative Particle Dynamics Europhysics Letters 19 155-160
Huang S-Y Lipp D W and Farinato R S 2001 Acrylamide Polymers In A Seidel ed
Kirk-Othmer Encyclopedia of Chemical Technology John Wiley amp Sons New Jersey
304-342
Hunter R J 1993 Introduction to Modern Colloid Science 1st ed Oxford University Press
Oxford New York
Hwang J Y and Dixon J B 2000 Flocculation behavior and properties of Na-montmorillonite
treated with four organic polymers Clay Science 11 137-146
Ibergay C Malfreyt P and Tildesley D J 2009 Electrostatic Interactions in Dissipative
Particle Dynamics Toward a Mesoscale Modeling of the Polyelectrolyte Brushes
Journal of Chemical Theory and Computation 5(12) 3245-3259
Ibergay C Malfreyt P and Tildesley D J 2010 Mesoscale Modeling of Polyelectrolyte
Brushes with Salt The Journal of Physical Chemistry B 114(21) 7274-7285
Inyang H I and Bae S 2005 Polyacrylamide sorption opportunity on interlayer and external
pore surfaces of contaminant barrier clays Chemosphere 58(1) 19-31
Inyang H I Bae S Mbamalu G and Park S-W 2007 Aqueous polymer effects on
volumetric swelling of Na-montmorillonite Journal of Materials in Civil Engineering
19(1) 84-90
115
Irene E A 1993 Applications of spectroscopic ellipsometry to microelectronics Thin Solid
Films 233(1-2) 96-111
Israelachvili J N 1991 Intermolecular and surface forces 2nd ed Academic Press London
San Diego
Jo H Y Katsumi T Benson C H and Edil T B 2001 Hydraulic Conductivity and
Swelling of Nonprehydrated GCLs Permeated with Single-Species Salt Solutions
Journal of Geotechnical and Geoenvironmental Engineering 127(7) 557-567
Kandhal P S and Parker F 1998 Aggregate tests related to asphalt concrete performance in
pavements National Cooperative Highway Research Program (NCHRP) Report 405
Transportation Research Board Washington DC
Katchalsky A and Spitnik P 1947 Potentiometric titrations of polymethacrylic acid Journal
of Polymer Science 2(4) 432-446
Katti K S Sikdar D Katti D R Ghosh P and Verma D 2006 Molecular interactions in
intercalated organically modified clay and clay-polycaprolactam nanocomposites
Experiments and modeling Polymer 47(1) 403-414
Kheradmand H Francois J and Plazanet V 1988 Hydrolysis of polyacrylamide and acrylic
acid-acrylamide copolymers at neutral pH and high temperature Polymer 29(5) 860-870
Kim S and Palomino A M 2009 Polyacrylamide-treated kaolin A fabric study Applied Clay
Science 45(4) 270-279
Kim S and Palomino A M 2011 Factors influencing the synthesis of tunable clay-polymer
nanocomposites using bentonite and polyacrylamide Applied Clay Science 51(4) 491-
498
Kim S J Kim M S Kim S I Spinks G M Kim B C and Wallace G G 2006 Self-
oscillatory actuation at constant DC voltage with pH-sensitive chitosanpolyaniline
hydrogel blend Chemistry of Materials 18(24) 5805-5809
Klenina O V and Lebedeva L G 1983 Viscometric properties of dilute solutions of
hydrolyzed polyacrylamide Polymer Science USSR 25(10) 2380-2389
Knauert S T Douglas J F and Starr F W 2007 The effect of nanoparticle shape on
polymer-nanocomposite rheology and tensile strength Journal of Polymer Science Part
B Polymer Physics 45(14) 1882-1897
Kong Y Manke C W Madden W G and Schlijper A G 1997 Effect of solvent quality on
the conformation and relaxation of polymers via dissipative particle dynamics The
Journal of Chemical Physics 107(2) 592-602
Koo J H 2006 Polymer nanocomposites processing characterization and applications
McGraw-Hill New York
Kremer K and Grest G S 1990 Dynamics of entangled linear polymer melts A molecular
dynamics simulation Journal of Chemical Physics 92 5057
Kroger M 2004 Simple models for complex nonequilibrium fluids Physics Reports 390(6)
453-551
Kulicke W M Kniewske R and Klein J 1982 Preparation characterization solution
properties and rheological behaviour of polyacrylamide Progress in Polymer Science
8(4) 373-468
Kurenkov V F 1997 Acrylamide Polymers In N P Cheremisinoff ed Handbook of
engineering polymeric materials Marcel Dekker New York 61-72
Lagaly G 1989 Principles of flow of kaolin and bentonite dispersions Applied Clay Science
4(2) 105-123
Lagaly G 2006 Colloid Clay Science In F Bergaya B K G Theng and G Lagaly (eds)
Handbook of clay science Elsevier Amsterdam Boston 141-245
116
Laguecir A and Stoll S 2005 Adsorption of a weakly charged polymer on an oppositely
charged colloidal particle Monte Carlo simulations investigation Polymer 46(4 SPEC
ISS) 1359-1372
Laird D A D 1997 Bonding between polyacrylamide and clay mineral surfaces Soil science
162(11) 826-832
Lee J J and Fuller G G 1984 Ellipsometry studies of adsorbed polymer chains subjected to
flow Macromolecules 17(3) 375-380
Lee J W Kim S Y Kim S S Lee Y M Lee K H and Kim S J 1999 Synthesis and
characteristics of interpenetrating polymer network hydrogel composed of chitosan and
poly(acrylic acid) Journal of Applied Polymer Science 73(1) 113-120
Lee L T Rahbari R Lecourtier J and Chauveteau G 1991 Adsorption of Polyacrylamides
on the Different Faces of Kaolinites Journal of Colloid and Interface Science 147(2)
Leermakers F A M Atkinson P J Dickinson E and Horne D S 1996 Self-Consistent-
Field Modeling of Adsorbed [beta]-Casein Effects of pH and Ionic Strength on Surface
Coverage and Density Profile Journal of Colloid and Interface Science 178(2) 681-693
Liu P and Zhang L 2007 Adsorption of dyes from aqueous solutions or suspensions with clay
nano-adsorbents Separation and Purification Technology 58(1) 32-39
Liu X-W Hu M and Hu Y-H 2008 Chemical composition and surface charge properties of
montmorillonite Journal of Central South University of Technology (English Edition)
15(2) 193-197
Lo I M C Mak R K M and Lee S C H 1997 Modified Clays for Waste Containment and
Pollutant Attenuation Journal of Environmental Engineering 123(1) 25-32
Lochhead R Y and McConnell Boykin C 2002 An investigative study of polymer adsorption
to smectite clay Polyelectrolytes and sodium montmorillonite In R Krishnamoorti and
R A Vaia (eds) Polymer nanocomposites synthesis characterization and modeling
Oxford University Press 85-98
Luckham P F and Rossi S 1999 The colloidal and rheological properties of bentonite
suspensions Advances in Colloid and Interface Science 82(1-3) 43-92
Luo C and Sommer J-U 2009 Coding coarse grained polymer model for LAMMPS and its
application to polymer crystallization Computer Physics Communications 180(8) 1382-
1391
Ma C and Eggleton R A 1999 Cation exchange capacity of kaolinite Clays and Clay
Minerals 47(2) 174-180
Mahdavinia G R Pourjavadi A Hosseinzadeh H and Zohuriaan M J 2004 Modified
chitosan 4 Superabsorbent hydrogels from poly(acrylic acid-co-acrylamide) grafted
chitosan with salt- and pH-responsiveness properties European Polymer Journal 40(7)
1399-1407
Mai Y W Yu Z-Z and Institute of Materials Minerals and Mining 2006 Polymer
nanocomposites CRC Press Woodhead Boca Raton FL Cambridge England
Mazo M A Manevitch L I Gusarova E B Shamaev M Y Berlin A A Balabaev N K
and Rutledge G C 2008 Molecular dynamics simulation of thermomechanical
properties of montmorillonite crystal 3 montmorillonite crystals with PEO oligomer
intercalates Journal of Physical Chemistry B 112(12) 3597-3604
McBride M B 1994 Environmental chemistry of soils Oxford University Press New York
Medjahdi G Sarazin D and Francois J 1990 Light scattering behaviour of semi-dilute
solutions of polyacrylamide European Polymer Journal 26(7) 823-829
Meunier A 2005 Clays Springer Berlin New York
Michaels A S 1954 Aggregation of Suspensions by Polyelectrolytes Industrial amp Engineering
Chemistry 46(7) 1485-1490
117
Michaels A S and Morelos O 1955 Polyelectrolyte Adsorption by Kaolinite Industrial and
Engineering Chemistry 47(9) 1801-1809
Mitchell J K 1956 The Fabric of Natural Clays and its Relation to Engineering Properties
Highway Research Board Proceedings 35(35th Annual Meeting Washington DC)
693-713
Mitchell J K 1993 Fundamentals of Soil Behavior 2nd ed John Wiley amp Sons New York
Mohan K K and Fogler H S 1997 Effect of pH and Layer Charge on Formation Damage in
Porous Media Containing Swelling Clays Langmuir 13(10) 2863-2872
Moore D M and Reynolds R C 1997 X-ray diffraction and the identification and analysis of
clay minerals 2nd ed Oxford University Press Oxford New York
Mortland M M and Brady N C 1970 Clay-Organic Complexes and Interactions Advances
in Agronomy Academic Press 75-117
Mpofu P Addai-Mensah J and Ralston J 2003 Investigation of the effect of polymer
structure type on flocculation rheology and dewatering behaviour of kaolinite
dispersions International Journal of Mineral Processing 71(1-4) 247-268
Muller-plathe F 2002 Coarse-Graining in Polymer Simulation From the Atomistic to the
Mesoscopic Scale and Back Chem Phys Chem 3 754-769
Murray H H 1991 Overview - Clay mineral applications Applied Clay Science 5 379-395
Muzny C D Butler B D Hanley H J M Tsvetkov F and Peiffer D G 1996 Clay
platelet dispersion in a polymer matrix Materials Letters 28(4-6) 379-384
Myagchenkov V A and Proskurina V E 2004 Flocculation Activity (with Respect to Ocher)
of Anionic Copolymers of Acrylamide in the Mode of Restricted Sedimentation as
Influenced by Their Chemical Heterogeneity Russian Journal of Applied Chemistry
77(3) 463-466
Nabzar L and Pefferkorn E 1985 An experimental study of kaolinite crystal edge-
polyacrylamide interactions in dilute suspensions Journal of Colloid and Interface
Science 108(1) 243-248
Nasser M S and James A E 2006 Settling and sediment bed bahaviour of kaolinite in
aqueous media Separation and Purification Technology 51 10-17
Nelson A and Cosgrove T 2004 Dynamic Light Scattering Studies of Poly(ethylene oxide)
Adsorbed on Laponite Layer Conformation and Its Effect on Particle Stability Langmuir
20(24) 10382-10388
Newman A C D 1987 Chemistry of clays and clay minerals Wiley Mineralogical Society
New York London
Nieminen R M 2002 From atomistic simulation towards multiscale modelling of materials
Journal of Physics Condensed Matter 14(11) 2859-2876
Nishimura S Biggs S Scales P J Healy T W Tsunematsu K and Tateyama T 1994
Molecular-scale structure of the cation modified muscovite mica basal plane Langmuir
10(12) 4554-4559
Pagonabarraga I Rotenberg B and Frenkel D 2010 Recent advances in the modelling and
simulation of electrokinetic effects bridging the gap between atomistic and macroscopic
descriptions Physical Chemistry Chemical Physics 12(33) 9566-9580
Painter P C and Coleman M M 1997 Fundamentals of polymer science an introductory text
2nd ed Technomic Pub Co Lancaster Pa
Palomino A M Kim S Summitt A and Fratta D 2011 Impact of diatoms on fabric and
chemical stability of diatom-kaolin mixtures Applied Clay Science 51(3) 287-294
Palomino A M and Santamarina J C 2005 Fabric Map for Kaolinite Effects of pH and
Ionic Concentration on Behavior Clays and Clay Minerals 53(3) 209 - 222
118
Pandey R B Anderson K L Heinz H and Farmer B L 2005 Conformation and dynamics
of a self-avoiding sheet Bond-fluctuation computer simulation Journal of Polymer
Science Part B Polymer Physics 43(8) 1041-1046
Parfitt R L and Greenland D J 1970 The Adsorption of Poly(Ethylene Glycols) on Clay
Minerals Clay Minerals 8(3) 305-315
Park T G and Hoffman A S 1992 Synthesis and characterization of pH- andor temperature-
sensitive hydrogels Journal of Applied Polymer Science 46(4) 659-671
Parks G A 1967 Surface chemistry of oxides in aqueous systems In W Stumm ed
Equilibrium concepts in aqueous systems American Chemical Society Washington 121-
160
Pefferkorn E Nabzar L and Varoqui R 1987 Polyacrylamide Na-Kaolinite Interactions
Effect of Electrolyte Concentration on Polymer Adsorption Colloid and Polymer Science
265(10) 889-896
Peng S and Wu C 1999 Light Scattering Study of the Formation and Structure of Partially
Hydrolyzed Poly(acrylamide)Calcium(II) Complexes Macromolecules 32(3) 585-589
Perez-Santano A Trujillano R Belver C Gil A and Vicente M A 2005 Effect of the
intercalation conditions of a montmorillonite with octadecylamine Journal of Colloid
and Interface Science 284(1) 239-244
Pignon F eacute eacute ric Piau J-M and Magnin A 1996 Structure and Pertinent Length
Scale of a Discotic Clay Gel Physical Review Letters 76(25) 4857
Pivkin I V and Karniadakis G E 2006 Coarse-graining limits in open and wall-bounded
dissipative particle dynamics systems The Journal of Chemical Physics 124(18)
184101-7
Plaks N 2010 Test framework development for use of coal combustion products (CCPS) in
embankment construction and mine land reclamation Masters Thesis Penn State
University University Park USA
Plimpton S 1995 Fast Parallel Algorithms for Short-Range Molecular Dynamics Journal of
Computational Physics 117(1) 1-19
Pospisil M Capkova P Weiss Z Malac Z and Simonik J 2002 Intercalation of
octadecylamine into montmorillonite Molecular simulations and XRD analysis Journal
of Colloid and Interface Science 245(1) 126-132
Pospisil M Kalendov A Capkov P SimonIk J and Valaskova M 2004 Structure analysis
of intercalated layer silicates combination of molecular simulations and experiment
Journal of Colloid and Interface Science 277(1) 154-161
Qian H-J Chen L-J Lu Z-Y and Li Z-S 2007 Surface Diffusion Dynamics of a Single
Polymer Chain in Dilute Solution Physical Review Letters 99(6) 068301-4
Rand B Pekenc E Goodwin J W and Smith R W 1980 Investigation into the existence of
edge-face coagulated structures in Na-montmorillonite suspensions Journal of the
Chemical Society Faraday Transactions 1 76 225-235
Ravve A 2000 Principles of polymer chemistry 2nd ed Kluwer AcademicPlenum Publishers
New York
Ray S S and Okamoto M 2003 Polymerlayered silicate nanocomposites a review from
preparation to processing Progress in Polymer Science 28(11) 1539-1641
Raymahashay B C 1987 A comparative study of clay minerals for pollution control Journal
Geological Society of India 30 408-413
Rekvig L Kranenburg M Vreede J Hafskjold B and Smit B 2003 Investigation of
Surfactant Efficiency Using Dissipative Particle Dynamics Langmuir 19(20) 8195-8205
Rietveld H M 1967 Line profiles of neutron powder-diffraction peaks for structure refinement
Acta Crystallographica 22 151
119
Rotenberg B Marry V Vuilleumier R Malikova N Simon C and Turq P 2007 Water
and ions in clays Unraveling the interlayermicropore exchange using molecular
dynamics Geochimica et Cosmochimica Acta 71(21) 5089-5101
Ruiz-Hitzky E and Aranda P 1990 Polymer-salt intercalation complexes in layer silicates
Advanced Materials 2(11) 545-547
Ruiz-Hitzky E and van Meerbeek A 2006 CLAY MINERAL- AND ORGANOCLAY-
POLYMER NANOCOMPOSITE In F Bergaya B K G Theng and G Lagaly (eds)
Handbook of clay science Elsevier Amsterdam Boston 141-245
Russev S C Arguirov T V and Gurkov T D 2000 [beta]-Casein adsorption kinetics on air-
water and oil-water interfaces studied by ellipsometry Colloids and Surfaces B
Biointerfaces 19(1) 89-100
Salles F Bildstein O Douillard J-M Jullien M and Van Damme H 2007 Determination
of the driving force for the hydration of the swelling clays from computation of the
hydration energy of the interlayer cations and the clay layer Journal of Physical
Chemistry C 111(35) 13170-13176
Samanta A Bera A Ojha K and Mandal A 2010 Effects of Alkali Salts and Surfactant on
Rheological Behavior of Partially Hydrolyzed Polyacrylamide Solutions Journal of
Chemical amp Engineering Data 55(10) 4315-4322
Samoshina Y Nylander T Shubin V Bauer R and Eskilsson K 2005 Equilibrium
Aspects of Polycation Adsorption on Silica Surface How the Adsorbed Layer Responds
to Changes in Bulk Solution Langmuir 21(13) 5872-5881
Santamarina J C Klein K A and Fam M A 2001 Soils and Waves Particulate Materials
Behavior Characterization and Process Monitoring J Wiley amp Sons Chichester New
York
Santamarina J C Klein K A Palomino A and Guimaraes M S 2002a Micro-Scale
Aspects of Chemical-Mechanical Coupling Interparticle Forces and Fabric In C D
Maio T Hueckel and B Loret (eds) Chemo-Mechanical Coupling in Clays From
Nano-Scale to Engineering Applications AA Balkema Lisse Maratea Italy 47 - 64
Santamarina J C Klein K A Wang Y H and Prencke E 2002b Specific Surface
Determination and Relevance Canadian Geotechnical Journal 39(1) 233-241
Sanz J and Serratosa J M 2002 Nuclear Magnetic Resonance Spectroscopy of Organo-Clay
Complexes In S Yariv and H Cross (eds) Organo-Clay Complexes and Interactions
Marcel Dekker New York 223-272
Schindler P W 1981 Surface complexes at oxide-water interfaces In M N Anderson and A J
Rubin (eds) Adsorption of inorganics at solid-liquid interfaces Ann Arbor Science Ann
Arbor MI 12-49
Schmidt D J Cebeci F C Kalcioglu Z I Wyman S G Ortiz C Van Vliet K J and
Hammond P T 2009 Electrochemically Controlled Swelling and Mechanical
Properties of a Polymer Nanocomposite ACS Nano 3(8) 2207-2216
Schwarz S Eichhorn K J Wischerhoff E and Laschewsky A 1999 Polyelectrolyte
adsorption onto planar surfaces a study by streaming potential and ellipsometry
measurements Colloids and Surfaces A Physicochemical and Engineering Aspects
159(2-3) 491-501
Scocchi G Posocco P Danani A Pricl S and Fermeglia M 2007 To the nanoscale and
beyond Multiscale molecular modeling of polymer-clay nanocomposites Fluid Phase
Equilibria 261(1-2) 366-374
Shackelford C D Benson C H Katsumi T Edil T B and Lin L 2000 Evaluating the
hydraulic conductivity of GCLs permeated with non-standard liquids Geotextiles and
Geomembranes 18(2-4) 133-161
120
Shen Z Simon G P and Cheng Y-B 2002a Comparison of solution intercalation and melt
intercalation of polymer-clay nanocomposites Polymer 43(15) 4251-4260
Shen Z Simon G P and Cheng Y-B 2002b Effects of molecular weight and clay organo-
ions on the melt intercalation of poly(ethylene oxide) into layered silicates Polymer
Engineering amp Science 42(12) 2369-2382
Shinoda T Onaka M and Izumi Y 1995 Proposed Models of Mesopore Structures in
Sulfuric Acid-Treated Montmorillonites and K10 Chemistry Letters 24(7) 495-496
Siegel R A and Firestone B A 1988 pH-dependent equilibrium swelling properties of
hydrophobic polyelectrolyte copolymer gels Macromolecules 21(11) 3254-3259
Skipper N T Chang F-R C and Sposito G 1995 Monte Carlo Simulation of Interlayer
Molecular Structure in Swelling Clay Minerals 1 Methodology Clays and Clay
Minerals 43(3) 285-293
Sposito G 1989 The Chemistry of Soils Oxford University Press New York
Sposito G 1998 On points of zero charge Environmental Science and Technology 32(19)
2815-2819
Sposito G Park S-H and Sutton R 1999 Monte Carlo Simulation of the Total Radial
Distribution Function for Interlayer water in Sodium and Potassium Montmorillonites
Clays and Clay Minerals 47(2) 192-200
Sridharan A and Prakash K 1999 Mechanisms controlling the undrained shear strength
behaviour of clays Canadian Geotechnical Journal 36(6) 1030-1038
Stemme S Odberg L and Malmsten M 1999 Effect of colloidal silica and electrolyte on the
structure of an adsorbed cationic polyelectrolyte layer Colloids and Surfaces A
Physicochemical and Engineering Aspects 155(2-3) 145-154
Steudel A Batenburg L F Fischer H R Weidler P G and Emmerich K 2009 Alteration
of swelling clay minerals by acid activation Applied Clay Science 44(1-2) 105-115
Stigter D and Dill K A 1995 Theory for Radii and Second Virial Coefficients 1 Highly
Charged Polyelectrolytes Macromolecules 28(15) 5325-5337
Story B T Urynowicz M A Johnson D W and Morris J A 2009 Reducing Water
Seepage with Anionic Polyacrylamide Application Methods and Turbidity Effects
Journal of Irrigation and Drainage Engineering 135(1) 87-95
Strawhecker K E and Manias E 2000 Structure and Properties of Poly(vinyl alcohol)Na+
Montmorillonite Nanocomposites Chemistry of Materials 12(10) 2943-2949
Strawhecker K E and Manias E 2006 Nanocomposites based on water soluble polymers and
unmodified smectite clays In Y W Mai and Z-Z Yu (eds) Polymer nanocomposites
CRC Press Woodhead Boca Raton FL Cambridge England 206-233
Stumm W 1992 Chemistry of the solid-water interface processes at the mineral-water and
particle-water interface in natural systems Wiley New York
Stutzmann T and Siffert B 1977 Contribution to the adsorption mechanism of acetamide and
polyacrylamide onto clay Clays and Clay Minerals 25 392-406
Suarez D L Rhoades J R Lavado R S and Grieve C M 1984 Effect of pH on soil
dispersion and saturated hydraulic conductivity Soil Sci Soc Am J 48(1) 50-55
Suter J L Anderson R L Greenwell H C and Coveney P V 2009 Recent advances in
large-scale atomistic and coarse-grained molecular dynamics simulation of clay minerals
Journal of Materials Chemistry 19(17) 2482-2493
Suter J L Coveney P V Greenwell H C and Thyveetil M-A 2007 Large-Scale
Molecular Dynamics Study of Montmorillonite Clay Emergence of Undulatory
Fluctuations and Determination of Material Properties The Journal of Physical
Chemistry C 111(23) 8248-8259
121
Sutton R and Sposito G 2006 Molecular simulation of humic substance-Ca-montmorillonite
complexes Geochimica et Cosmochimica Acta 70(14) 3566-3581
Suzuki A and Tanaka T 1990 Phase transition in polymer gels induced by visible light
Nature 346 345-347
Swartzen-Allen S L and Matijevic E 1974 Surface and colloid chemistry of clays Chem
Rev 74(3) 385-400
Synowicki R A Pribil G K Cooney G Herzinger C M Green S E French R H Yang
M K Burnett J H and Kaplan S 2004 Fluid refractive index measurements using
rough surface and prism minimum deviation techniques Journal of Vacuum Science amp
Technology B 22(6) 3450-3453
Takahashi A 1991 Conformational states of polymers adsorbed on interfaces Polymer Journal
23(5) 715-724
Tanaka T Nishio I Sun S-T and Ueno-Nishio S 1982 Collapse of Gels in an Electric
Field Science 218(4571) 467-469
Tanihara K and Nakagawa M 1975 Flocculation treatment of waste water containing
montmorillonite IV Interlamellar complex formation between various ion forms of
montmorillonite and poly(ethylene oxide) or polyacrylamide Nippon Kagaku Kaishi 5
782-789
Tekin N Demirbas O and Alkan M 2005 Adsorption of cationic polyacrylamide onto
kaolinite Microporous and Mesoporous Materials 85(3) 340-350
Theng B K G 1979 Formation and Properties of Clay-Polymer Complexes Amsterdam New
York
Theng B K G 1982 Clay-polymer interactions summary and perspectives Clays and Clay
Minerals 30(1) 1-10
Tombacz E Csanaky C and Illes E 2001 Polydisperse fractal aggregate formation in clay
mineral and iron oxide suspensions pH and ionic strength dependence Colloid amp
Polymer Science 279(5) 484-492
Tran N H Dennis G R Milev A S Kannangara G S K Wilson M A and Lamb R N
2005 Interactions of sodium montmorillonite with poly(acrylic acid) Journal of Colloid
and Interface Science 290(2) 392-396
Ufer K Stanjek H Roth G Dohrmann R Kleeberg R and Kaufhold S 2008 Quantitative
phase analysis of bentonites by the rietveld method Clays and Clay Minerals 56(2) 272-
282
Uhlik F Limpouchova Z Jelinek K and Prochazka K 2004 Polyelectrolyte shells of
copolymer micelles in aqueous solutions A Monte Carlo study The Journal of Chemical
Physics 121(5) 2367-2375
Ulrich S Seijo M Laguecir A and Stoll S 2006 Nanoparticle adsorption on a weak
polyelectrolyte Stiffness pH charge mobility and ionic concentration effects
investigated by Monte Carlo simulations Journal of Physical Chemistry B 110(42)
20954-20964
Vaia R A Ishii H and Giannelis E P 1993 Synthesis and properties of two-dimensional
nanostructures by direct intercalation of polymer melts in layered silicates Chemistry of
Materials 5(12) 1694-1696
van Olphen H 1977 An Introduction to Clay Colloid Chemistry For Clay Technologists
Geologists and Soil Scientists 2nd ed Wiley New York
Vazquez B Roman J S Peniche C and Cohen M E 1997 Polymeric Hydrophilic
Hydrogels with Flexible Hydrophobic Chains Control of the Hydration and Interactions
with Water Molecules Macromolecules 30(26) 8440-8446
122
Wang J Wang D Y Li F Tang X G Chan H L W Mo D and Choy C L 2004
Simple transmission ellipsometry method for measuring the electric-field-induced
birefringence in PLZT thin films Journal of Materials Science 39(5) 1805-1807
Wang M S and Pinnavaia T J 1994 Clay-Polymer Nanocomposites Formed from Acidic
Derivatives of Montmorillonite and an Epoxy Resin Chemistry of Materials 6(4) 468-
474
Whitley H D and Smith D E 2004 Free energy energy and entropy of swelling in Cs- Na-
and Sr-montmorillonite clays Journal of Chemical Physics 120(11) 5387-5395
Whitney G 1990 Role of Water in the Smectite-to-Illite Reaction Clays and Clay Minerals
38(4) 343-350
Wu J and Lerner M M 1993 Structural thermal and electrical characterization of layered
nanocomposites derived from sodium-montmorillonite and polyethers Chemistry of
Materials 5(6) 835-838
Wu J Lin J Li G and Wei C 2001 Influence of the COOH and COONa groups and
crosslink density of poly(acrylic acid)montmorillonite superabsorbent composite on
water absorbency Polymer International 50(9) 1050-1053
Wu S and Shanks R A 2003 Conformation of polyacrylamide in aqueous solution with
interactive additives and cosolvents Journal of Applied Polymer Science 89(11) 3122-
3129
Wu S and Shanks R A 2004 Solubility study of polyacrylamide in polar solvents Journal of
Applied Polymer Science 93(3) 1493-1499
Wu S Shanks R A and Bryant G 2006 Properties of hydrophobically modified
polyacrylamide with low molecular weight and interaction with surfactant in aqueous
solution Journal of Applied Polymer Science 100(6) 4348-4360
Xia F Feng L Wang S Sun T Song W Jiang W and Jiang L 2006 Dual-responsive
surfaces that switch between superhydrophilicity and superhydrophobicity Advanced
Materials 18(4) 432-436
Yano K Usuki A Okada A Kurauchi T and Kamigaito O 1993 Synthesis and properties
of polyimide-clay hybrid J Polym Sci Part A 31 2493-2498
Young M H Moran E A Yu Z Zhu J and Smith D M 2009 Reducing Saturated
Hydraulic Conductivity of Sandy Soils with Polyacrylamide Soil Sci Soc Am J 73(1)
13-20
Zelazny L W He L and Vanwormhoudt A 1996 Charge Analysis of Soils and Anion
Exchange In D L Sparks ed Methods of soil analysis Part 3 Chemical methods Soil
Science Society of America American Society of Agronomy Madison Wis USA
1231-1253
Zeng Q H Yu A B and Lu G Q 2008 Multiscale modeling and simulation of polymer
nanocomposites Progress in Polymer Science 33(2) 191-269
Zeng Q H Yu A B Lu G Q and Paul D R 2005 Clay-based polymer nanocomposites
Research and commercial development Journal of Nanoscience and Nanotechnology
5(10) 1574-1592
Zysset M and Schindler P W 1996 The proton promoted dissolution kinetics of K-
montmorillonite Geochimica et Cosmochimica Acta 60(6) 921-931
123
APPENDIX A EXAMPLE CALCULATION FOR CLAY-TO-
POLYMER VOLUME RATIO
If we have 25g montmorillonite (ρ=25g0cm3) and 375g polyacrylamide (ρ=075g0cm3)
3
310
52
25cm
cmg
gV onitemontmorill
3
35
750
753cm
cmg
gV midepolyacryla
Thus clay-to-polymer volume ratio will be equal to 2
When clay-polymer nanocomposites are prepared using above amount of clay and polymer to set
clay content to 001 total volume of water to be used will be
mlcmg
g
contentclay
Mass
Vclay
clay
water 1000010
52
253
124
APPENDIX B PRESSURIZED PERMEABILITY
Sample Calculation
Measured flow rate Q = 10-5 cm3s = 61 x 10-7 in3s
Dynamic viscosity of water μ = 129 x 10-7 lbsin2 at 25degC
Sample diameter D = 1 in
Specimen length L = 15 in
Applied inlet pressure (driving pressure) Pa = 50 lbin2
Applied outlet pressure (atmospheric pressure) Pb = 147 lbin2
Unit weight of water γw = 624 lbft3 = 00361 lbin3
Cross-sectional area of the sample A = πD24 = 0785 in2
Hydraulic head due to the inlet pressure ha = Paγw = 138462 in
Hydraulic head due to the outlet pressure hb = Paγw = 40678 in
From Darcyrsquos law
L
hhAkQ ab )(
Thus hydraulic conductivity (permeability) k will be
)( ba hhA
LQk
= 1193 x 10-9 ins = 3029 x 10-9 cms
125
APPENDIX C DPD EQUILIBRATION
Figure C1 shows ltRg2gt12 of the simulated polymer sandwiched between two clay
surfaces as a function of pH at clay-to-polymer volume ratio 4 This confirms that each condition
in Figure 55 reached equilibrium at time step 500000
3
4
5
0 5 10 15
ltR
g2gt
12
Time (μs)
3
4
5
0 5 10 15
ltR
g2gt
12
Time (μs)
(a) (b)
3
4
5
0 5 10 15
ltR
g2gt
12
Time (μs)
3
4
5
0 5 10 15
ltR
g2gt
12
Time (μs)
(c) (d)
126
3
4
5
0 5 10 15
ltR
g2gt
12
Time (μs)
3
4
5
0 5 10 15
ltR
g2gt
12
Time (μs)
(e) (f)
35
45
55
0 5 10 15
ltR
g2gt
12
Time (μs)
35
45
55
0 5 10 15
ltR
g2gt
12
Time (μs)
(g) (h)
Figure C1 ltRg2gt12 vs simulation time for PAM with charge density of (a) 00 (b) 01 (c)
0143 (d) 02 (e) 025 (f) 033 (g) 05 and (h) 08 at clay-to-polymer volume ratio 4
127
APPENDIX D SCALING OF SIMULATED SYSTEM
As described in Section 52 one simulation length unit represents 4481 Aring From this
relationship the length of a polymer molecule composed of 236 beads with cutoff radius 2289 is
242 nm This represents a PAM molecule with molecular weight asymp 80000 gmol Similarly the
simulated surface composed of 22 beads times 22 beads represents a Mt surface with dimensions
of 225 nm x 225 nm Figure D1 shows a coarse-grained DPD bead a simulated PAM molecule
and a simulated Mt surface used in this study Figure D2 shows an example of unit conversion
between simulated values and real values
(a) (b) (c)
Figure D1 Schematic of simulated components used in this study (a) a DPD bead (b) a PAM
molecule and (c) a Mt surface
0
10
20
30
40
50
5 7 9 11 13
Inte
rlay
er S
paci
ng
pH
0
5
10
15
20
5 7 9 11 13
Inte
rlay
er S
paci
ng (
nm)
pH
(a) (b)
Figure D2 Simulated interlayer spacing results (a) in simulation unit (dimensionless) and (b) in
real unit (nm)
103 nm MW asymp 80000 gmol 225 nm
225 nm
128
VITA
Sungho Kim
EDUCATION PhD Civil and Environmental Engineering The Pennsylvania State University Dec 2011 Dissertation ldquoAn Engineered Clay Soil System Using Functional Polymersrdquo MSCE Civil and Environmental Engineering The Pennsylvania State University Aug 2008 Thesis ldquoPolyacrylamide-Treated Kaolin Clay A Fabric Studyrdquo BSE Environmental Science and Engineering (dual degree in Civil Engineering) Korea University Feb 2005
EXPERIENCE HIGHLIGHTS Graduate Research Assistant Aug 2006 ndash Dec 2011 Soil Particle Modification for the Development of Engineered Soil Materials
Polymer-Treated Clay Soils Engineered Soil Fabrics - Pore Fluid Chemistry and Mineral Mixtures Clay Particle Surface Modification Micro-Scale Soil Mechanics Multi-Scale Computer Simulation from Atomistic to Meso (MC MD DPD) NSF Research Project Jul 2010 ndash Dec 2011 PI Angelica M Palomino Project name Engineering a Modifiable clay ldquoTunablerdquo Polymer-Clay Composite Award number 1041995 Sponsor National Science Foundation Division of Civil Mechanical and Manufacturing
Innovation USA Undergraduate Research Assistant 2004 Project name Nonstructural Strategies for flood prevention Supervisor Ministry of Construction amp Transportation South Korea
(Since 2009 Ministry of Land Transport and Maritime Affairs) Republic of Korea Air Force Jan 1999 ndash Jul 2001 Detection Radar Operator Airman First Class
AWARDS AND FELLOWSHIPS Graduate Research Assistantship 2006 ndash 2011 Student Grant of the Clay Minerals Society 2011 Graduate Scholarship of the Construction Material Testing Laboratory 2009 2008 Undergraduate Research Assistantship 2004 Honors Scholarship 2004 2003 2002 Semester High Honor 2004 2003 2002
ii
The dissertation of Sungho Kim was reviewed and approved by the following
Angelica Maria Palomino
Assistant Professor of Civil and Environmental Engineering
Dissertation Advisor
Chair of Committee
Mian C Wang
Professor Emeritus of Civil and Environmental Engineering
James H Adair
Professor of Material Science and Engineering
Coray M Colina
Associate Professor of Material Science and Engineering
Peggy A Johnson
Professor of Civil and Environmental Engineering
Head of the Department of Civil and Environmental Engineering
Signatures are on file in the Graduate School
iii
ABSTRACT
Soil modification is widely accepted to improve soil properties in the field of
geotechnical and geoenvironmental engineering In the case of clay soil it is well known that the
clay fabric determines properties of the soil such as permeability shear strength and
compressibility Although clay fabric has successfully been modified using polymers they are
typically utilized as a static modification That is no further structural modification is expected
due to the irreversible interactions between the polymer and clay particles In this study
responsive polymers those for which conformational behavior is affected by the surrounding
environment such as pH and ionic strength are used as a clay fabric modifier such that the final
structures are ldquotunablerdquo Three studies were conducted to investigate (1) composite synthesis of
clay and responsive polymer (2) tunability of the composites at the meso-scale and (3)
computational studies of the tunability
First synthesis of bentonite-polyacrylamide nanocomposites was performed by
investigating variables such as synthesizing temperature clay content polymer molecular weight
pH and clay-to-polymer volume ratio X-ray diffraction was used to characterize effects of each
variable on the synthesis of nanocomposites with intercalated structure Optimum conditions for
the greatest quantity of intercalated structure were found at clay content of 0001 synthesis with a
low molecular weight polymer and clay-to-polymer volume ratio of 2
Second tunability of the synthesized nanocomposites was investigated using step-by-step
laboratory experiments (1) dynamic light scattering was used to confirm pH-responsiveness of
polyacrylamide in a bulk solution (2) spectroscopic ellipsometry was used to explore validity of
the pH-responsiveness after adsorption on a surface and (3) meso-scale characterization such as
specific surface area measurement swelling tests and pressurized permeability tests were
iv
performed to investigate whether the micro-scale conformational changes of the polymer lead to
modification of meso-scale engineering properties of clay-polymer composites
Thirdly a computational study on tunable behavior of the nanocomposites was performed
Since the conducted laboratory tests provide indirect insight into the behavior of the
nanocomposites a computational study provides further evidence supporting the tunable
characteristics of the nanocomposites Results from dissipative particle dynamics were in a good
qualitative agreement with experimental data
v
TABLE OF CONTENTS
LIST OF FIGURES viii
LIST OF TABLES xi
ACKNOWLEDGEMENTS xii
INTRODUCTION 1
11 Motivation 3
12 Objectives 4
13 Hypothesis 5
14 Expected Contributions 5
LITERATURE REVIEW 7
21 Nature of Montmorillonite 7
22 Responsive Polymers 14
23 Polyacrylamide-Montmorillonite Interactions and Associations 18
24 Synthesis of Clay-Polymer Nanocomposites 22
25 Characterization of Clay-Polymer Nanocomposites 24
251 X-ray Diffraction 24
252 Spectroscopic Ellipsometry 24
26 Computer Simulation 25
261 Overview 25
262 Dissipative Particle Dynamics 28
SYNTHESIS OF TUNABLE CLAY-POLYMER NANOCOMPOSITES 32
31 Introduction 32
32 Experimental Study 33
321 Materials 33
322 Synthesis of Clay-Polymer Nanocomposites ndash Solution Intercalation 36
323 Mixing and Drying Temperatures 37
324 Analysis Techniques 38
vi
33 Results and Discussion 39
331 Influence of Mixing and Drying Temperatures 40
332 Mineral Dissolution 43
333 Nanocomposite Synthesis Optimization 45
335 Dominant Factor for Intercalated Structure Formation 48
34 Conclusions 49
MANUPULATION OF SYNTHESIZED CLAY-POLYMER NANOCOMPOSITES 51
41 Introduction 51
42 Materials 53
421 Clay Minerals 53
422 Polyacrylamide 55
423 Synthesis of CPN and Microcomposites 56
43 Micro-Scale Characterization 57
431 Dynamic Light Scattering 58
432 Spectroscopic Ellipsometry 60
44 Meso-Scale Characterization 65
441 Specific Surface Area 66
442 Swelling Test 69
443 Hydraulic Conductivity Measurement 73
45 Linkage of Micro-Scale Behavior to Meso-Scale Property 79
46 Conclusions 82
COMPUTER SIMULATION 84
51 Introduction 84
52 Mapping of Length- and Time Scales 85
53 Polyacrylamide in an Aqueous Solution 87
54 Polyacrylamide Adsorbed on a Clay Particle 92
55 Interlayer Spacing Manipulation 95
56 Linkage of Micro-Scale Behavior to Meso-Scale Property 101
vii
57 Conclusions 103
CONCLUSIONS 105
Future Work 107
REFERENCES 109
Appendix A Example Calculation for Clay-to-Polymer Volume Ratio 123
Appendix B Pressurized Permeability 124
Appendix C DPD Equilibration 125
Appendix D Scaling of Simulated system 127
VITA 128
viii
LIST OF FIGURES
Figure 21 Mineral composition of dry Na+-montmorillonite used in the study Violet-colored
circles denote an exchangeable cation Na+ Basal spacing in the absence of the exchangeable
cations is 0913 nm for dry clay (van Olphen 1977) The thickness of a layer is 0654 nm
obtained using X-ray diffraction (Brindley and Brown 1980) 9
Figure 22 Electrical potential (Vx) of double layer compiled from Israelachvili (1991) Stumm
(1992) Santamarina et al (2001) and Mitchell (1993) 11
Figure 23 Hydrolysis reaction of polyacrylamide under basic conditions Compiled from
Barvenik (1994) Kurenkov (1997) and Myagchenkov and Proskurina (2004) 16
Figure 24 Hydrolysis reaction of cationic polyacrylamide under basic conditions Compiled
from Aksberg and Wagberg (1989) 17
Figure 25 Conformations for nonionic PAM under various pH and ionic strength conditions
(Michaels 1954 Klenina and Lebedeva 1983 Al-Anazi and Sharma 2002 Besra et al 2004)
Cyan and red monomers denote neutral monomer and charged monomer respectively Images
obtained from computer simulations (dissipative particle dynamics) 18
Figure 26 Schematic of various clay-polymer composites (a) phase-separated (b) intercalated
and (c) exfoliated structures 21
Figure 27 Time-length scale plot illustrating various computational methods at relevant time
and length scales Also shown are the basic interaction units in each method 26
Figure 28 Schematic of coarse-graining on (a) a polyacrylamide chain and (b) a Mt particle
The smaller spheres represent atoms the larger yellow and blue spheres are coarse-grained beads
Bond length (L) and bond angle (A) of the coarse-grained beads are also shown 28
Figure 31 Basal spacings for bentonite-nPAM nanocomposites synthesized at (a) 20degC (b)
60degC and (c) 85degC mixing temperatures 41
Figure 32 Basal spacings for bentonite-nPAM nanocomposites synthesized at 20degC and 110degC
drying temperatures with (a) low molecular weight PAM and (b) high molecular weight PAM 42
Figure 33 Si-NMR spectra for clay-polymer nanocomposites synthesized with (a) unadjusted
polymer solution and pH-adjusted polymer solutions (b) pHasymp4 and (c) pHasymp11 Al-NMR spectra
for clay-polymer nanocomposites synthesized with (d) unadjusted polymer solution and pH-
adjusted polymer solutions (e) pHasymp4 and (f) pHasymp11 44
Figure 34 XRD diffractogram for clay-polymer nanocomposites synthesized with (a)
unadjusted polymer solution and pH-adjusted polymer solutions (b) pH 4 and (c) pH 11 M
denotes a typical peak for Mt 45
ix
Figure 35 Impact of clay content on quantity of montmorillonite intercalated with PAM XRD
intensity was obtained from a peak corresponding to basal spacings greater than 145 Aring Error
bars were plotted based on the calculated standard deviation of three measured values 46
Figure 36 Impact of clay-to-polymer volume ratio on quantity of montmorillonite intercalated
with PAM XRD intensity was obtained from a peak corresponding to basal spacings greater than
145 Aring Error bars were plotted based on calculated standard deviation of three measured values
48
Figure 41 Scanning electron microscopy images for (a) bentonite and (b) CPN synthesized
using bentonite and PAM 57
Figure 42 Scanning electron microscopy images for (a) kaolinite and (b) microcomposite
synthesized using kaolinite and PAM 57
Figure 43 Hydrodynamic radius of montmorillonite and nPAM as a function of pH 59
Figure 44 Schematic of spectroscopic ellipsometry apparatus 62
Figure 45 Real part of the complex dielectric function spectra ( = 1 + i2) for PAM in
solutions with pH = 3 6 and 115 Also shown is 1 for H2O 63
Figures 46 (a) PAM thickness and (b) change in thickness as functions of time in solutions with
pH = 3 6 and 115 63
Figure 47 MB specific surface area of (a) microcomposites and (b) CPN as a function of pH
Clay-to-polymer volume ratio for (a) and (b) was 625 and 2 respectively 68
Figure 48 Swelling ratio of (a) microcomposites and (b) CPN as functions of pH and time The
dashed lines indicate the swelling ratios for the untreated (no polymer) materials 71
Figure 49 Schematic of pressurized permeability test apparatus with a picture of permeability
cell 75
Figure 410 Permeability of kaolinite-PAM microcomposites as a function of pH (a) gel-form
and (b) powder-form 76
Figure 411 Permeability of CPN as a function of pH (a) gel-form and (b) powder-form 78
Figure 412 Behavior comparison between hydrodynamic radius and adsorbed layer thickness of
PAM Hydrodynamic radius was measured using dynamic light scattering and adsorbed PAM
layer thickness was obtained from spectroscopic ellipsometry 80
Figure 413 Behavior comparison between adsorbed PAM layer thickness and swelling ratio
Adsorbed PAM layer thickness was obtained from spectroscopic ellipsometry and swelling ratio
was measured using water absorbency tests 81
Figure 51 ltRg2gt12 of the simulated polymer in water as a function of (a) charge fraction and (b)
pH 90
x
Figure 52 ltRg2gt12 vs simulation time for PAM with charge density of (a) 025 and (b) 033 91
Figure 53 (a) ltRg2gt12 of the simulated polymer adsorbed on a clay surface and (b) the polymer
layer thickness as a function of pH 93
Figure 54 Trajectories of the polymer and the clay surface (a) initial configuration and final
configurations with charge density of (b) 00 (c) 01 (d) 0143 (e) 02 (f) 025 (g) 033 (h)
05 and (i) 08 Cyan red yellow and black beads denote neutral monomer charged monomer
neutral clay and charged clay 94
Figure 55 (a) ltRg2gt12 of the simulated polymer sandwiched between two clay layers and (b) the
interlayer spacing as a function of pH at clay-to-polymer volume ratio 4 96
Figure 56 Trajectories of the polymer and the clay surfaces at clay-to-polymer volume ratio 4
(a) initial configuration containing two clay surfaces a PAM molecule and water and final
configurations with charge density of (b) 00 (c) 01 (d) 0143 (e) 02 (f) 025 (g) 033 (h)
05 and (i) 08 Cyan red yellow and black beads denote neutral monomer charged monomer
neutral clay and charged clay 98
Figure 57 (a) ltRg2gt12 of the simulated polymer sandwiched between two clay layers and (b)
the interlayer spacing as a function of pH at clay-to-polymer volume ratio 2 100
Figure 58 Swelling ratio and simulated interlayer spacing for CPN as a function of solution pH
Diamond and square symbols denote the swelling ratio and the simulated interlayer spacing
respectively The CPN was synthesized at clay-to-polymer volume ratio 2 102
Figure C1 ltRg2gt12 vs simulation time for PAM with charge density of (a) 00 (b) 01 (c)
0143 (d) 02 (e) 025 (f) 033 (g) 05 and (h) 08 at clay-to-polymer volume ratio 4 126
Figure D1 Schematic of simulated components used in this study (a) a DPD bead (b) a PAM
molecule and (c) a Mt surface 127
Figure D2 Simulated interlayer spacing results (a) in simulation unit (dimensionless) and (b) in
real unit (nm) 127
xi
LIST OF TABLES
Table 31 Chemical composition of the sodium bentonite used in this study (Supplier data) 35
Table 32 Properties of the sodium bentonite used in this study 35
Table 33 Characteristics of polyacrylamides used in this study 35
Table 34 Test matrix and resulting basal spacing with XRD intensity 40
Table 41 Chemical composition of clay minerals used in this study 54
Table 42 Properties of clay materials used in this study 54
Table 43 Characteristics of polyacrylamides used in this study 55
Table 51 Scaling relations used in this study (Fuchslin et al 2009) 86
Table 52 DPD parameters used in this study 88
Table 53 Force constants α used in this study 88
xii
ACKNOWLEDGEMENTS
Throughout my work on this PhD research I have been fortunate to have been helped by
many people making the completion of this research possible Of these people the first I would
like to appreciate is my advisor Dr Angelica Palomino She gave me the flexibility in selecting
any topic which I was interested in allowing me to in-depth study the fundamental study I have
spent the last 3 years working on I would like to thank her also for her support guidance
availability and insights Since I met Dr Palomino my advice to students looking for a graduate
advisor has simply been ldquoFind someone like Dr Palominordquo
I would like to thank all of my committee members Dr Mian Wang Dr James Adair
and Dr Coray Colina who helped guide me when I needed extra assistance They have spent a
great deal of time discussing ideas with me and keeping me on the right track
I owe many thanks to the following people who helped me accomplish this research Dr
Nicholas Podraza and Mr Michael Motyka helped me conduct spectroscopic ellipsometry
Professor Evangelos Manias helped me develop idea of this research and shared his expertise on
clay-polymer nanocomposites and computer simulations Dr Martin Lisal Dr Gregory Larsen
and Ms Kristin Patterson shared their knowledge on computer simulations Ms Nicole
Wondering with an expertise of X-ray diffraction shared a lot of knowledge and techniques with
me Ms Maria Klimkiewicz helped me do scanning electron microscopy Mr Daniel Fura a
technical support supervisor of CITEL helped me perform all laboratory experiments
I acknowledge the National Science Foundation (NSF) that provided funding for a part of
this study This work is as a result of partial support from the NSF under grant 1041995
My family has provided me with unconditional support and advice which have made my
completion of this work possible My wife Soojin Ahn has always been willing to lend an ear
Thank you all for all of your help and friendship
Chapter 1
INTRODUCTION
Not all soils inherently have desirable geotechnical and geoenvironmental engineering
properties Physical andor chemical processes are often manipulated to obtain a target
performance of soil systems For example grains can be added to grains with different
morphologies as in diatom-kaolin clay mixtures to influence the mixture flocculation liquid
limit and plasticity water retention and even solubility (Palomino et al 2011) It is well known
that clay particle arrangement the so-called clay fabric varies with the bulk fluid chemistry such
as pH ionic concentration and temperature (van Olphen 1977 Theng 1979 Mitchell 1993
Lagaly 2006) Clay fabric alteration leads to changes in macro-scale clay properties such as
permeability (Mitchell 1956 Suarez et al 1984) shear strength (Sridharan and Prakash 1999)
compressive strength (Nasser and James 2006) and compressibility (Gajo and Maines 2007) In
addition the use of polymer at different concentrations molecular weights andor ionic types
alters the bulk fluid chemistry manipulating clay fabric (Kim and Palomino 2009) Polymer-
treated clay composites so-called clay-polymer composites may lead to enhancements of overall
clay material characteristics such as shear strength permeability clay swelling and contaminant
barrier properties (van Olphen 1977 Theng 1979 Hjelmstad 1990 Lo et al 1997 Inyang and
Bae 2005) While each of these approaches improves the soil properties these methods are
essentially permanent that is irreversible Irreversible interactions of polymer molecules with
clay mineral surface limits further modifications of the clay-polymer composites (Nadler et al
1992)
The use of responsive polymers in which the conformation varies with external
environment triggers will lead to a new family of clay-polymer composites Since the
conformation of a given responsive polymer varies with the external environment for example
2
bulk solution pH responsive polymers may provide the capacity to modify in-situ properties of
resulting clay-polymer composites after polymer placement That is the interlayer andor
interparticle spacing of composites synthesized from responsive polymers can be manipulated
through changes in the surrounding fluid pH ionic concentration temperature and electric field
For example clay-polymer composites synthesized using a pH responsive polymer may be
capable of further modification by exposing the composites to alternate pH conditions
Furthermore the use of water-soluble responsive polymer can have the potential for large-scale
in-situ modification due to minimum energy demand In order to maximize the potential for
interlayer andor interparticle spacing modification the optimized design of these composites is
an intercalated structure in which polymer molecules are adsorbed onto both the particle surface
and interlayer surface Thus both interparticle and interlayer distances of the final composite
have the ability to be modified through exposure to various pH
Although soil modification using polymers or surfactants have been previously
investigated (Gardner and Arias 2000 Bhardwaj et al 2007 Story et al 2009 Young et al
2009) thus far responsive polymers have not been addressed for this purpose Efforts to produce
a material with controllable morphology have recently been reported with the use of responsive
polymers ie polymers which are responsive to external environmental conditions such as pH
(Feil et al 1992 Xia et al 2006) ionic strength (Wu and Shanks 2003) temperature (Bae et al
1990) and electrical potential (Kim et al 2006) Some pH-responsive polymers such as
polyacrylamide and poly(acrylic acid) have the added benefit of high solubility in water The
combination of pH- or ionic concentration responsiveness and high solubility is advantageous for
producing large-scale quantities of clay-polymer composite material with the ability to be
ldquotunablerdquo in-situ thus creating a novel type of engineered soil
In spite of the considerable number of studies of clay-polymer composites clay
intercalation by polymer is not yet fully understood Due to many factors affecting the process
3
and difficulties of developing tools capable to monitor the process quantifying final morphology
and properties of the final clay-polymer composite is very challenging In addition
characteristics of clay minerals and the interactions responsible for meso-scale properties
occurring at the length scales of monomers approximately a billionth of a meter limit probing
with current experimental techniques Thus computer simulation and modeling may play an
ever-increasing role in designing and predicting material properties and designing such
experimental work For clay-polymer composites computer simulation and modeling are
especially useful in addressing the thermodynamics and kinetics of the formation of composites
the hierarchical characteristics of the structure and dynamics the dependence of polymer
rheological behavior on the addition of clay particles and the molecular origins of the
reinforcement mechanisms
11 Motivation
The motivation for this study can be summarized as follows
(1) Irreversible interactions of polymer with clay limits further modifications of clay-
polymer composites
(2) Commonly used techniques including melt intercalation and in-situ intercalation to
produce clay-polymer composites with intercalated structure demands extra energy
thus limits large-scale production which is necessary for geotechnical and
geoenvironmental applications
(3) With current experimental technologies it is very challenging to quantitatively
characterize polymer molecules in the interlayer space of clay minerals
4
12 Objectives
Although many studies of soil modification with the use of polymers and efforts to
produce a material with controllable morphology have been previously addressed a study of
large-scale clay modification with the use of responsive polymers has not been reported Micro-
andor nano-level conformational changes of responsive polymers as a function of external
environment triggers may result in changes in micro- and meso-scale properties In addition the
use of water-soluble polymers may provide the potential for in-situ large-scale production This
work includes the use of water-soluble responsive polymers as a viable tool for creating a new
family of clay-polymer composites The optimum condition for creating clay-polymer
composites while maximizing the amount of intercalated structure formation was investigated
experimentally Once the optimum conditions were found further experimental and
computational investigations were conducted to determine whether or not the controllable
characteristics of the responsive polymer results in changes in micro- and meso-scale properties
of the clay-polymer composites ie ldquotunablerdquo clay-polymer nanocomposites
The objectives of this study are (1) to create ldquotunablerdquo clay-polymer nanocomposites
using an expandable clay (montmorillonite) and a water-soluble responsive polymer
(polyacrylamide) and to develop an optimized procedure for the future large-scale production of
in-situ modifiable engineered clay soils (2) to link the micro-scale response of the polymer in
the synthesized clay-polymer composites to the meso-scale properties of the system such as
specific surface area swelling potential and permeability and (3) to perform a computational
analysis supporting the experimental findings X-ray diffraction will be used to investigate the
formation of intercalated structure Nuclear magnetic resonance will be used to explore the
effects of strong acidic and basic solutions on the mineral dissolution Dynamic light scattering
and spectroscopic ellipsometry will be used to characterize the controllable morphology of the
clay-polymer composites at the micro-scale Specific surface area swelling potential and
5
hydraulic conductivity will be measured to characterize the controllable morphology at the meso-
scale Coarse-grained atomistic computer simulation technique will be utilized to support the
experimental findings
13 Hypothesis
This study is about synthesizing a new family of clay-polymer composites characterizing
and exploring micro- and meso-scale behavior of the composite material The specific questions
to be addressed in this study are
(1) Is it possible to synthesize a new family of clay-polymer composites ldquotunablerdquo clay-
polymer nanocomposite using an expansive clay and a responsive polymer If so
what is the optimum condition for the synthesis
(2) Can tunability of the new clay-polymer composite be characterized using current
experimental techniques such as spectroscopic ellipsometry
(3) Does the tunability at the micro-scale result in property changes at the meso-scale
(4) Can computer simulation support the experimental findings
14 Expected Contributions
Clay-polymer composites have proven effective for improving material properties
However the use of polymer has been limited in the field of geotechnical and geoenvironmental
engineering for many reasons including cost inefficiency and difficulties in handling Since this
study shows a way to solve the aforementioned problems it is expected that the use of polymer
materials in the geotechnical and geoenvironmental engineering will become more common In
particular it was found that an engineered clay soil with an ability for further modification has
the potential for many state-of-the-art applications by showing cost-effective procedures for
6
synthesis micro- and meso-scale characterizations and a way of overcoming limitations of
quantitative characterization ie introduction of computer simulation
7
Chapter 2
LITERATURE REVIEW
Much can be learned from the existing literature about the nature of clays and clay
surfaces polymers and even the interaction between the two materials Yet very little is known
about the behavior of responsive clay-polymer composites Systematic studies will be carried out
to investigate clay-polymer composite swelling behavior the conformational behavior of a
selected polymer interactions between the clay and polymer composite synthesizing techniques
and meso-scale computer simulation techniques Topics addressed in this chapter include (1) the
nature of montmorillonite (2) the concept of responsive polymers (3) polyacrylamide-
montmorillonite interactions and associations (4) preparation and (5) characterization of clay-
polymer composites and (6) meso-scale computer simulation
21 Nature of Montmorillonite
Montmorillonite (Mt) is a member of the smectite mineral group It has a crystalline
structure consisting of two silica tetrahedral sheets and one aluminummagnesium octahedral
sheet (21 layered phyllosilicate) The tetrahedral sheets and octahedral sheet are strongly held
together by shared oxygen atoms ndash covalent bonds ndash forming a single layer The thickness of the
layers is on the order of 1 nm and aspect ratios are typically 100 to 1500 Various cation
substitutions such as Si4+ by Al3+ in tetrahedral sheets and Al3+Fe3+ by Mg2+Fe2+ in octahedral
sheets ie isomorphic substitution can occur leading to a net negative charge on the layers (van
Olphen 1977 Brindley and Brown 1980 Newman 1987) The resulting charges are
counterbalanced by exchangeable cations such as Na+ K+ Ca2+ Mg2+ and organic ions While
some charge balancing cations are located on the external crystallite surface the majority of
exchangeable cations are found in the interlayer space (Giannelis et al 1999 Luckham and Rossi
1999)
8
Mt has the idealized structural formula My+∙nH2O(Al2-yMgy)Si4O10(OH)2 where M is a
monovalent charge compensating cation in the interlayer and y is the degree of isomorphic
substitution ranging from 50 to 130 represented as the cation exchange capacity (CEC cmolkg)
(van Olphen 1977 Brindley and Brown 1980 Giannelis et al 1999 Ray and Okamoto 2003)
The mineral composition of Mt compensated with sodium ions Na033[(Al167Mg033)Si4O10(OH)2]
is shown in Figure 21 Weak van der Waals attraction forces as well as a high repulsive potential
on the layer surface induced by isomorphic substitution allow water molecules and cations to
penetrate such that the interlayer spacing expands This is the basis for swelling behavior (van
Olphen 1977 Israelachvili 1991 Mitchell 1993)
Swelling behavior consists of two stages (van Olphen 1977) (1) crystalline or short-
range swelling and (2) osmotic or long-range swelling When dry Mt is first exposed to moist
conditions the interlayer cations become hydrated with water molecules The layers may
separate from 96Aring up to 22Aring (Theng 1979) The adsorption energy of the water layers on the
clay surface is the driving force in this stage of swelling The swelling behavior depends on the
nature of the interlayer cations such as the capacity of cations to retain the polar molecules within
the interlayer space and the location of the layer charge (van Olphen 1977 Newman 1987
Berend et al 1995 Whitley and Smith 2004 Ferrage et al 2005 Meunier 2005 Douillard et
al 2007) For example the interlayer spacing for Na+-montmorillonite increases from 96 Aring to
125 Aring when hydrated with one water layer under low water content to 156 Aring when hydrated
with two water layers and to 188 Aring when hydrated with three water layers under high water
content (Berend et al 1995 Chang et al 1995 Ferrage et al 2005)
On the other hand swelling does not occur when the layer charge is zero where no
cation-hydration occurs or when the layer charge is too high resulting in large electrostatic
attraction forces which prevent the penetration of water molecules (Meunier 2005)
9
Figure 21 Mineral composition of dry Na+-montmorillonite used in the study Violet-colored
circles denote an exchangeable cation Na+ Basal spacing in the absence of the exchangeable
cations is 0913 nm for dry clay (van Olphen 1977) The thickness of a layer is 0654 nm
obtained using X-ray diffraction (Brindley and Brown 1980)
Mt saturated with polyvalent cations typically swells less than when saturated with monovalent
cations because electrostatic attraction between a polyvalent cation and layer surface is large
enough to offset the double layer repulsion (Berend et al 1995 Luckham and Rossi 1999 Salles
Si
O
Al
Mg
Na
basal
spacing
096 nm
to ~ infin
Octahedral
sheet
Tetrahedral
sheet
Interlayer
space
Tetrahedral
sheet
10
et al 2007) In addition the electrostatic forces between the divalent cations and the layer
surface are greater than hydration forces of the divalent cations (Ashmawy et al 2002)
Mt saturated with small monovalent cations such as Li+ and Na+ can absorb more water
Osmotic forces derived from the relatively high ionic concentrations between the layers allow
water molecules to keep penetrating and thus leads to osmotic swelling (Swartzen-Allen and
Matijevic 1974 van Olphen 1977) Due to the difference in hydration energy swelling
increases for Mt containing counterions in the order of Li+ gt Cs+ Na+ gt Rb+ gt K+ (Newman
1987 Berend et al 1995 Hensen et al 2001 Salles et al 2007) This osmotic stage of swelling
is accompanied by large volume changes ndash in excess of 40Aring ndash of the interlayer spacing and is
limited by frictional forces of the particle surface due to the formation of edge-to-face particle
associations (van Olphen 1977 Theng 1979) As water content increases the layers swell
laterally as well as longitudinally (Fukushima 1984)
Near the mineral surface hydrated counterions are attracted to the net charge of the layer
surface according to Coulombic attraction These counterions diffuse away from the mineral
surface due to water polarity and thermal agitation The diffusion range is limited by the
attraction force between the particle or layer surface and the hydrated counterion and by the
electrical potential of the particle or layer The counterion concentration decreases to the bulk
fluid concentration as a function of distance from the surface The electrical double layer consists
of the Stern layer and the Gouy-Chapman diffuse layer as shown in Figure 22 The outer
boundary of the Gouy-Chapman diffuse layer is not well-defined (van Olphen 1977 Stumm
1992) The magnitude of surface charge is represented as the Stern potential and zeta potential
The Stern potential is represented by the pH value at which the total net surface charge is zero
while the zeta potential is depicted as zero electrophoretic mobility of a particle in an electric
field (Sposito 1998) The difference between Stern potential and zeta potential implies the
amount of diffuse ions entrapped within the shear plane of the electric double layer For example
11
Figure 22 Electrical potential (Vx) of double layer compiled from Israelachvili (1991) Stumm
(1992) Santamarina et al (2001) and Mitchell (1993)
the experimentally determined value of surface potential for one type of Mt is approximately 128
mV the zeta potential is found to be 78 mV and the distance from the surface to the shear plane
is 05 nm (Theng 1979) The thickness of the double layer (1κ in meters) depends on
(2)
(3)
(1)
Surface potential
Vst (Stern potential)
ζ (zeta potential)
Vst e Vx = Vstmiddote-x
κ (double layer thickness) distance x
(1) inner sphere complexes
(2) outer sphere complexes
(3) diffuse ion swarm
shear
plane
Stern
layer
Gouy-Chapman diffuse layer
12
permittivity of the surrounding fluid temperature bulk fluid concentration and ionic valence
(Stumm 1992 McBride 1994)
2
0
2
0
2
1
zc
T
Ne
k
av
B
where kB is Boltzmannrsquos constant (138 x 10-23 JK) ε0 is the permittivity of free space (8854 x
10-12 C2J-1m-1) e is the electron charge (1602 x 10-19 C) Nav is Avogadrorsquos number (6022 x 1023
mol-1) ε is the dielectric constant of the bulk fluid (785 for water at 25degC) T is absolute
temperature (K) c0 is bulk fluid (electrolyte) concentration (molm3) and z is the ion valence
Random movements of hydrated counterions in and out of the double layer induces a change in
the thickness as a function of thermal agitation and the availability of counterions (van Olphen
1977 Hunter 1993 Santamarina et al 2001)
Clay surface charge density consists of (Sposito 1989 Stumm 1992 Sposito 1998) (1)
permanent structural charges (σ0) resulting from isomorphic substitution or broken bonds in the
clay lattice (2) net proton charges (σH) due to protonationdeprotonation ie pH-dependent (3)
inner-sphere surface complex charges (σIS) and outer-sphere surface complex charges (σOS) and
(4) adsorbed ions in the diffuse double layer (σD) which have a similar mobility to the ions in the
bulk fluid The inner-sphere surface complexes include no water molecules between the clay
surface and the cation while the outer-sphere surface complexes contain at least one water
molecule in between Protonation and deprotonation of the mineral surface occurs through
potential determining ions such as H+ and OH- Other ions may form inner- and outer-sphere
complexes through adsorption Cation adsorption is especially significant because it alters the
surface charge on O2- termination sites depending on the concentration valence and size of the
ions Charge on a silica tetrahedral basal face (Si4O10) of smectite minerals can vary
approximately from 03 to 065 ie one O2- termination site every 028 ~ 06 nm2 (Meunier
2005) The charge can be calculated as (Zelazny et al 1996 Meunier 2005)
13
Charge = CEC (cmolkg) x mass of half unit cell (g) x 10-5
For example if a Mt has half unit cell formula Na033[(Al167Mg033)Si4O10(OH)2] and CEC=808
cmolkg layer charge of the mineral is 03
In 21 minerals such as Mt the permanent structural charge (σ0) is significant due to a
large amount of isomorphic substitution Since the permanent structural charges are pH-
independent all pH-dependent charges are typically on the particle edges where hydroxyl groups
such as Al-OH12- and Si-OH are dominant due to broken bonds of the tetrahedral and octahedral
layers While Mt theoretically has pH-dependent charges at the particle edges these charges
represent less than 5 of the total surface charge (Borchardt 1989) In addition to the particle
edges particle faces were also reported to be pH-dependent representing as much as 20 of the
face surface charge (Schindler 1981 Mohan and Fogler 1997)
The point of zero charge (PZC) is defined as pH value where total net surface charge (σP
= σ0 + σH + σIS + σOS) is zero (ie Stern potential is zero) The isoelectric point (IEP) is reached
when the electrophoretic mobility of a particle in an electric field is zero (ie zeta potential is
zero) Due to the diffuse nature of the ion swarm the PZC is typically not equal to the IEP
(Sposito 1998) Both PZC and IEP of a clay particle depend on the availability of OH-
termination sites along the particle surface fluid pH and the dominant counterion valence and
concentration in the fluid (Stumm 1992 Santamarina et al 2001) The presence of significant
permanent structural charges in Mt results in IEP less than pH 25 (Parks 1967 Drever 1997) or
even undetected IEP (Nishimura et al 1994 Tombacz et al 2001) Therefore the surface
charge of 21 mineral particles may remain negative even at very low pH
In general pore fluid chemistry such as pH and ionic concentration significantly affects
Mt particle arrangement (van Olphen 1977 Lagaly 1989 Mitchell 1993 Santamarina et al
2002a) In pH ranging from 4 to 11 edge-to-edge flocculation is observed at NaCl
concentrations greater than 5x10⁻³ molL and face-to-face aggregation is observed at NaCl
14
concentration greater than 025~03 molL (Rand et al 1980 Chen et al 1990) At pH below 4
the particle edges become positively charged while the particle faces still remain negatively
charged inducing electrostatic attraction between the edges and faces ie edge-to-face
flocculation (Lagaly 1989 Mohan and Fogler 1997) The edge-to-face flocs remain unsettled in
Mt suspensions which differs from that in kaolinite suspensions
When exposed to extreme pH conditions clay particles are subjected to irreversible
dissolution affecting the structure and structural charges (σ0) (Carroll and Starkey 1971 Shinoda
et al 1995 Zysset and Schindler 1996 Santamarina et al 2002a Steudel et al 2009) At low
pH the protonation of OH- in the octahedral layer and of O2- in the tetrahedral layer results in a
release of SiO2 At high pH the deprotonation of Si-OH and the formation of Si-O- in the
tetrahedral layer results in a release of Si The dissolution behavior is mainly observed at the
edge sites and the dissolution rate depends on both pH and ionic concentration Si dissolution
rates range from 3x10⁻⁷ to 2x10⁻⁶ molgmiddoth at pH 1 (Zysset and Schindler 1996) In addition to the
dissolution behavior a solution with high pH and ionic concentration may convert smectite into
illite at room temperature (Whitney 1990 Bauer and Velde 1999)
22 Responsive Polymers
Polymers are large molecules macromolecules composed of smaller units called
monomers Polymer characteristics vary with the arrangement of those monomer units andor the
various types of functional groups resulting in unique properties (Painter and Coleman 1997)
For example the chain conformation of a pH-responsive polymer such as poly(acrylic acid) or
polyacrylamide containing either an acidic (COOH) or a basic (NH2) functional group in the
polymer network varies with bulk solution pH (Michaels and Morelos 1955 Feil et al 1992
Chen and Hoffman 1995 Al-Anazi and Sharma 2002 Liu et al 2008)
15
Responsive polymers are the result of efforts to produce a material with controllable
morphology Responsive polymers are responsive to external environmental conditions such as
pH (Siegel and Firestone 1988 Brannon-Peppas and Peppas 1991 Feil et al 1992 Gudeman
and Peppas 1995 Al-Anazi and Sharma 2002 Xia et al 2006) ionic strength (Flory 1953
Gudeman and Peppas 1995 Al-Anazi and Sharma 2002 Wu and Shanks 2003) temperature
(Bae et al 1990 Park and Hoffman 1992) electric potential (Tanaka et al 1982 Kim et al
2006) and photo-irradiation (Suzuki and Tanaka 1990) Clay-polymer composites synthesized
with expansive clay (montmorillonite) and responsive polymer (polyacrylamide) were also
reported to show such controllable morphologies due to the responsiveness of polymer (Gao and
Heimann 1993)
The conformation of such responsive polymers varies with external environment triggers
Polyacrylamide polymer chains tend to have coiled conformation at pH below 105 and to have
extended conformation at pH above 105 (Besra et al 2004) Poly(acrylic acid) polymer chains
tend to have coiled conformation at pH below 425 and to have extended conformation at pH
above 425 (Al-Anazi and Sharma 2002) These pH-responsive polymers have the added benefit
of high solubility in water The combination of pH- or ionic concentration responsiveness and
high solubility is advantageous for producing large-scale quantities of clay-polymer composite
material with the ability to be ldquotunablerdquo in-situ thus creating a novel type of engineered soil
Polyacrylamide (PAM) is a widely used water-soluble polymer which is synthesized by
free radical polymerization of acrylamide derived from acrylonitrile by either bioconversion or
catalytic hydrolysis (Kulicke et al 1982 Brandrup and Immergut 1989 Barvenik 1994
Kurenkov 1997 Huang et al 2001 Wu and Shanks 2004) Polyacrylamide is a linear
amorphous odorless hard glassy white polymer with a very low toxicity The preferential
reactivity ratios of acrylamide allow a wide range of molecular weights further functionalizations
and charge densities A colorless crystalline acrylamide contains two functional groups a
16
a
CH
NH2
O = C
CH2
reactive double bond and an amide group The amide group is reactive in changing the ionic
character or in cross-linking the polymer A polyacrylamide solution generally undergoes
reaction characteristics of an aliphatic amide group most importantly hydrolysis
Hydrolysis can occur under acidic or basic conditions and is reversible (Kheradmand et
al 1988 Kurenkov 1997) The acidic hydrolysis reaction of the amide group is very slow On
the other hand basic hydrolysis of polyacrylamide is a rapid reaction and incorporates acrylate
groups (COO-) into macromolecules as shown in Figure 23 The degree of hydrolysis is
influenced by temperature reaction time and the concentration of salts such as NaCl and KCl
The maximum degree of hydrolysis is 70~80 for polyacrylamide due to reduced reactivity of
the amide groups and depends on the effects of the neighboring carboxylate groups as well as the
conformation of polyacrylamide (Kurenkov 1997 Huang et al 2001) The rate of hydrolysis for
cationic polyacrylamides increases as pH or temperature increases and as the mole ratio of
cationic functional groups decreases (Aksberg and Wagberg 1989) Charge density on cationic
polyacrylamide decreases as the hydrolysis reaction (Figure 24) progresses
+ bNaOH rarr + bNH3
Figure 23 Hydrolysis reaction of polyacrylamide under basic conditions Compiled from
Barvenik (1994) Kurenkov (1997) and Myagchenkov and Proskurina (2004)
CH2
a-b
CH
NH2
O = C
CH2
b
CH
Na+
O = C
O-
17
a
CH
NH2
O = C
CH2 CH2
b
CH
N+
O = C
O
(CH2)2
(CH3)3
Cl-
+ OH- rarr +
Figure 24 Hydrolysis reaction of cationic polyacrylamide under basic conditions Compiled
from Aksberg and Wagberg (1989)
When a solution of polyacrylamide with molecular weight above 1 x 10⁶ is kept at room
temperature the intramolecular hydrogen bonds begin to collapse and the polymer degrades The
macromolecules undergo conformational changes to a more compact flexible coil conformation
having a smaller hydrodynamic volume thus decreasing the overall viscosity (Kulicke et al
1982) Three types of degradation may occur in aqueous solution of polyacrylamide (Kulicke et
al 1982 Huang et al 2001) (1) thermal degradation which occurs slightly at 50˚C and
significantly at 75˚C (2) mechanical degradation for which the viscosity decreases with
increasing high speed stirring of the aqueous polymer solution and (3) oxidative degradation
which occurs depending on pH The degradation can be facilitated by free radicals ionizing
radiation light heat shear and stirring speed of aqueous polyacrylamide solution Careful
handling of the solution as well as the addition of sodium nitrile or thio compounds can inhibit
the degradation of polymers (Kulicke et al 1982 Kurenkov 1997 Huang et al 2001)
PAM is pH-responsive polymer due to its bias hydrolysis behavior under acidic or basic
conditions The hydrolysis reaction of the amide group on PAM molecules occurs very slowly
under acidic conditions while it occurs rapidly under basic conditions The hydrolysis reaction
incorporates acrylate groups (COO-) introducing negative charges on the molecules The
repulsive forces between hydrolyzed groups repel monomer units of PAM expanding the whole
CH2
n-m
CH
NH2
O = C
CH2
m
CH
Na+
O = C
O- n-m
CH2 CH2
OH N+
(CH3)3 Cl-
18
Figure 25 Conformations for nonionic PAM under various pH and ionic strength conditions
(Michaels 1954 Klenina and Lebedeva 1983 Al-Anazi and Sharma 2002 Besra et al 2004)
Cyan and red monomers denote neutral monomer and charged monomer respectively Images
obtained from computer simulations (dissipative particle dynamics)
chain leading to extended conformation Therefore the polymer molecule has a contracted coil
conformation at acidic pH and an extended conformation at basic pH as shown schematically in
Figure 25 In addition to pH-responsive behavior PAM is responsive to ionic concentration
(Klenina and Lebedeva 1983 Brondsted and Kopecek 1992 Samanta et al 2010) With
decreasing ionic strength the conformation varies from extended to coiled Note that the Flory-
Huggins parameter (χ) for PAM is 048plusmn001 in water at 30degC (Huang et al 2001)
23 Polyacrylamide-Montmorillonite Interactions and Associations
Polymers have been observed to adsorb onto clay mineral surfaces via van der Waals
forces electrostatic interactions and hydrogen bonding interactions (van Olphen 1977 Theng
1979) Polymer adsorption on a clay particle surface alters the surface properties of the particle
such as surface charge and hence interparticle forces Polymer characteristics at the solid-liquid
Contracted coiled
conformation at pH lt 4
Partially coiled
conformation at pH asymp 6
Extended conformation
at pH gt 105
Increasing extended conformation with increasing pH and with decreasing ionic strength
19
interface play an important role The interaction with clay particles can be complex due to
electrostatic forces chemical bonding and other forces operating simultaneously Understanding
the interplay and relative significance of each of these phenomena is critical to the interpretation
of a given polymerrsquos affect on a clay system
Polyacrylamide (PAM) has been observed to irreversibly adsorb onto clay mineral
surfaces and external surfaces of soil aggregates (Stutzmann and Siffert 1977 Gao and Heimann
1993 Lochhead and McConnell Boykin 2002) Interactions between clay particles and polymer
molecules result from (1) polymer bridging (2) charge neutralization or compensation (3)
complex formation between clay particle surfaces and polymer molecules or (4) a combination of
these mechanisms (Mortland and Brady 1970 van Olphen 1977 Pefferkorn et al 1987 Lee et
al 1991 Gao and Heimann 1993 Laird 1997 Dobias et al 1999 Mpofu et al 2003 Deng et
al 2006) Polymer bridging plays a major role in the presence of nonionic polymers (Theng
1982 Laird 1997 Hogg 1999 Deng et al 2006) while charge neutralization plays a major role
in the presence of cationic polymers
A nonionic polyacrylamide molecule strongly interacts with the clay surface via polymer
bridging reducing the overall negative charge through alteration of the electrical double layer
repulsive force (Fleer et al 1972 Carasso et al 1997 Besra et al 2002) A polymer molecule
can be adsorbed onto clay particles simultaneously bridging more than one particle The amide
group specifically the carbonyl oxygen (C=O) of PAM bonds to the edge site (Al-Al-OH or Al-
Mg-OH group) through hydrogen bonding Hydrogen bonding between the carbonyl group and
the face site is favored under acidic pH (Lochhead and McConnell Boykin 2002) Hydrogen
bonding also occurs between the oxygen atoms of clay and the protons of the amide group
(Haraguchi and Takehisa 2002) Hydrophobic bonding occurs between the hydrophobic
backbone (CH2-CH) of PAM and the hydrophobic basal face (ie uncharged sites on the siloxane
face) Exchangeable cations on the clay surface are bridged to the carbonyl oxygen of PAM
20
through ion-dipole interaction ie complex formation (Mortland and Brady 1970 Haraguchi and
Takehisa 2002 Ruiz-Hitzky and van Meerbeek 2006) Water molecules can bridge the
exchangeable cation together with the carbonyl oxygen through hydrogen bonding between the
water molecule and the carbonyl group and ion-dipole interaction between the water molecule
and the exchangeable cation
Polymer bridging can be modified by the molecular weight of the polymer the
conformation (ie coiled or extended) of polymer molecules and preexisting exchangeable
cations on the clay particle surface The conformation of PAM molecules in aqueous systems is
pH-dependent At pH = 6 both cationic and nonionic PAM molecules are neither fully extended
nor fully coiled that is intermediate conformation (Besra et al 2004) The importance of the
exchangeable cations in terms of ion-dipole interaction increases in the order Na+ K+ lt Ca2+
Mg2+ lt Al3+ lt Cu2+ Ni2+ (Deng et al 2006)
Coulombic attraction is the dominating bonding mechanism between the clay surface and
cationic PAM molecules (van Olphen 1977 Theng 1979 Laird 1997 Mpofu et al 2003) The
positively charged trimethyl ammonium groups (NR3) of cationic PAM are attracted to the
negatively charged sites along clay particle surface At the critical coagulation concentration
(CCC) of PAM all charges on the mineral surface are compensated Once the CCC is exceeded
aggregation occurs through van der Waals attraction The charged groups of cationic PAM may
also adsorb onto more than one particle and so may also contribute to polymer bridging
Cationic PAM molecules may also form an adsorption complex when a concentration of PAM
greater than the critical coagulation concentration is used The hydrophobic backbones (CH2-
CH) of the excess cationic PAM molecules link together through van der Waals attraction
Three different types of clay-polymer composites may be obtained when a clay particle is
associated with a polymer molecule in solution (Giannelis et al 1999 Alexandre and Dubois
2000 Ray and Okamoto 2003 Mai et al 2006 Ruiz-Hitzky and van Meerbeek 2006) (1)
21
phase-separated (microcomposite or conventional composite) (2) intercalated and (3) exfoliated
structures as shown in Figure 26 The phase-separated structure does not include polymer
intercalation into the interlayer space and thus interactions between a clay particle and a polymer
molecule lead to particle-level composites or microcomposites Properties of the phase-separated
composites are nearly the same as a traditional clay-polymer mixture Intercalated structure
develops when an extended polymer molecule is inserted between the particle layers The pattern
repeats every few nanometers maintaining a well-defined spatial relationship to each other ie
layered structure (Figure 26-b) Intercalation of clays by polymer is attributed to ion-exchange
reaction and ion-dipole interaction (Pospisil et al 2002 Pospisil et al 2004 Ruiz-Hitzky and
van Meerbeek 2006) Exchangeable cations in the interlayer space either replace with inorganic
andor organic cations or interact with polar neutral molecules intercalated between silicate
layers In an exfoliated structure which normally occurs with high polymer content the layers
are completely separated and the individual layers are distributed throughout the system
Exfoliation is identified by X-ray diffractograms with no diffraction peaks since the particle
layers have separated far from one another (gt 8 nm) Since the intercalated and exfoliated
structures result in layer-level composites or nanocomposites properties of the nanocomposites
may totally differ from the microcomposite This study focuses on the development and
manipulation of clay-polymer nanocomposites with intercalated structures
(a) (b) (c)
Figure 26 Schematic of various clay-polymer composites (a) phase-separated (b) intercalated
and (c) exfoliated structures
22
Polymer treatment alters the properties of Mt (van Olphen 1977 Theng 1979) For
example hydraulic conductivity of Mt increases with cationic polyacrylamide addition
(Ashmawy et al 2002) The mechanism of this phenomenon includes polymer bridging through
(1) the replacement of the adsorbed Na+ or Ca2+ in the clay by the cationic polymer molecules
(this process is likely to be irreversible since a number of cations on a single polymer chain
would need to be displaced simultaneously) and (2) a relatively weak dipole bond between the
cationic polymer molecule and Na+ In this case the replacement of Na+ is not likely since the
clay sheets are coated with the polymer
24 Synthesis of Clay-Polymer Nanocomposites
Clay-polymer nanocomposites (CPN) can be synthesized through four main techniques
(Gao and Heimann 1993 Vaia et al 1993 Yano et al 1993 Ray and Okamoto 2003 Gao
2004 Koo 2006 Mai et al 2006) (1) in-situ polymerization (2) solution exfoliation (3) melt
intercalation and (4) solution intercalation In-situ polymerization involves the construction of
polymer chains from monomers in solution within the clay particle interlayer space and
polymerization is initiated with heat radiation pre-intercalated initiators or catalysts (Zeng et al
2005) Extrapolating these extra steps to the macro-scale may inhibit the economic feasibility of
producing large quantities of intercalated materials especially when added heat or radiation is
required Solution exfoliation requires a solvent to exfoliate layered particles into single platelets
to which the polymers adsorb However this technique results in a polymer matrix ldquostuddedrdquo
with individual platelets In addition there are accompanying health and safety concerns due to
the organic solvent (Gao 2004) Melt intercalation requires heating the polymer matrix to a
molten state and then adding small quantities of clay material This process leads to a polymer
enhanced with clay rather than clay enhanced with a polymer
23
The intercalation of polymer molecules into clay particle interlayers without exfoliation
can be attained using solution intercalation (Yano et al 1993 Ray and Okamoto 2003 Gao
2004 Koo 2006 Mai et al 2006) which utilizes water-soluble polymers such as
polyacrylamide and swelling clay such as bentonite Intercalation by polymer molecules takes
place from a bulk polymer solution The interlayer water molecules are spontaneously displaced
with a polymer molecule due to negative variation in the Gibbs free energy (Theng 1979 Mai et
al 2006) The entropy obtained by desorption of water molecules from exchangeable cations in
the interlayer space compensates for the decrease in the overall entropy of the intercalated
polymer molecules leading to the polymer intercalation (Vaia et al 1993) Therefore the
reaction occurs without providing an external energy source implying better cost-efficiency than
other intercalation techniques In addition low health and safety risks can be expected due to the
use of water as a solvent
The solution intercalation technique has been successfully used to synthesize intercalated
structures of Mt with polymers such as poly(ethylene oxide) (Parfitt and Greenland 1970 Ruiz-
Hitzky and Aranda 1990 Wu and Lerner 1993 Shen et al 2002a) poly(acrylic acid) (Tran et
al 2005) polyacrylamide (Tanihara and Nakagawa 1975 Hwang and Dixon 2000) and
poly(vinyl alcohol) (Strawhecker and Manias 2000) Due to their linear structure poly(ethylene
oxide) molecules easily intercalate increasing the clay interlayer spacing to 223Aring (Parfitt and
Greenland 1970) The interlayer spacing of Mt mixed with poly(acrylic acid) or polyacrylamide
increases to 16Aring (Tran et al 2005) or to 155Aring (Hwang and Dixon 2000) respectively from
96Aring The interlayer spacing when treated with poly(acrylic acid) can be further increased to 20
Aring by increasing the mixing temperature up to 60˚C (Tran et al 2005) The interlayer spacing
tends to increase with increasing polymer concentration and mixing temperature and with
decreasing polymer molecular weight (Hwang and Dixon 2000 Shen et al 2002a Tran et al
2005) This study utilizes the solution intercalation technique for the aforementioned reasons
24
The solution intercalation technique has not attracted enormous interest because of its sensitivity
to experimental conditions such as polymer concentration (Shen et al 2002a) Thus it is
important to first understand the factors that control the extent of intercalation by the polymer in
order to develop a large-scale production technique
25 Characterization of Clay-Polymer Nanocomposites
251 X-ray Diffraction
Changes in the basal spacing of the synthesized clay-polymer composites is typically
characterized using X-ray diffraction (XRD) This is technique most often used to characterize
clay-polymer nanocomposites particularly with intercalated structures (van Olphen 1977 Koo
2006 Mai et al 2006) Intercalation of polymer molecules into the layer space increases the
interlayer spacing resulting in a shift of the diffraction peak towards lower angle values Thus
resulting interlayer spacing is calculated based on the Braggrsquos equation λ=2dmiddotsinθ where λ
denotes the wave length of the X-ray radiation (typically CuKa where λ=1541Aring ) d denotes the
interlayer spacing and θ denotes the measured diffraction angle
252 Spectroscopic Ellipsometry
Ellipsometry has previously been utilized to measure the thickness of the double layer
and adsorbed polymer layer on a surface (Lee and Fuller 1984 Irene 1993 Filippova 1998
Schwarz et al 1999 Russev et al 2000 Fan and Advincula 2002 Fan et al 2002 Wang et al
2004 Schmidt et al 2009) The technique detects the change in the polarization state of the light
modified by a sample surface Among the many techniques such as nuclear magnetic resonance
vibrational spectroscopy ellipsometry and neutron scattering that can be used to characterize
adsorbed polymer layers (Cohen Stuart et al 1986) ellipsometry illuminates in-situ
characteristics of adsorbed polymer molecules on a nearly flat surface such that effects of the
surface properties including roughness and curvature can be negligible Other benefits of using
25
ellipsometry are that the method is non-destructive non-invasive highly accurate requires only
small sample sizes and can be used on wet samples (Irene 1993 Russev et al 2000 Fan et al
2002) The achievable resolution can be lt 1 Aring but sensitivity to film thickness can be
maintained to tens of microns Changes in the polarization state result in different values of the
relative phase change Δ and the relative amplitude change which are characteristic angles of
the surface reflecting the polarized light perpendicularly (s-wave) and parallel (p-wave) to the
incidence plane The fundamental relationship between and is given as a complex reflection
coefficient (Irene 1993)
)exp()tan( i
||
||)tan(
s
p
r
r
sp
where p and s are the phase angles and rp and rs represent the complex amplitude reflection or
Fresnel coefficients The properties of the sample ndash optical properties in the form of the complex
refractive index (N = n +ik) or complex dielectric function (ε = ε1 + iε2 = N2) spectra and
microstructural factors such as film thickness ndash affect the measured spectra (Δ ψ) Thus the pH-
and time-dependent conformational changes of adsorbed polymer molecules onto a simulated
mineral surface may be captured through measurement of the spectroscopic ellipsometric angles
26 Computer Simulation
261 Overview
One important goal of simulation and modeling in material science is the accurate and
rapid prediction of materials and their properties and features Computer simulation may provide
a molecular level understanding of the mechanisms responsible for the behavior of clay-polymer
26
systems All forces and interactions occurring at a nano- andor micro-level can easily be
modeled by mathematical equations Such a technique not only complements experimental
results with a detailed atomistic level picture of the relevant phenomena but also illuminates
systems unaccessible via experimental methods Computer simulation and modeling of clays and
polymers based on theories and computational methods have long been used to study and
understand their complex behavior (Chang et al 1995 Skipper et al 1995 Boek et al 1996
Groot and Warren 1997 Sposito et al 1999 Balazs et al 2000 Bourg et al 2003 Cygan et al
2004b Pandey et al 2005 Sutton and Sposito 2006 Suter et al 2009) A number of
computational techniques have been used to investigate processes at different length and time
scales Figure 27 is a time-length scale plot illustrating current computational techniques at
relevant time and length scales
Quantum
Mechanics(electrons)
Mesoscale Simulation (molecules segments)
eg Coarse-grained MD DPD
Molecular
Mechanics(atoms)
Chara
cte
ristic
Length
Characteristic Time
mm
μm
nm
pico
seconds
nano
seconds
micro
seconds seconds minutes
FEM DEM
(finite elements)
Figure 27 Time-length scale plot illustrating various computational methods at relevant time
and length scales Also shown are the basic interaction units in each method
27
Since atomistic simulation and modeling methods such as molecular dynamics (MD) and
Monte Carlo (MC) approach a realistic description of the system they are commonly used to
understand the behavior and properties of clays electrolytes and polymers (Skipper et al 1995
Sposito et al 1999 Chodanowski and Stoll 2001 Bourg et al 2003 Boulet et al 2004 Cygan
et al 2004b Laguecir and Stoll 2005 Katti et al 2006 Sutton and Sposito 2006 Ulrich et al
2006 Rotenberg et al 2007 Mazo et al 2008 Pagonabarraga et al 2010) However extreme
care must be taken in interpreting the results from such atomistic simulations since they can only
probe extremely small spatial dimensions and very limited time scales compared to experiments
In addition atomistic simulations take a significant amount of time and cost for predicting the
behavior of full-scale complex systems such as clay-polymer composites due to the restricted
length (~102 nm) and time scale (~102 ns) (Rotenberg et al 2007) For example a clay particle
with a width of 05μm and 100 layers would have about 01 billion atoms If such particles are
associated with a polymer molecule to form clay-polymer composites the system would
comprise too many atoms for atomistic simulation to equilibrate microscopic properties such as
radius of gyration or end-to-end distance
On the other hand the basic idea of coarse-grained atomistic computer simulation such
as coarse-grained molecular dynamics (CGMD) and dissipative particle dynamics (DPD) is to
decrease the system size These meso-scale computer simulations are based on spring-connected
particles so-called beads representing groups of atoms Thus the coarse-grained atomistic
technique has advantages in simulating and modeling large andor complex systems at a longer
timescale with current computer performance (Kremer and Grest 1990 Groot and Warren 1997
Goddard et al 2001 Muller-plathe 2002 Nieminen 2002 Kroger 2004 Boek et al 2005
Daivis et al 2007 Depa 2007 Fermeglia and Pricl 2007 Scocchi et al 2007 Zeng et al
2008 Luo and Sommer 2009 Suter et al 2009 Gruenert et al 2010) Figure 28 illustrates a
28
L AL
A
(a) (b)
Figure 28 Schematic of coarse-graining on (a) a polyacrylamide chain and (b) a Mt particle
The smaller spheres represent atoms the larger yellow and blue spheres are coarse-grained beads
Bond length (L) and bond angle (A) of the coarse-grained beads are also shown
schematic of coarse-graining a polymer chain and a clay particle where a monomer and a unit cell
of the clay particle respectively are replaced with a single bead
262 Dissipative Particle Dynamics
DPD was introduced by Hoogerbrugge and Koelman (1992) for addressing
hydrodynamic behavior of fluids While DPD is similar to molecular dynamics (MD) it has one
major difference in that a group of atoms a so-called coarse-grained bead is the basic unit of
DPD simulation Thus DPD has several advantages over the traditional MD technique For
example hydrodynamic behavior of a DPD system can be observed with fewer particles than that
required in an MD simulation which allows larger time steps to be taken than those in MD DPD
can simulate both Newtonian and non-Newtonian fluids including polymer solutions on
microscopic length and time scales
In the DPD approach all beads are defined by their mass mi position ir and momentum
ip Particles interact through a pairwise two-body short-ranged force ijF describing the sum
29
of a conservative force ijCF a dissipative force ij
DF and a random force ijRF (Espaňol and
Warren 1995 Groot and Warren 1997 Gibson et al 1998)
ijF = ijCF + ij
DF + ijRF
ijCF =
cij
cij
ij
ij
c
ij
ij
rrif
rrifr
r
r
ra
0
))(1(
ijDF = -γij∙ω
Dmiddotrijmiddotij
ij
ij
ij
ij
r
rv
r
r )(
ijRF = σijmiddot ω
Rmiddotrij
ij
ijij
r
r
t
where aij is the maximum repulsion between bead i and bead j rij = || ijr ijr = ji rr rc is the
cutoff radius γij and σij are the friction coefficient and noise amplitude between bead i and bead
j respectively ωD and ωR are r-dependent weight functions jjiiij mpmpv and ζij = ζji
is a Gaussian random number with zero mean and unit variance
It has been shown that the system obeys the fluctuation-dissipation theorem in which one
of the two weight functions fixes the other weight function if the following relationships hold
(Espaňol and Warren 1995)
ωD(r) = [ωR(r)]2
σ2 = 2γkBT
where kB is the Boltzmann constant and T is the temperature ωD(r) and ωR(r) are simply chosen
as (Groot and Warren 1997)
c
c
cRD
rrif
rrifr
r
rr
0
)1()]([)(
2
2
30
Neighboring beads in a polymer chain link together through a harmonic spring with the spring
constant ks and equilibrium bond length r0 (Groot and Warren 1997)
Fsij = ksmiddot(r ndash r0)
2
The spring constant for polymers ranges from 4 to 10 (Groot 2003 Qian et al 2007) The
equilibrium bond length ranging from 0 to 085rc has been adopted for a polymer molecule
(Gibson et al 1998 Gibson et al 1999 Rekvig et al 2003 Gonzalez-Melchor et al 2006)
This harmonic spring can also be used as a bond in a rigid particle For a rigid particle including
clay particles the spring constant varies from 50 to 100 (Rekvig et al 2003 Gonzalez-Melchor
et al 2006 Knauert et al 2007)
Electrostatic interactions play a key role in understanding the phenomena of a complex
system such as colloidal suspensions polymeric solutions and their mixtures Thus the
inclusion of electrostatic interactions in DPD simulations is essential to capture the micro-scale
phenomena including charged polymer adsorption on a clay particle clay intercalation by a
charged polymer and conformation of a charged polymer adsorbed on a surface Electrostatic
interactions in DPD simulations can be solved using a grid method modified Ewald sum method
or modified particle-particle particle-mesh (PPPM) technique (Groot 2003 Gonzalez-Melchor et
al 2006 Ibergay et al 2009) The grid method in which the electrostatic field is solved locally
on a grid efficiently captures the most important features of electrostatic interactions in a
reasonable manner Polyelectrolyte-surfactant systems were successfully simulated using this
method (Groot 2003) The modified Ewald sum method is a combination of the standard Ewald
method with some charge distribution on a particle that avoids the formation of nondesirable
ionic pairs due to soft repulsion of DPD beads The modified PPPM method in which charges
are distributed over a particle has also been successfully used to study charged polymer systems
(Ibergay et al 2009 Ibergay et al 2010) The standard Ewald method is known for accurately
describing Coulombic forces (Ewald 1921 Essmann et al 1995 Cygan et al 2004a Suter et
31
al 2007) However since computational efficiency is more important in a very complex system
the modified PPPM method was used in this study
DPD simulations usually operate in reduced units that are dimensionless Length mass
and energy are measured in units of a force cutoff radius the mass of a single DPD bead and kBT
where kB is Boltzmannrsquos constant and T is absolute temperature
32
Chapter 3
SYNTHESIS OF TUNABLE CLAY-POLYMER NANOCOMPOSITES
The purpose of the study described in this chapter is to develop an optimized procedure
for synthesizing clay-polymer nanocomposites using an expansive clay mineral (bentonite) and a
responsive polymer (polyacrylamide) for the future production of ldquotunablerdquo clay soils The
nanocomposites were produced using a solution intercalation technique that has potential for
large-scale production in situ Variables investigated include clay content polymer molecular
weight pH and clay-to-polymer volume ratio Changes in the basal spacing of bentonite were
characterized using X-ray diffraction
31 Introduction
In order to enhance engineering properties clay soils are often manipulated by physical
andor chemical processes including polymer addition However polymer treatment limits
further modification of the clay-polymer nanocomposites due to their irreversible interactions A
responsive polymer can be used to synthesize clay-polymer nanocomposites (CPN) the properties
of which vary with external environment triggers That is interlayer andor interparticle spacing
of the CPN can be manipulated through changes in the surrounding fluid pH ionic concentration
temperature or electric field For example CPN synthesized from a pH responsive polymer may
be further modifiable by exposing the CPN to alternate pH conditions Since the conformation of
pH-responsive polymers varies with pH the interlayer andor interparticle spacing may also vary
with pH By altering the fabric of the clay system at the particle level the meso-scale properties
such as void ratio permeability swelling potential and strength will also be affected For
example when the conformation of the polymer becomes coiled the interlayer andor
interparticle spacing decreases This leads to a dense fabric and a subsequent decrease in void
ratio Once the polymer is adsorbed in the interlayer space of swelling clays the swelling
33
behavior may also be controlled via the reversible conformational change of the responsive
polymer
In order to maximize the potential for interlayer and interparticle spacing modification
the optimized design of nanocomposites is CPN with intercalated structures in which polymer
molecules are adsorbed onto both the particle surface and interlayer surface Hence both
interparticle and interlayer spacing of the CPN are capable of further modification through
exposure to alternating pH conditions ie ldquotunablerdquo CPN
The purpose of this study is to develop an optimized procedure for synthesizing ldquotunablerdquo
CPN using an expansive clay mineral (montmorillonite) and a responsive polymer
(polyacrylamide) for the future production of in-situ modifiable clay soils Furthermore the CPN
should be created such that the potential for structure modification is maximized The CPN were
synthesized using a solution intercalation technique which has potential for in-situ large-scale
production The significance of this approach is that the optimized procedure found through this
study can be utilized to synthesize a new type of CPN which is tunable as well as feasible for in-
situ large-scale production The variables investigated in this study include clay content polymer
molecular weight pH and clay-to-polymer volume ratio Changes in the basal spacing of
montmorillonite were characterized using X-ray diffraction (XRD) Nuclear magnetic resonance
(NMR) spectroscopy was used to monitor mineral dissolution under the tested pH conditions
The effects of nanocomposite synthesizing temperature were also investigated
32 Experimental Study
321 Materials
3211 Bentonite
Montmorillonite (Mt) was chosen due to its large swelling capacity which provides the
greatest opportunity for polymer molecule adsorption onto both the particle surface as well as the
34
interlayer surfaces The clay mineral used in this study is an untreated Mt a dioctahedral
smectite with the chemical formula (NaCa)033(Al167Mg033)Si4O10(OH)2middotnH2O A sodium
bentonite from American Colloid Company (Arlington Illinois) designated commercially as
AEG powder was used as the sour of Mt The sodium bentonite comprises principally of Mt and
minor amounts of feldspar and quartz The chemical composition obtained from the supplier is
listed in Table 31 Selected properties of the clay material are given in Table 32 The Mt was
oven-dried for 24 hours at 105˚C prior to testing
3212 Polyacrylamide (PAM)
Polymer intercalation into the interlayer space of Mt was attempted using
polyacrylamides obtained from Cytec Industries Inc (West Paterson NJ) Polyacrylamide was
chosen because it is responsive to pH changes Specifically the conformation (expansion or
contraction) of a PAM molecule depends on the surrounding fluid pH The polymer molecule has
a contracted coil conformation at acidic pH and an extended conformation at basic pH (Michaels
1954 Al-Anazi and Sharma 2002 Besra et al 2004) as shown schematically in Figure 25
Therefore PAM molecules are expected to be more easily adsorbed onto the interlayer space at
basic pH leading to more intercalated structure formation than that at acidic pH PAM is also
sensitive to ionic concentration but this property was not considered in this study Hence ionic
concentration was kept constant The two types of polyacrylamides used in this study were high
molecular weight nonionic (NPAM) and low molecular weight nonionic (nPAM) These polymer
types were chosen to highlight the impacts of molecular weight difference on the formation of
intercalated structure Selected characteristics of the polymers are given in Table 33
35
Table 31 Chemical composition of the sodium bentonite used in this study (Supplier data)
component component
SiO2 6302
Al2O3 2108
Fe2O3 325
FeO 035
CaO 065
MgO 267
Na2O 257
trace 072
LOI 564
Table 32 Properties of the sodium bentonite used in this study
Property Values Methods
Median particle diameter D50 (μm) 272
Particle size distribution determined using a
Malvern Mastersizer S (Malvern Instruments
Ltd)
Specific gravity 25 Supplier data
Specific surface (m2g) 706 Modified methylene blue European spot
method (Santamarina et al 2002b)
pH (at solids content of 2) 85 Determined from pH measurement using the
Accumet XL50 pH meter (Fisher Scientific)
Isoelectric point (pH) 003
Determined from zeta potential
measurements using a PALS zeta potential
analyzer (Brookhaven Instruments Co)
Cationic exchange capacity
(cmolkg) 808
Ammonia-electrode method (Borden and
Giese 2001)
Table 33 Characteristics of polyacrylamides used in this study
Type Trade Name Structure (Barvenik 1994
Huang et al 2001) Molecular weight
(gmol) a
High molecular
weight N300
~ 6 x 10⁶
Low molecular
weight N300LMW ~ 8 x 10⁴
aMeasured using viscometry method (Brandrup and Immergut 1989 Ravve 2000)
n
CH
NH2
O = C
CH2
36
322 Synthesis of Clay-Polymer Nanocomposites ndash Solution Intercalation
The solution intercalation technique is a CPN synthesizing method in which clay
dispersions and polymer solutions are separately prepared and then mixed together Due to
negative variation in the Gibbs free energy polymer molecules are spontaneously intercalated
into the interlayer space of Mt (Theng 1979 Vaia et al 1993) Thus energy demand is minimal
implying cost efficiency and contributing to the capability of large-scale production for
geotechnical and geoenvironmental applications In addition in-situ production as well as low
health and safety risks can be expected due to the use of water as a solvent
Since Mt intercalation by a polymer molecule is affected by clay content (Shen et al
2002b Perez-Santano et al 2005) polymer concentration (Hwang and Dixon 2000 Shen et al
2002a) polymer molecular weight (Hwang and Dixon 2000 Heinz et al 2007) and pH (Besra
et al 2004 Perez-Santano et al 2005) selected variables investigated in this study using the
solution intercalation technique include clay content polymer molecular weight pH and clay-to-
polymer volume ratio The clay content is defined as the proportion of clay volume with respect
to the total dispersion volume Dispersions were prepared at clay contents of 0001 0005 001
and 003 representing a broad range of clay content in geotechnical and environmental
applications The high molecular weight polymer has MW ~ 6x10⁶ gmol and MW of the low
molecular weight polymer is ~ 8x10⁴ gmol The polymer solution pH was modified to target
acidic (pH asymp 4) neutral (pH asymp 6) and basic (pH asymp 11) conditions The polymer molecule
conformational change results from hydrolysis and reaction on the amino functional group
(Barvenik 1994 Kurenkov 1997 Bruice 2001) Hydrolysis and the amino group reactions
occur very slowly at pH below 9 and below 45 respectively Since the conformational change is
insignificant at pH below 45 the acidic target pH used was pH 4
The clay-to-polymer volume ratio is defined as the proportion of clay volume with
respect to polymer volume and is used to consider both clay content and polymer concentration
37
simultaneously An example calculation for clay-to-polymer volume ratio can be found in
Appendix A A broad range of clay-to-polymer volume ratios were considered in this study
125 2 4 8 125 25 and 625
Clay dispersions were prepared at the specified clay contents by mixing the appropriate
mass of oven-dried clay in deionized water The dispersion was placed on a magnetic stirrer and
stirred for 24 hours to provide enough separation of interlayers ie swelling This step is herein
referred to as the swelling stage
Polymer solutions were prepared according to the designated clay-to-polymer volume
ratio by mixing the appropriate mass of each polymer in deionized water The solution was
stirred for 24 hours The pH of the solution was adjusted to the target pH by using 01M HCl or
01M NaOH buffer solutions After adjusting the pH the polymer solution was mixed thoroughly
with the prepared clay dispersion for 24 hours This step is herein referred to as the mixing stage
During mixing the dispersion was covered to prevent evaporation The mixture of clay and
polymer was then air-dried and pulverized using a pestle and mortar The solution intercalation
process was performed a total of three times per test condition
323 Mixing and Drying Temperatures
Mixing temperature has been reported as a factor affecting changes in basal spacing of
Mt treated with a polymer (Tran et al 2005 Filippi et al 2007) The basal spacing of Mt treated
with poly(acrylic acid) was further expanded at a mixing temperature of 60˚C compared to room
temperature (Tran et al 2005) However analogous information is not available for Mt treated
with polyacrylamide In addition determining the optimum composite synthesis conditions is the
first step in designing future feasibility studies for large-scale production especially in terms of
additional energy consumption In order to investigate the effect of mixing temperature samples
were prepared at clay content of 002 pH 11 and clay-to-polymer volume ratio of 8 These
synthesis conditions were randomly chosen within the boundaries for intercalated structure
38
formation ie clay content lt 003 and clay-to-polymer volume ratio lt 25 The samples were
mixed at room temperature (21 plusmn 2˚C) 60˚C and 85˚C and then air-dried Samples to
investigate the effect of drying temperature (post mixing stage) were prepared at clay content of
001 pH 11 and clay-to-polymer volume ratio of 125 These synthesis conditions were
randomly chosen as above The samples were then dried at 110˚C and room temperature and
then ground into powder form
324 Analysis Techniques
3241 X-ray Diffraction (XRD)
Changes in the basal spacing of the synthesized clay-polymer composites were
characterized using X-ray diffraction (XRD) This technique is most often used to characterize
clay-polymer composites particularly intercalated structures (van Olphen 1977 Koo 2006 Mai
et al 2006) Intercalation of polymer molecules into the clay particle increases the interlayer
spacing resulting in a shift of the diffraction peak towards lower diffraction angle values (2θ lt
7˚)
The pulverized clay-polymer composites ie powder form (approximately 05 g by
weight) were placed in a zero-background holder consisting of a quartz crystal cut polished 6deg of
the c-axis The holder filled with the sample was introduced to the XRD instrument XRD
spectrums for the treated samples were obtained with a Scintag Pad V (Scintag Inc Cupertino
CA) operated at 35 kV voltage and 30 mA current with Cu Kα radiation (λ = 154178 Aring )
Quantitatively analyzing XRD results of clay samples is theoretically possible using Rietveld
XRD quantification (Rietveld 1967 Ufer et al 2008) However quantification of XRD results
for clay-polymer nanocomposites presents its own challenge since particles may not be aligned
and no database on clay-polymer complexes exists In addition the XRD peaks from this study
are low-angle (2θ lt 10˚) This diffraction angle range is not ideal for obtaining reliable
39
diffraction signatures due to distorted reflections (Moore and Reynolds 1997) Therefore for the
purpose of this study it is assumed that particles are oriented in the same direction and the
relative degree of intercalation is compared using XRD intensity data Note that the XRD peak
position for each diffractogram was determined using Jade 9+ software (Materials Data Inc
Livermore CA)
3242 Nuclear Magnetic Resonance (NMR) Spectroscopy
The effects of mineral dissolution at pH 4 and pH 11 were investigated using nuclear
magnetic resonance (NMR) spectroscopy coupled with X-ray diffraction (XRD) NMR spectra
are used to identify the structural and dynamic properties of solids including clay minerals and
clay-based materials (Sanz and Serratosa 2002) NMR spectra provide information on whether
or not layer distortions have occurred XRD patterns provide information on whether or not the
layered structure of the tested clay minerals remains intact Thus XRD patterns as well as solid-
state 29Si 27Al MAS NMR spectra can be used as indicators of the final structure of CPN
High-resolution 29Si 27Al MAS NMR spectra of the sample (approximately 02 g by
weight) in powder form were recorded using a Bruker Avance 300 spectrometer and 5 mm Doty
MAS probes spun at 6 kHz for Si and 15 kHz for Al respectively A 1 μs (π10) pulse with 30 s
delay was used for 29Si and a 1 μs (π10) pulse with 1 s delay was used for 27Al
33 Results and Discussion
The characteristic basal spacings obtained using XRD for the synthesized
nanocomposites are summarized in Table 34 and plotted in Figures 31 and 32 Sample
numbers in Table 34 beginning with CC MW PH and CP indicate the corresponding variables
clay content polymer molecular weight pH and clay-to-polymer volume ratio respectively
Sample numbers beginning with N represent a clay sample without polymer treatment XRD
intensity represented as counts indicates the relative amount of a structure with a particular basal
40
Table 34 Test matrix and resulting basal spacing with XRD intensity
Sample
numbera
Clay
content
Polymer
type
pH of
polymer
solution
Clay-to-
polymer
volume ratio
Basal spacing
(nm)b
XRD intensity
at peak
(counts)
N1 0001 na na na
1227 150
N2 001 1166 160
CC1 0001 nPAM 109 8 1526 225
CC4 0005 nPAM 109 8 1509 280
CC7 001 nPAM 1094 8 1515 200
CC10 003 nPAM 111 8 1215 210
MW1 001 nPAM 1094 125 1527 1211 180 180
MW4 001 NPAM 1096 125 1558 1151 130 115
PH1 001 nPAM 41 8 1515 1289 230 180
PH4 001 nPAM 565 8 1515 1308 210 175
PH7 001 nPAM 1094 8 1515 200
CP1 0001 nPAM 109 125 1557 310
CP4 0001 nPAM 11 2 1541 460
CP7 0001 nPAM 1104 4 1504 400
CP10 001 nPAM 111 8 1515 1289 230 180
CP13 001 nPAM 1094 125 1527 1211 180 180
CP16 001 nPAM 109 25 1108 310
CP19 001 nPAM 1092 625 1164 225 a For clarity iterations under each condition are not tabulated but still found in text or in plots
b All XRD peaks within 2θ below eight degrees (basal spacing greater than approximately 11nm) are
tabulated
spacing (Moore and Reynolds 1997) Thus the intensity corresponding to basal spacings greater
than 145Aring is directly related to the quantity of intercalated structures Results of the mineral
dissolution study are shown in Figures 33 and 34
331 Influence of Mixing and Drying Temperatures
Mixing temperature appeared to have no impact on the formation of intercalated structure when
using the low molecular weight polyacrylamide over the range of temperatures tested (Figure
31) Note that basal spacings larger than 145Aring indicate the formation of intercalated structure
since the height of the PAM monomer is approximately 51Aring (Bruice 2001) For
nanocomposites formed with nPAM (Figure 32-a) and nanocomposites formed with NPAM
41
0
100
200
300
400
Inte
nsi
ty (
cou
nts
)
1479nm1278nm
0
100
200
300
400
Inte
nsi
ty (
cou
nts
)
1495nm1192nm
0
100
200
300
400
2 7 12 17 22 27
Inte
nsi
ty (
cou
nts
)
2θ˚ (CuKα)
1494nm1253nm
Figure 31 Basal spacings for bentonite-nPAM nanocomposites synthesized at (a) 20degC (b)
60degC and (c) 85degC mixing temperatures
(Figure 32-b) drying temperature did not significantly influence intercalation Furthermore the
difference between the second basal spacings (room-temperature vs oven-temperature) was
approximately the size of a water molecule (approximately 2 ~ 34Aring ndash Skipper et al 1995) This
observation was confirmed by comparing these results (Figure 32) with samples of hydrated
clay N1 and N2 (Table 34) which were prepared following the same synthesizing procedures
except without polymer addition The comparison of basal spacings at different drying
(a)
(b)
(c)
42
0
100
200
300
400
Inte
nsi
ty (
cou
nts
)
1527nm1211nm
21plusmn2˚C
0
100
200
300
400
2 7 12 17 22 27
Inte
nsi
ty (
cou
nts
)
2θ˚ (CuKα)
1509nm
1005nm
110˚C
(a)
0
100
200
300
400
Inte
nsi
ty (
cou
nts
)
1558nm1151nm
21plusmn2˚C
0
100
200
300
400
2 7 12 17 22 27
Inte
nsi
ty (
cou
nts
)
2θ˚ (CuKα)
1511nm
1005nm
110˚C
(b)
Figure 32 Basal spacings for bentonite-nPAM nanocomposites synthesized at 20degC and 110degC
drying temperatures with (a) low molecular weight PAM and (b) high molecular weight PAM
43
temperatures indicated that the drying temperature did not influence the intercalation and
confirmed that the clay particle was intercalated by the polymer molecule Thus all remaining
attempts at forming nanocomposites were completed at room temperature for both the mixing and
drying stages
332 Mineral Dissolution
NMR and XRD results to investigate the impact of pH on mineral dissolution are shown
in Figures 33 and 34 Figure 33 presents typical NMR characteristics of Mt Tetrahedral
silicon corresponds to -935 ppm on the Si-NMR spectra and tetrahedral and octahedral
aluminum peak at 58737 and 3917 ppm respectively on the Al-NMR spectra (Kinsey et al
1985) The lack of shifting in the NMR peak positions for nanocomposites synthesized with pH-
adjusted (Figure 33-b and 33-c) and unadjusted (Figure 33-a) polymer solutions indicated that
the acid or base added during the polymer solution pH-adjustment step did not impact mineral
dissolution when the polymer solution was mixed with the clay dispersion This result was
confirmed in the XRD diffractogram which showed that the typical characteristics of Mt
remained for nanocomposites synthesized with pH-adjusted and unadjusted polymer solutions
(Figure 34) Figures 33 and 34 indicate that the amount of mineral dissolution of the CPN due
to exposure to the pH-adjusted solutions (pH asymp 4 and pH asymp 11) did not differ significantly from a
nanocomposite synthesized with unadjusted polymer solution Figure 34 also indicates that
PAM treatment increased the interlayer spacing due to the formation of intercalated structure
44
Figure 33 Si-NMR spectra for clay-polymer nanocomposites synthesized with (a) unadjusted
polymer solution and pH-adjusted polymer solutions (b) pHasymp4 and (c) pHasymp11 Al-NMR spectra
for clay-polymer nanocomposites synthesized with (d) unadjusted polymer solution and pH-
adjusted polymer solutions (e) pHasymp4 and (f) pHasymp11
(c)
(b)
(a)
(f)
(e)
(d)
-935
-1062
3917
58737
45
2 7 12 17 22 27
Rel
ativ
e In
ten
sity
2θ˚ (CuKα)
15 nm
Figure 34 XRD diffractogram for clay-polymer nanocomposites synthesized with (a)
unadjusted polymer solution and pH-adjusted polymer solutions (b) pH 4 and (c) pH 11 M
denotes a typical peak for Mt
333 Nanocomposite Synthesis Optimization
The characteristic basal spacings obtained using XRD for the synthesized
nanocomposites are summarized in Table 34 and plotted in Figures 35 and 36 as a function of
the variables considered in this study
(a)
(b)
(c)
M M
M M
M M
46
0
100
200
300
400
500
0001 001 01
Inte
nsi
ty (
cou
nts
)
Clay content
Figure 35 Impact of clay content on quantity of montmorillonite intercalated with PAM XRD
intensity was obtained from a peak corresponding to basal spacings greater than 145 Aring Error
bars were plotted based on the calculated standard deviation of three measured values
The relationship between clay content and XRD intensity for intercalated structure is
plotted in Figure 35 The clay content was defined as the proportion of clay volume with respect
to the total dispersion volume With respect to clay content intercalated structure occurred at
clay contents of 0001 0005 and 001 but not at clay content of 003 As clay content increased
less intercalated CPN formed Polymer molecules tend to be adsorbed first onto particle surface
due primarily to accessibility thus more clay particles may hinder the interlayer adsorption of
polymer At clay content of 003 no intercalated structure formation implies that the polymer
adsorption takes place on the particle surface first
Intercalated structure occurred in the presence of both low molecular weight PAM and
high molecular weight PAM However the difference in molecular weight led to slight
differences in basal spacing and amount of intercalated structure (Table 34) When all other
nanocomposite synthesis conditions were held constant the low molecular weight PAM
nanocomposites resulted in a higher XRD intensity than the nanocomposite synthesized with high
47
molecular weight PAM The slightly lower quantity of intercalated structures with high
molecular weight PAM is consistent with its larger size This observation is similar to that of
other researchers in that smaller molecules penetrate more easily into interlayer spaces (Aranda
and Ruiz-Hitzky 1992 Hwang and Dixon 2000 Inyang and Bae 2005)
The effect of polymer conformation was insignificant XRD intensity and basal spacing
at all tested pH ranges were nearly constant The polyacrylamide used in this study has extended
conformation at basic pH while it has contracted coil conformation at acidic pH (Figure 25)
Thus PAM molecules were expected to be more easily adsorbed onto the interlayer space at basic
pH leading to more intercalated structure formation than that at acidic pH However the results
indicate that the polymer solution pH did not significantly influence the formation of intercalated
structure One possible reason for this observation is due to pH neutralization during mixing with
clay dispersion Since pH adjustment was performed for the polymer solution only it is very
likely that adjusted pH of polymer solution was neutralized when added to the clay dispersion
(pH not adjusted) diminishing the effect of polymer conformation This was confirmed with pH
values measured after mixing that ranged from pH 75 to pH 9
The formation of intercalated structure tends to increase with decreasing clay-to-polymer
volume ratio (Figure 36) The quantity of intercalated structures was maximized at a clay-to-
polymer volume ratio of 2 Beyond this apparent maximum XRD intensity decreased with
decreasing clay-to-polymer volume ratio At the lowest tested clay-to-polymer volume ratio of
125 the reduction in intensity suggests exfoliation of the clay particles (Wang and Pinnavaia
1994 Alexandre and Dubois 2000 Biswas and Ray 2001) As exfoliated structures form the
XRD intensity corresponding to the quantity of intercalated structures decreases On the other
hand the lowest quantity of intercalated structures corresponded to the clay-to-polymer volume
ratio of 125 These results indicate that the formation of intercalated structure in part is
determined by the applied clay-to-polymer volume ratio
48
0
100
200
300
400
500
1 10 100
Inte
nsi
ty (
coun
ts)
Clay-to-Polymer Volume Ratio
Figure 36 Impact of clay-to-polymer volume ratio on quantity of montmorillonite intercalated
with PAM XRD intensity was obtained from a peak corresponding to basal spacings greater than
145 Aring Error bars were plotted based on calculated standard deviation of three measured values
335 Dominant Factor for Intercalated Structure Formation
Most of the conditions tested here exhibited expanded basal spacing (greater than 145Aring )
which is an indication of the formation of intercalated structure However intercalated structure
indicated by basal spacing gt145Aring was not observed in samples CC10 CP16 and CP19 CC10
sample was synthesized at clay content 003 while CP16 and CP19 were synthesized at clay-to-
polymer volume ratios of 25 and 625 (Table 34) While clay content polymer molecular
weight and clay-to-polymer volume ratio affect the formation of intercalated structure based on
the increase in XRD intensity clay content and clay-to-polymer volume ratio are the most
significant factors tested here Polymer molecular weight and polymer solution pH (in the tested
range) play a less critical role The most significant factor affecting intercalated structure
formation was the clay-to-polymer volume ratio From samples CP16 and CP19 although clay
49
content was expected to form intercalated structures the measured basal spacings did not exceed
145Aring due to the high clay-to-polymer volume ratio (gt 125)
34 Conclusions
The purpose of this study is to develop an optimized procedure for synthesizing clay-
polymer nanocomposites (CPN) using an expansive clay and a pH-responsive polymer for the
goal of creating ldquotunablerdquo nanocomposites Factors such as clay content polymer molecular
weight pH and clay-to-polymer volume ratio that influence the formation of intercalated
structure were investigated The solution intercalation technique was found to be appropriate for
synthesizing CPN using bentonite and polyacrylamide a responsive polymer
When synthesizing CPN the mixing and drying temperatures do not appear to affect the
formation of intercalated structure for nanocomposites of bentonite and polyacrylamide
Synthesizing these nanocomposites at high temperatures provides no advantage over synthesizing
at room temperature In the tested temperature range the solution intercalation technique is
promising for synthesizing bentonite-polyacrylamide nanocomposites with no additional energy
consumption
Nuclear magnetic resonance spectra and X-ray diffraction indicate that the mineral
dissolution due to pH-adjusted polymer solutions is insignificant It is likely that mixing the pH-
adjusted polymer solution with the clay dispersion (not pH-adjusted) results in pH neutralization
Such pH neutralization also affects conformational behavior of polyacrylamide molecules
minimizing the pH effect on the synthesis of intercalated structure
The formation of intercalated structure is maximized by the appropriate clay content
polymer molecular weight and clay-to-polymer volume ratios Intercalation was successful at
clay content below 003 and clay-to-polymer volume ratio below 25 While clay content
polymer molecular weight and clay-to-polymer volume ratio affect the formation of intercalated
50
structure the most significant factor is the clay-to-polymer volume ratio The formation of
intercalated structure is expected only when appropriate clay-to-polymer volume ratio of less than
25 is applied At clay-to-polymer volume ratios below 25 intercalated structure formation
increases with decreasing clay content and polymer molecular weight The quantity of
intercalated material tends to increase with decreasing clay-to-polymer volume ratio and has an
apparent maximum at the ratio of 2 Using low molecular weight polyacrylamide was slightly
more efficient in forming CPN compared to high molecular weight polyacrylamide The smaller
size of the low molecular weight polyacrylamide molecule allows for easier insertion into the
interlayer space of the particle
51
Chapter 4
MANUPULATION OF SYNTHESIZED CLAY-POLYMER
NANOCOMPOSITES
The purpose of this chapter is to investigate the responsiveness or tunability of clay-
polymer composite materials with controllable micro-scale properties such as interlayer and
interparticle spacing and with controllable meso-scale properties including specific surface area
swelling potential and permeability Descriptions of experimental methods and their
interpretation are provided verifying that the micro-scale conformational changes of polymer lead
to meso-scale property changes
41 Introduction
Soils are often modified with the use of polymers or surfactants in the fields of material
science geotechnical and geoenvironmental engineering (Gardner and Arias 2000 Bhardwaj et
al 2007 Story et al 2009 Young et al 2009) Polymer additions alter soil fabric enhancing
engineering properties such as swelling behavior (Hjelmstad 1990 Inyang et al 2007) water
permeability (Young et al 2009) contaminant barrier properties (Inyang and Bae 2005) water
retention (Bhardwaj et al 2007) and material properties such as thermal resistance toughness
and water permeability (Strawhecker and Manias 2006) The use of responsive polymers has an
additional benefit of controllable morphologies Morphologies of pH- ionic strength-
temperature- and electrical potential-responsive polymers are tunable with each environmental
trigger inducing controllable system properties (Bae et al 1990 Feil et al 1992 Wu and Shanks
2003 Kim et al 2006 Xia et al 2006)
Many studies have focused on the investigation of conformation of polymers adsorbed on
a clay mineral surface using ellipsometry nuclear magnetic resonance scanning probe
52
microscopy diffuse reflectance Fourier transform infrared spectroscopy and Monte Carlo
simulation (Bottero et al 1988 Takahashi 1991 Chodanowski and Stoll 2001 Brotherson et
al 2007 Blachier et al 2009) Only a few studies have attempted to characterize polymer
conformation adsorbed in the interlayer space of a clay mineral (Glinel et al 2001) However
conformational behavior of a responsive polymer after adsorption has not been studied since
current experimental technologies limit the ability to characterize the conformation of the
polymer adsorbed on a mobile suspended surface ie clay particle in water Understanding the
conformational behavior of a responsive polymer adsorbed on a surface is critical to predicting
the behavior of tunable CPN
This study utilizes a pH-responsive polymer since the high solubility of a pH-responsive
polymer is advantageous for large-scale production necessary for in-situ engineering applications
pH-responsive polymers may have various conformations as a function of the surrounding fluid
chemistry which could lead to changes in CPN properties Therefore the objective of this
chapter is to link micro-scale conformational behavior of a pH-responsive polymer to meso-scale
properties of CPN Micro-scale tests such as dynamic light scattering and spectroscopic
ellipsometry were used to investigate micro-scale conformational behavior of the pH-responsive
polymer The polymer conformation in a bulk aqueous solution was investigated using dynamic
light scattering Spectroscopic ellipsometry was used to explore the polymer conformation on a
surface Meso-scale tests including specific surface area measurement swelling potential
measurement and hydraulic conductivity tests were conducted to explore meso-scale properties
of CPN corresponding to micro-scale polymer conformations A linkage between the micro-scale
polymer conformation and the meso-scale properties of CPN will be made For example CPN
synthesized using polyacrylamide is expected to have greater interlayer and interparticle spacings
ie open fabric at pH above 11 than that at pH below 10 Thus the swelling potential of the
CPN would be maximized at pH above 11 resulting in minimal permeability
53
42 Materials
421 Clay Minerals
Montmorillonite (Mt) was chosen due to its large swelling capacity which provides the
greatest opportunity for polymer molecule adsorption onto both the particle surface as well as the
interlayer surfaces The clay mineral used in this study was an untreated Mt a dioctahedral
smectite with the chemical formula (NaCa)033(Al167Mg033)Si4O10(OH)2middotnH2O The source of Mt
is a sodium bentonite from American Colloid Company (Arlington Illinois) designated
commercially as AEG powder This bentonite comprises principally of Mt and minor amounts of
feldspar and quartz The chemical composition obtained from the supplier is listed in Table 41
Selected properties of the clay material are given in Table 42 The Mt was oven-dried for 24
hours at 105˚C prior to testing
Kaolinite was also used to investigate effects of interlayer spacing modification
Kaolinite has little swelling potential and cannot easily be intercalated by a polymer while Mt
has a high swelling potential and is easily intercalated by a polymer providing the ability for
interlayer spacing modification Thus only interparticle spacing can be modified in the case of
kaolinite treated with polymer The kaolinite used in this study was an untreated kaolin from
Wilkinson Kaolin Associates LLC (Gordon Georgia) The kaolinite designated commercially as
Wilklay SA-1 is a dioctahedral kaolinite with the chemical formula Al2O3middot2SiO2middot2H2O The
chemical composition is nearly the same as theoretical kaolinite indicating a high level of purity
(Table 41) The kaolinite was converted to a monoionic sodium kaolin using a conversion
method modified after van Olphen (1977) and Palomino and Santamarina (2005) The method
consists of mixing the kaolin in a 2M NaCl solution for 48 hours and a 1M NaCl solution twice
for 24 hours each time After the final salt wash the excess salt is removed by replacing the
supernatant fluid with deionized water until the supernatant conductivity measures less than 100
microScm The converted clay slurry is oven-dried and ground using a pestle and mortar The
54
kaolinite contains small content of illite impurity confirmed by X-ray diffraction (Kim and
Palomino 2009)
Table 41 Chemical composition of clay minerals used in this study
constituent
constituent
Kaolinite
(Supplier Data)
Theoretical kaolinite
(Murray 1991)
Bentonite
(Supplier Data)
SiO2 456 463 6302
Al2O3 384 398 2108
Fe2O3 04 325
FeO 035
TiO2 15
CaO 006 065
MgO trace 267
K2O 018
Na2O trace 257
trace 072
LOI 1382 139 564
Table 42 Properties of clay materials used in this study
Property Kaolinite Bentonite
Median particle diameter D50 (μm) 168a 272b
Specific gravityc 26 25
Specific surfaced (m2g) 4037 70646
pH (at solids content of 2)e 75 85
Isoelectric point (pH)f 23 003
Cationic exchange capacity (cmolkg)g 23 808 a Hydrometer test (ASTM 2003) b Particle size distribution determined using a Malvern Mastersizer S (Malvern Instruments Ltd)
c Supplier data
d Modified methylene blue European spot method (Santamarina et al 2002b) e Determined from pH measurement using the Accumet XL50 pH meter (Fisher Scientific)
f Determined from zeta potential measurements using a PALS zeta potential analyzer (Brookhaven
Instruments Co) g Ammonia-electrode method (Borden and Giese 2001)
55
422 Polyacrylamide
Polyacrylamide (PAM) was chosen because it is responsive to changes in pH
Specifically the conformation (expansion or contraction) of a PAM molecule depends on the
surrounding fluid pH The polymer molecule has a contracted coil conformation at acidic pH and
an extended conformation at basic pH (Michaels 1954 Al-Anazi and Sharma 2002 Besra et al
2004) as shown schematically in Figure 25 PAM is also sensitive to ionic concentration but
this property was not considered in this study Hence ionic concentration was kept constant
For most of the tests the clay minerals were treated with low molecular weight nonionic
PAM (nPAM) In the hydraulic conductivity testing (Section 443) high molecular weight
nonionic PAM (NPAM) and high molecular weight cationic PAM (CPAM) containing 20
cationic quaternary ammonium salt groups were also used to highlight the impacts of polymer
molecular weight and ionic type respectively All three types of PAM were obtained from Cytec
Industries Inc West Paterson NJ Selected characteristics of the polymers are given in Table 43
Table 43 Characteristics of polyacrylamides used in this study
Type Trade Name Structure (Barvenik 1994 Huang
et al 2001) Fraction of
charged units
Molecular
weight (gmol) a
NPAM N300
None ~ 6 x 10⁶
nPAM N300LMW None ~ 8 x 10⁴
CPAM C494
20)(
ba
b ~ 4 x 10⁶
a Measured using viscometry method (Brandrup and Immergut 1989 Ravve 2000)
a
CH
NH2
O = C
CH2
a
CH
NH2
O = C
CH2 CH2
b
CH
N+
O = C
O
(CH2)2
(CH3)3
Cl-
56
Degree of hydrolysis τ = b (a+b) was determined by acid-base titration (Anthony et al 1975)
τ = 1 defines the chemical formula of poly(acrylic acid) The degree of hydrolysis employed in
this study is a statistical quantity thus it does not correlate with the conformation of the polymer
molecule (Michaels 1954)
423 Synthesis of CPN and Microcomposites
Clay-polymer nanocomposites were synthesized through a solution intercalation
technique using bentonite and PAM The clay content and clay-to-polymer volume ratio were
0001 and 2 respectively which were the optimum conditions for the greatest quantity of
intercalated structure (Kim and Palomino 2011) Figure 41 shows scanning electron microscopy
images for bentonite and the synthesized CPN The synthesized CPN was (1) used in gel-form
or (2) air-dried and ground using pestle and mortar ie powder-form Gel-form CPN is the
synthesized CPN prior to air-drying and grinding
Kaolinite-PAM microcomposites were synthesized by mixing kaolinite slurry with PAM
solution for 24 hours The microcomposites were used to highlight affects of interlayer spacing
modification when compared to montmorillonite-PAM composites The concentration of PAM
was 240 mgL ie clay-to-polymer volume ratio = 625 which was the optimum condition for
the formation of microcomposites (Kim and Palomino 2009) Figure 42 shows scanning
electron microscopy images for kaolinite and the synthesized microcomposite Two types of
composites gel-form and powder-form were prepared as above
57
(a) (b)
Figure 41 Scanning electron microscopy images for (a) bentonite and (b) CPN synthesized
using bentonite and PAM
(a) (b)
Figure 42 Scanning electron microscopy images for (a) kaolinite and (b) microcomposite
synthesized using kaolinite and PAM
43 Micro-Scale Characterization
The term ldquomicrordquo used in this study is defined as the level of a clay particle ie lt 2 μm
in length Responsiveness of PAM in terms of conformation was investigated using dynamic
light scattering (DLS) and spectroscopic ellipsometry (SE) Although the polymer is expected to
have a particular conformation in a dilute solution it is not guaranteed that the polymer will have
3 μm 25 μm
5 μm 10 μm
58
the same conformation when adsorbed onto a clay mineral surface since the properties of a
surface play a critical role in the conformational behavior (Michaels 1954 Fleer 1993) Thus it
is important to characterize conformational behavior of the polymer not only in a dilute solution
but also on a clay mineral surface The polymer conformation in a dilute solution was
investigated using DLS while SE was used to explore conformational behavior of the polymer
adsorbed on a clay mineral surface
431 Dynamic Light Scattering
In a dilute solution where a conventional viscometer does not have enough sensitivity
dynamic light scattering (DLS) has been proven to be a powerful method to study the
morphology of clay particles polymer molecules and their complexes (Berne and Pecora 1976
Francois et al 1979 Kulicke et al 1982 Muzny et al 1996 Pignon et al 1996 Peng and Wu
1999 Nelson and Cosgrove 2004 Wu et al 2006 Connal et al 2008) Dynamic light
scattering offers many advantages speed versatility small sample size and measurement time
independent of particle density It is also a non-destructive technique For sub-micron sizes it is
sometimes the only viable technique
If a laser beam falls on a polymer solution and impinges upon the molecular particles the
electrons of the particles are induced to vibrate such that they interfere with the transmission of
light and cause scattering in various directions The fluctuations in the scattered light which are
related to the motion of the particles are measured For a dilute monodispersed suspension of
noninteracting particles the relaxation of the fluctuations (Г) is described by
Dn 2
0
))2
sin(4
(
where n is the refractive index of the suspending liquid λ0 is the wavelength of the laser in
vacuum α is the scattering angle and D is the particle diffusion coefficient For spherical
59
particles the Stokes-Einstein relationship relates the particle diameter d and the diffusion
constant D
Dt
Tkd B
)(3
where kB is the Boltzmannrsquos constant T is the absolute temperature and η(t) is the viscosity of
the liquid in which the particle is moving
A Mt dispersion and an nPAM solution were prepared at clay content of 4x10⁻⁵ and
polymer concentration of 15 mgL respectively The samples were then treated with 01M HCl
and NaOH solutions to reach the target pH (pH 3 6 and 115) DLS was performed using a nano
zeta potential and submicron particle size analyzer Beckman Coulter Delsa 400SX (Brookhaven
Instruments Corporation Holtsville NY) The wavelength of the laser light is 635nm
Measurements were conducted at 25 degC and the scattering angle was set at 90deg DLS was carried
out a total of two times per test condition PAM molecules were expected to have pH-dependent
hydrodynamic radius since PAM expands with increasing pH
10
100
1000
1 3 5 7 9 11 13
Hy
dro
dy
nam
ic R
adiu
s (
nm
)
pH
Mt
nPAM
Figure 43 Hydrodynamic radius of montmorillonite and nPAM as a function of pH
60
Figure 43 shows DLS results for montmorillonite and nPAM as a function of pH The
molecule size of nPAM was affected by pH as expected The hydrodynamic radius increased
with increasing pH The hydrodynamic radius of the polymer at pH 115 is approximately five
times larger than that at pH 3 Since the hydrolysis rate of PAM is theoretically the same at pH
below pH 10 the hydrodynamic radius at pH 6 was expected to be nearly the same as that at pH 3
However it was experimentally found that PAM molecules have slight negative charges even at
neutral pH due to hydrolysis of the amide group into acrylic acid (Kurenkov 1997) Repulsion
forces between negatively charged groups of PAM molecules induced expanded coiled
conformation at pH 6 With increasing pH the expanded coiled nPAM molecules become
extended (pH 115) The hydrodynamic radius of Mt in the dispersion also appeared to be pH-
dependent Since Mt has pH-dependent charges on its surface (Schindler 1981 Mohan and
Fogler 1997) flocculationaggregation the degree and extent of which are a function of pH
occurs leading to pH-dependent particle size
DLS results confirm that PAM is pH-responsive in an aqueous solution However DLS
cannot capture the conformation of PAM in the interlayer space of CPN since DLS does not
provide information on the location of polymer molecules Even if PAM in CPN is still pH-
responsive the pH-dependent behavior of Mt may hinder DLS from characterizing PAM
conformation of CPN
432 Spectroscopic Ellipsometry
In order to investigate the pH-responsiveness of PAM in CPN it has to first be
demonstrated that PAM is still pH-responsive on a surface In this chapter PAM molecules were
adsorbed onto a fixed surface simulating a clay mineral surface After the polymer adsorption
pH-responsiveness of PAM was explored at various pH values using SE The conformational
61
behavior of PAM adsorbed on the simulated surface is expected to be a function of ambient
solution pH
Amorphous SiO2 was used to simulate a clay mineral surface A simulated surface was
used instead of a real clay particle in order to accurately capture adsorbed PAM conformation and
its evolution using SE The complexities associated with utilizing true clay particles in
suspension (mobile suspended surface) with the technique would yield results that are difficult to
interpret Thus a simpler system was devised that would isolate the behavior of interest The
amorphous SiO2 layer used is simply the native oxide of crystalline silicon (c-Si) wafer The
simulated surface was placed at the bottom of a fused silica vessel with windows at 20deg to the
sample surface normal such that the incident light from the ellipsometer passes through the
windows at normal incidence as schematically shown in Figure 44 A polymer solution (1875
mgL) of 150ml was introduced to the vessel the polymer was allowed to adsorb onto the
simulated surface for 2 hours Since it has been reported that the adsorbed amount of PAM on a
silica surface reaches equilibrium within about an hour (Stemme et al 1999) a 2-hour time
period was selected to allow for PAM to be uniformly adsorbed onto the simulated surface
Consequently the adsorption density was same throughout the surface Also the equilibrium
period did not affect capturing time-dependent hydrolysis behavior of PAM since the adsorption
was allowed at neutral pH where the hydrolysis reaction occurs relatively slowly The solution
pH was then adjusted to the selected target value pH 3 6 or 115 Note that the simulated
surface is negatively charged at all tested pH conditions similar to the actual silica tetrahedral
sheet of montmorillonite However the charge density may be different
A model RC2 multichannel ellipsometer fabricated by J A Woollam Co Inc (Lincoln
NE) having a maximum spectral range from 075 to 515 eV and operating on the dual rotating
compensator principle (Chen et al 2004) was used for this study Ellipsometric spectra (in Δ ψ)
are collected at room temperature (20 plusmn 1degC) via real-time spectroscopic ellipsometry (RTSE)
62
Detector
Polarizer
Analyzer
Simulated Surface
Polymer
Layer
Thickness
Subjected to pH change
after polymer placementLaser
Light
Figure 44 Schematic of spectroscopic ellipsometry apparatus
monitoring during sample modification from reflection mode measurements at an oblique angle
of incidence of 70deg The spectral range was limited to 15 to 45 eV due to the absorption of light
by water (H2O)
The complex dielectric function spectra (ε = ε1 + iε2) or alternately the complex index of
refraction (N = n + ik) of the PAM layer and its time-dependent thickness variations were
extracted using a least squares regression analysis and an unweighted error function (Cong et al
1991) to fit the experimental RTSE data using structural models consisting of a semi-infinite c-Si
substrate 17 Aring native SiO2 PAM layer H2O structure For each sample measured ε is
obtained by fitting 10 individual SE measurements selected from the RTSE data to structural
models where the PAM thickness can vary A common parameterization for ε consisting of a
Sellmeier oscillator (Collins and Ferlauto 2005) and a constant additive term to ε1 was used In
this way a representative ε for each film is obtained which can then be used to determine the
PAM thickness for all ellipsometric spectra collected in real-time The underlying native oxide
thickness is determined from a separate measurement of each c-Si wafer in air Reference spectra
in ε for native SiO2 c-Si (Herzinger et al 1998) and H2O (Synowicki et al 2004) were used
Figure 45 shows the real part of (1 = n2 where 2 = 2nk = 0) obtained from RTSE
measurements of the PAM prepared at pH of 3 6 and 115 There appears to be little variation in
63
the PAM due to the pH of the solution and no absorption originating from the PAM is observed
in this spectral range 2= 0 1 for H2O is also shown to highlight the optical contrast present
between it and the PAM Figure 46-a shows the time-dependent PAM thickness for each
solution pH in this series over the span of one day The initial thickness d0 of the PAM layers
are different but range from 290 to 390 Aring The error on all thickness values is 4 Aring Figure 46-
b shows the percentage difference in the thickness for each layer as a function of time
determined by d = (d d0)d0 where d is the PAM thickness at a given time
Figure 45 Real part of the complex dielectric function spectra ( = 1 + i2) for PAM in
solutions with pH = 3 6 and 115 Also shown is 1 for H2O
225
275
325
375
425
0 400 800 1200
Th
ick
nes
s (
Aring)
Time (minutes)
pH asymp 6
pH asymp 3
pH asymp 115
-30
-20
-10
0
10
20
30
0 400 800 1200
Th
ick
nes
s C
han
ge
Δd
d0
()
Time (minutes)
pH asymp 6
pH asymp 3
pH asymp 115
Δd = d - d0
(a) (b)
Figures 46 (a) PAM thickness and (b) change in thickness as functions of time in solutions with
pH = 3 6 and 115
64
It appears that the PAM in the basic solution pH 115 swells by approximately 27 of
its initial value by the end of one day while the PAM in the acidic solutions pH 3 and 6 contract
by 26 and 17 respectively Closer investigation of the time dependent PAM layer thickness
show that the sample in pH 115 appears to initially decrease in the first 15 minutes by 7 then
subsequently increase throughout the remainder of RTSE monitoring The thickness of the PAM
in pH 115 saturates at about 600 minutes (10 hours) PAM in acid decreases monotonically with
time although PAM in the more acidic solution (pH 3) contracts more rapidly The contraction
rate for PAM in the pH 6 solution may be stabilizing after 900 minutes (15 hours) indicating that
a steady state may be reached PAM in the pH 3 solution does not appear to stabilize over the
measurement time
The initial difference in the layer thickness can be explained by a difference in ionic
strength due to the addition of 01M NaOH and HCl solution as a pH modifier The
concentration of Na+ at pH 115 was approximately 0006M while that of Cl- at pH 3 was
approximately 0001M which are large enough to limit expansion of PAM molecules resulting in
contracted coil conformation (Klenina and Lebedeva 1983 Aulich et al 2010 Bittrich et al
2010) Thus PAM in the absence of added ions ie at pH 6 has the maximum initial layer
thickness Assuming that no additional PAM attaches to the surface during this time for the pH
115 solution the PAM is expected to have initially contracted on the SiO2 surface but later
uncoiled resulting in the increased layer thickness After 15 minutes expansion of the PAM
molecules started to offset the initial decrease The PAM in pH 3 and 6 solutions begin
constricted and coiled near the SiO2 surface and continues to contract For the pH 6 case
however the changes in the layer thickness will stabilize over 15 hours while the PAM thickness
for the pH 3 case continues to decrease Since the layer thickness was expected to remain nearly
constant at pH 3 and 6 this unexpected time-dependent phenomenon at those pH values can be
considered with the concept of surface coverage It is well-known that adsorbed polymer layer
65
thickness decreases with increasing surface coverage and high molecular weight polymer
adsorbed on a surface slowly covers the surface (Leermakers et al 1996 Filippova 1998
Samoshina et al 2005) At all tested pH the same behavior of covering the surface occurs to
different degree due to pH-dependent charges on the PAM molecules Since surface coverage
increases with decreasing intermolecular repulsion (Leermakers et al 1996) the surface
coverage at pH 3 is the maximum leading to the minimum polymer layer thickness In theory the
surface coverage at pH 6 should be nearly the same as pH 3 However in reality PAM molecules
usually have slight negative charges at neutral pH caused by a finite degree of hydrolysis of
amide groups into acrylic acid (Kurenkov 1997) such that PAM molecules remain slightly
expanded coiled conformation
These RTSE results on the micro-scale PAM conformations were in reasonable
agreement with theory and previously found experimental results of PAM that PAM
conformation evolves from contracted coiled to extended as pH increases More importantly the
RTSE results confirm that PAM responsiveness to pH is still valid in the presence of a surface
44 Meso-Scale Characterization
The term ldquomesordquo used in this study is defined as the level of a significant number of clay-
polymer interactions ie 2 μm lt meso lt a few cm in length PAM appeared to have pH-
dependent conformational behavior even on a clay mineral surface evidenced by micro-scale
characterizations of PAM conformation at various pH values using dynamic light scattering and
spectroscopic ellipsometry In this section effects of such micro-scale conformational changes
on meso-scale CPN properties were investigated using specific surface area measurement
swelling test and hydraulic conductivity measurement These meso-scale characterizations may
reveal whether the controllable PAM conformation at the micro-scale is valid at the scale of
engineering applications
66
441 Specific Surface Area
Specific surface area is an important property of a clay mineral that determines amount of
accessible sites for polymer adsorption (Theng 1979 Liu and Zhang 2007) Specific surface
area measurements can be used as an indirect indicator of interlayer spacing of a clay mineral as
well as of polymer conformation The conformation of PAM molecules adsorbed onto particles
and interlayer surfaces varies with pH Thus a variation in specific surface area indicates a
change in the interlayer spacing resulting from the changing polymer molecule conformation
Gas adsorption and methylene blue (MB) adsorption are often used to measure specific surface
area Contrary to gas adsorption which utilizes dry samples the MB adsorption technique can be
applied to wet samples which is viable for characterization of tunable CPN synthesized using a
pH-responsive polymer and an expansive clay mineral Hence MB adsorption was used in this
study to measure the specific surface area of the synthesized CPN
The chemical formula of MB is C16H18N3SCl with a molecular weight of 31987 gmol
The thickness of a MB molecule is about 325Aring (Santamarina et al 2002b) Since the interlayer
spacing of Mt is about 22Aring only in the first stage of swelling ie short-range swelling (Theng
1979) MB molecules are readily adsorbed onto the interlayer surface and onto PAM molecules
previously adsorbed on the interlayer surface ie intercalated Therefore interlayer spacing
varying with PAM conformation was investigated through MB specific surface measurements
CPN and microcomposites were synthesized as aforementioned (Section 423) Clay
alone samples were also prepared as a comparison at the same clay content used for each system
The samples were then treated with 01M HCl and NaOH solutions to reach the target pH (pH 3
6 and 115) MB specific surface area measurement was carried out following the modified
European spot method (Kandhal and Parker 1998 Santamarina et al 2002b)
67
Interlayer spacing of clay minerals varying with PAM conformation was investigated
through specific surface area measurements The specific surface area was influenced by pH
(Figure 47) Since kaolinite has pH-dependent charges on its surface (van Olphen 1977 Ma and
Eggleton 1999) pH-dependent specific surface area for pure kaolinite dispersion was expected
Due to protonation and deprotonation the pH-dependent sites become positively charged with
decreasing pH inducing a decrease in MB adsorption (Ghosh and Bhattacharyya 2002) Two
important observations in Figure 47-a are (1) the specific surface area of kaolinite-nPAM
microcomposites is pH-dependent and (2) the extent of the changes in specific surface area of the
microcomposites varying with pH is greater than that of pure kaolinite dispersion This is likely
due to the pH-dependent charges of kaolinite as well as the pH-dependent conformational
behavior of PAM This observation confirms the ellipsometric observation that PAM is still pH-
responsive on a clay mineral surface (Figure 47) Note that the specific surface area of the
microcomposites was smaller than that of pure kaolinite dispersion at all tested pH ranges It was
previously reported that polymer adsorption onto kaolinite decreases specific surface area since
polymer molecules induce flocculationaggregation of clay particles (Nabzar and Pefferkorn
1985)
While Mt theoretically has pH-dependent charges at the particle edges these charges
represent less than 5 of the total surface charge In addition to the particle edges particle faces
were also reported to be pH-dependent representing as much as 20 of the face surface charge
(Schindler 1981 Mohan and Fogler 1997) Due to protonation and deprotonation the pH-
dependent sites become positively charged with decreasing pH and negatively charged with
increasing pH MB molecules are positively charged in aqueous solution and thus are more easily
adsorbed onto the mineral surface with increasing pH (Chen et al 1999 Ghosh and
Bhattacharyya 2002) Such a contribution to the overall surface charge could explain the
apparent increase in specific surface area from pH 3 to pH 115 (Raymahashay 1987)
68
10
20
30
40
50
1 3 5 7 9 11 13
Surf
ace
area
(m
2g
)
pH
Kaolinite
Kaolinite+nPAM
(a)
400
600
800
1000
1200
1 3 5 7 9 11 13
Surf
ace
area
(m
2g
)
pH
Mt+nPAM
Mt
(b)
Figure 47 MB specific surface area of (a) microcomposites and (b) CPN as a function of pH
Clay-to-polymer volume ratio for (a) and (b) was 625 and 2 respectively
69
In contrast to the kaolinite-PAM microcomposites an even greater increase in MB
specific surface area for CPN was observed with increasing pH It is likely attributable to the
difference in clay-to-polymer volume ratio The clay-to-polymer volume ratio for the CPN is
much smaller than that for the microcomposites ie 2 vs 625 Thus polymer molecules became
a dominant factor to determine the specific surface area of the CPN The specific surface area
increased with increasing pH For pure Mt specific surface area increased by approximately 10
from pH 6 to pH 115 while that for CPN increased by approximately 50 in the same pH range
In addition to the pH-dependency of the mineral surface it is also likely that the extended
conformation of PAM at high pH provides more available surface sites for MB adsorption
This result implies that interlayer spacings increase with extended PAM conformation at
basic pH When the polymer conformation becomes extended both the increased interlayer
spacing and the extended polymer molecules allow more MB molecules to be adsorbed onto the
interlayer surface and onto the polymer surface This increases the apparent specific surface area
Nevertheless further testing is required to demonstrate which factor(s) determines the behavior
since clay surface charge MB adsorption and PAM conformation vary simultaneously with pH
Specifically the increase in MB specific surface area at pH 115 is due possibly to (1) negatively
charged clay surfaces (2) negatively charged polymer surfaces (hydrolyzed to COO-) (3)
cationic MB molecules (C16H18N3S+) in water and (4) fully extended conformation of the
polymer
442 Swelling Test
Swelling behavior of clay minerals in the presence of moisture is often a problem in the
development and maintenance of geotechnical and geoenvironmental engineering applications
The swelling behavior depends on factors such as mineral composition grain size aggregate size
cationic exchange capacity chemical composition and concentration of the bulk fluid
70
(Shackelford et al 2000 Ashmawy et al 2002) Polymer treatment was reported to limit
swelling behavior of clay minerals (Inyang et al 2007) Therefore tunable CPN cannot only
limit the swelling behavior but also provide an additional benefit due to its controllable swelling
property For example a tunable CPN synthesized using a pH-responsive polymer and an
expansive clay can be used to filtrate waste water corresponding to its pH such that extremely
high pH or low pH waste water can be separated protecting a natural ecology Thus quantitative
understanding of swelling behavior of tunable CPN is important for engineered soil applications
Comparing swelling behavior of the microcomposites with that of CPN effects of
internal swelling can be investigated As mentioned previously kaolinite has little swelling
potential Thus only the interparticle spacing of PAM-treated kaolinite is affected
(microcomposite as in Figure 26-a) On the other hand polymer intercalation into the interlayer
space of Mt was achieved through a solution intercalation technique leading to nanocomposite
with intercalated structure (Figure 26-b) Kaolinite-PAM microcomposites and CPN were
synthesized as described in Section 423 Swelling ratio was determined by measuring water
absorbency (Vazquez et al 1997 Bajpai and Giri 2003 Mahdavinia et al 2004) The
synthesized composites in dry powder form (1g) was placed into a weighed filter bag and
immersed in 250 ml deionized water The water pH was adjusted to the target pH (pH 3 6 and
115) using 01M HCl or 01M NaOH solution The sample was allowed to hydrate with water at
room temperature At consecutive time intervals the filter bag containing the swollen sample
was allowed to drain by hanging until water drops no longer fell from the sample (~20 minutes)
The bag was then weighed to determine the mass of the swollen gel The swelling ratio was
calculated by dividing the mass of the swollen sample by the mass of the dry sample
71
0
1
2
0 24 48 72
Sw
elli
ng r
ati
o
Time (hour)
pH 115
pH 6
pH 3
(a)
0
5
10
15
0 24 48 72
Sw
elli
ng r
ati
o
Time (hour)
pH 115
pH 6
pH 3
(b)
Figure 48 Swelling ratio of (a) microcomposites and (b) CPN as functions of pH and time The
dashed lines indicate the swelling ratios for the untreated (no polymer) materials
Untreated
Kaolinite
Untreated
Mt
72
The swelling ratio determined by measuring water absorbency is shown in Figure 48
The swelling ratio tends to increase with time at all tested pH until reaching equilibrium but the
magnitude differs significantly After 72 hours the microcomposites and the CPN at pH 115
have swelling ratio of 145 and 129 respectively while those at pH 3 have swelling ratio of
approximately 11 and 38 respectively As expected the PAM hydrolysis rate was greater under
a basic condition (Kheradmand et al 1988 Kurenkov 1997) The measured degree of
hydrolysis for the polymer at pH 115 was 081 which is in good agreement with reported
experimental values of maximum degree of hydrolysis (Kurenkov 1997 Huang et al 2001)
The difference in swelling ratio between samples at pH 3 and 6 was expected to be insignificant
since little ionization occurs at pH below pH 85 ie about 2 units lower than the pKa value
However PAM hydrolysis at neutral pH as well as the addition of 01M HCl solution to adjust
the solution pH may have contributed to the observed difference seen in both the microcomposite
and the CPN
In spite of previously reported results that polymer treatment limits swelling behavior
(Inyang et al 2007) this result implies that conformational changes of PAM adsorbed in the
interlayer space lead to interlayer spacing changes However the magnitude of internal swelling
and external swelling due to PAM conformation change cannot be separated since the surface
characteristics of kaolinite and Mt are different from each other Nevertheless these results
indicate that both interlayer and interparticle spacings can be modified by a pH-responsive
polymer Another important finding from the results is that the swelling property of clay-polymer
composites synthesized with a pH-responsive polymer can be controlled by altering the pH
condition such that the swelling is either less than or greater than that of the untreated material
Note that swelling ratios for untreated clay minerals were obtained from swell index
(ASTM D5890) (2006) The swelling ratio for untreated clay minerals was volumetric ratio of
the soil sample before and after the sample is immersed in deionized water for 72 hours
73
Equilibrium swelling ratios for untreated clay minerals was reached after 24 hours The swelling
ratio for untreated kaolinite was 1 at all tested pH conditions while that for untreated Mt was
117 12 and 115 at pH 3 6 and 115 respectively It was previously reported that Mt swelling
decreased with increasing ionic strength (Herbert et al 2008) Thus the slightly pH-dependent
swelling ratio for pure Mt is likely attributed to increased ionic concentration by adding 01M
HCl or NaOH solution as a pH-modifier Expansion of polymer conformation is also limited by
high ionic strength at highlow pH (Aulich et al 2010 Bittrich et al 2010) Thus the same
effect likely occurred in the swelling ratio measurement for the microcomposites and the CPN
However when comparing the extent of PAM conformation changes the effect of increased ionic
strength was insignificant after equilibrium is reached
443 Hydraulic Conductivity Measurement
Hydraulic conductivity (permeability) which is one of most important characteristics in
the field of geotechnical and geoenvironmental engineering is affected by fabric anisotropy pore
fluid chemistry mineral type including particle size size distribution and chemical composition
internal swelling saturation and compaction method of a soil system (Mitchell 1993) Different
fabric types for kaolinite and Mt lead to different permeability values (Mitchell 1956 Suarez et
al 1984) For example open fabric (eg edge-to-face and edge-to-edge) systems have two
orders of magnitude greater permeability than closed fabric (eg face-to-face and dispersed)
systems Internal swelling of clay soil systems decreases permeability (Jo et al 2001) and can be
limited by treating with a polymer (Inyang et al 2007) Polymer adsorption onto clay particles
occurs at the external surface and internal surface (ie intercalation) altering the fabric type and
the interlayer spacing Thus the effect of fabric type and internal swelling is of concern in this
study
74
Hydraulic conductivity tests were conducted to investigate pH-dependent meso-scale
behavior of kaolinite-PAM microcomposite and CPN materials Permeability of the
microcomposites and the CPN should decrease with increasing pH since PAM extends under high
pH conditions resulting in swelling of the composites Consequently the surrounding pore size
reduces A reduction in the pore size prevents water flow through the system thus decreasing
permeability (Gardner and Arias 2000 Shackelford et al 2000 El-Hajji et al 2001 Jo et al
2001) Effects of sample type polymer molecular weight (MW) and ionic type of polymer were
also investigated Two different sample types ndash gel-form and powder-form ndash were used Three
different PAM ndash low MW nonionic PAM high MW nonionic PAM and high MW cationic PAM
ndash were used
A pressurized permeameter was used for this study The permeability test apparatus
included a confining pressure cell and equipment for supplying a driving pressure greater than
ambient pressure to the sample (Figure 49) This pressurized permeability test (Plaks 2010) was
adopted to minimize the measurement time and preferential flow The permeability cell consists
of a hollow metal cylinder which holds a Tygon tube with an inner diameter of 254 cm Clay-
polymer composites of 23 g were synthesized in either gel-from or powder-form using three
different PAM ie low MW PAM high MW nonionic PAM and high MW cationic PAM Thus
total number of samples was 16 including untreated (no polymer) kaolinite and Mt The
synthesized materials were placed in the Tygon tube and then compacted using a tamping rod
until the packed sample length is 4 cm so the void ratio of the sample is 05 A confining
pressure of 50 lbin2 and a driving pressure of 25 lbin2 were applied though high pressure
permeant lines connected to the permeability cell The permeant solution was pH-adjusted
deionized water The pH was adjusted to pH 3 6 or 115 using 01M HCl or 01M NaOH
solution A test at one pH condition was run until the effluent pH and electrical conductivity
reached equilibrium Effluent pH and electrical conductivity were monitored at consecutive time
75
Pressure
Control PanelGas
Supply
Influent
Solution Reservoir
Driving Pressure
Confining
PressurePermeability
Cell
Effluent
Collector
Figure 49 Schematic of pressurized permeability test apparatus with a picture of permeability
cell
intervals After replacing the influent solution with next target pH another permeability
measurement was conducted on the same sample Once a cycle of permeability tests with four
pH conditions (pH 6 pH 3 pH 6 pH 115) was completed the sample was replaced
Sample calculations for permeability can be found in Appendix B Note that a permeability of
1x10⁻¹⁰ cms was the experimental minimum of the test apparatus
Figure 410 shows the hydraulic conductivity test results for kaolinite-PAM
microcomposites as a function of pH Permeability tends to decrease with increasing pH for all
tested samples Due to pH-dependent surface charges of kaolinite pure kaolinite has a slightly
pH-dependent permeability The pH-dependent surface leads to dispersed fabric at high pH
resulting in low permeability (Mitchell 1956 Santamarina et al 2001 Palomino and
Santamarina 2005) For the microcomposites polymer adsorption induced flocculation or
aggregation of kaolinite particles leading to larger pore sizes in the system Kaolinite-NPAM
microcomposites have the greatest permeability since high molecular weight PAM links more
kaolinite particles leading to larger flocsaggregates ie larger pore size Greater decreases in
76
permeability for the microcomposites with increasing pH than the case of pure kaolinite were
observed (Figure 410-a) Since PAM conformation becomes extended at high pH these
10E-10
10E-08
10E-06
10E-04
1 3 5 7 9 11 13
Per
mea
bil
ity
(cm
s)
pH
Kaolinite+nPAM
Kaolinite+NPAM
Kaolinite+CPAM
Kaolinite
(a)
10E-10
10E-08
10E-06
10E-04
1 3 5 7 9 11 13
Per
mea
bil
ity
(cm
s)
pH
Kaolinite+nPAM
Kaolinite+NPAM
Kaolinite+CPAM
Kaolinite
(b)
Figure 410 Permeability of kaolinite-PAM microcomposites as a function of pH (a) gel-form
and (b) powder-form
77
decreases in permeability were likely due to PAM-induced pore size reduction For kaolinite-
CPAM microcomposites the magnitude of permeability changes with pH differs from other
microcomposites since cationic PAM molecules preferentially link negatively charged kaolinite
particles reducing the expansion of PAM molecules The ion-ion interaction between a kaolinite
particle and a CPAM molecule is even stronger than the ion-dipole interaction between a
kaolinite particle and a nPAMNPAM molecule (Ebnesajjad 2006)
For the microcomposites in powder form (Figure 410-b) permeability decreased to a
lesser degree when treated with PAM This is attributed to mechanical degradation of PAM
molecules when ground (Kulicke et al 1982) Since the air-dried microcomposites were ground
into nearly same sized particles PAM molecules adsorbed on the kaolinite surfaces were trimmed
to nearly same sized chains Thus all three types of kaolnite-PAM microcomposites appear as
having nearly the same permeability at pH 3 and 6 At pH 115 slightly higher permeability of
kaolinite-CPAM microcomposites was observed due to wholely negatively charged kaolinite
surfaces Kaolinite particles become negatively charged on both silica and aluminum sheets at
pH gt 8 since the isoelectric point for the face and edge of kaolinite particle is about pH 79 and
pH 72 respectively (Santamarina et al 2001 Tekin et al 2005)
Figure 411 shows the hydraulic conductivity test results for CPN as a function of pH
Permeability tends to decrease with increasing pH for all tested samples Due to pH-dependent
surface charges of Mt pure Mt has slightly pH-dependent permeability As pH decreases the
particle edges become positively charged while the particle faces still remain negatively charged
inducing electrostatic attraction between the edges and faces ie edge-to-face flocculation
(Lagaly 1989 Mohan and Fogler 1997)
For CPN polymer adsorption induced flocculationaggregation of Mt particles leads to
larger pore sizes in the system Mt-nPAM nanocomposites have the greatest permeability which
is different from the case of kaolinite-PAM microcomposites This implies that internal swelling
78
10E-10
10E-08
10E-06
10E-04
1 3 5 7 9 11 13
Per
mea
bilit
y (
cms
)
pH
Mt+nPAM
Mt+NPAM
Mt+CPAM
Mt
(a)
10E-10
10E-08
10E-06
10E-04
1 3 5 7 9 11 13
Per
mea
bilit
y (
cms
)
pH
Mt+nPAM
Mt+NPAM
Mt+CPAM
Mt
(b)
Figure 411 Permeability of CPN as a function of pH (a) gel-form and (b) powder-form
as well as fabric type plays a significant role in permeability nPAM was found to be most
readily intercalated into the interlayer space of Mt thus Mt-nPAM nanocomposites are likely to
79
have the greatest ability for permeability modification by pH changes Greater decreases in
permeability for CPN with increasing pH than the case of pure Mt were observed (Figure 411-a)
Since PAM conformation becomes extended at high pH the greater decreases in permeability
were likely due to PAM-induced pore size reduction For Mt-CPAM nanocomposites the
different magnitudes of the pH-dependent permeability changes from other CPN is because
cationic PAM molecules preferentially link negatively charged Mt particles hindering an
expansion of PAM molecules
For the CPN in powder form (Figure 411-b) permeability decreased to a lesser degree
All three types of CPN appeared to have nearly the same permeability at pH 3 and 6 Like to the
microcomposites this is attributed to mechanical degradation of PAM molecules when ground
(Kulicke et al 1982) At pH 115 higher permeability of Mt-CPAM nanocomposites was due to
the higher affinity of cationic PAM molecules to the negatively charged Mt surfaces
45 Linkage of Micro-Scale Behavior to Meso-Scale Property
It was observed that the micro-scale polymer conformation influenced meso-scale CPN
properties including specific surface area swelling potential and permeability From the
evidence of DLS and SE measurements the coiled polymer conformation at pH 3 becomes
expanded coiled at pH 6 and further extended with increasing pH (pH 115) Meso-scale CPN
properties were affected by the pH-dependent PAM conformation Specific surface area
increased with extended conformation of PAM while it decreased with coiled conformation of
PAM Swelling potential also increased with increasing pH ie extended conformation of PAM
The increase in swelling potential of CPN induced a decrease in pore size in the CPN system
resulting in decreased permeability
In comparing hydrodynamic radius measurements obtained from DLS to adsorbed PAM
layer thickness measurements obtained from SE a qualitative agreement was found that both
80
hydrodynamic radius and adsorbed PAM layer thickness increase with increasing pH (Figure
412) According to scaling law theory (de Gennes 1987) the maximum possible hydrodynamic
thickness for PAM is 12181 nm assuming one layer adsorption of PAM on the surface However
the adsorbed thickness at pH 115 was approximately 375 nm Such a discrepancy may result
from many factors affecting the polymer comformation including ionic strength due to the
addition of pH modifiers crosslinking effect and intra-interactions of the polymer and
interactions between polymers and surfaces (Klenina and Lebedeva 1983 de Gennes 1987
Askadskii 1990 Fleer 1993 Lee et al 1999 Wu et al 2001 Aulich et al 2010 Bittrich et al
2010) Note that the scaling law theory does not provide any insight into the conformation of the
polymer adsorbed on a surface (Campbell et al 2002) The same discrepancy was observed
when comparing conformational behavior of the polymer at two different scales ie adsorbed
PAM layer thickness vs swelling ratio (Figure 413) However a qualitative agreement was
found between the adsorbed PAM layer thickness and the swelling ratio
0
10
20
30
40
0
20
40
60
80
100
1 3 5 7 9 11 13
Ad
sorb
ed P
AM
Lay
er T
hic
kn
ess
(nm
)
Hy
dro
dy
nam
ic R
adiu
s (n
m)
Solution pH
Hydrodynamic radius of PAM
Adsorbed PAM layer thickness
Figure 412 Behavior comparison between hydrodynamic radius and adsorbed layer thickness of
PAM Hydrodynamic radius was measured using dynamic light scattering and adsorbed PAM
layer thickness was obtained from spectroscopic ellipsometry
81
0
5
10
15
0
10
20
30
40
1 3 5 7 9 11 13
Sw
elling
R
atio
Ad
sorb
ed P
AM
Lay
er T
hic
knes
s (n
m)
Solution pH
Adsorbed PAM layer thickness
Swelling ratio
Figure 413 Behavior comparison between adsorbed PAM layer thickness and swelling ratio
Adsorbed PAM layer thickness was obtained from spectroscopic ellipsometry and swelling ratio
was measured using water absorbency tests
The extent of conformation changes was likely to be affected by the presence of a clay
surface Based on DLS results PAM layer thickness should increase by approximately 100
from pH 6 to pH 115 However the layer thickness of PAM adsorbed on a surface increased by
approximately 20 (Figure 412) Similar phenomenon was also observed for PAM sandwiched
in between two surfaces (Figure 47) Based on the surface area of a PAM molecule calculated
using hydrodynamic radius the surface area of a PAM molecule increases by approximately
500 from pH 6 to pH 115 in a bulk aqueous solution However surface area contribution of
PAM molecules to the increase in CPN specific surface area was approximately 50 Thus the
conformational behavior of PAM was further limited when it is adsorbed in between two surfaces
These phenomena can be explained by the previously reported observation that the logarithmic
value of the acid dissociation constant pKa inside a polymer molecule is different from the pKa
value near a surface (Dong et al 2009) Possible reasons for this gradient include minimization
82
of the systemsrsquo free energy and inhomogeneous polymer volume distribution or the formation of
a double layer at the polymer-solution interface reducing the ion transport into the polymer
molecule (Uhlik et al 2004 Gong et al 2007)
Yet a quantitative linkage between the micro-scale PAM conformation and the meso-
scale properties cannot be made due to (1) many factors affecting the behavior simultaneously
and (2) experimental limitations of characterizing the location of polymer molecules in CPN ndash
either in the interlayer spacing or on the particle surface Computer simulation providing a
molecular level understanding of the mechanisms responsible for the behavior of clay-polymer
systems can be an alternative to capture the PAM behavior in the interlayer spacing of CPN
Such a technique is expected not only to complement experimental results with a detailed micro
level picture of the relevant phenomena but also to illuminate systems inaccessible via current
experimental methods
46 Conclusions
In this chapter micro-scale conformational behavior of a pH-responsive polymer was
qualitatively linked to meso-scale properties of clay-polymer nanocomposites (CPN) including
specific surface area swelling potential and permeability The micro-scale polymer
conformation studied by dynamic light scattering (DLS) and real-time spectroscopic ellipsometry
(RTSE) was in a reasonable agreement with the measured specific surface area swelling potential
and permeability of the CPN
The conformation of polyacrylamide (PAM) in an aqueous solution varied with pH from
coiled (pH 3) to extended (pH 115) Corresponding to the conformational changes layer
thickness of PAM adsorbed on a surface meso-scale properties of the synthesized clay-polymer
composites including specific surface area swelling potential and permeability were modified by
altering the pH condition The layer thickness specific surface area and swelling potential
83
increased significantly with increasing pH corresponding to the extended conformation of PAM
at basic pH The increase in swelling potential reduced the pore size leading to a decrease in
permeability In the presence of a surface the conformational changes were limited However a
quantitative linkage was not made due to experimental limitations and complex pH-dependencies
of clay surface charge and PAM conformation
Nevertheless the effectiveness of the use of a pH-responsive polymer has been
established in this chapter Understanding the kinetics of PAM conformational behavior on a
simulated surface verified by specific surface area swelling potential measurements and
permeability tests on real CPN will assist in developing strategies for designing CPN with tunable
engineering properties
84
Chapter 5
COMPUTER SIMULATION
The purpose of this chapter is to computationally investigate responsiveness or tunability
of clay-polymer nanocomposites (CPN) with controllable micro-scale interlayer and interparticle
spacing since quantification is limited with current experimental techniques The quantitatively
found computer simulation results will be linked to an experimentally measured property of the
CPN Descriptions of computational procedures and their interpretation are provided
quantitatively verifying that the micro-scale conformational changes of polymer lead to meso-
scale property changes
51 Introduction
In spite of the considerable number of studies of CPN clay intercalation by polymer is
not yet fully understood Due to many factors affecting the process and difficulties of developing
tools capable of monitoring the process quantifying final morphology and properties of the final
CPN is very challenging In addition nearly amorphous characteristics of clay minerals and the
interactions responsible for meso-scale properties occurring at the length scales of monomers
approximately a billionth of a meter limit probing with current experimental techniques
Understanding the conformational behavior of a responsive polymer adsorbed on a surface is
critical to predicting the behavior of tunable CPN Thus computer simulation may play an ever-
increasing role in designing and predicting material properties and designing such experimental
work
Computer simulation can provide insight into the molecular level understanding of the
mechanisms responsible for the behavior of clay-polymer systems All forces and interactions
occurring at the micro-level can be simulated through mathematical equations Such a technique
not only complements experimental results with a detailed atomistic level picture of the relevant
85
phenomena but also illuminates systems unaccessible via experimental methods Computer
simulation of clays and polymers based on theories and computational methods have long been
used to study and understand their complex behavior (Chang et al 1995 Skipper et al 1995
Boek et al 1996 Groot and Warren 1997 Sposito et al 1999 Balazs et al 2000 Bourg et al
2003 Cygan et al 2004b Pandey et al 2005 Sutton and Sposito 2006 Suter et al 2009) The
purpose of this study is to investigate pH-dependent conformational behavior of a polyacrylamide
(PAM) in an aqueous solution and to link the micro-scale conformational changes to a meso-scale
CPN property Dissipative particle dynamics (DPD) a coarse-grained atomistic computer
simulation technique was used to simulate micro-scale CPN behavior Three different conditions
were simulated (1) polymer in an aqueous solution (2) polymer adsorbed on a clay layer surface
and (3) polymer sandwiched between two clay layers An attempt was made to link the
composite response predicted with DPD to the experimentally measured CPN properties under
similar pH conditions
52 Mapping of Length- and Time Scales
In a DPD simulation it is necessary to map physical length and time scales with reduced
units in order to match the simulated system behavior with actual system conditions Groot and
co-authors (Groot and Warren 1997 Groot and Rabone 2001) report that the distance beyond
which all forces become zero the so-called cutoff radius is always unity Thus when
representing more than a single water molecule with a single DPD bead Groot et alrsquos
parameterization often fails For example an increase in the repulsion parameter led to freezing
of a DPD liquid This represents an upper limit of coarse-graining (CG) (Pivkin and Karniadakis
2006) An alternative CG method was developed such that the cutoff radius can be adjusted
(Fuchslin et al 2009) This method prescribes enlarging the interaction radius of DPD beads
while decreasing the number of DPD beads in a system Using this method a simple monomeric
86
DPD system with a CG level of up to 125 was simulated without changing the pressure or mass
density of the system This alternative method of coarse-graining was adopted for this study
The scaling relations for the CG level number mass and cutoff radius of DPD beads DPD force
constants and energy and time units are listed in Table 51
The density and the number of atoms to be coarse-grained into a DPD bead influence the
mapping between physical and reduced length- and time scales In this study =1 represents a
system in which one water molecule is coarse-grained into a DPD bead Thus simulation
parameters for =1 are rc=1 m=1 α=25 γ=45 σ=3 and ε=1 (Groot and Warren 1997) These
parameters imply that each DPD bead has a volume equal to the volume of a water molecule (asymp
30 Aring 3) hence rc = 4481 Aring at mass density ρ=3 (Groot 2003) These parameters are scaled
according to the described scaling relations for other coarse-graining levels For example for
=12 simulation parameters should be rc=12 m=12 α=131037 γ=23587 σ=23792 and ε=12
Table 51 Scaling relations used in this study (Fuchslin et al 2009)
Scaling ratio = 1 Scaling ratio =
Total number of DPD beads N -1 N
Mass m m
Cutoff radius rc 1d rc
Force constant α 1-1d α
Friction coefficient γ 1-1d γ
Noise amplitude σ 1-1(2d) σ
Energy unit ε ε
Time unit τ 1d τ
d is the number of dimensions of the system
87
53 Polyacrylamide in an Aqueous Solution
The first step in this study was to investigate the polymer conformation with various
charge fractions in an aqueous solution The DPD method has been successfully used to simulate
the conformation of charged polymers (Gonzalez-Melchor et al 2006) Gonzalez-Melchor et al
found that the root mean square radius of gyration which represents the morphology of polymer
molecules increases with increasing charge fraction on the polymer chain in an aqueous solution
Thus the root mean square radius of gyration was used to monitor the conformation of the
polymer with eight different charge fractions 0 01 0143 02 025 033 05 and 08 The
charge fraction was defined as the number of charged beads with respect to the total number of
beads composing the polymer molecule Hence the difference in charge fraction was simulated
by increasing the number of charged beads on a polymer chain The maximum charge fraction
was set to 08 since the maximum degree of hydrolysis of polyacrylamide is 80 (Kurenkov
1997 Huang et al 2001) In order to remove the effect of ionic strength which has been reported
to influence polymer conformation (Fleer 1993) the ionic concentration was kept at zero by not
adding any salts beads
The system considered here includes a long chain of polymer molecules with charges
counterions and water molecules Each of these components was modeled explicitly A cubic
simulation box of size 50 x 50 x 50 in DPD length units was employed The DPD parameters
used in this study are found in Tables 52 and 53 The overall mass density of the system was
held constant at ρm = 3 For a system with 1 the force constant between like beads was
determined as αii = 75ρm (Groot and Warren 1997) The force constant between unlike beads
αij was determined as (Groot 2000)
αij = αii + 3268middotχij
where αii is the force constant between like beads and χij is the Flory-Huggins parameter which is
048plusmn001 for the given polymer in water at 30degC (Huang et al 2001) The force constant was
88
Table 52 DPD parameters used in this study
= 1 = 12
Mass 1 12
Mass density 3 3
Number density 3 025
Cutoff radius 1 2289
γ 45 23587
σ 3 23792
ε 1 12
τ 1 2289
Table 53 Force constants α used in this study
water
Non-
charged
PAM
Charged
PAM
Non-
charged
clay
Charged
Clay Counterion
water 13104 13261 10483 13261 4717 13104
Non-charged
PAM 13104 13104 4717 1048 13261
Charged PAM 13104 1048 13261 13261
Non-charged
clay 13104 13104 13261
Charged Clay 13104 13261
Counterion 13104
also calculated based on the solvency of each component as (Kong et al 1997 Gibson et al
1998)
αij = αii (1 + ζ)
89
where ζ is the solvency of the solvent The theta-solvent condition (random coil conformation)
occurs at ζ=0 The solvency between water and polyacrylamide was set to -002 to reflect the
water-soluble nature of the polymer (Gibson et al 1998)
DPD parameters for a system with 12 were calculated according to Fuchslinrsquos scaling
relations shown as above (Fuchslin et al 2009) This scaling ratio was selected in the
consideration of efficiency and accuracy At this scaling ratio a 236-bead polymer corresponds
to mapping polyacrylamide (PAM) with molecular weight Mw=80000
A constant time step of Δt = 004 was used so that the investigation of the equations of
motion remained stable and the average temperature of the system did not exceed a system
temperature plusmn2 All simulations were performed using the LAMMPS molecular dynamics
simulator (Plimpton 1995) A simulation was run for 500000 time steps to reach equilibrium
followed by another 500000 time steps to calculate average properties of the system
One polyacrylamide molecule in water was simulated at eight different charge fractions
The main result of this type of simulation is the root mean square radius of gyration ltRg2gt12 of
the polymer in the solution as a function of charge fraction The radius of gyration is a key
property that varies with polymer conformation which has been studied both theoretically and
experimentally (Francois et al 1979 Medjahdi et al 1990 Stigter and Dill 1995 Griffiths et
al 2004) The root mean square radius of gyration was calculated by
i
cmiig rrmM
R 2212)(
1
where M is the total mass of polymer molecule mi and ri are the mass and position of ith
monomer and rcm is the center-of-mass position of the molecule Since the conformation of
polyacrylamide varies with pH the radius of gyration should also vary with pH pH of the
simulated solution was calculated with the Henderson-Hasselbalch equation (Katchalsky and
Spitnik 1947)
90
3
4
5
0 025 05 075 1
ltR
g2gt
12
Charge Density
(a)
3
4
5
5 7 9 11 13
ltR
g2gt
12
pH
(b)
Figure 51 ltRg2gt12 of the simulated polymer in water as a function of (a) charge fraction and (b)
pH
91
apKc
cpH
)
1(log10
where c is charge density and pKa is the logarithmic value of the acid dissociation ndash acidity ndash
constant (108 for polyacrylamide) Simulated root mean square radius of gyration results of the
polymer are shown in Figure 51
Figure 51-a shows the results for the root mean square radius of gyration as a function of
charge density The trend is in good agreement with experimental results (Stigter and Dill 1995)
Figure 51-b shows the pH-dependent root mean square radius of gyration The radius of gyration
abruptly changed around the pH value of the polymerrsquos pKa which qualitatively corresponds to
experimental results (Griffiths et al 2004) Note that pH values of 1 and 14 correspond
theoretically to the fully coiled and fully extended polymer conformation respectively (Stigter
and Dill 1995) In order to confirm that the apparent increase in the root mean square radius of
gyration between charge density 025 and 033 plots of ltRg2gt12 vs simulation time intervals are
displayed in Figure 52 Figure 52 also demonstrates that the used time step of 500000 for
equilibrium was appropriate for the studied system
35
45
55
0 5 10 15
ltR
g2gt
12
Time (μs)
35
45
55
0 5 10 15
ltR
g2gt
12
Time (μs)
(a) (b)
Figure 52 ltRg2gt12 vs simulation time for PAM with charge density of (a) 025 and (b) 033
92
54 Polyacrylamide Adsorbed on a Clay Particle
After investigating the conformational behavior of the polymer in an aqueous solution
the conformation of adsorbed polymer on a clay particle was explored using the DPD method A
polymer molecule and a clay layer were placed in a cubic simulation box of size 50 x 50 x 50 in
DPD length units The clay layer was tethered at the bottom of the simulation box (z=1) by a stiff
harmonic spring A system containing the polymer molecule with no charges and the clay layer
were simulated for 500000 time steps allowing adsorption of the polymer molecule onto the clay
layer surface Another 500000 time steps were run at each selected polymer charge fraction to
collect average properties of the system Z-coordination and root mean square radius of gyration
of the polymer were monitored In order to isolate the conformational behavior of PAM the clay
surface charge density was fixed at 02 which is a typical charge fraction for a montmorillonite
(Mt) surface
The z-coordination and root mean square radius of gyration of a PAM molecule as well
as the conformational behavior of the PAM molecule adsorbed on a clay surface were
investigated Simulated results of root mean square radius of gyration of the polymer and the
polymer layer thickness ie averaged z-coordination of the polymer are shown in Figure 53
Figure 53-a shows the results for the root mean square radius of gyration as a function of
charge density The trend is in good agreement with that for the polymer in an aqueous solution
(Figure 51-a) However there appear to be slight differences between this case and the polymer
molecule in solution alone The difference may be attributed to the interactions between the
surface and the polymer which induced a bulk pKa value inside the polymer molecule different
from the pKa value near the surface (Uhlik et al 2004 Gong et al 2007 Dong et al 2009) At
pH 85~10 the expected force on the polymer molecule is repulsion so that the conformation is
expanded-coiled At pH gt 10 the expected repulsive force on the polymer molecule further
increases and the corresponding conformation also increases leading to the maximum polymer
93
3
4
5
0 025 05 075 1
ltR
g2gt
12
Charge Density
(a)
0
10
20
30
40
50
5 7 9 11 13
Poly
mer
Lay
er T
hic
knes
s
pH
(b)
Figure 53 (a) ltRg2gt12 of the simulated polymer adsorbed on a clay surface and (b) the polymer
layer thickness as a function of pH
94
(a) (b) (c)
(d) (e) (f)
(g) (h) (i)
Figure 54 Trajectories of the polymer and the clay surface (a) initial configuration and final
configurations with charge density of (b) 00 (c) 01 (d) 0143 (e) 02 (f) 025 (g) 033 (h)
05 and (i) 08 Cyan red yellow and black beads denote neutral monomer charged monomer
neutral clay and charged clay
95
layer thickness The adsorbed polymer layer thickness also varies with solution pH (Figure 53-
b) The results shown in Figure 53-b confirm that PAM molecules remain pH-responsive when
adsorbed on a clay surface Figure 54 graphically shows that the polymer layer thickness varied
according to conformational changes of the polymer due to different charge densities The
polymer layer thickness increases near the pKa value of the polymer
55 Interlayer Spacing Manipulation
Interlayer spacing between two clay layers was monitored with varying polymer charge
fraction A polymer molecule and two clay layers were placed in a cubic simulation box of size
50 x 50 x 50 in DPD length units One clay layer was tethered at the bottom of the simulation
box (z=1) by a stiff harmonic spring and the other clay layer was placed at z=10 so that the initial
interlayer spacing was approximately 40Aring which is the experimental maximum interlayer
spacing of montmorillonite (van Olphen 1977) A system containing the polymer molecule with
no charges was sandwiched between the clay layers and simulated for 500000 time steps
allowing adsorption of the polymer molecule onto the two clay layer surfaces Another 500000
time steps were run at each polymer charge fraction to collect average properties of the system
The z-coordination of the top clay layer and root mean square radius of gyration of the polymer
were monitored The clay surface charge density was fixed at 02 The effect of clay-to-polymer
volume ratio was also simulated by increasing the number of polymer molecules One and two
polymer molecules represent clay-to-polymer volume ratio of 4 and 2 respectively
Z-coordination of the top clay layer and root mean square radius of gyration of the
polymer were monitored to investigate interlayer spacing manipulation Interlayer spacing was
calculated by averaging the z-coordination of the top clay layer Simulated results of the root
mean square radius of gyration of the polymer and the interlayer spacing are shown in Figure 55
96
3
4
5
0 025 05 075 1
ltR
g2gt
12
Charge Density
(a)
0
10
20
30
40
50
5 7 9 11 13
Inte
rlay
er S
pac
ing
pH
(b)
Figure 55 (a) ltRg2gt12 of the simulated polymer sandwiched between two clay layers and (b) the
interlayer spacing as a function of pH at clay-to-polymer volume ratio 4
Figure 55-a shows results for root mean square radius of gyration as a function of charge
density The trend is in good agreement with that for the polymer in an aqueous solution (Figure
97
51-a) while a slight difference appeared due to the presence of two clay layer surfaces Interlayer
spacing tends to increase with pH (Figure 55-b) showing the tunability of the clay-polymer
nanocomposites The polymer layer thickness with only one clay layer surface (Figure 53-b) was
greater than the case with two clay layers In other words the polymer layer thickness ie
interlayer spacing decreased with the two clay layer surfaces Interactions between the surfaces
and the polymer induced a difference in the pKa value between inside the polymer molecule and
near the surface (Uhlik et al 2004 Gong et al 2007 Dong et al 2009) The extent of the
difference in pKa value further increased with the two clay layer surfaces Figure 56 graphically
shows final trajectories of the polymer and the clay layers The interlayer spacing varied
according to conformational changes of the polymer due to different charge densities An abrupt
change occurs in the interlayer spacing near the pKa value of the polymer ie charge density 05
(Figure 56-h)
98
(a) (b) (c)
(d) (e) (f)
(g) (h) (i)
Figure 56 Trajectories of the polymer and the clay surfaces at clay-to-polymer volume ratio 4
(a) initial configuration containing two clay surfaces a PAM molecule and water and final
configurations with charge density of (b) 00 (c) 01 (d) 0143 (e) 02 (f) 025 (g) 033 (h)
05 and (i) 08 Cyan red yellow and black beads denote neutral monomer charged monomer
neutral clay and charged clay
99
Clay-to-polymer volume ratio has been reported to be a critical factor for the intercalated
structure formation (Kim and Palomino 2011) The quantity of intercalated structure increases
with decreasing clay-to-polymer volume ratio enhancing the ability for further modification
Effects of clay-to-polymer volume ratio were investigated with clay-to-polymer volume ratios of
2 and 4 Simulated results of the root mean square radius of gyration of the polymer and the
interlayer spacing at clay-to-polymer volume ratio 2 are shown in Figure 57 The trend is nearly
the same as at clay-to-polymer volume ratio 4 However an increase in the interlayer spacing
was observed at charge density greater than 033 It is well-known that crosslinking polymer
molecules affects polymer conformation in dilute solutions (Askadskii 1990 Fleer 1993 Lee et
al 1999 Wu et al 2001) Thus the observation is likely due to the relative increase in the
number of polymer molecules At high charge density the repulsion forces generated by two
polymer molecules ndash clay-to-polymer volume ratio 2 ndash are greater than those with one polymer
molecule ndash clay-to-polymer volume ratio 4 ndash such that the interlayer spacing further increased
This phenomenon is in good agreement with previously reported experimental results and that
the potential for further modification increases with decreasing clay-to-polymer volume ratio
(Kim and Palomino 2011)
100
1
2
3
4
5
6
0 025 05 075 1
ltR
g2gt
12
Charge Density
(a)
0
10
20
30
40
50
5 7 9 11 13
Inte
rlay
er S
pac
ing
pH
(b)
Figure 57 (a) ltRg2gt12 of the simulated polymer sandwiched between two clay layers and (b)
the interlayer spacing as a function of pH at clay-to-polymer volume ratio 2
101
56 Linkage of Micro-Scale Behavior to Meso-Scale Property
It was quantitatively found that PAM conformation becomes extended with increasing
pH inducing an increase in the interlayer spacing of a clay mineral However this result for one
PAM-molecule system cannot be quantitatively linked to the experimental findings described in
Chapter 4 since in reality it is difficult to test with one PAM molecule For example 17x1014
PAM molecules are theoretically contained even at a very small concentration of PAM (eg 15
ml of 15 mgL PAM solution which was used in the DLS tests) In addition crosslinking
polymer molecules affects polymer conformation in dilute solutions (Askadskii 1990 Fleer
1993 Lee et al 1999 Wu et al 2001) Hence a quantitative linkage between computer
simulation results and experimental results often fail Yet it is still worth attempting to
qualitatively link the computational results to the experimental findings
In addition to the measurement conducted in Chapter 442 the same test was carried out
at five different pH values to match with simulated pH intervals The additionally tested pH
values were pH 112 108 102 84 and 38 Results of swelling ratio at 72 hours as well as the
simulated interlayer spacing are presented in Figure 58 The simulated results of interlayer
spacing is in a good qualitative agreement with the experimental swelling ratio In other words
PAM conformation changes to extended with increasing pH However a significant change in
the swelling ratio occurs around pH 113 On the other hand the simulated results show that such
a significant change in the interlayer spacing occurs near the pKa value of the polymer (ie pH
108) This is attributed to not only the change in the pKa value of the polymer near the surface
but also the lowered pH value near the surface (Michaels and Morelos 1955 Uhlik et al 2004
Gong et al 2007 Dong et al 2009)
102
0
10
20
30
40
50
0
5
10
15
1 3 5 7 9 11 13
Sim
ula
ted
Inte
rlay
er
Spac
ing
Sw
elling R
atio
Solution pH
Swelling ratio
Simulated interlayer spacing
Figure 58 Swelling ratio and simulated interlayer spacing for CPN as a function of solution pH
Diamond and square symbols denote the swelling ratio and the simulated interlayer spacing
respectively The CPN was synthesized at clay-to-polymer volume ratio 2
Contrary to the observations from DPD simulations of the interlayer spacing that the
PAM conformations were nearly the same at pH below 8 the swelling ratio significantly
increased from pH 3 to pH 84 This phenomenon may be attributed to the nature of Mt and
PAM The charge fraction for the simulated clay surfaces was fixed at 02 (pH-independent) to
isolate the conformational behavior of PAM while natural Mt has pH-dependent charges on its
surface The results of specific surface area and permeability for Mt confirm the pH-dependent
behavior of Mt (Figures 43 and 45) In addition PAM molecules usually have slight negative
charges at neutral pH caused by a finite degree of hydrolysis of amide groups into acrylic acid
(Kurenkov 1997) Thus it is likely that the combination of those mechanisms induced a
significant change in swelling ratio from pH 3 to pH 84
DPD simulations and physical experiments are mutually supportive Experimental
limitations precluded obtaining a permeability measurement for CPN at pH 115 as the
103
permeability was too low to measure However DPD simulation results provide insight into the
permeability at pH 115 The expected permeability would further decrease due to more extended
interlayer spacing (Figure 55-b) On the other hand a system is often simplified for the
efficiency of computer simulation so some characteristics are not captured In this study the use
of simplified clay surfaces and polymer molecules did not capture pH-dependent behavior of Mt
and the hydrolysis behavior of PAM at neutral pH
57 Conclusions
In this study the coarse-grained atomistic computer simulation technique of dissipative
particle dynamics was used to quantitatively explore the effect of micro-scale pH-responsive
polymer conformation on the interlayer spacing of clay-polymer nanocomposites (CPN)
Polyacrylamide (PAM) and montmorillonite (Mt) surface were modeled as a bead and harmonic
spring The pH-responsiveness of the polymer was simulated by using various charge fractions
The polymer conformation became extended with increasing pH The same trend was observed
with clay surfaces to a lesser degree A quantitative relationship between the PAM conformation
and the interlayer spacing of the simulated clay was found for a system containing one PAM
molecule sandwiched in between two Mt layers
Swelling ratio was measured to link the micro-scale PAM conformation to meso-scale
CPN properties The swelling ratio results were in qualitative agreement with the simulated PAM
conformation in that the swelling ratio increased with increasing pH The computer simulation
results confirmed that micro-scale changes in polymer conformation of tunable CPN affect meso-
scale CPN behaviors
Although it is still challenging to quantitatively link computational findings to
experimental results computer simulation was demonstrated to be a viable tool providing a good
qualitative agreement with experimental findings In addition computer simulation provided the
104
insight to overcome experimental limitations On the other hand experimental results provided
information that computer simulation did not capture such as pH-dependent behavior of
montmorillonite crosslinking effects of the polymer and hydrolysis behavior of PAM at neutral
pH
105
Chapter 6
CONCLUSIONS
A new technique of soil modification with the use of a responsive polymer ndash tunable
clay-polymer nanocomposites (CPN) ndash was developed and demonstrated in this study The
tunable CPN were proven to have controllable system properties by means of further
modifications post synthesis The tested soil was montmorillonite (Mt) and polyacrylamide
(PAM) was used as a soil modifier Micro-scale conformational behavior of PAM in a bulk
solution and in the CPN was characterized using dynamic light scattering (DLS) and
spectroscopic ellipsometry (SE) respectively Corresponding meso-scale property changes of the
CPN were characterized by measuring specific surface area swelling potential and permeability
A coarse-grained computer simulation technique dissipative particle dynamics (DPD) was used
to investigate the effects of the micro-scale PAM conformation on the meso-scale CPN properties
An optimized procedure was developed for synthesizing tunable CPN using an expansive
clay (Mt) and a water-soluble responsive polymer (PAM) The optimum condition for the
maximum quantity of intercalated structure formation was found with low molecular weight
nonionic PAM at clay-to-polymer volume ratio 2 and clay content 0001 With the use of a
water-soluble polymer large-scale production of in-situ modifiable engineered clay soils is
feasible
Corresponding to pH-dependent conformation of PAM in a bulk solution PAM in the
synthesized CPN also had pH-dependent conformation to lesser degree due to the presence of
surfaces Layer thickness of PAM adsorbed on a surface specific surface area and swelling
potential increased with increasing pH corresponding to extended PAM conformation at basic
pH The increase in the swelling potential resulted in pore size reduction leading to a decrease in
permeability
106
With the use of DPD technique a quantitative linkage between PAM conformation and a
CPN property ndash interlayer spacing ndash was made for a system containing one PAM molecule
sandwiched between two Mt layers Although it is still challenging to quantitatively link
computational findings to meso-scale experimental results computer simulation was
demonstrated to be a viable tool providing good qualitative agreement with experimental
findings In addition computer simulation provided the insight to overcome experimental
limitations On the other hand experimental results provided information that computer
simulation did not capture such as pH-dependent behavior of Mt and hydrolysis behavior of PAM
at neutral pH
This study indicates that the use of pH-responsive polymer is a viable tool for soil
modification The conformation of a pH-responsive polymer varies with ambient solution pH
leading to system property changes due to changes in soil fabric ie interlayer and interparticle
spacings Thus this study may offer a new outlook for a purpose of creating engineered soil
systems A responsive polymer can be widely utilized in the fields of geotechnical and
geoenvironmental engineering to build an engineered soil system which has tunable system
properties
107
Future Work
Strength and Deformation of Clay-Polymer Nanocomposites
Since geotechnical applications typically include supporting the load imposed by
buildings or structures mechanical properties such as shear strength compressive strength and
deformation are of interest Polymer introduction may affect mechanical properties of the
system thus effects of polymer are required to be investigated by means of laboratory testing
used in the field of geotechnical engineering
Polymer molecules provide additional bonding between clay particles or between clay
layers thus better mechanical properties may be obtained Polymer molecules are typically
flexible while clay particles are relatively rigid and hence better toughness may be expected for
clay-polymer systems Thus mechanical properties for polymer-treated clay soil systems will be
investigated by means of geotechnical testing such as direct shear test consolidation test and
triaxial tests Variables such as sample type molecular weight and ionic type of polymer and
ionic strength can be used to explore effects of each variable If current experimental techniques
are not suitable for the new material to investigate such an effect of interest a new technique can
be developed considering both characteristics of clays and polymers
Geoenvironmental Applications of Clay-Polymer Nanocomposites
In contrast to the geotechnical applications chemistry and biology are important in the
field of geoenvironmental engineering When clay-polymer composites are applied in field
interactions of the composites with preexisting ions and microorganisms may be of concern since
such interactions may affect the clay-polymer system
For example as found in this study a clay-polymer system can have lower permeability
than pure clay systems Thus it can be used for an environmental barrier or filter that prevents
108
contaminants from exposure to nature However preexisting cations andor microorganisms can
neutralize negatively charged groups of polyacrylamide leading to an increase in permeability
Preexisting cations andor microorganisms can also provide additional adsorption sites for
contaminants improving the barrier properties of the system Therefore such factors need to be
investigated prior to introducing polymers into clay soil systems Laboratory testing including
adsorption test for contaminants on the clay-polymer composites can be performed in the
presence of different ions andor microorganisms to explore effects of each factor on the barrier
property of the clay-polymer composites
Expansion of the Use of Computer Simulation for Investigation of Clay-Polymer Nanocomposites
With current experimental technologies it is very challenging to characterize clay-
polymer nanocomposites since it is a very small complex system As shown in this study
dissipative particle dynamics is a viable tool to characterize such a small complex system Thus
the technique can be used to explore unknown or controversial issues of clay-polymer systems
since computer simulation has the advantage of isolating a factor of interest
For example the most dominant factor in the behavior of the ldquotunablerdquo clay polymer
nanocomposites and complex pH-dependencies observed in specific surface area measurement
can be demonstrated with the use of computer simulation techniques Each factor affecting the
behavior can be isolated during simulation to find degree of influence Comparing the found
degree of influence the most dominant factor(s) can be determined
109
REFERENCES
Aksberg R and Wagberg L 1989 Hydrolysis of cationic polyacrylamides Journal of Applied
Polymer Science 38(2) 297-304
Al-Anazi H A and Sharma M M 2002 Use of a pH Sensitive Polymer for Conformance
Control International Symposium and Exhibition on Formation Damage Control
Lafayette Louisiana
Alexandre M and Dubois P 2000 Polymer-layered silicate nanocomposites Preparation
properties and uses of a new class of materials Materials Science and Engineering R
Reports 28(1-2) 1-63
Anthony A J King P H and Randall C W 1975 The effects of branching and other
physical properties of anionic polyacrylamides on the flocculation of domestic sewage
Journal of Applied Polymer Science 19(1) 37-48
Aranda P and Ruiz-Hitzky E 1992 Poly(ethylene oxide)-silicate intercalation materials Chem
Mater 4(6) 1395-1403
Ashmawy A K El-Hajji D Sotelo N and Muhammad N 2002 Hydraulic performance of
untreated and polymer-treated bentonite in inorganic landfill leachates Clays and Clay
Minerals 50(5) 546-552
Askadskii A A 1990 Influence of crosslinking density on the properties of polymer networks
Polymer Science USSR 32(10) 2061-2069
ASTM 2003 D422-63 Standard Test Method for Particle-Size Analysis of Soils American
Society for Testing and Materials (ASTM)
ASTM 2006 D5890 Standard Test Method for Swell Index of Clay Mineral Component of
Geosynthetic Clay Liners American Society for Testing and Materials (ASTM)
Aulich D Hoy O Luzinov I Brucher M Hergenroder R Bittrich E Eichhorn K-J
Uhlmann P Stamm M Esser N and Hinrichs K 2010 In Situ Studies on the
Switching Behavior of Ultrathin Poly(acrylic acid) Polyelectrolyte Brushes in Different
Aqueous Environments Langmuir 26(15) 12926-12932
Bae Y H Okano T and Wan Kim S 1990 Temperature dependence of swelling of
crosslinked poly(NN prime -alkyl substituted acrylamides) in water Journal of Polymer
Science Part B Polymer Physics 28(6) 923-936
Bajpai A K and Giri A 2003 Water sorption behaviour of highly swelling (carboxy
methylcellulose-g-polyacrylamide) hydrogels and release of potassium nitrate as
agrochemical Carbohydrate Polymers 53(3) 271-279
Balazs A Ginzburg v v Lyatskaya Y Singh C and Zhulina E 2000 Modeling the Phase
Behavior of Polymer-Clay Nanocomposites In T J Pinavaia and G W Beall (eds)
Polymer-clay nanocomposites John Wiley amp Sons Ltd
Barvenik F W 1994 Polyacrylamide characteristics related to soil applications Soil Science
158 235-243
Bauer A and Velde B 1999 Smectite transformation in high molar KOH solutions Clay
Minerals 34(2) 259-273
Berend I Cases J-M Franccedilois M Uriot J-P Michot L Masion A and Thomas F 1995
Mechanism of Adsorption and Desorption of Water Vapor by Homoionic
Montmorillonites 2 The Li+ Na+ K+ Rb+ and Cs+-Exchanged Forms Clays and
Clay Minerals 43(3) 324-336
Berne B J and Pecora R 1976 Dynamic light scattering John Wiley amp Sons Inc New York
110
Besra L Sengupta D K Roy S K and Ay P 2002 Flocculation and dewatering of kaolin
suspensions in the presence of polyacrylamide and surfactants International Journal of
Mineral Processing 66(1-4) 203-232
Besra L Sengupta D K Roy S K and Ay P 2004 Influence of polymer adsorption and
conformation on flocculation and dewatering of kaolin suspension Separation and
Purification Technology 37(3) 231-246
Bhardwaj A K Shainberg I Goldstein D Warrington D N and JLevy G 2007 Water
Retention and Hydraulic Conductivity of Cross-Linked Polyacrylamides in Sandy Soils
Soil Sci Soc Am J 71(2) 406-412
Biswas M and Ray S S 2001 Recent Progress in Synthesis and Evaluation of Polymer-
Montmorillonite Nanocomposites Advances in Polymer Science 155 167-221
Bittrich E Kuntzsch M Eichhorn K-J and Uhlmann P 2010 Complex pH- and
temperature-sensitive swelling behavior of mixed polymer brushes Journal of Polymer
Science Part B Polymer Physics 48(14) 1606-1615
Blachier C Michot L Bihannic I Barr O Jacquet A and Mosquet M 2009 Adsorption
of polyamine on clay minerals Journal of Colloid and Interface Science 336(2) 599-606
Boek E S Coveney P V and Lekkerkerker H N W 1996 Computer simulation of
rheological phenomena in dense colloidal suspensions with dissipative particle dynamics
Journal of Physics Condensed Matter 8(47) 9509-9512
Boek E S Padding J T den Otter W K and Briels W J 2005 Mechanical Properties of
Surfactant Bilayer Membranes from Atomistic and Coarse-Grained Molecular Dynamics
Simulations The Journal of Physical Chemistry B 109(42) 19851-19858
Borchardt G 1989 Smectites In J B Dixon S B Weed and R C Dinauer (eds) Minerals in
soil environments Soil Science Society of America Madison Wisconsin USA 675-727
Borden D and Giese R F 2001 Baseline studies of the clay minerals society source clays
Cation exchange capacity measurements by the ammonia-electrode method Clays and
Clay Minerals 49(5) 444-445
Bottero J Y Bruant M Cases J M Canet D and Fiessinger F 1988 Adsorption of
nonionic polyacrylamide on sodium montmorillonite Relation between adsorption [xi]
potential turbidity enthalpy of adsorption data and 13C-NMR in aqueous solution
Journal of Colloid and Interface Science 124(2) 515-527
Boulet P Coveney P V and Stackhouse S 2004 Simulation of hydrated Li+- Na+- and K+-
montmorillonitepolymer nanocomposites using large-scale molecular dynamics
Chemical Physics Letters 389(4-6) 261-267
Bourg I C Bourg A C M and Sposito G 2003 Modeling diffusion and adsorption in
compacted bentonite A critical review Journal of Contaminant Hydrology 61(1-4)
293-302
Brandrup J and Immergut E H 1989 Polymer handbook 3rd ed Wiley New York
Brannon-Peppas L and Peppas N A 1991 Equilibrium swelling behavior of dilute ionic
hydrogels in electrolytic solutions Journal of Controlled Release 16(3) 319-329
Brindley G W and Brown G 1980 Crystal structures of clay minerals and their X-ray
identification Mineralogical Society London
Brondsted H and Kopecek J 1992 pH-Sensitive Hydrogels Polyelectrolyte Gels American
Chemical Society 285-304
Brotherson B Bottomley L A Ludovice P and Deng Y 2007 Cationic Polyacrylamide
Conformation on Mica Studied by Single Molecule Pulling with Scanning Probe
Microscopy Macromolecules 40(13) 4561-4567
Bruice P Y 2001 Organic chemistry 3rd ed Prentice Hall Upper Saddle River NJ
111
Campbell A M Pan Z and Somasundaran P 2002 Monitoring of Adsorbed Polymer
Conformation in Concentrated Suspensions In V A Hackley P Somasundaran and J
A Lewis (eds) Polymers in particulate systems Properties and applications Marcel
Dekker Inc New York Basel 135-156
Carasso M L Rowlands W N and OBrien R W 1997 The Effect of Neutral Polymer and
Nonionic Surfactant Adsorption on the Electroacoustic Signals of Colloidal Silica
Journal of Colloid and Interface Science 193(2) 200-214
Carroll D and Starkey H C 1971 Reactivity of Clay Minerals with Acids and Alkalies Clays
and Clay Minerals 19(5) 321-333
Chang F R C Skipper N T and Sposito G 1995 Computer simulation of interlayer
molecular structure in sodium montmorillonite hydrates Langmuir 11(7) 2734
Chen C An I Ferreira G M Podraza N J Zapien J A and Collins R W 2004
Multichannel Mueller matrix ellipsometer based on the dual rotating compensator
principle Thin Solid Films 455-456 14-23
Chen G and Hoffman A S 1995 Graft copolymers that exhibit temperature-induced phase
transitions over a wide range of pH Nature 373(6509) 49-52
Chen G Pan J Han B and Yan H 1999 Adsorption of Methylene Blue on Montmorillonite
Journal of Dispersion Science and Technology 20(4) 1179-1187
Chen J S Cushman J H and Low P F 1990 Rheological Behavior of Na-Montmorillonite
Suspensions at Low Electrolyte Concentration Clays and Clay Minerals 38(1) 57-62
Chodanowski P and Stoll S 2001 Polyelectrolyte Adsorption on Charged Particles in the
Debye-Huckel Approximation A Monte Carlo Approach Macromolecules 34 2320-
2328
Cohen Stuart M A Cosgrove T and Vincent B 1986 Experimental aspects of polymer
adsorption at solidsolution interfaces Advances in Colloid and Interface Science 24
143-239
Collins R W and Ferlauto A S 2005 Optical Properties of Materials In H G Tompkins and
E A Irene (eds) Handbook of Ellipsometry William Andrew Pub Springer Norwich
NY 125-129
Cong Y An l Vedam K and Collins R W 1991 Optical characterization of a four-medium
thin film structure by real time spectroscopic ellipsometry amorphous carbon on
tantalum Applied Optics 30(19) 2692-2703
Connal L A Li Q Quinn J F Tjipto E Caruso F and Qiao G G 2008 pH-Responsive
Poly(acrylic acid) Core Cross-Linked Star Polymers Morphology Transitions in Solution
and Multilayer Thin Films Macromolecules 41(7) 2620-2626
Cygan R T Guggenheim S and Koster van Groos A F 2004a Molecular Models for the
Intercalation of Methane Hydrate Complexes in Montmorillonite Clay The Journal of
Physical Chemistry B 108(39) 15141-15149
Cygan R T Liang J-J and Kalinichev A G 2004b Molecular Models of Hydroxide
Oxyhydroxide and Clay Phases and the Development of a General Force Field The
Journal of Physical Chemistry B 108(4) 1255-1266
Daivis P J Matin M L and Todd B D 2007 Nonlinear shear and elongational rheology of
model polymer melts at low strain rates Journal of Non-Newtonian Fluid Mechanics
147(1-2) 35-44
de Gennes P G 1987 Polymers at an interface a simplified view Advances in Colloid and
Interface Science 27(3-4) 189-209
Deng Y Dixon J B White G N Loeppert R H and Juo A S R 2006 Bonding between
polyacrylamide and smectite Colloids and Surfaces A Physicochemical and Engineering
Aspects 281(1-3) 82-91
112
Depa P K 2007 Multiscale Modeling of Polymeric Materials PhD Dissertation Penn State
University University Park USA
Dobias B Qiu X and Rybinski W v 1999 Solid-liquid dispersions Marcel Dekker New
York
Dong R Lindau M and Ober C K 2009 Dissociation Behavior of Weak Polyelectrolyte
Brushes on a Planar Surface Langmuir 25(8) 4774-4779
Douillard J M Salles F Devautour-Vinot S Manteghetti A and Henry M 2007 Study of
the surface energy of montmorillonite using PACHA formalism Journal of Colloid and
Interface Science 306(1) 175-182
Drever J I 1997 The Geochemistry of Natural Waters Surface and Groundwater
Environments 3rd ed Prentice Hall Upper Saddle River NJ
Ebnesajjad S 2006 Surface treatment of materials for adhesion bonding William Andrew Pub
New York
El-Hajji D Ashmawy A K Darlington J and Sotelo N 2001 Effect of inorganic leachate
on polymer treated GCL material Proceedings of the Geosynthetics 2001 Conference
Portland Oregon 663-670
Espaňol P and Warren P 1995 Statistical Mechanics of Dissipative Particle Dynamics
Europhysics Letters 30(4) 191-196
Essmann U Perera L Berkowitz M L Darden T Lee H and Pedersen L G 1995 A
smooth particle mesh Ewald method The Journal of Chemical Physics 103(19) 8577-
8593
Ewald P 1921 Die Berechnung optischer und elektrostatischer Gitterpotentiale Ann Phys 64
253-287
Fan X and Advincula R C 2002 Nanostructured ultrathin films of silicate clay and
polyelectrolytes deposition parameters and mechanical properties by nanoindentation
Materials Research Society Symposium Proceedings Boston MA USA 335-340
Fan X Park M-k Xia C and Advincula R 2002 Surface structural characterization and
mechanical testing by nanoindentation measurements of hybrid polymerclay
nanostructured multilayer films Journal of materials research 17(7) 1622-1633
Feil H Bae Y H Feijen J and Kim S W 1992 Mutual influence of pH and temperature on
the swelling of ionizable and thermosensitive hydrogels Macromolecules 25(20) 5528-
5530
Fermeglia M and Pricl S 2007 Multiscale modeling for polymer systems of industrial interest
Progress in Organic Coatings 58(2-3) 187-199
Ferrage E Lanson B Sakharov B A and Drits V A 2005 Investigation of smectite
hydration properties by modeling experimental X-ray diffraction patterns Part I
Montmorillonite hydration properties American Mineralogist 90(8-9) 1358-1374
Filippi S Mameli E Marazzato C and Magagnini P 2007 Comparison of solution-blending
and melt-intercalation for the preparation of poly(ethylene-co-acrylic acid)organoclay
nanocomposites European Polymer Journal 43(5) 1645-1659
Filippova N L 1998 Adsorption and Desorption Kinetics of Polyelectrolytes on Planar
Surfaces Langmuir 14(5) 1162-1176
Fleer G J 1993 Polymers at interfaces 1st ed Chapman amp Hall London New York
Fleer G J Koopal L K and Lyklema J 1972 Polymer adsorption and its effect on the
stability of hydrophobic colloids Colloid amp Polymer Science 250(7) 689-702
Flory P J 1953 Principles of polymer chemistry Cornell University Press Ithaca
Francois J Sarazin D Schwartz T and Weill G 1979 Polyacrylamide in water molecular
weight dependence of ltR2gt and [eta] and the problem of the excluded volume exponent
Polymer 20(8) 969-975
113
Fuchslin R M Fellermann H Eriksson A and Ziock H-J 2009 Coarse graining and
scaling in dissipative particle dynamics The Journal of Chemical Physics 130(21)
214102-8
Fukushima Y 1984 X-ray diffraction study of aqueous montmorillonite emulsions Clays and
Clay Minerals 32(4) 320-326
Gajo A and Maines M 2007 Mechanical effects of aqueous solutions of inorganic acids and
bases on a natural active clay Geotechnique 57(8) 687-99
Gao D and Heimann R B 1993 Structure and mechanical properties of superabsorbent poly
(acrylamide)-montmorillonite composite hydrogels Polymer Gels and Networks 1(4)
225-246
Gao F 2004 Claypolymer composites the story Materials Today 7(11) 50-55
Gardner K H and Arias M S 2000 Clay swelling and formation permeability reductions
induced by a nonionic surfactant Environmental Science and Technology 34(1) 160-166
Ghosh D and Bhattacharyya K G 2002 Adsorption of Methylene Blue on Kaolinite Applied
Clay Science 20 295-300
Giannelis E P Krishnamoorti R and Manias E 1999 Polymer-silicate nanocomposites
Model systems for confined polymers and polymer brushes Advances in Polymer
Science 138 107-147
Gibson J B Chen K and Chynoweth S 1998 Simulation of Particle Adsorption onto a
Polymer-Coated Surface Using the Dissipative Particle Dynamics Method Journal of
Colloid and Interface Science 206(2) 464-474
Gibson J B Zhang K Chen K Chynoweth S and Manke C W 1999 Simulation of
colloid-polymer systems using dissipative particle dynamics Molecular Simulation 23
1-41
Glinel K Laschewsky A and Jonas A M 2001 Ordered Polyelectrolyte multilayers 3
Complexing Clay Platelets with Polycations of Varying Structure Macromolecules
34(15) 5267-5274
Goddard W A Cagin T Blanco M Vaidehi N Dasgupta S Floriano W Belmares M
Kua J Zamanakos G Kashihara S Iotov M and Gao G 2001 Strategies for
multiscale modeling and simulation of organic materials polymers and biopolymers
Computational and Theoretical Polymer Science 11(5) 329-343
Gong P Wu T Genzer J and Szleifer I 2007 Behavior of Surface-Anchored Poly(acrylic
acid) Brushes with Grafting Density Gradients on Solid Substrates 2 Theory
Macromolecules 40(24) 8765-8773
Gonzalez-Melchor M Mayoral E Velazquez M E and Alejandre J 2006 Electrostatic
interactions in dissipative particle dynamics using the Ewald sums Journal of Chemical
Physics 125(22)
Griffiths P C Paul A Khayat Z Wan K-W King S M Grillo I Schweins R Ferruti P
Franchini J and Duncan R 2004 Understanding the Mechanism of Action of
Poly(amidoamine)s as Endosomolytic Polymers Correlation of Physicochemical and
Biological Properties Biomacromolecules 5(4) 1422-1427
Groot R D 2000 Mesoscopic Simulation of Polymer-Surfactant Aggregation Langmuir
16(19) 7493-7502
Groot R D 2003 Electrostatic interactions in dissipative particle dynamics - simulation of
polyelectrolytes and anionic surfactants The Journal of Chemical Physics 118(24)
11265-11277
Groot R D and Rabone K L 2001 Mesoscopic Simulation of Cell Membrane Damage
Morphology Change and Rupture by Nonionic Surfactants Biophysical Journal 81(2)
725-736
114
Groot R D and Warren P B 1997 Dissipative particle dynamics Bridging the gap between
atomistic and mesoscopic simulation The Journal of Chemical Physics 107(11) 4423-
4435
Gruenert G Ibrahim B Lenser T Lohel M Hinze T and Dittrich P 2010 Rule-based
spatial modeling with diffusing geometrically constrained molecules BMC
Bioinformatics 11 307
Gudeman L F and Peppas N A 1995 Preparation and characterization of pH-sensitive
interpenetrating networks of poly(vinyl alcohol) and poly(acrylic acid) Journal of
Applied Polymer Science 55(6) 919-928
Haraguchi K and Takehisa T 2002 Nanocomposite Hydrogels A Unique OrganicndashInorganic
Network Structure with Extraordinary Mechanical Optical and SwellingDe-swelling
Properties Advanced Materials 14(16) 1120-1124
Heinz H Vaia R A Krishnamoorti R and Farmer B L 2007 Self-Assembly of
Alkylammonium Chains on Montmorillonite Effect of Chain Length Head Group
Structure and Cation Exchange Capacity Chemistry of Materials 19(1) 59-68
Hensen E J M Tambach T J Bliek A and Smit B 2001 Adsorption isotherms of water in
Li-- Na-- and K--montmorillonite by molecular simulation The Journal of Chemical
Physics 115(7) 3322-3329
Herbert H-J Kasbohm J Sprenger H Fernandez A M and Reichelt C 2008 Swelling
pressures of MX-80 bentonite in solutions of different ionic strength Physics and
Chemistry of the Earth 33(SUPPL 1) S327-S342
Herzinger C M Johs B McGahan W A Woollam J A and Paulson W 1998
Ellipsometric determination of optical constants for silicon and thermally grown silicon
dioxide via a multi-sample multi-wavelength multi-angle investigation Journal of
Applied Physics 83(6) 3323-3336
Hjelmstad K E 1990 Cationic polymers prevent permeability loss during leaching Minerals
and Metallurgical Processing 7(1) 30-35
Hogg R 1999 Role of polymer adsorption kinetics in flocculation Colloids and Surfaces A
Physicochemical and Engineering Aspects 146(1-3) 253-263
Hoogerbrugge P J and Koelman J M V A 1992 Simulating Microscopic Hydrodynamic
Phenomena with Dissipative Particle Dynamics Europhysics Letters 19 155-160
Huang S-Y Lipp D W and Farinato R S 2001 Acrylamide Polymers In A Seidel ed
Kirk-Othmer Encyclopedia of Chemical Technology John Wiley amp Sons New Jersey
304-342
Hunter R J 1993 Introduction to Modern Colloid Science 1st ed Oxford University Press
Oxford New York
Hwang J Y and Dixon J B 2000 Flocculation behavior and properties of Na-montmorillonite
treated with four organic polymers Clay Science 11 137-146
Ibergay C Malfreyt P and Tildesley D J 2009 Electrostatic Interactions in Dissipative
Particle Dynamics Toward a Mesoscale Modeling of the Polyelectrolyte Brushes
Journal of Chemical Theory and Computation 5(12) 3245-3259
Ibergay C Malfreyt P and Tildesley D J 2010 Mesoscale Modeling of Polyelectrolyte
Brushes with Salt The Journal of Physical Chemistry B 114(21) 7274-7285
Inyang H I and Bae S 2005 Polyacrylamide sorption opportunity on interlayer and external
pore surfaces of contaminant barrier clays Chemosphere 58(1) 19-31
Inyang H I Bae S Mbamalu G and Park S-W 2007 Aqueous polymer effects on
volumetric swelling of Na-montmorillonite Journal of Materials in Civil Engineering
19(1) 84-90
115
Irene E A 1993 Applications of spectroscopic ellipsometry to microelectronics Thin Solid
Films 233(1-2) 96-111
Israelachvili J N 1991 Intermolecular and surface forces 2nd ed Academic Press London
San Diego
Jo H Y Katsumi T Benson C H and Edil T B 2001 Hydraulic Conductivity and
Swelling of Nonprehydrated GCLs Permeated with Single-Species Salt Solutions
Journal of Geotechnical and Geoenvironmental Engineering 127(7) 557-567
Kandhal P S and Parker F 1998 Aggregate tests related to asphalt concrete performance in
pavements National Cooperative Highway Research Program (NCHRP) Report 405
Transportation Research Board Washington DC
Katchalsky A and Spitnik P 1947 Potentiometric titrations of polymethacrylic acid Journal
of Polymer Science 2(4) 432-446
Katti K S Sikdar D Katti D R Ghosh P and Verma D 2006 Molecular interactions in
intercalated organically modified clay and clay-polycaprolactam nanocomposites
Experiments and modeling Polymer 47(1) 403-414
Kheradmand H Francois J and Plazanet V 1988 Hydrolysis of polyacrylamide and acrylic
acid-acrylamide copolymers at neutral pH and high temperature Polymer 29(5) 860-870
Kim S and Palomino A M 2009 Polyacrylamide-treated kaolin A fabric study Applied Clay
Science 45(4) 270-279
Kim S and Palomino A M 2011 Factors influencing the synthesis of tunable clay-polymer
nanocomposites using bentonite and polyacrylamide Applied Clay Science 51(4) 491-
498
Kim S J Kim M S Kim S I Spinks G M Kim B C and Wallace G G 2006 Self-
oscillatory actuation at constant DC voltage with pH-sensitive chitosanpolyaniline
hydrogel blend Chemistry of Materials 18(24) 5805-5809
Klenina O V and Lebedeva L G 1983 Viscometric properties of dilute solutions of
hydrolyzed polyacrylamide Polymer Science USSR 25(10) 2380-2389
Knauert S T Douglas J F and Starr F W 2007 The effect of nanoparticle shape on
polymer-nanocomposite rheology and tensile strength Journal of Polymer Science Part
B Polymer Physics 45(14) 1882-1897
Kong Y Manke C W Madden W G and Schlijper A G 1997 Effect of solvent quality on
the conformation and relaxation of polymers via dissipative particle dynamics The
Journal of Chemical Physics 107(2) 592-602
Koo J H 2006 Polymer nanocomposites processing characterization and applications
McGraw-Hill New York
Kremer K and Grest G S 1990 Dynamics of entangled linear polymer melts A molecular
dynamics simulation Journal of Chemical Physics 92 5057
Kroger M 2004 Simple models for complex nonequilibrium fluids Physics Reports 390(6)
453-551
Kulicke W M Kniewske R and Klein J 1982 Preparation characterization solution
properties and rheological behaviour of polyacrylamide Progress in Polymer Science
8(4) 373-468
Kurenkov V F 1997 Acrylamide Polymers In N P Cheremisinoff ed Handbook of
engineering polymeric materials Marcel Dekker New York 61-72
Lagaly G 1989 Principles of flow of kaolin and bentonite dispersions Applied Clay Science
4(2) 105-123
Lagaly G 2006 Colloid Clay Science In F Bergaya B K G Theng and G Lagaly (eds)
Handbook of clay science Elsevier Amsterdam Boston 141-245
116
Laguecir A and Stoll S 2005 Adsorption of a weakly charged polymer on an oppositely
charged colloidal particle Monte Carlo simulations investigation Polymer 46(4 SPEC
ISS) 1359-1372
Laird D A D 1997 Bonding between polyacrylamide and clay mineral surfaces Soil science
162(11) 826-832
Lee J J and Fuller G G 1984 Ellipsometry studies of adsorbed polymer chains subjected to
flow Macromolecules 17(3) 375-380
Lee J W Kim S Y Kim S S Lee Y M Lee K H and Kim S J 1999 Synthesis and
characteristics of interpenetrating polymer network hydrogel composed of chitosan and
poly(acrylic acid) Journal of Applied Polymer Science 73(1) 113-120
Lee L T Rahbari R Lecourtier J and Chauveteau G 1991 Adsorption of Polyacrylamides
on the Different Faces of Kaolinites Journal of Colloid and Interface Science 147(2)
Leermakers F A M Atkinson P J Dickinson E and Horne D S 1996 Self-Consistent-
Field Modeling of Adsorbed [beta]-Casein Effects of pH and Ionic Strength on Surface
Coverage and Density Profile Journal of Colloid and Interface Science 178(2) 681-693
Liu P and Zhang L 2007 Adsorption of dyes from aqueous solutions or suspensions with clay
nano-adsorbents Separation and Purification Technology 58(1) 32-39
Liu X-W Hu M and Hu Y-H 2008 Chemical composition and surface charge properties of
montmorillonite Journal of Central South University of Technology (English Edition)
15(2) 193-197
Lo I M C Mak R K M and Lee S C H 1997 Modified Clays for Waste Containment and
Pollutant Attenuation Journal of Environmental Engineering 123(1) 25-32
Lochhead R Y and McConnell Boykin C 2002 An investigative study of polymer adsorption
to smectite clay Polyelectrolytes and sodium montmorillonite In R Krishnamoorti and
R A Vaia (eds) Polymer nanocomposites synthesis characterization and modeling
Oxford University Press 85-98
Luckham P F and Rossi S 1999 The colloidal and rheological properties of bentonite
suspensions Advances in Colloid and Interface Science 82(1-3) 43-92
Luo C and Sommer J-U 2009 Coding coarse grained polymer model for LAMMPS and its
application to polymer crystallization Computer Physics Communications 180(8) 1382-
1391
Ma C and Eggleton R A 1999 Cation exchange capacity of kaolinite Clays and Clay
Minerals 47(2) 174-180
Mahdavinia G R Pourjavadi A Hosseinzadeh H and Zohuriaan M J 2004 Modified
chitosan 4 Superabsorbent hydrogels from poly(acrylic acid-co-acrylamide) grafted
chitosan with salt- and pH-responsiveness properties European Polymer Journal 40(7)
1399-1407
Mai Y W Yu Z-Z and Institute of Materials Minerals and Mining 2006 Polymer
nanocomposites CRC Press Woodhead Boca Raton FL Cambridge England
Mazo M A Manevitch L I Gusarova E B Shamaev M Y Berlin A A Balabaev N K
and Rutledge G C 2008 Molecular dynamics simulation of thermomechanical
properties of montmorillonite crystal 3 montmorillonite crystals with PEO oligomer
intercalates Journal of Physical Chemistry B 112(12) 3597-3604
McBride M B 1994 Environmental chemistry of soils Oxford University Press New York
Medjahdi G Sarazin D and Francois J 1990 Light scattering behaviour of semi-dilute
solutions of polyacrylamide European Polymer Journal 26(7) 823-829
Meunier A 2005 Clays Springer Berlin New York
Michaels A S 1954 Aggregation of Suspensions by Polyelectrolytes Industrial amp Engineering
Chemistry 46(7) 1485-1490
117
Michaels A S and Morelos O 1955 Polyelectrolyte Adsorption by Kaolinite Industrial and
Engineering Chemistry 47(9) 1801-1809
Mitchell J K 1956 The Fabric of Natural Clays and its Relation to Engineering Properties
Highway Research Board Proceedings 35(35th Annual Meeting Washington DC)
693-713
Mitchell J K 1993 Fundamentals of Soil Behavior 2nd ed John Wiley amp Sons New York
Mohan K K and Fogler H S 1997 Effect of pH and Layer Charge on Formation Damage in
Porous Media Containing Swelling Clays Langmuir 13(10) 2863-2872
Moore D M and Reynolds R C 1997 X-ray diffraction and the identification and analysis of
clay minerals 2nd ed Oxford University Press Oxford New York
Mortland M M and Brady N C 1970 Clay-Organic Complexes and Interactions Advances
in Agronomy Academic Press 75-117
Mpofu P Addai-Mensah J and Ralston J 2003 Investigation of the effect of polymer
structure type on flocculation rheology and dewatering behaviour of kaolinite
dispersions International Journal of Mineral Processing 71(1-4) 247-268
Muller-plathe F 2002 Coarse-Graining in Polymer Simulation From the Atomistic to the
Mesoscopic Scale and Back Chem Phys Chem 3 754-769
Murray H H 1991 Overview - Clay mineral applications Applied Clay Science 5 379-395
Muzny C D Butler B D Hanley H J M Tsvetkov F and Peiffer D G 1996 Clay
platelet dispersion in a polymer matrix Materials Letters 28(4-6) 379-384
Myagchenkov V A and Proskurina V E 2004 Flocculation Activity (with Respect to Ocher)
of Anionic Copolymers of Acrylamide in the Mode of Restricted Sedimentation as
Influenced by Their Chemical Heterogeneity Russian Journal of Applied Chemistry
77(3) 463-466
Nabzar L and Pefferkorn E 1985 An experimental study of kaolinite crystal edge-
polyacrylamide interactions in dilute suspensions Journal of Colloid and Interface
Science 108(1) 243-248
Nasser M S and James A E 2006 Settling and sediment bed bahaviour of kaolinite in
aqueous media Separation and Purification Technology 51 10-17
Nelson A and Cosgrove T 2004 Dynamic Light Scattering Studies of Poly(ethylene oxide)
Adsorbed on Laponite Layer Conformation and Its Effect on Particle Stability Langmuir
20(24) 10382-10388
Newman A C D 1987 Chemistry of clays and clay minerals Wiley Mineralogical Society
New York London
Nieminen R M 2002 From atomistic simulation towards multiscale modelling of materials
Journal of Physics Condensed Matter 14(11) 2859-2876
Nishimura S Biggs S Scales P J Healy T W Tsunematsu K and Tateyama T 1994
Molecular-scale structure of the cation modified muscovite mica basal plane Langmuir
10(12) 4554-4559
Pagonabarraga I Rotenberg B and Frenkel D 2010 Recent advances in the modelling and
simulation of electrokinetic effects bridging the gap between atomistic and macroscopic
descriptions Physical Chemistry Chemical Physics 12(33) 9566-9580
Painter P C and Coleman M M 1997 Fundamentals of polymer science an introductory text
2nd ed Technomic Pub Co Lancaster Pa
Palomino A M Kim S Summitt A and Fratta D 2011 Impact of diatoms on fabric and
chemical stability of diatom-kaolin mixtures Applied Clay Science 51(3) 287-294
Palomino A M and Santamarina J C 2005 Fabric Map for Kaolinite Effects of pH and
Ionic Concentration on Behavior Clays and Clay Minerals 53(3) 209 - 222
118
Pandey R B Anderson K L Heinz H and Farmer B L 2005 Conformation and dynamics
of a self-avoiding sheet Bond-fluctuation computer simulation Journal of Polymer
Science Part B Polymer Physics 43(8) 1041-1046
Parfitt R L and Greenland D J 1970 The Adsorption of Poly(Ethylene Glycols) on Clay
Minerals Clay Minerals 8(3) 305-315
Park T G and Hoffman A S 1992 Synthesis and characterization of pH- andor temperature-
sensitive hydrogels Journal of Applied Polymer Science 46(4) 659-671
Parks G A 1967 Surface chemistry of oxides in aqueous systems In W Stumm ed
Equilibrium concepts in aqueous systems American Chemical Society Washington 121-
160
Pefferkorn E Nabzar L and Varoqui R 1987 Polyacrylamide Na-Kaolinite Interactions
Effect of Electrolyte Concentration on Polymer Adsorption Colloid and Polymer Science
265(10) 889-896
Peng S and Wu C 1999 Light Scattering Study of the Formation and Structure of Partially
Hydrolyzed Poly(acrylamide)Calcium(II) Complexes Macromolecules 32(3) 585-589
Perez-Santano A Trujillano R Belver C Gil A and Vicente M A 2005 Effect of the
intercalation conditions of a montmorillonite with octadecylamine Journal of Colloid
and Interface Science 284(1) 239-244
Pignon F eacute eacute ric Piau J-M and Magnin A 1996 Structure and Pertinent Length
Scale of a Discotic Clay Gel Physical Review Letters 76(25) 4857
Pivkin I V and Karniadakis G E 2006 Coarse-graining limits in open and wall-bounded
dissipative particle dynamics systems The Journal of Chemical Physics 124(18)
184101-7
Plaks N 2010 Test framework development for use of coal combustion products (CCPS) in
embankment construction and mine land reclamation Masters Thesis Penn State
University University Park USA
Plimpton S 1995 Fast Parallel Algorithms for Short-Range Molecular Dynamics Journal of
Computational Physics 117(1) 1-19
Pospisil M Capkova P Weiss Z Malac Z and Simonik J 2002 Intercalation of
octadecylamine into montmorillonite Molecular simulations and XRD analysis Journal
of Colloid and Interface Science 245(1) 126-132
Pospisil M Kalendov A Capkov P SimonIk J and Valaskova M 2004 Structure analysis
of intercalated layer silicates combination of molecular simulations and experiment
Journal of Colloid and Interface Science 277(1) 154-161
Qian H-J Chen L-J Lu Z-Y and Li Z-S 2007 Surface Diffusion Dynamics of a Single
Polymer Chain in Dilute Solution Physical Review Letters 99(6) 068301-4
Rand B Pekenc E Goodwin J W and Smith R W 1980 Investigation into the existence of
edge-face coagulated structures in Na-montmorillonite suspensions Journal of the
Chemical Society Faraday Transactions 1 76 225-235
Ravve A 2000 Principles of polymer chemistry 2nd ed Kluwer AcademicPlenum Publishers
New York
Ray S S and Okamoto M 2003 Polymerlayered silicate nanocomposites a review from
preparation to processing Progress in Polymer Science 28(11) 1539-1641
Raymahashay B C 1987 A comparative study of clay minerals for pollution control Journal
Geological Society of India 30 408-413
Rekvig L Kranenburg M Vreede J Hafskjold B and Smit B 2003 Investigation of
Surfactant Efficiency Using Dissipative Particle Dynamics Langmuir 19(20) 8195-8205
Rietveld H M 1967 Line profiles of neutron powder-diffraction peaks for structure refinement
Acta Crystallographica 22 151
119
Rotenberg B Marry V Vuilleumier R Malikova N Simon C and Turq P 2007 Water
and ions in clays Unraveling the interlayermicropore exchange using molecular
dynamics Geochimica et Cosmochimica Acta 71(21) 5089-5101
Ruiz-Hitzky E and Aranda P 1990 Polymer-salt intercalation complexes in layer silicates
Advanced Materials 2(11) 545-547
Ruiz-Hitzky E and van Meerbeek A 2006 CLAY MINERAL- AND ORGANOCLAY-
POLYMER NANOCOMPOSITE In F Bergaya B K G Theng and G Lagaly (eds)
Handbook of clay science Elsevier Amsterdam Boston 141-245
Russev S C Arguirov T V and Gurkov T D 2000 [beta]-Casein adsorption kinetics on air-
water and oil-water interfaces studied by ellipsometry Colloids and Surfaces B
Biointerfaces 19(1) 89-100
Salles F Bildstein O Douillard J-M Jullien M and Van Damme H 2007 Determination
of the driving force for the hydration of the swelling clays from computation of the
hydration energy of the interlayer cations and the clay layer Journal of Physical
Chemistry C 111(35) 13170-13176
Samanta A Bera A Ojha K and Mandal A 2010 Effects of Alkali Salts and Surfactant on
Rheological Behavior of Partially Hydrolyzed Polyacrylamide Solutions Journal of
Chemical amp Engineering Data 55(10) 4315-4322
Samoshina Y Nylander T Shubin V Bauer R and Eskilsson K 2005 Equilibrium
Aspects of Polycation Adsorption on Silica Surface How the Adsorbed Layer Responds
to Changes in Bulk Solution Langmuir 21(13) 5872-5881
Santamarina J C Klein K A and Fam M A 2001 Soils and Waves Particulate Materials
Behavior Characterization and Process Monitoring J Wiley amp Sons Chichester New
York
Santamarina J C Klein K A Palomino A and Guimaraes M S 2002a Micro-Scale
Aspects of Chemical-Mechanical Coupling Interparticle Forces and Fabric In C D
Maio T Hueckel and B Loret (eds) Chemo-Mechanical Coupling in Clays From
Nano-Scale to Engineering Applications AA Balkema Lisse Maratea Italy 47 - 64
Santamarina J C Klein K A Wang Y H and Prencke E 2002b Specific Surface
Determination and Relevance Canadian Geotechnical Journal 39(1) 233-241
Sanz J and Serratosa J M 2002 Nuclear Magnetic Resonance Spectroscopy of Organo-Clay
Complexes In S Yariv and H Cross (eds) Organo-Clay Complexes and Interactions
Marcel Dekker New York 223-272
Schindler P W 1981 Surface complexes at oxide-water interfaces In M N Anderson and A J
Rubin (eds) Adsorption of inorganics at solid-liquid interfaces Ann Arbor Science Ann
Arbor MI 12-49
Schmidt D J Cebeci F C Kalcioglu Z I Wyman S G Ortiz C Van Vliet K J and
Hammond P T 2009 Electrochemically Controlled Swelling and Mechanical
Properties of a Polymer Nanocomposite ACS Nano 3(8) 2207-2216
Schwarz S Eichhorn K J Wischerhoff E and Laschewsky A 1999 Polyelectrolyte
adsorption onto planar surfaces a study by streaming potential and ellipsometry
measurements Colloids and Surfaces A Physicochemical and Engineering Aspects
159(2-3) 491-501
Scocchi G Posocco P Danani A Pricl S and Fermeglia M 2007 To the nanoscale and
beyond Multiscale molecular modeling of polymer-clay nanocomposites Fluid Phase
Equilibria 261(1-2) 366-374
Shackelford C D Benson C H Katsumi T Edil T B and Lin L 2000 Evaluating the
hydraulic conductivity of GCLs permeated with non-standard liquids Geotextiles and
Geomembranes 18(2-4) 133-161
120
Shen Z Simon G P and Cheng Y-B 2002a Comparison of solution intercalation and melt
intercalation of polymer-clay nanocomposites Polymer 43(15) 4251-4260
Shen Z Simon G P and Cheng Y-B 2002b Effects of molecular weight and clay organo-
ions on the melt intercalation of poly(ethylene oxide) into layered silicates Polymer
Engineering amp Science 42(12) 2369-2382
Shinoda T Onaka M and Izumi Y 1995 Proposed Models of Mesopore Structures in
Sulfuric Acid-Treated Montmorillonites and K10 Chemistry Letters 24(7) 495-496
Siegel R A and Firestone B A 1988 pH-dependent equilibrium swelling properties of
hydrophobic polyelectrolyte copolymer gels Macromolecules 21(11) 3254-3259
Skipper N T Chang F-R C and Sposito G 1995 Monte Carlo Simulation of Interlayer
Molecular Structure in Swelling Clay Minerals 1 Methodology Clays and Clay
Minerals 43(3) 285-293
Sposito G 1989 The Chemistry of Soils Oxford University Press New York
Sposito G 1998 On points of zero charge Environmental Science and Technology 32(19)
2815-2819
Sposito G Park S-H and Sutton R 1999 Monte Carlo Simulation of the Total Radial
Distribution Function for Interlayer water in Sodium and Potassium Montmorillonites
Clays and Clay Minerals 47(2) 192-200
Sridharan A and Prakash K 1999 Mechanisms controlling the undrained shear strength
behaviour of clays Canadian Geotechnical Journal 36(6) 1030-1038
Stemme S Odberg L and Malmsten M 1999 Effect of colloidal silica and electrolyte on the
structure of an adsorbed cationic polyelectrolyte layer Colloids and Surfaces A
Physicochemical and Engineering Aspects 155(2-3) 145-154
Steudel A Batenburg L F Fischer H R Weidler P G and Emmerich K 2009 Alteration
of swelling clay minerals by acid activation Applied Clay Science 44(1-2) 105-115
Stigter D and Dill K A 1995 Theory for Radii and Second Virial Coefficients 1 Highly
Charged Polyelectrolytes Macromolecules 28(15) 5325-5337
Story B T Urynowicz M A Johnson D W and Morris J A 2009 Reducing Water
Seepage with Anionic Polyacrylamide Application Methods and Turbidity Effects
Journal of Irrigation and Drainage Engineering 135(1) 87-95
Strawhecker K E and Manias E 2000 Structure and Properties of Poly(vinyl alcohol)Na+
Montmorillonite Nanocomposites Chemistry of Materials 12(10) 2943-2949
Strawhecker K E and Manias E 2006 Nanocomposites based on water soluble polymers and
unmodified smectite clays In Y W Mai and Z-Z Yu (eds) Polymer nanocomposites
CRC Press Woodhead Boca Raton FL Cambridge England 206-233
Stumm W 1992 Chemistry of the solid-water interface processes at the mineral-water and
particle-water interface in natural systems Wiley New York
Stutzmann T and Siffert B 1977 Contribution to the adsorption mechanism of acetamide and
polyacrylamide onto clay Clays and Clay Minerals 25 392-406
Suarez D L Rhoades J R Lavado R S and Grieve C M 1984 Effect of pH on soil
dispersion and saturated hydraulic conductivity Soil Sci Soc Am J 48(1) 50-55
Suter J L Anderson R L Greenwell H C and Coveney P V 2009 Recent advances in
large-scale atomistic and coarse-grained molecular dynamics simulation of clay minerals
Journal of Materials Chemistry 19(17) 2482-2493
Suter J L Coveney P V Greenwell H C and Thyveetil M-A 2007 Large-Scale
Molecular Dynamics Study of Montmorillonite Clay Emergence of Undulatory
Fluctuations and Determination of Material Properties The Journal of Physical
Chemistry C 111(23) 8248-8259
121
Sutton R and Sposito G 2006 Molecular simulation of humic substance-Ca-montmorillonite
complexes Geochimica et Cosmochimica Acta 70(14) 3566-3581
Suzuki A and Tanaka T 1990 Phase transition in polymer gels induced by visible light
Nature 346 345-347
Swartzen-Allen S L and Matijevic E 1974 Surface and colloid chemistry of clays Chem
Rev 74(3) 385-400
Synowicki R A Pribil G K Cooney G Herzinger C M Green S E French R H Yang
M K Burnett J H and Kaplan S 2004 Fluid refractive index measurements using
rough surface and prism minimum deviation techniques Journal of Vacuum Science amp
Technology B 22(6) 3450-3453
Takahashi A 1991 Conformational states of polymers adsorbed on interfaces Polymer Journal
23(5) 715-724
Tanaka T Nishio I Sun S-T and Ueno-Nishio S 1982 Collapse of Gels in an Electric
Field Science 218(4571) 467-469
Tanihara K and Nakagawa M 1975 Flocculation treatment of waste water containing
montmorillonite IV Interlamellar complex formation between various ion forms of
montmorillonite and poly(ethylene oxide) or polyacrylamide Nippon Kagaku Kaishi 5
782-789
Tekin N Demirbas O and Alkan M 2005 Adsorption of cationic polyacrylamide onto
kaolinite Microporous and Mesoporous Materials 85(3) 340-350
Theng B K G 1979 Formation and Properties of Clay-Polymer Complexes Amsterdam New
York
Theng B K G 1982 Clay-polymer interactions summary and perspectives Clays and Clay
Minerals 30(1) 1-10
Tombacz E Csanaky C and Illes E 2001 Polydisperse fractal aggregate formation in clay
mineral and iron oxide suspensions pH and ionic strength dependence Colloid amp
Polymer Science 279(5) 484-492
Tran N H Dennis G R Milev A S Kannangara G S K Wilson M A and Lamb R N
2005 Interactions of sodium montmorillonite with poly(acrylic acid) Journal of Colloid
and Interface Science 290(2) 392-396
Ufer K Stanjek H Roth G Dohrmann R Kleeberg R and Kaufhold S 2008 Quantitative
phase analysis of bentonites by the rietveld method Clays and Clay Minerals 56(2) 272-
282
Uhlik F Limpouchova Z Jelinek K and Prochazka K 2004 Polyelectrolyte shells of
copolymer micelles in aqueous solutions A Monte Carlo study The Journal of Chemical
Physics 121(5) 2367-2375
Ulrich S Seijo M Laguecir A and Stoll S 2006 Nanoparticle adsorption on a weak
polyelectrolyte Stiffness pH charge mobility and ionic concentration effects
investigated by Monte Carlo simulations Journal of Physical Chemistry B 110(42)
20954-20964
Vaia R A Ishii H and Giannelis E P 1993 Synthesis and properties of two-dimensional
nanostructures by direct intercalation of polymer melts in layered silicates Chemistry of
Materials 5(12) 1694-1696
van Olphen H 1977 An Introduction to Clay Colloid Chemistry For Clay Technologists
Geologists and Soil Scientists 2nd ed Wiley New York
Vazquez B Roman J S Peniche C and Cohen M E 1997 Polymeric Hydrophilic
Hydrogels with Flexible Hydrophobic Chains Control of the Hydration and Interactions
with Water Molecules Macromolecules 30(26) 8440-8446
122
Wang J Wang D Y Li F Tang X G Chan H L W Mo D and Choy C L 2004
Simple transmission ellipsometry method for measuring the electric-field-induced
birefringence in PLZT thin films Journal of Materials Science 39(5) 1805-1807
Wang M S and Pinnavaia T J 1994 Clay-Polymer Nanocomposites Formed from Acidic
Derivatives of Montmorillonite and an Epoxy Resin Chemistry of Materials 6(4) 468-
474
Whitley H D and Smith D E 2004 Free energy energy and entropy of swelling in Cs- Na-
and Sr-montmorillonite clays Journal of Chemical Physics 120(11) 5387-5395
Whitney G 1990 Role of Water in the Smectite-to-Illite Reaction Clays and Clay Minerals
38(4) 343-350
Wu J and Lerner M M 1993 Structural thermal and electrical characterization of layered
nanocomposites derived from sodium-montmorillonite and polyethers Chemistry of
Materials 5(6) 835-838
Wu J Lin J Li G and Wei C 2001 Influence of the COOH and COONa groups and
crosslink density of poly(acrylic acid)montmorillonite superabsorbent composite on
water absorbency Polymer International 50(9) 1050-1053
Wu S and Shanks R A 2003 Conformation of polyacrylamide in aqueous solution with
interactive additives and cosolvents Journal of Applied Polymer Science 89(11) 3122-
3129
Wu S and Shanks R A 2004 Solubility study of polyacrylamide in polar solvents Journal of
Applied Polymer Science 93(3) 1493-1499
Wu S Shanks R A and Bryant G 2006 Properties of hydrophobically modified
polyacrylamide with low molecular weight and interaction with surfactant in aqueous
solution Journal of Applied Polymer Science 100(6) 4348-4360
Xia F Feng L Wang S Sun T Song W Jiang W and Jiang L 2006 Dual-responsive
surfaces that switch between superhydrophilicity and superhydrophobicity Advanced
Materials 18(4) 432-436
Yano K Usuki A Okada A Kurauchi T and Kamigaito O 1993 Synthesis and properties
of polyimide-clay hybrid J Polym Sci Part A 31 2493-2498
Young M H Moran E A Yu Z Zhu J and Smith D M 2009 Reducing Saturated
Hydraulic Conductivity of Sandy Soils with Polyacrylamide Soil Sci Soc Am J 73(1)
13-20
Zelazny L W He L and Vanwormhoudt A 1996 Charge Analysis of Soils and Anion
Exchange In D L Sparks ed Methods of soil analysis Part 3 Chemical methods Soil
Science Society of America American Society of Agronomy Madison Wis USA
1231-1253
Zeng Q H Yu A B and Lu G Q 2008 Multiscale modeling and simulation of polymer
nanocomposites Progress in Polymer Science 33(2) 191-269
Zeng Q H Yu A B Lu G Q and Paul D R 2005 Clay-based polymer nanocomposites
Research and commercial development Journal of Nanoscience and Nanotechnology
5(10) 1574-1592
Zysset M and Schindler P W 1996 The proton promoted dissolution kinetics of K-
montmorillonite Geochimica et Cosmochimica Acta 60(6) 921-931
123
APPENDIX A EXAMPLE CALCULATION FOR CLAY-TO-
POLYMER VOLUME RATIO
If we have 25g montmorillonite (ρ=25g0cm3) and 375g polyacrylamide (ρ=075g0cm3)
3
310
52
25cm
cmg
gV onitemontmorill
3
35
750
753cm
cmg
gV midepolyacryla
Thus clay-to-polymer volume ratio will be equal to 2
When clay-polymer nanocomposites are prepared using above amount of clay and polymer to set
clay content to 001 total volume of water to be used will be
mlcmg
g
contentclay
Mass
Vclay
clay
water 1000010
52
253
124
APPENDIX B PRESSURIZED PERMEABILITY
Sample Calculation
Measured flow rate Q = 10-5 cm3s = 61 x 10-7 in3s
Dynamic viscosity of water μ = 129 x 10-7 lbsin2 at 25degC
Sample diameter D = 1 in
Specimen length L = 15 in
Applied inlet pressure (driving pressure) Pa = 50 lbin2
Applied outlet pressure (atmospheric pressure) Pb = 147 lbin2
Unit weight of water γw = 624 lbft3 = 00361 lbin3
Cross-sectional area of the sample A = πD24 = 0785 in2
Hydraulic head due to the inlet pressure ha = Paγw = 138462 in
Hydraulic head due to the outlet pressure hb = Paγw = 40678 in
From Darcyrsquos law
L
hhAkQ ab )(
Thus hydraulic conductivity (permeability) k will be
)( ba hhA
LQk
= 1193 x 10-9 ins = 3029 x 10-9 cms
125
APPENDIX C DPD EQUILIBRATION
Figure C1 shows ltRg2gt12 of the simulated polymer sandwiched between two clay
surfaces as a function of pH at clay-to-polymer volume ratio 4 This confirms that each condition
in Figure 55 reached equilibrium at time step 500000
3
4
5
0 5 10 15
ltR
g2gt
12
Time (μs)
3
4
5
0 5 10 15
ltR
g2gt
12
Time (μs)
(a) (b)
3
4
5
0 5 10 15
ltR
g2gt
12
Time (μs)
3
4
5
0 5 10 15
ltR
g2gt
12
Time (μs)
(c) (d)
126
3
4
5
0 5 10 15
ltR
g2gt
12
Time (μs)
3
4
5
0 5 10 15
ltR
g2gt
12
Time (μs)
(e) (f)
35
45
55
0 5 10 15
ltR
g2gt
12
Time (μs)
35
45
55
0 5 10 15
ltR
g2gt
12
Time (μs)
(g) (h)
Figure C1 ltRg2gt12 vs simulation time for PAM with charge density of (a) 00 (b) 01 (c)
0143 (d) 02 (e) 025 (f) 033 (g) 05 and (h) 08 at clay-to-polymer volume ratio 4
127
APPENDIX D SCALING OF SIMULATED SYSTEM
As described in Section 52 one simulation length unit represents 4481 Aring From this
relationship the length of a polymer molecule composed of 236 beads with cutoff radius 2289 is
242 nm This represents a PAM molecule with molecular weight asymp 80000 gmol Similarly the
simulated surface composed of 22 beads times 22 beads represents a Mt surface with dimensions
of 225 nm x 225 nm Figure D1 shows a coarse-grained DPD bead a simulated PAM molecule
and a simulated Mt surface used in this study Figure D2 shows an example of unit conversion
between simulated values and real values
(a) (b) (c)
Figure D1 Schematic of simulated components used in this study (a) a DPD bead (b) a PAM
molecule and (c) a Mt surface
0
10
20
30
40
50
5 7 9 11 13
Inte
rlay
er S
paci
ng
pH
0
5
10
15
20
5 7 9 11 13
Inte
rlay
er S
paci
ng (
nm)
pH
(a) (b)
Figure D2 Simulated interlayer spacing results (a) in simulation unit (dimensionless) and (b) in
real unit (nm)
103 nm MW asymp 80000 gmol 225 nm
225 nm
128
VITA
Sungho Kim
EDUCATION PhD Civil and Environmental Engineering The Pennsylvania State University Dec 2011 Dissertation ldquoAn Engineered Clay Soil System Using Functional Polymersrdquo MSCE Civil and Environmental Engineering The Pennsylvania State University Aug 2008 Thesis ldquoPolyacrylamide-Treated Kaolin Clay A Fabric Studyrdquo BSE Environmental Science and Engineering (dual degree in Civil Engineering) Korea University Feb 2005
EXPERIENCE HIGHLIGHTS Graduate Research Assistant Aug 2006 ndash Dec 2011 Soil Particle Modification for the Development of Engineered Soil Materials
Polymer-Treated Clay Soils Engineered Soil Fabrics - Pore Fluid Chemistry and Mineral Mixtures Clay Particle Surface Modification Micro-Scale Soil Mechanics Multi-Scale Computer Simulation from Atomistic to Meso (MC MD DPD) NSF Research Project Jul 2010 ndash Dec 2011 PI Angelica M Palomino Project name Engineering a Modifiable clay ldquoTunablerdquo Polymer-Clay Composite Award number 1041995 Sponsor National Science Foundation Division of Civil Mechanical and Manufacturing
Innovation USA Undergraduate Research Assistant 2004 Project name Nonstructural Strategies for flood prevention Supervisor Ministry of Construction amp Transportation South Korea
(Since 2009 Ministry of Land Transport and Maritime Affairs) Republic of Korea Air Force Jan 1999 ndash Jul 2001 Detection Radar Operator Airman First Class
AWARDS AND FELLOWSHIPS Graduate Research Assistantship 2006 ndash 2011 Student Grant of the Clay Minerals Society 2011 Graduate Scholarship of the Construction Material Testing Laboratory 2009 2008 Undergraduate Research Assistantship 2004 Honors Scholarship 2004 2003 2002 Semester High Honor 2004 2003 2002
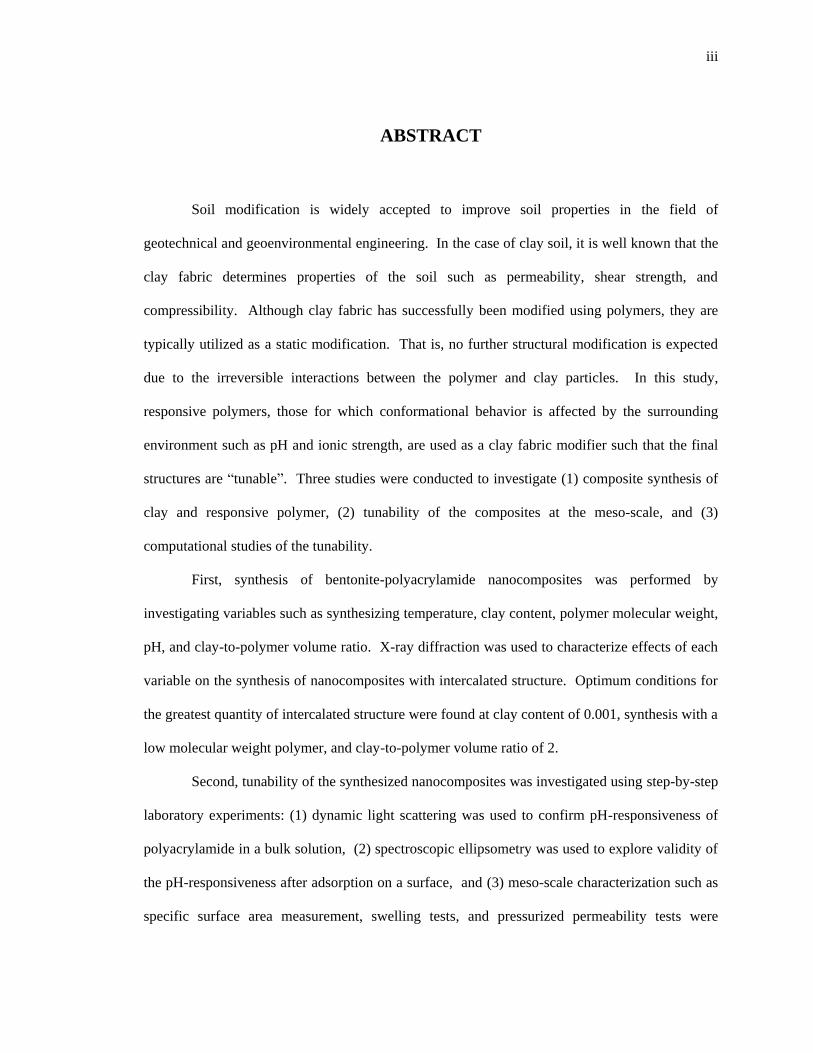
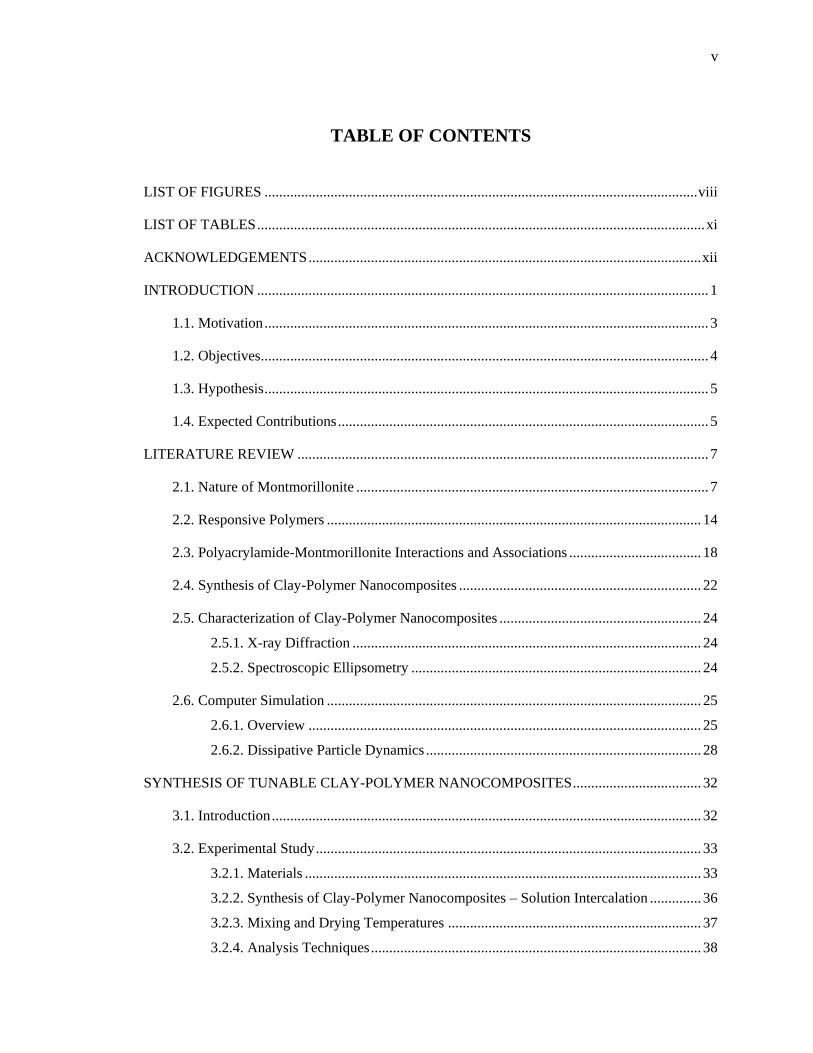