An energy-efficient residential area - BASRECbasrec.net/wp-content/uploads/2014/05/Integral Energy...
43
16.09.2013 Maija-Riitta Kontio An energy-efficient residential area
Transcript of An energy-efficient residential area - BASRECbasrec.net/wp-content/uploads/2014/05/Integral Energy...
16.09.2013
Maija-Riitta Kontio
An energy-efficient residential area
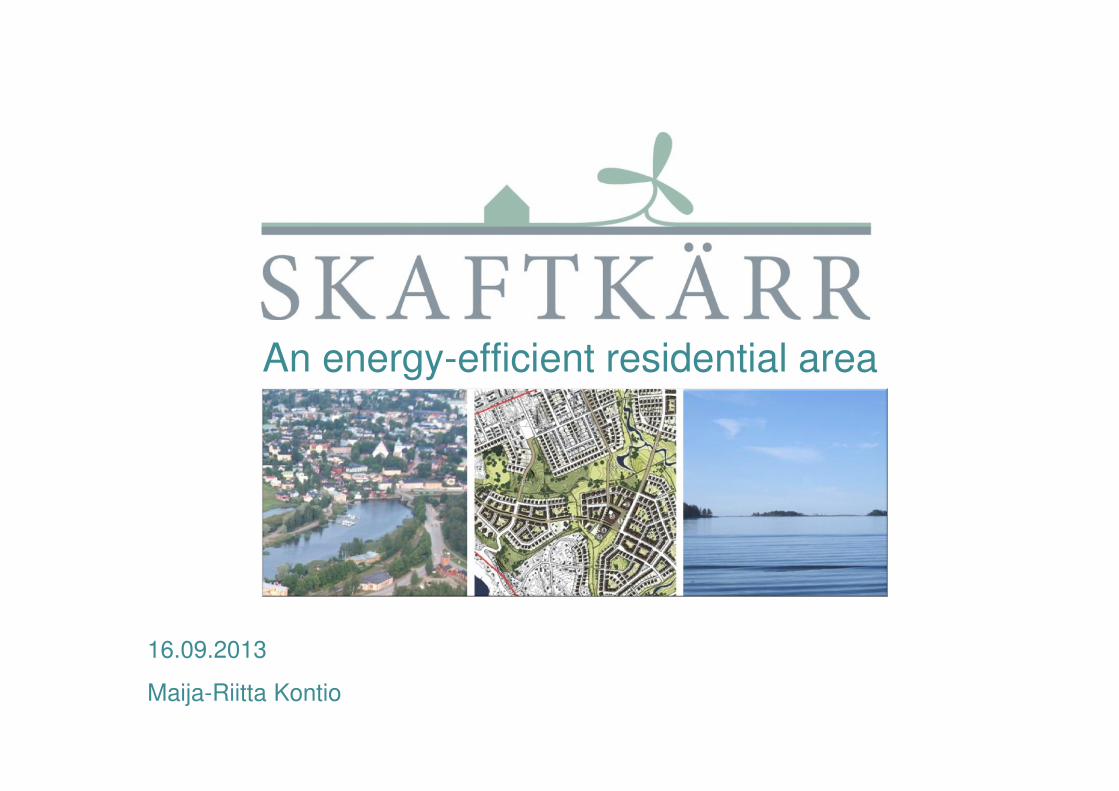
Inhabitants 49028
Number of jobs 20200
Primary production 2%
Industry 28%
Construction 8%
Trade 11%
Other services 51 %
Land area 655 km2
Water area 1 484 km2

PLANNING PROCESS IN FINLAND
NATIONAL GOALS FOR LANDUSEPLANNING
REGIONALPLAN
GENERALPLAN
CITYPLAN
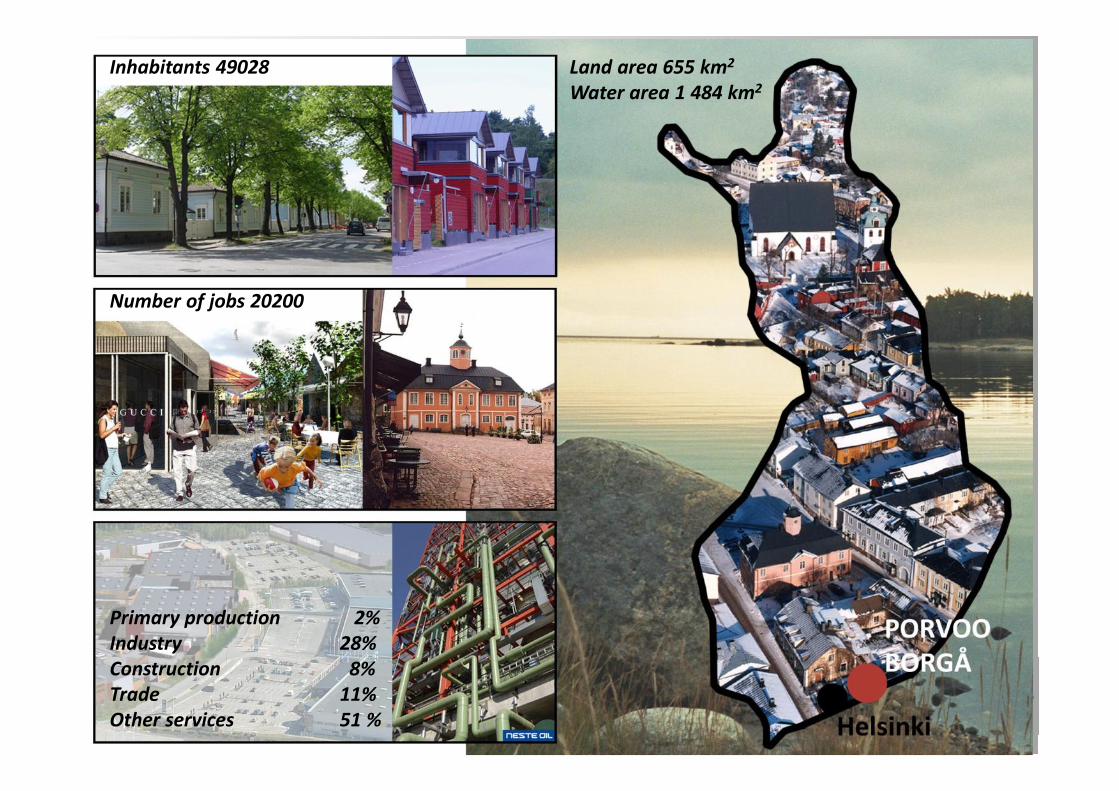
THE SKAFTKÄRR PROJECT • Duration 2008-2012
• Co-funders– City of Porvoo– Sitra– Porvoon Energia Oy
• Other partners:– Posintra Oy (project co-ordinator) – Ministry of the Environment (in steering group)– Uusimaa Centre for Economic Development, Transport and the
Environment (in steering group)
• Construction of Skaftkärr area 2012-2020
400 ha 6000 cap
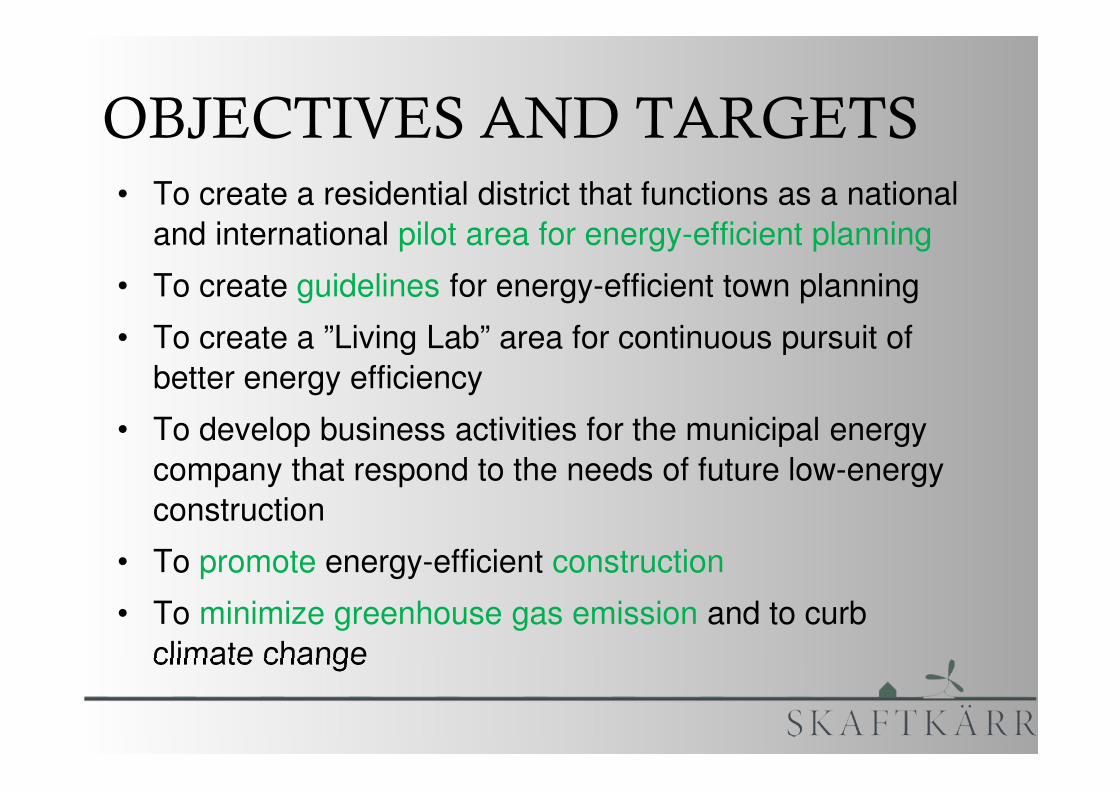
OBJECTIVES AND TARGETS• To create a residential district that functions as a national
and international pilot area for energy-efficient planning
• To create guidelines for energy-efficient town planning
• To create a ”Living Lab” area for continuous pursuit of better energy efficiency
• To develop business activities for the municipal energycompany that respond to the needs of future low-energyconstruction
• To promote energy-efficient construction
• To minimize greenhouse gas emission and to curbclimate change

Development of spatial planning
processes
Development of business
models for energy
companies
Energy LivingLab:
Development of counselling,
cooperation and feedback
An energy-efficient residential area: Skaftkärr in the City of Porvoo, Finland

Can town planning address the energy efficiency of areas ?
What ways are there to reduce carbon footprints ?
Do we need to change planning practices and develop ourplanning process ?
QUESTIONS
SKAFTKÄRR OUTLINE PLAN
TOUKOVUORI CITY PLAN
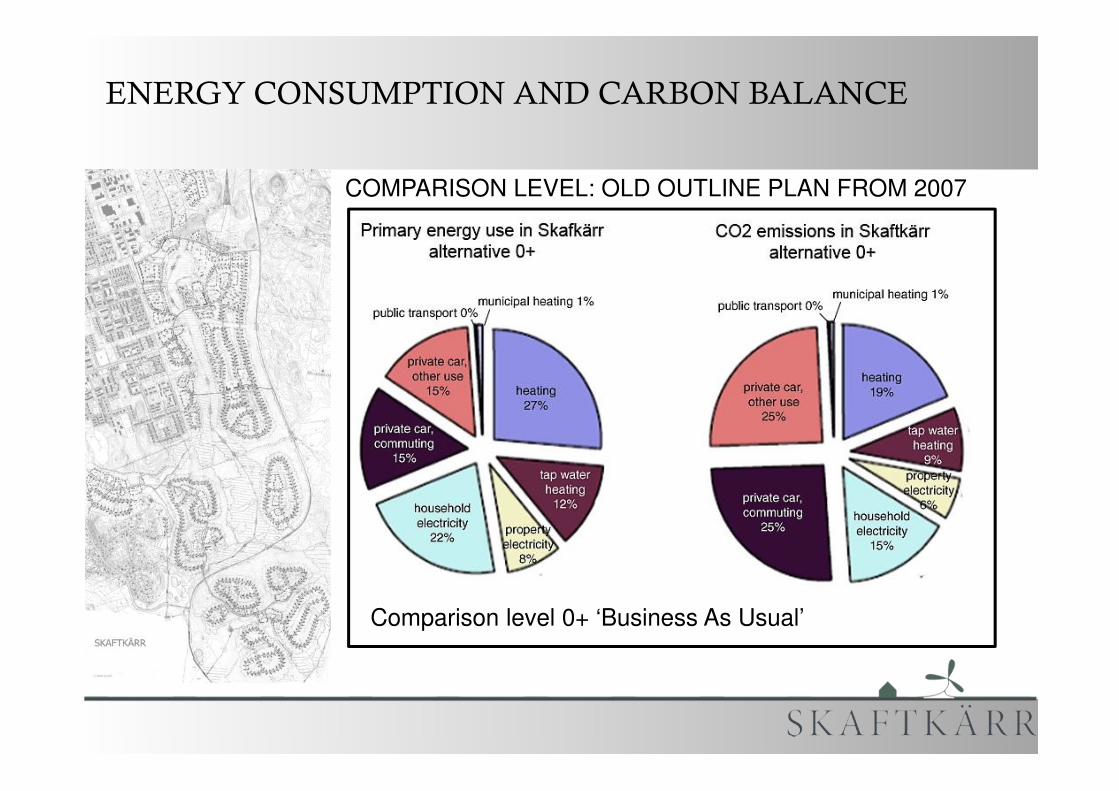
COMPARISON LEVEL: OLD OUTLINE PLAN FROM 2007
ENERGY CONSUMPTION AND CARBON BALANCE
Comparison level 0+ ‘Business As Usual’
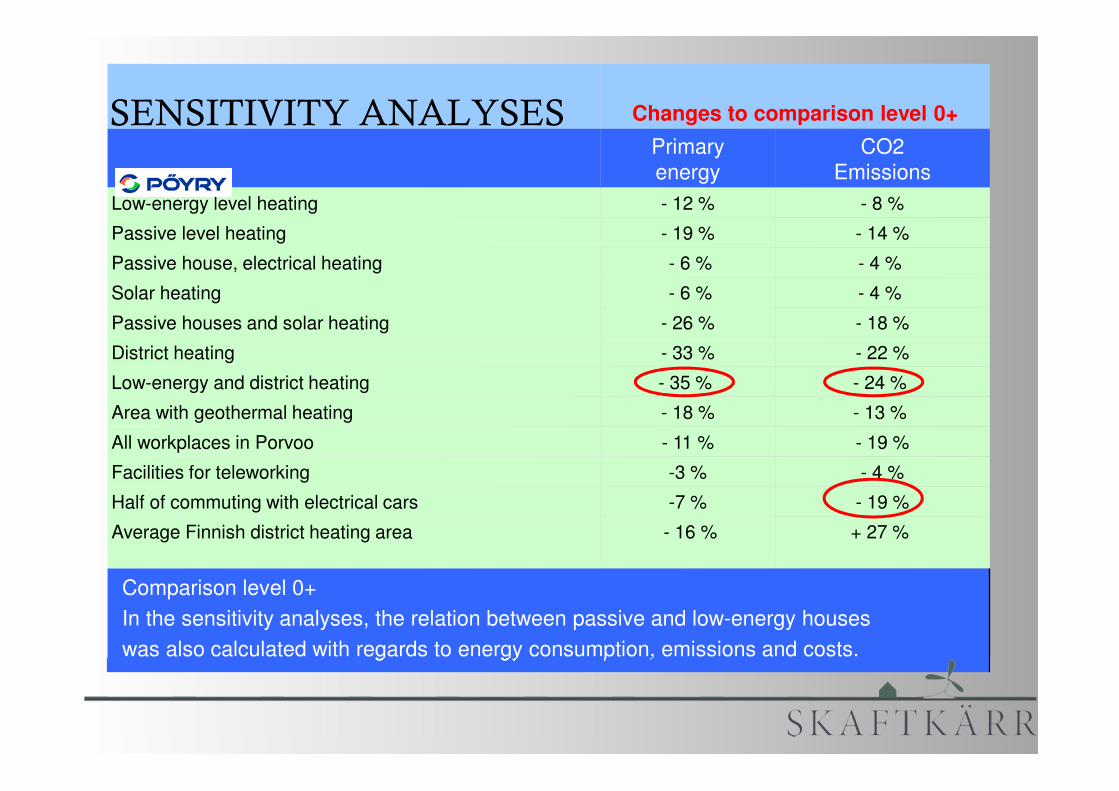
Changes to comparison level 0+
Primaryenergy
CO2Emissions
Low-energy level heating - 12 % - 8 %
Passive level heating - 19 % - 14 %
Passive house, electrical heating - 6 % - 4 %
Solar heating - 6 % - 4 %
Passive houses and solar heating - 26 % - 18 %
District heating - 33 % - 22 %
Low-energy and district heating - 35 % - 24 %
Area with geothermal heating - 18 % - 13 %
All workplaces in Porvoo - 11 % - 19 %
Facilities for teleworking -3 % - 4 %
Half of commuting with electrical cars -7 % - 19 %
Average Finnish district heating area - 16 % + 27 %
Comparison level 0+
In the sensitivity analyses, the relation between passive and low-energy houses
was also calculated with regards to energy consumption, emissions and costs.
SENSITIVITY ANALYSES

SOLUTION MODELSLAND USE
M1 M2 M3 M4
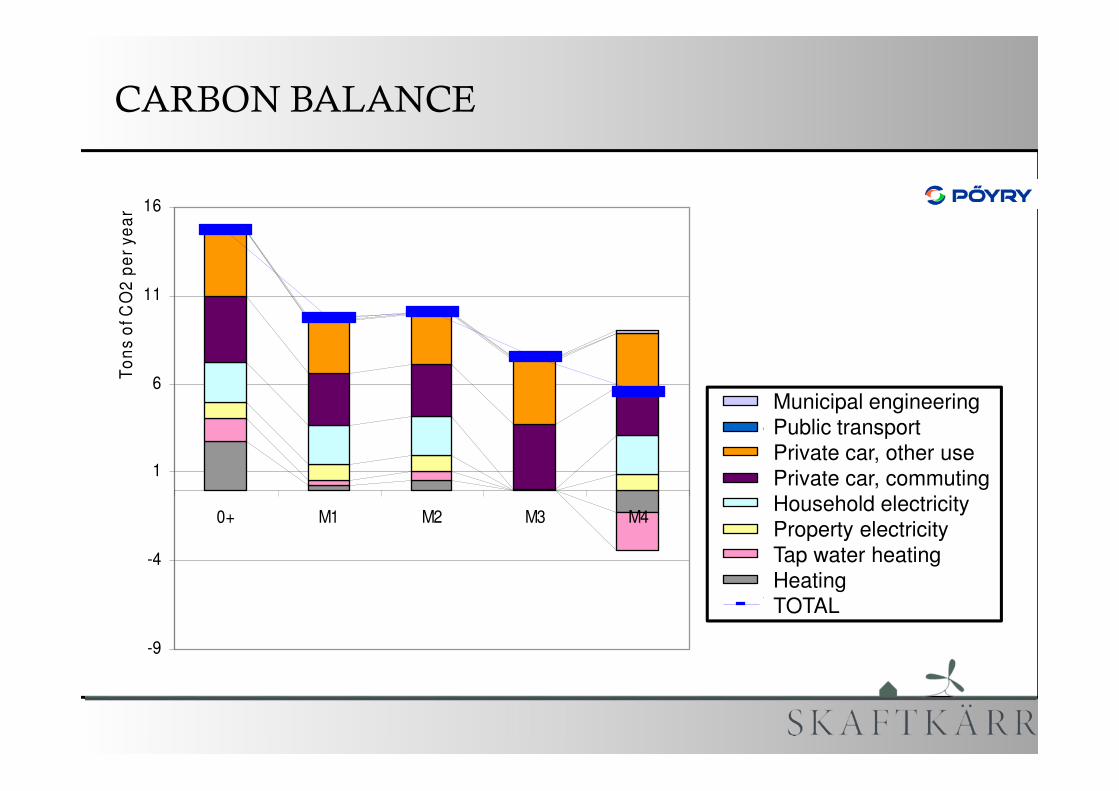
CARBON BALANCE
-9
-4
1
6
11
16
0+ M1 M2 M3 M4
To
ns
of C
O2
pe
r ye
ar
Kunnallistekniikka
Julkinen liikenne
Henkilöauto, muu
Henkilöauto, työ
Käyttäjäsähkö
Kiinteistösähkö
Käyttövesi
Lämmitys
YHTEENSÄ
Municipal engineeringPublic transportPrivate car, other usePrivate car, commutingHousehold electricityProperty electricityTap water heatingHeatingTOTAL
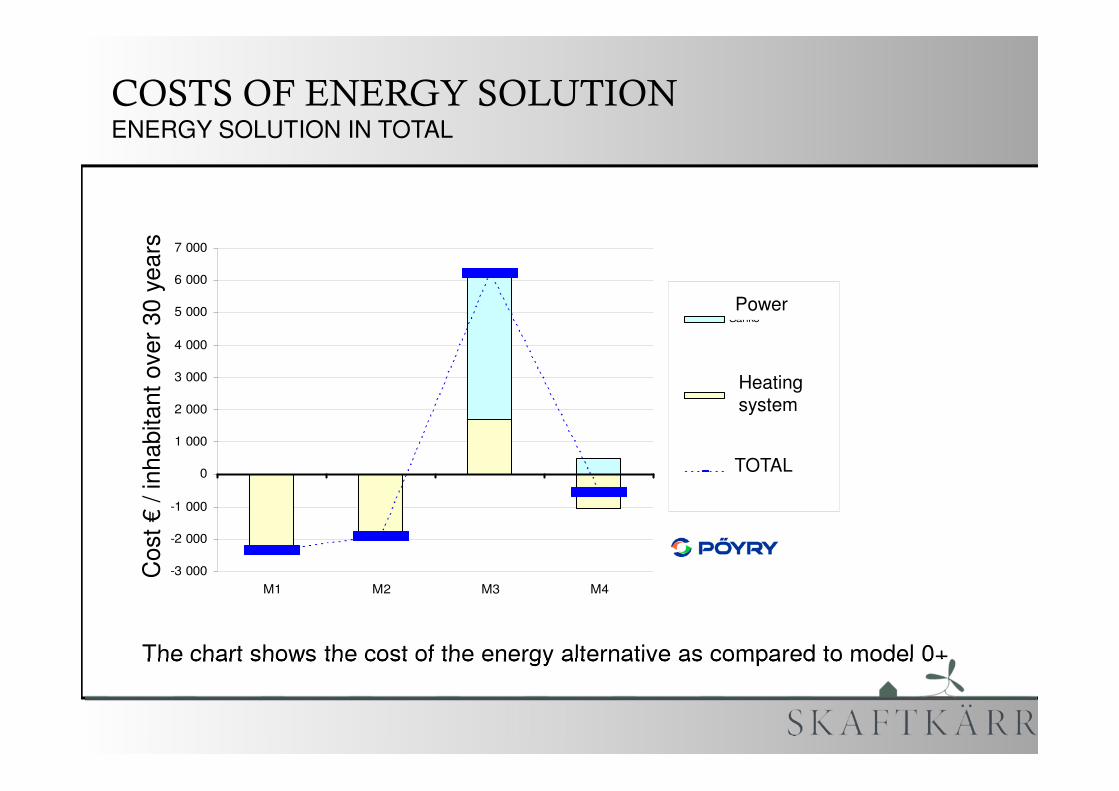
COSTS OF ENERGY SOLUTIONENERGY SOLUTION IN TOTAL
The chart shows the cost of the energy alternative as compared to model 0+
Energiaratkaisu yhteensä
-3 000
-2 000
-1 000
0
1 000
2 000
3 000
4 000
5 000
6 000
7 000
M1 M2 M3 M4
Kus
tann
us €
/asu
kas
30 v
uode
ssa
Sähkö
Lämmitysjärjestelmä
YHTEENSÄ
Cos
t€/ i
nhab
itant
over
30 y
ears
Power
Heatingsystem
TOTAL
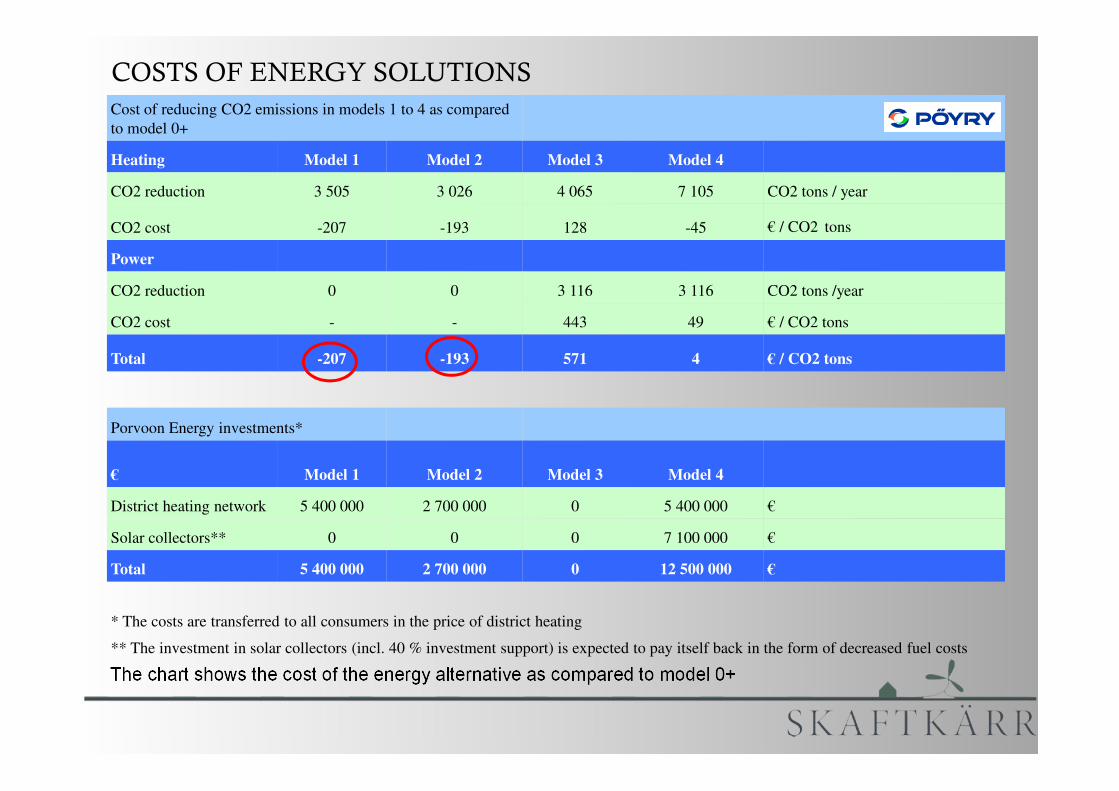
COSTS OF ENERGY SOLUTIONS
The chart shows the cost of the energy alternative as compared to model 0+
Cost of reducing CO2 emissions in models 1 to 4 as compared
to model 0+
Heating Model 1 Model 2 Model 3 Model 4
CO2 reduction 3 505 3 026 4 065 7 105 CO2 tons / year
CO2 cost -207 -193 128 -45 € / CO2 tons
Power
CO2 reduction 0 0 3 116 3 116 CO2 tons /year
CO2 cost - - 443 49 € / CO2 tons
Total -207 -193 571 4 € / CO2 tons
Porvoon Energy investments*
€ Model 1 Model 2 Model 3 Model 4
District heating network 5 400 000 2 700 000 0 5 400 000 €
Solar collectors** 0 0 0 7 100 000 €
Total 5 400 000 2 700 000 0 12 500 000 €
* The costs are transferred to all consumers in the price of district heating
** The investment in solar collectors (incl. 40 % investment support) is expected to pay itself back in the form of decreased fuel costs
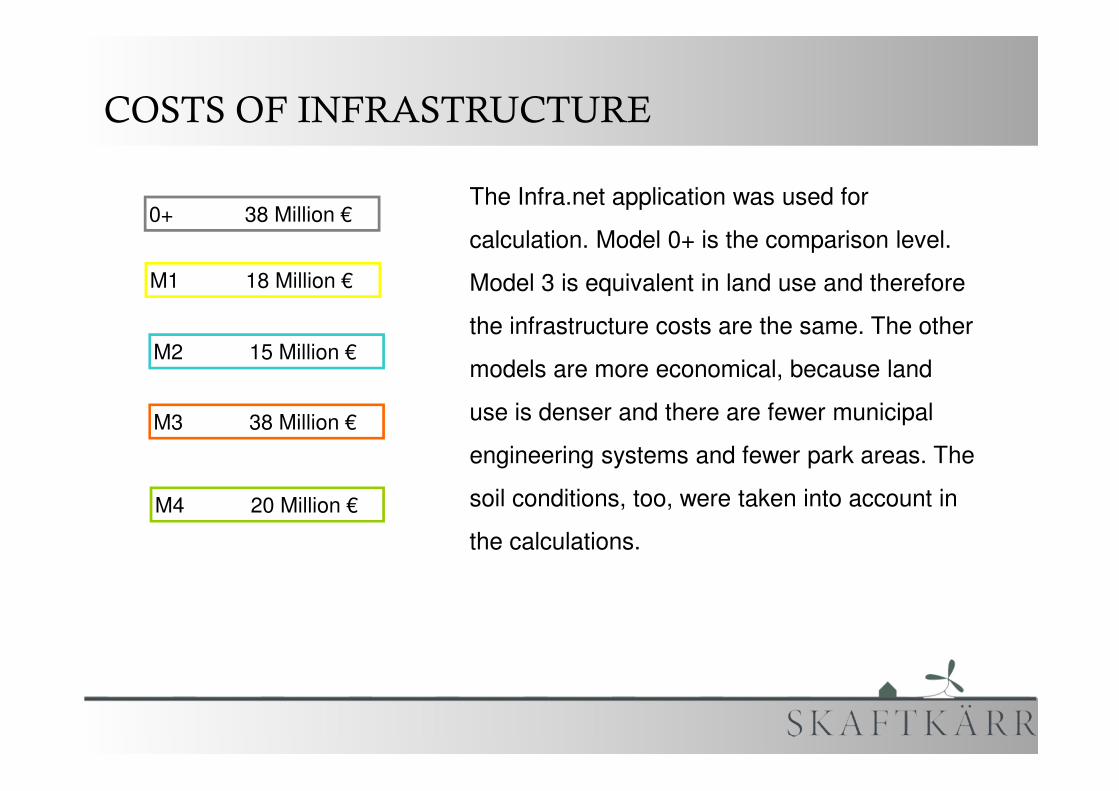
COSTS OF INFRASTRUCTURE
The Infra.net application was used for
calculation. Model 0+ is the comparison level.
Model 3 is equivalent in land use and therefore
the infrastructure costs are the same. The other
models are more economical, because land
use is denser and there are fewer municipal
engineering systems and fewer park areas. The
soil conditions, too, were taken into account in
the calculations.
0+ 38 Million €
M1 18 Million €
M2 15 Million €
M3 38 Million €
M4 20 Million €
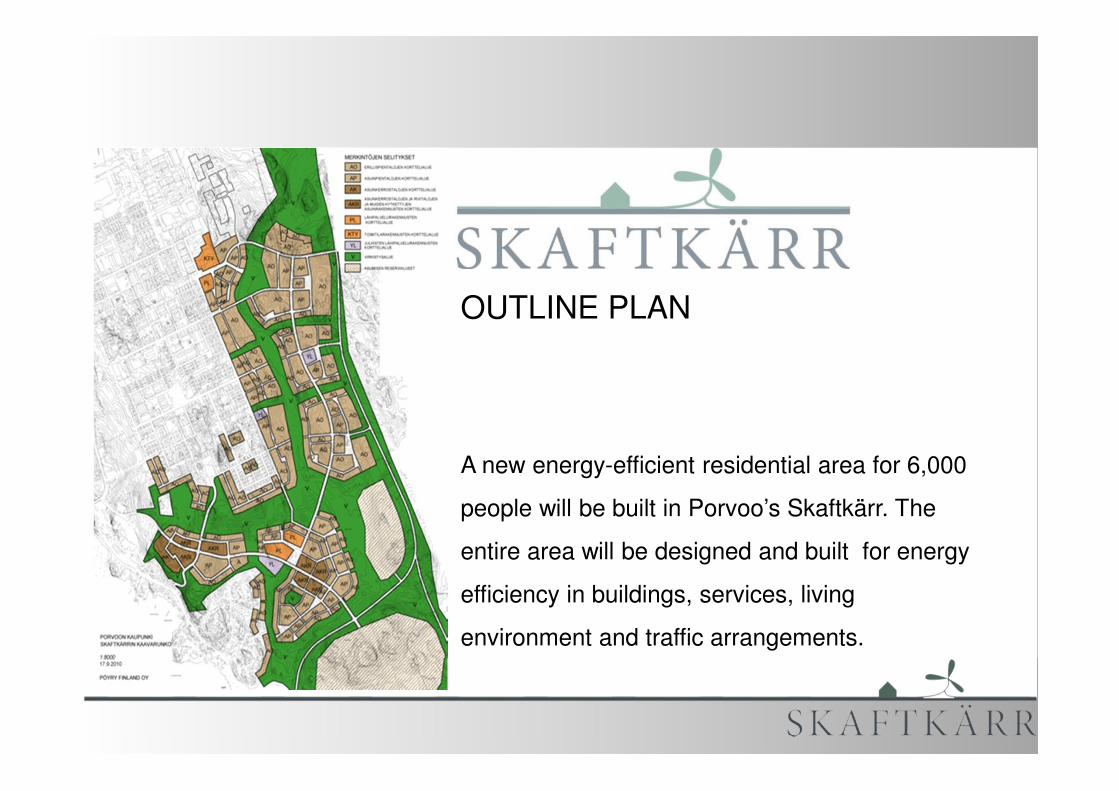
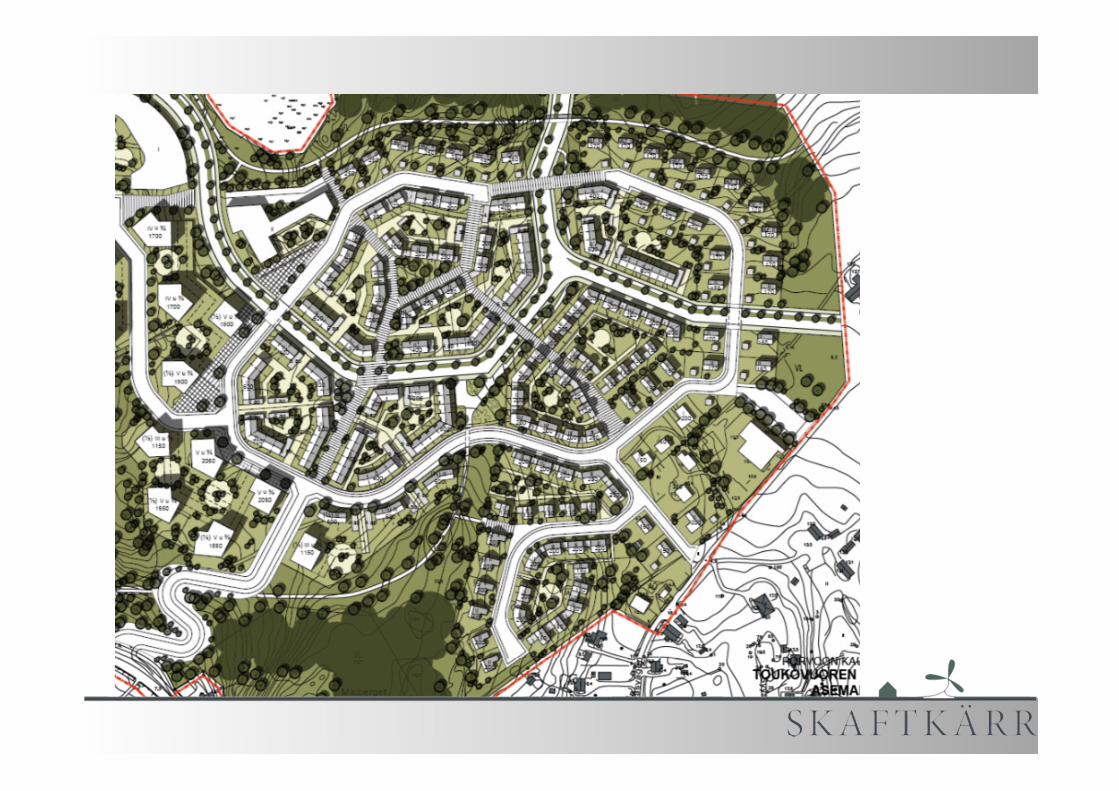
OUTLINE PLAN
A new energy-efficient residential area for 6,000
people will be built in Porvoo’s Skaftkärr. The
entire area will be designed and built for energy
efficiency in buildings, services, living
environment and traffic arrangements.
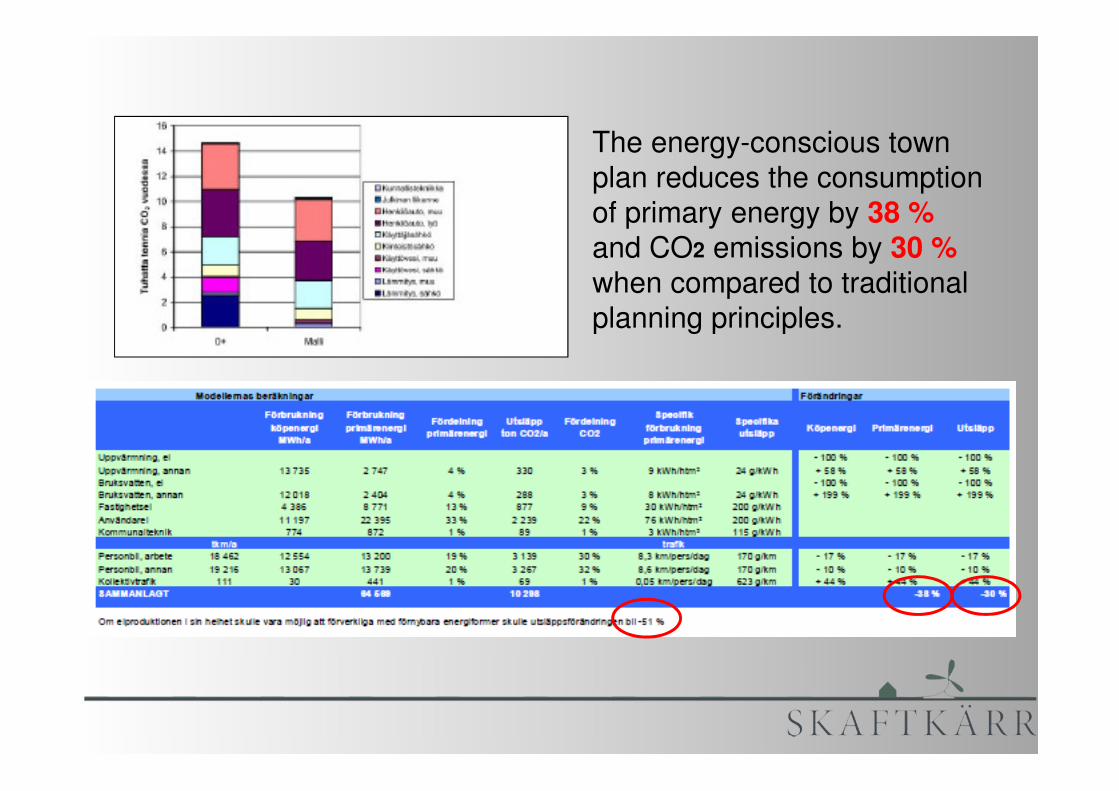
The energy-conscious townplan reduces the consumptionof primary energy by 38 %and CO2 emissions by 30 % when compared to traditionalplanning principles.
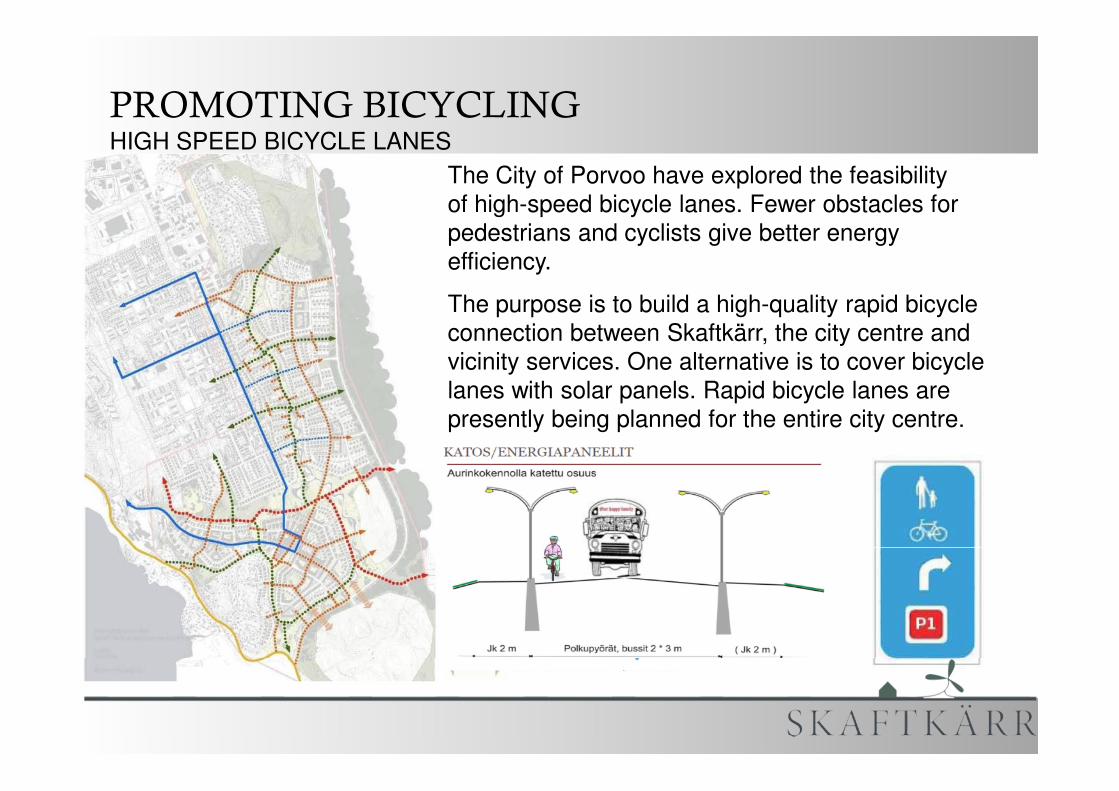
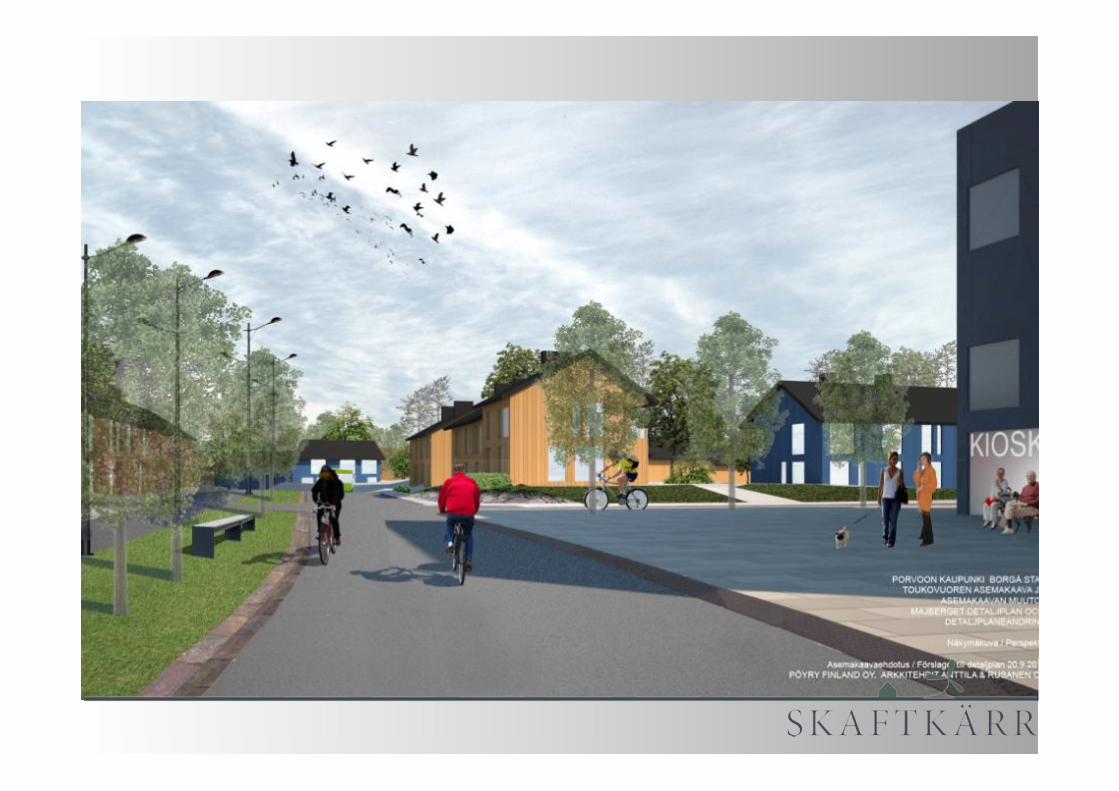
The City of Porvoo have explored the feasibilityof high-speed bicycle lanes. Fewer obstacles for pedestrians and cyclists give better energyefficiency.
PROMOTING BICYCLINGHIGH SPEED BICYCLE LANES
The purpose is to build a high-quality rapid bicycleconnection between Skaftkärr, the city centre and vicinity services. One alternative is to cover bicyclelanes with solar panels. Rapid bicycle lanes arepresently being planned for the entire city centre.
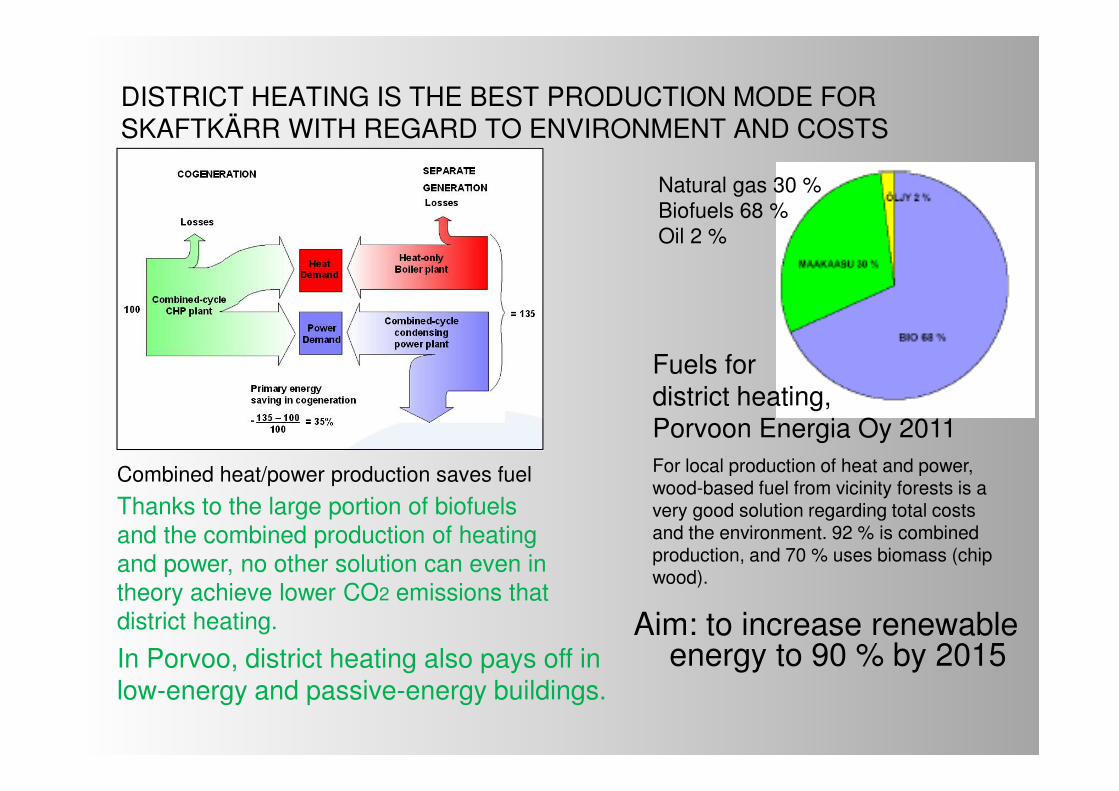
DISTRICT HEATING IS THE BEST PRODUCTION MODE FORSKAFTKÄRR WITH REGARD TO ENVIRONMENT AND COSTS
Combined heat/power production saves fuel
Fuels for district heating, Porvoon Energia Oy 2011For local production of heat and power, wood-based fuel from vicinity forests is a very good solution regarding total costsand the environment. 92 % is combinedproduction, and 70 % uses biomass (chipwood).
Thanks to the large portion of biofuels and the combined production of heating and power, no other solution can even in theory achieve lower CO2 emissions that district heating.
In Porvoo, district heating also pays off in low-energy and passive-energy buildings.
Natural gas 30 %Biofuels 68 %Oil 2 %
Aim: to increase renewable energy to 90 % by 2015
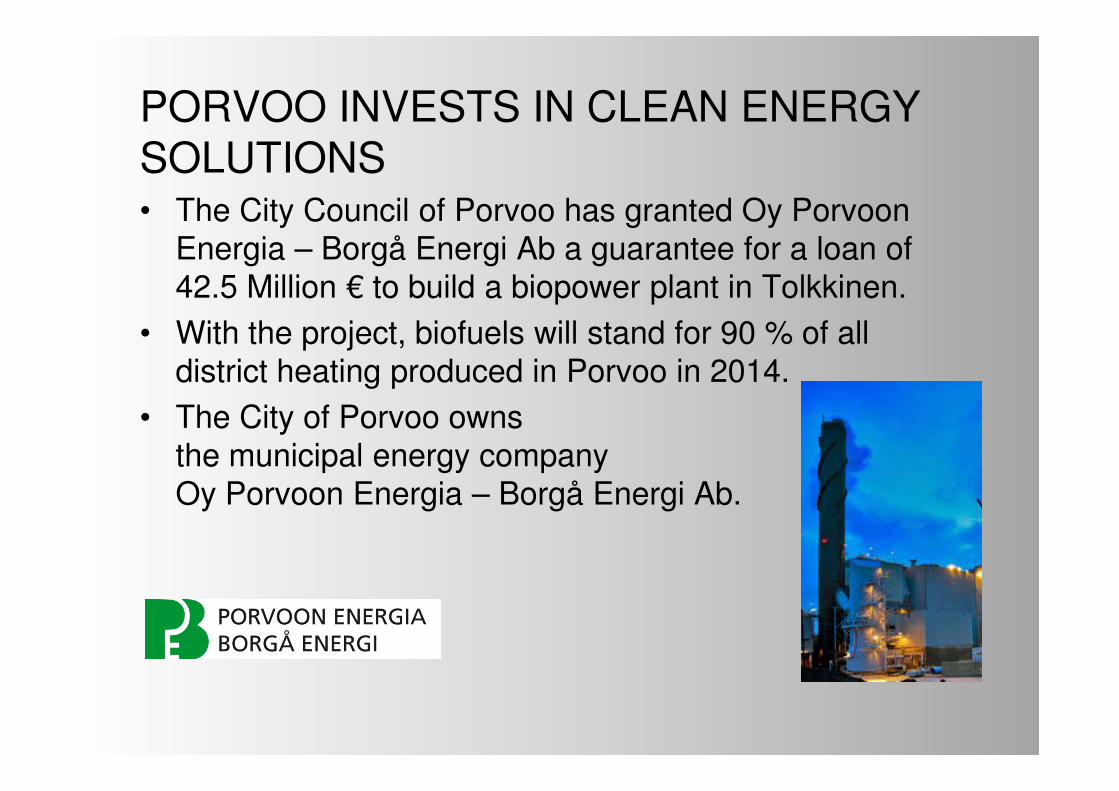
PORVOO INVESTS IN CLEAN ENERGY SOLUTIONS• The City Council of Porvoo has granted Oy Porvoon
Energia – Borgå Energi Ab a guarantee for a loan of 42.5 Million € to build a biopower plant in Tolkkinen.
• With the project, biofuels will stand for 90 % of alldistrict heating produced in Porvoo in 2014.
• The City of Porvoo ownsthe municipal energy companyOy Porvoon Energia – Borgå Energi Ab.
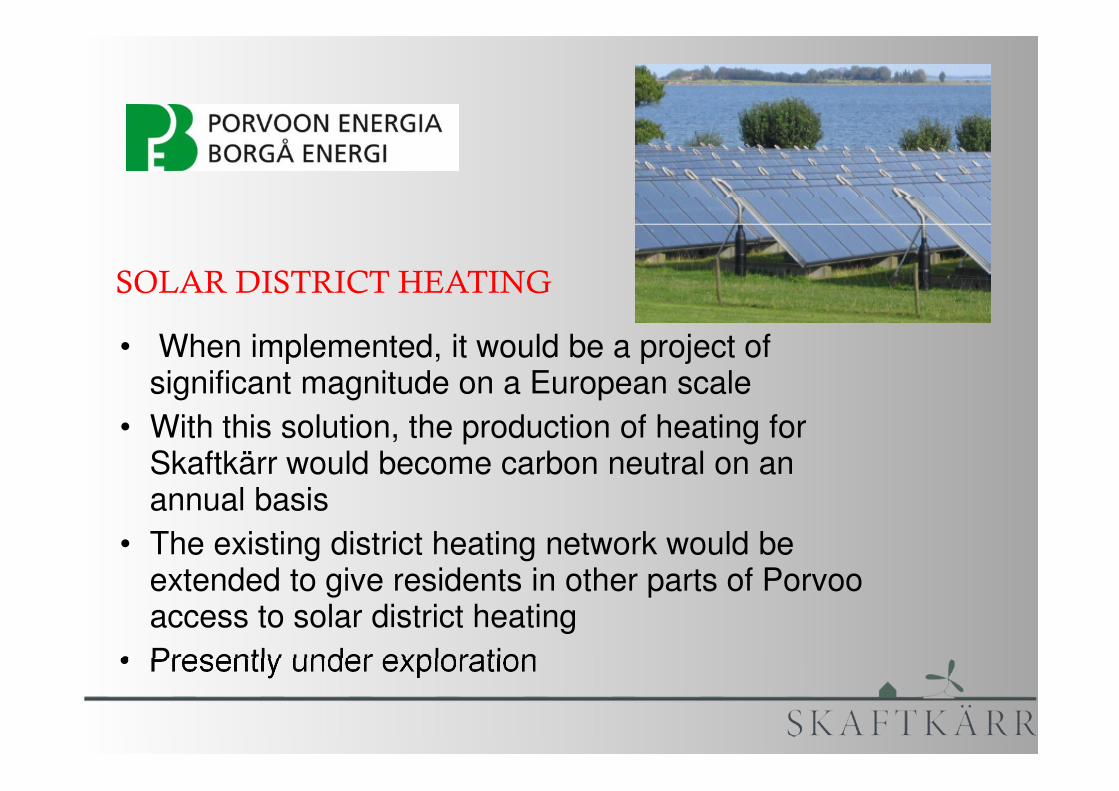
• When implemented, it would be a project of significant magnitude on a European scale
• With this solution, the production of heating for Skaftkärr would become carbon neutral on an annual basis
• The existing district heating network would beextended to give residents in other parts of Porvoo access to solar district heating
• Presently under exploration
SOLAR DISTRICT HEATING
SKAFTKÄRR OUTLINE PLAN
TOUKOVUORI CITY PLAN
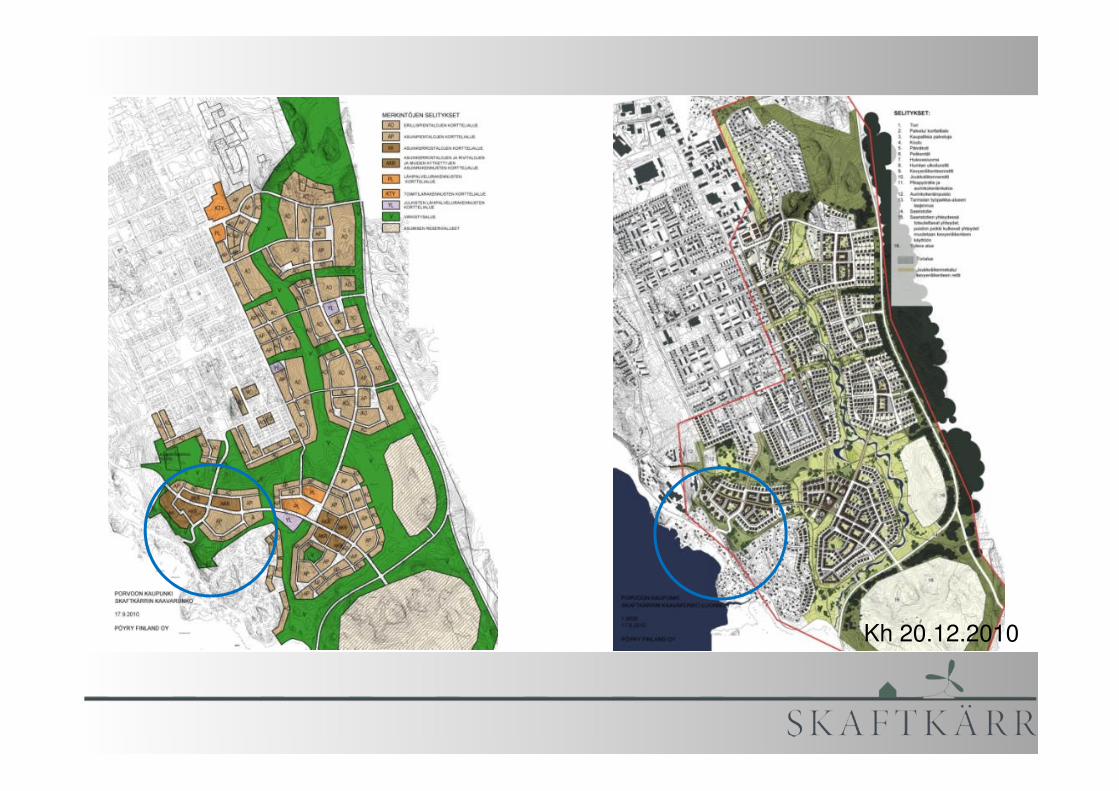
Kh 20.12.2010
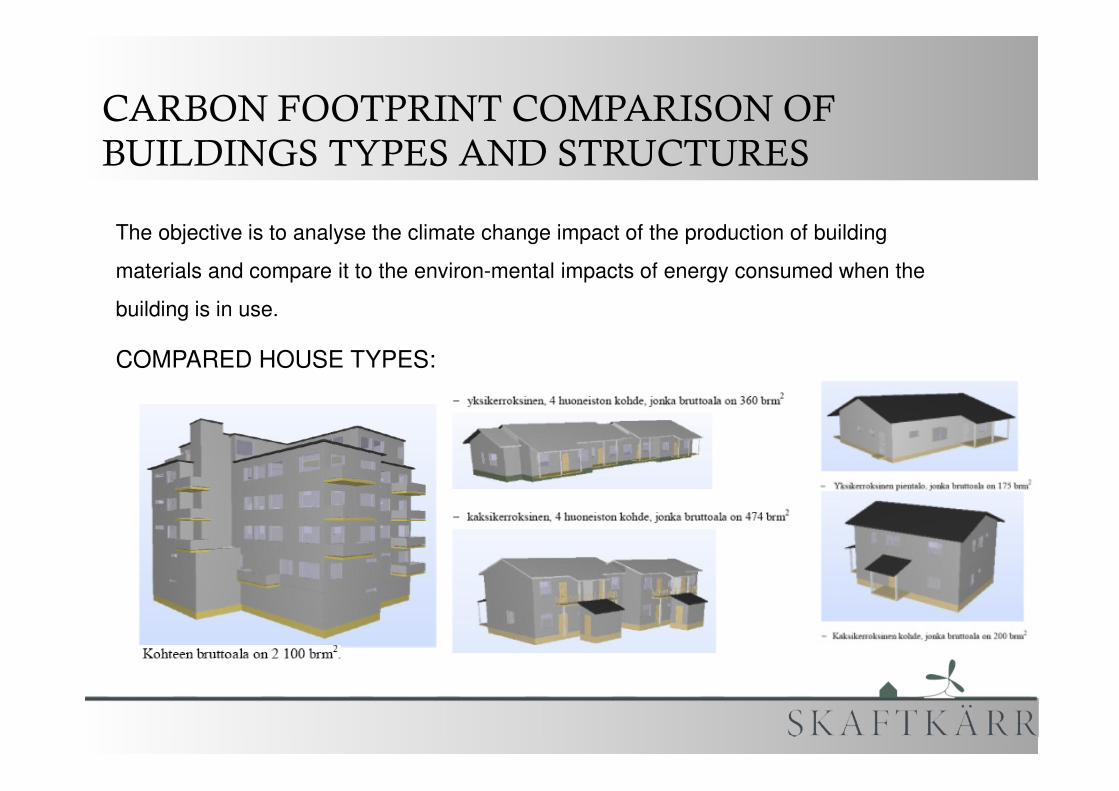
CARBON FOOTPRINT COMPARISON OF BUILDINGS TYPES AND STRUCTURES
The objective is to analyse the climate change impact of the production of building
materials and compare it to the environ-mental impacts of energy consumed when the
building is in use.
COMPARED HOUSE TYPES:

Multi-storey residential buildings: Main sources of carbon footprint during construction and use
Multi-storey residential buildings: carbon footprint caused byconstruction and 30 years of use
30-year perspective of carbon footprint in multi-storey residentialhouses built according to new 2012 norms and useing districtheating(Concrete frame / Wooden frame / Concrete frame, passive)
COMPARISON OF CARBON FOOTPRINT OF BUILDINGS
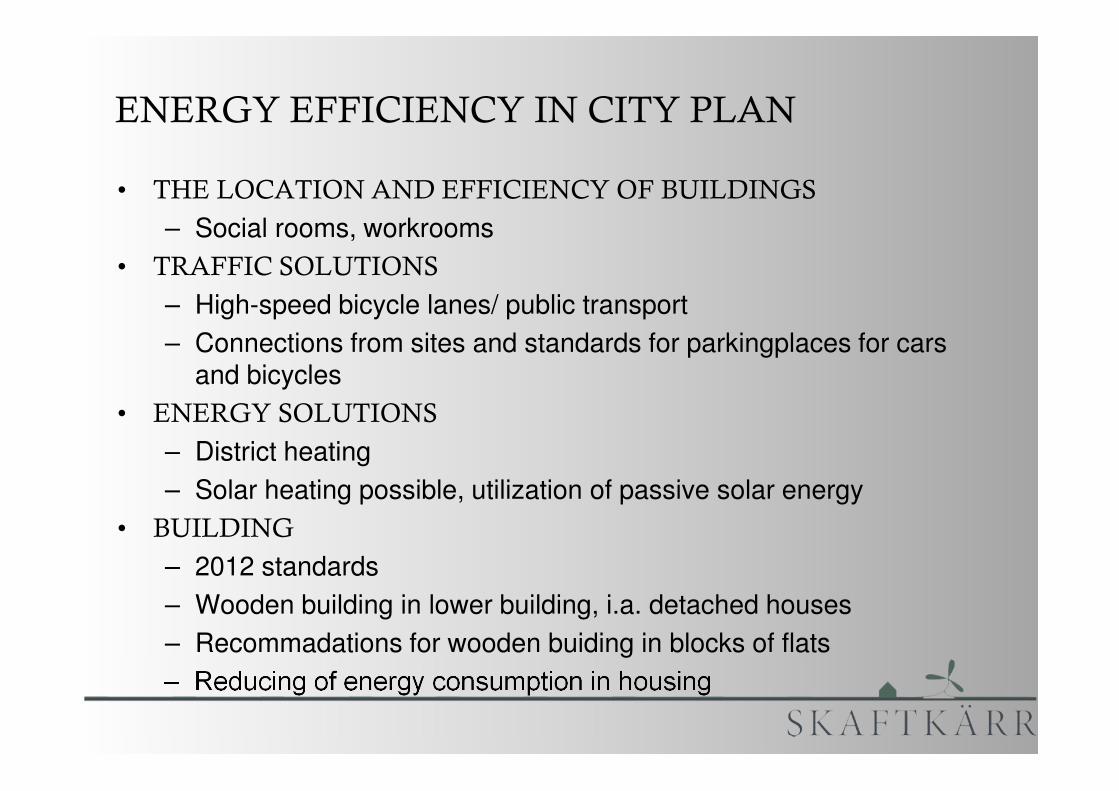
ENERGY EFFICIENCY IN CITY PLAN
• THE LOCATION AND EFFICIENCY OF BUILDINGS
– Social rooms, workrooms
• TRAFFIC SOLUTIONS
– High-speed bicycle lanes/ public transport
– Connections from sites and standards for parkingplaces for carsand bicycles
• ENERGY SOLUTIONS
– District heating
– Solar heating possible, utilization of passive solar energy
• BUILDING
– 2012 standards
– Wooden building in lower building, i.a. detached houses
– Recommadations for wooden buiding in blocks of flats
– Reducing of energy consumption in housing
ENERGY EFFICIENCY STARTS FROM PLANNING
• The Skaftkärr project has clearly demonstrated that significant emissions reductions can be achieved in Finland if the evaluation of energy and emissions impact is included in all town planning
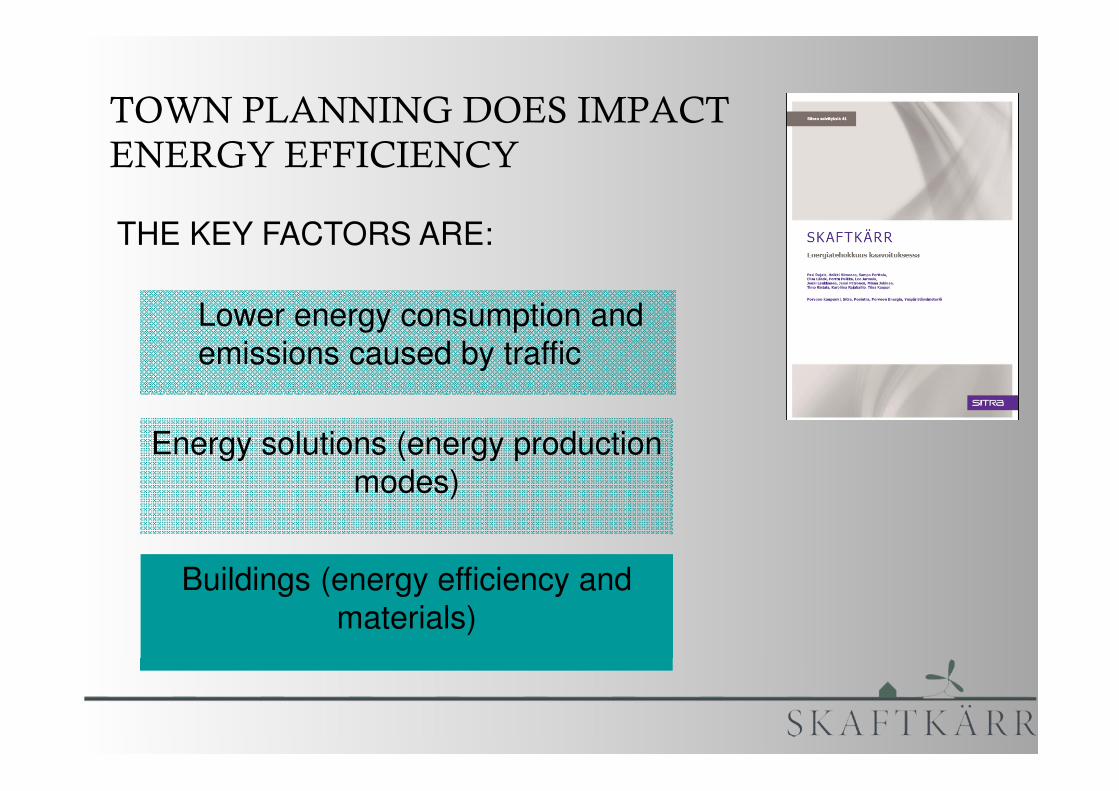
TOWN PLANNING DOES IMPACT ENERGY EFFICIENCY
Lower energy consumption and emissions caused by traffic
Energy solutions (energy productionmodes)
Buildings (energy efficiency and materials)
THE KEY FACTORS ARE:
Maarit Ståhlberg and Maija-Riitta Kontio
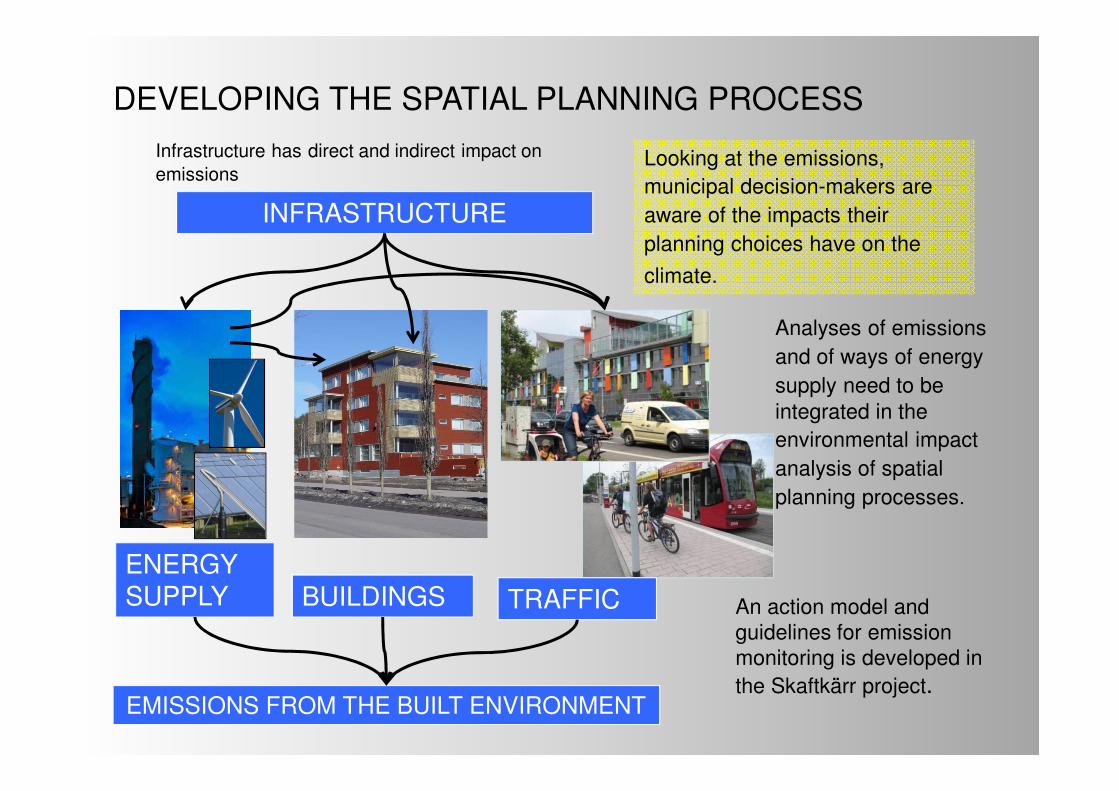
ENERGY SUPPLY BUILDINGS TRAFFIC
INFRASTRUCTURE
EMISSIONS FROM THE BUILT ENVIRONMENT
DEVELOPING THE SPATIAL PLANNING PROCESS
Looking at the emissions, municipal decision-makers areaware of the impacts theirplanning choices have on the
climate.
Analyses of emissions and of ways of energysupply need to beintegrated in the environmental impactanalysis of spatialplanning processes.
An action model and guidelines for emission monitoring is developed in the Skaftkärr project.
Infrastructure has direct and indirect impact on emissions
GOOD NEWSEnergy efficiency has a pricetag
Carbon footprints cost, tooSmaller footprints can reduce
residential costs
Spatial planning has its pricetag, too, but it can reduce the costs
of implementation
SPATIAL PLANNING IS NOT ENOUGH
• We need to focus the whole process from stragies, Zone planning,Cityplanning, building guidance and permiting to housing and every day´sliving and clarify, what are the impacts in enegy efficiency and emissions
• Process is important, how to deal information is even more
• Spatial planning is co-operation or more: working together
• We have to change and renew our ways of working
• We have to be open-minded for new practices and at the same time:
• We have to offer different possibilities to act and choise, both for citizensand decission makers
• Living Lab for monitoring and dissemination
NATIONAL LAND USE GUIDLINES
LOCAL MASTER PLAN
LOCAL DETAILED PLAN
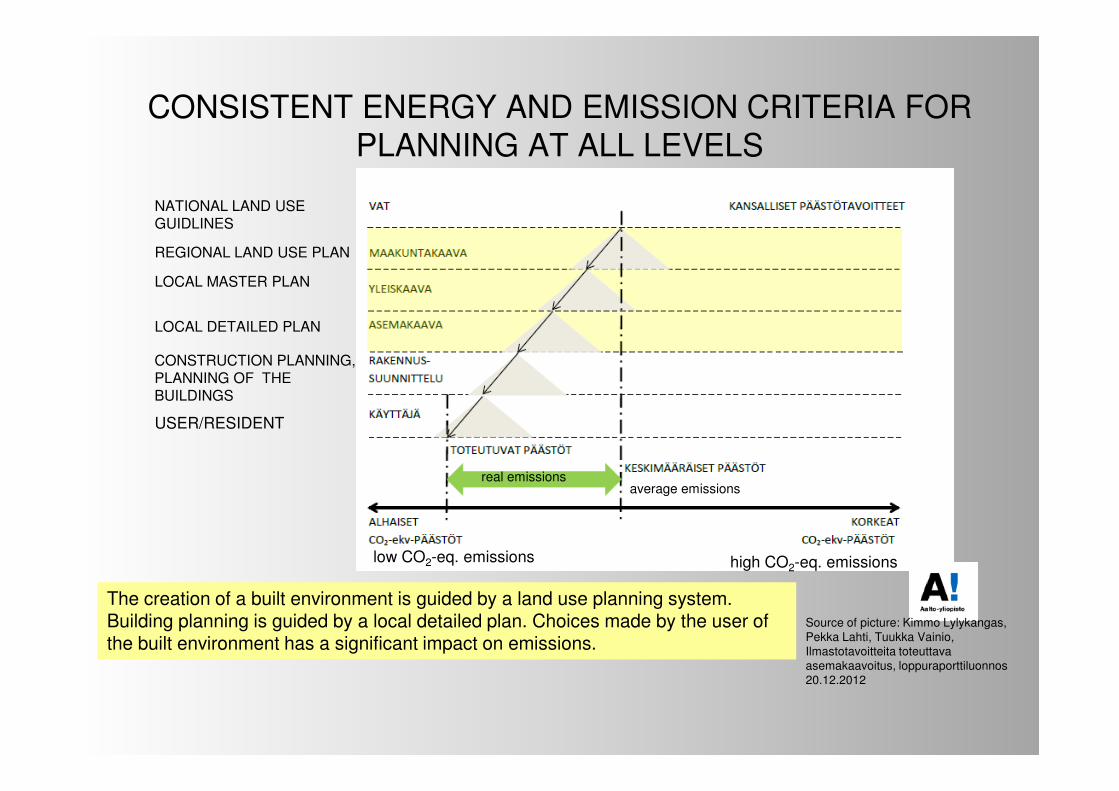
CONSISTENT ENERGY AND EMISSION CRITERIA FOR PLANNING AT ALL LEVELS
REGIONAL LAND USE PLAN
The creation of a built environment is guided by a land use planning system. Building planning is guided by a local detailed plan. Choices made by the user of the built environment has a significant impact on emissions.
Source of picture: Kimmo Lylykangas, Pekka Lahti, Tuukka Vainio, Ilmastotavoitteita toteuttava asemakaavoitus, loppuraporttiluonnos 20.12.2012
CONSTRUCTION PLANNING, PLANNING OF THE BUILDINGS
USER/RESIDENT
real emissionsaverage emissions
low CO2-eq. emissions high CO2-eq. emissions
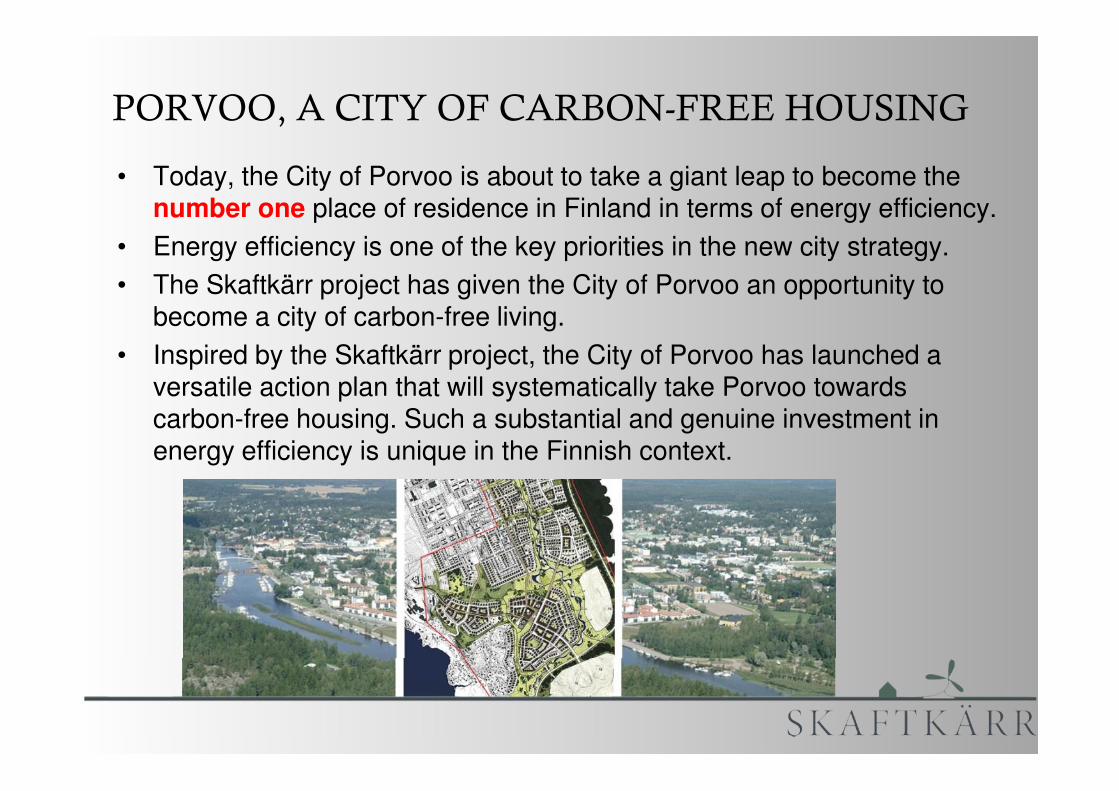
PORVOO, A CITY OF CARBON-FREE HOUSING
• Today, the City of Porvoo is about to take a giant leap to become the number one place of residence in Finland in terms of energy efficiency.
• Energy efficiency is one of the key priorities in the new city strategy.
• The Skaftkärr project has given the City of Porvoo an opportunity to become a city of carbon-free living.
• Inspired by the Skaftkärr project, the City of Porvoo has launched a versatile action plan that will systematically take Porvoo towards carbon-free housing. Such a substantial and genuine investment in energy efficiency is unique in the Finnish context.
What is it ?What is it ?What is it ?What is it ?
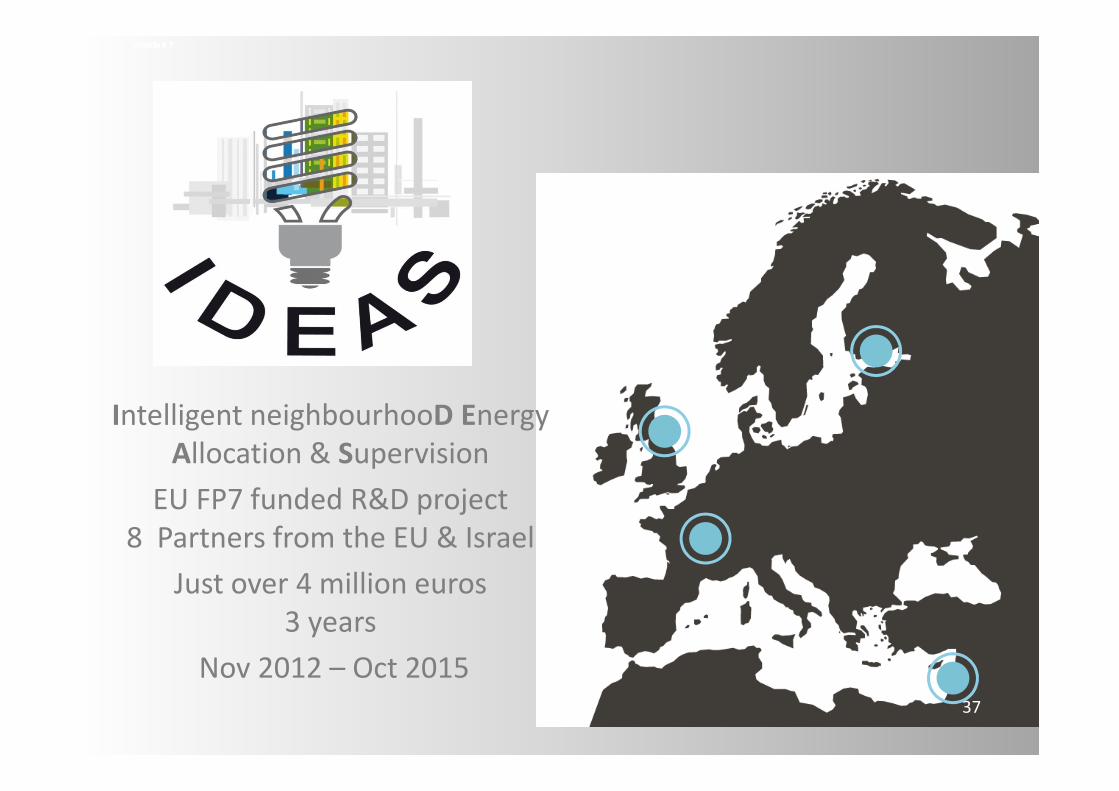
Intelligent neighbourhooD Energy
Allocation & Supervision
EU FP7 funded R&D project
8 Partners from the EU & Israel
Just over 4 million euros
3 years
Nov 2012 – Oct 2015 37
IDEAS-project is currently working on o IT tools and o business models
that can be exploited ino planning of energy positive residential areaso energy production and o energy consumption.
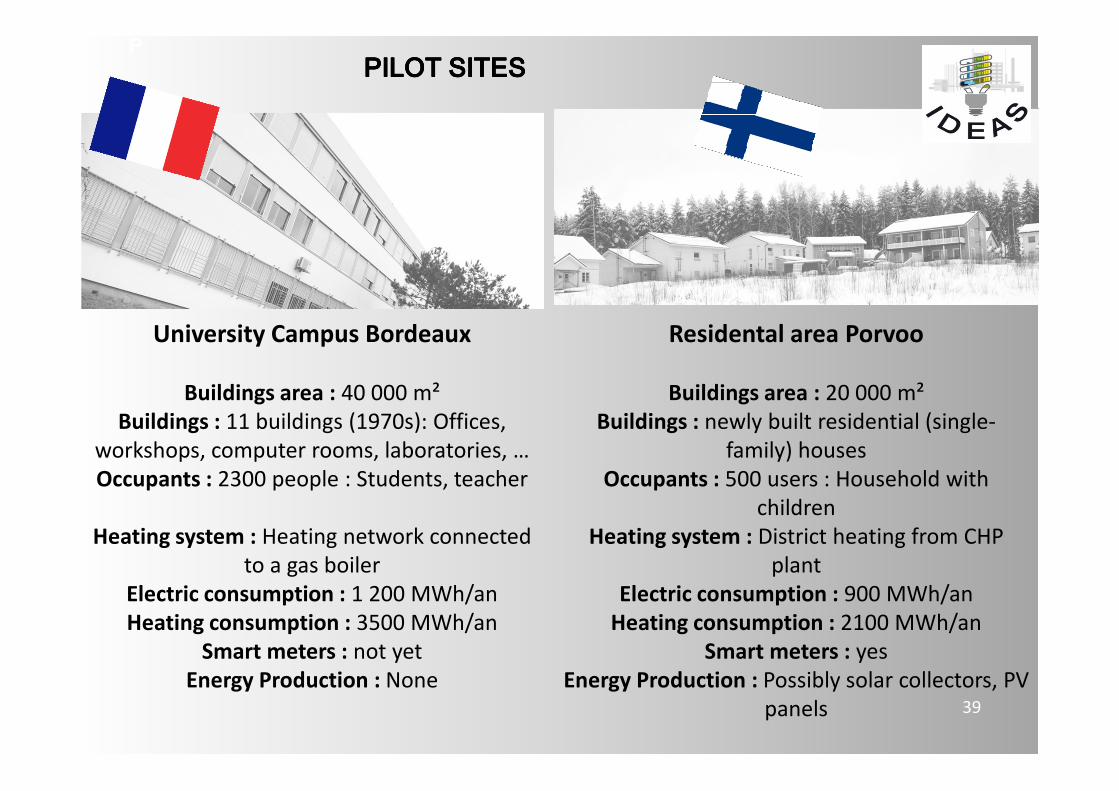
PPPP PILOT SITESPILOT SITESPILOT SITESPILOT SITES
39
Residental area Porvoo
Buildings area : 20 000 m²
Buildings : newly built residential (single-
family) houses
Occupants : 500 users : Household with
children
Heating system : District heating from CHP
plant
Electric consumption : 900 MWh/an
Heating consumption : 2100 MWh/an
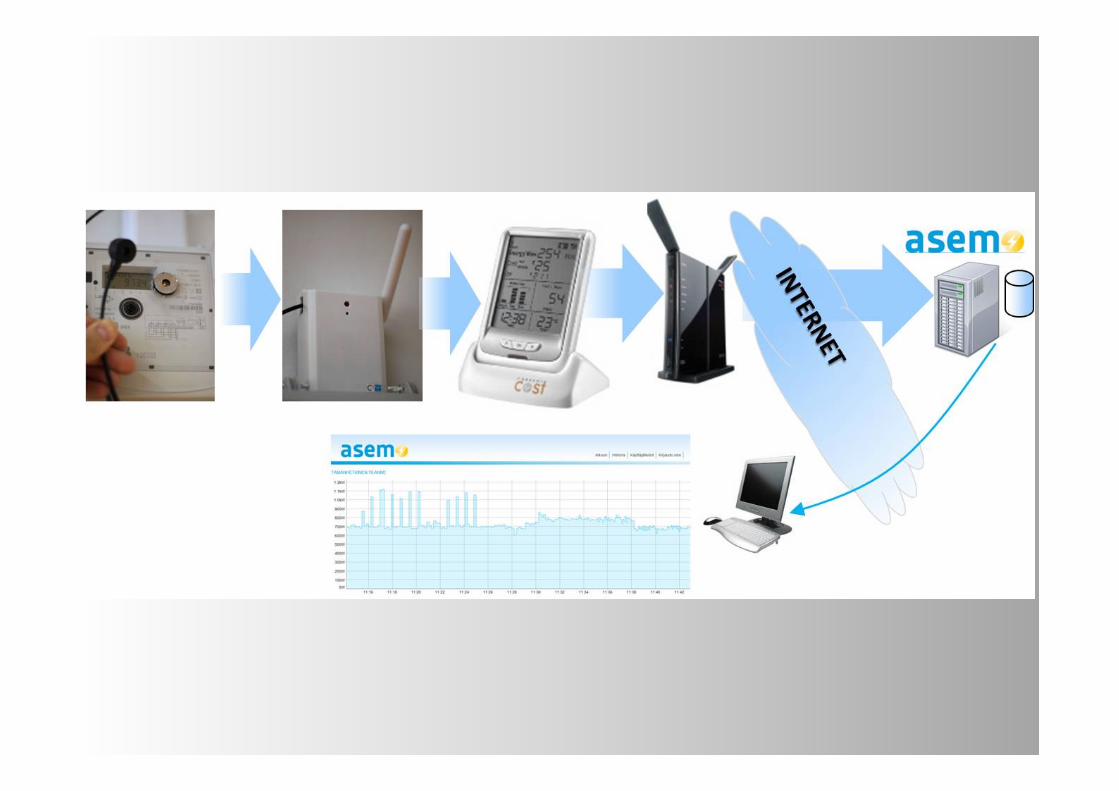
Smart meters : yes
Energy Production : Possibly solar collectors, PV
panels
University Campus Bordeaux
Buildings area : 40 000 m²
Buildings : 11 buildings (1970s): Offices,
workshops, computer rooms, laboratories, …
Occupants : 2300 people : Students, teacher
Heating system : Heating network connected
to a gas boiler
Electric consumption : 1 200 MWh/an
Heating consumption : 3500 MWh/an
Smart meters : not yet
Energy Production : None
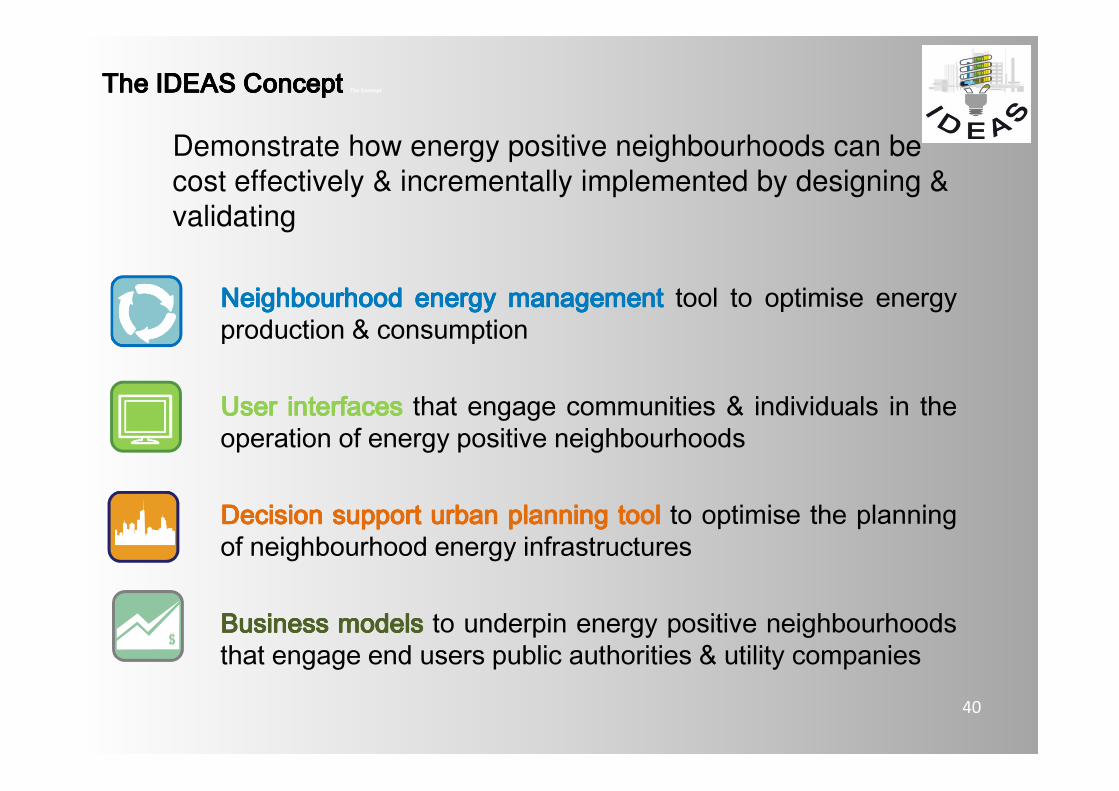
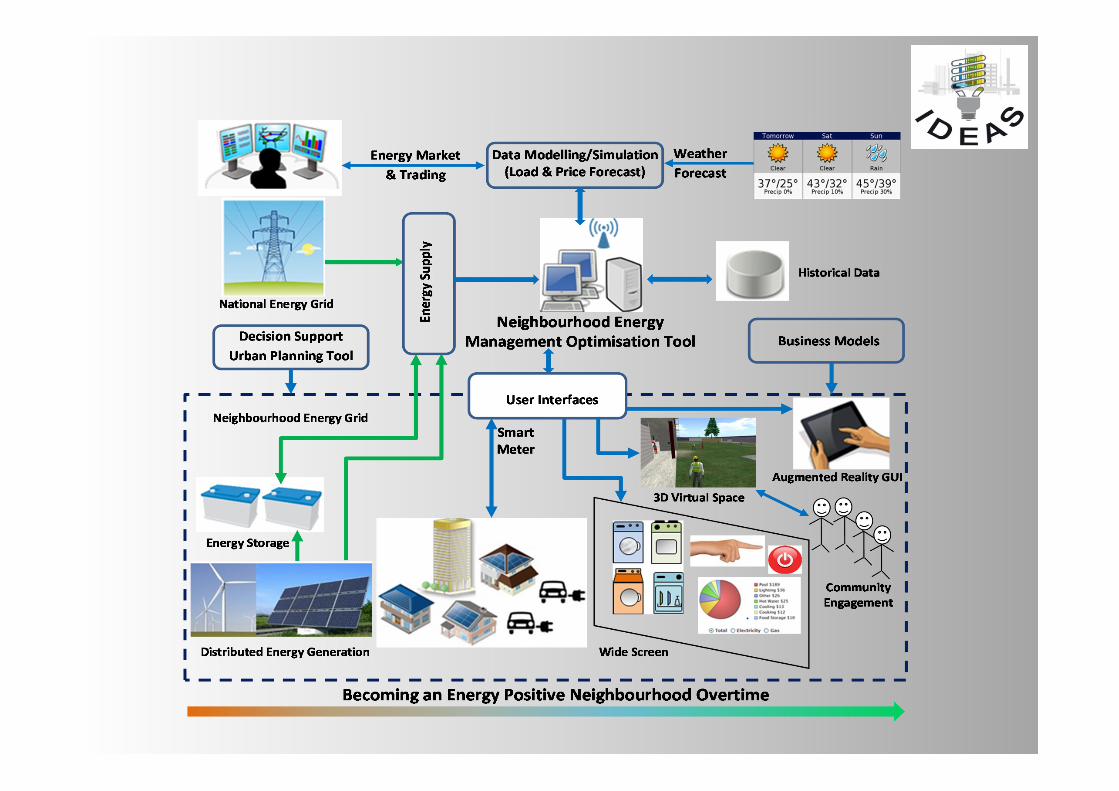
The The The The IDEAS Concept IDEAS Concept IDEAS Concept IDEAS Concept The Concept
Demonstrate how energy positive neighbourhoods can be cost effectively & incrementally implemented by designing & validating
NeighbourhoodNeighbourhoodNeighbourhoodNeighbourhood energyenergyenergyenergy managementmanagementmanagementmanagement tool to optimise energyproduction & consumption
UserUserUserUser interfacesinterfacesinterfacesinterfaces that engage communities & individuals in theoperation of energy positive neighbourhoods
DecisionDecisionDecisionDecision supportsupportsupportsupport urbanurbanurbanurban planningplanningplanningplanning tooltooltooltool to optimise the planningof neighbourhood energy infrastructures
BusinessBusinessBusinessBusiness modelsmodelsmodelsmodels to underpin energy positive neighbourhoodsthat engage end users public authorities & utility companies
40
IDEAS
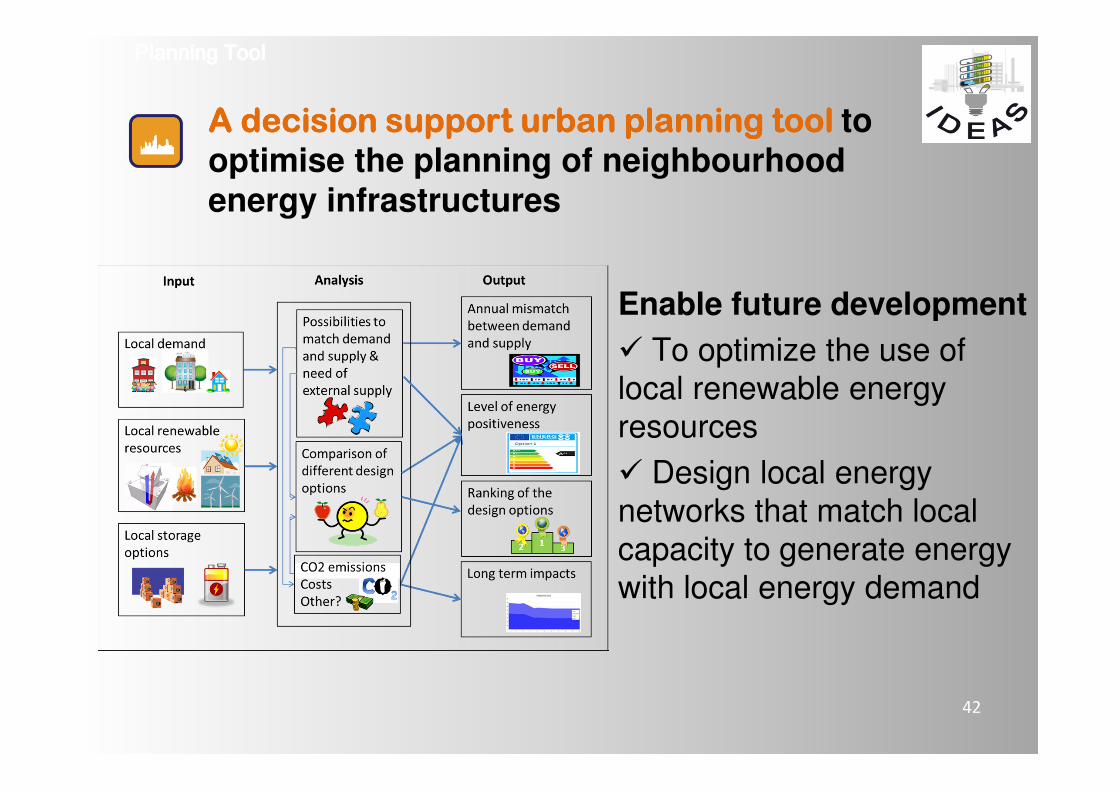
Enable future development
� To optimize the use of local renewable energy resources
� Design local energy networks that match local capacity to generate energy with local energy demand
Planning ToolPlanning ToolPlanning ToolPlanning Tool
A decision support urban planning tool A decision support urban planning tool A decision support urban planning tool A decision support urban planning tool to optimise the planning of neighbourhood energy infrastructures
42

Thank youfor your attention!
www.skaftkarr.fi
www.porvoo.fi
www.sitra.fi
www.porvoonenergia.fi
www.posintra.fi