An energy-efficient readout circuit for resonant sensors ...
8
REVIEW OF SCIENTIFIC INSTRUMENTS 84, 025005 (2013) An energy-efficient readout circuit for resonant sensors based on ring-down measurement Z. Zeng, 1 M. A. P. Pertijs, 2 and D. M. Karabacak 1 1 Holst Centre/imec, High Tech Campus 31, Eindhoven, The Netherlands 2 Electronic Instrumentation Laboratory/DIMES, Delft University of Technology, Delft, The Netherlands (Received 4 January 2013; accepted 1 February 2013; published online 25 February 2013) This paper presents an energy-efficient readout circuit for resonant sensors that operates based on a transient measurement method. The resonant sensor is driven at a frequency close to its resonance frequency by an excitation source that can be intermittently disconnected, causing the sensor to oscillate at its resonance frequency with exponentially decaying amplitude. By counting the zero crossings of this ring-down response, the interface circuit can detect the resonance frequency. In contrast with oscillator-based readout, the presented readout circuit is readily able to detect qual- ity factor (Q) of the resonator from the envelope of the ring-down response, and can be used even in the presence of large parasitic capacitors. A prototype of the readout circuit has been integrated in 0.35 μm CMOS technology, and consumes only 36 μA from a 3.3 V supply during a measure- ment time of 2 ms. The resonance frequency and quality factor of a micro-machined SiN resonator obtained using this prototype are in good agreement with results obtained using impedance analy- sis. Furthermore, a clear transient response is observed to ethanol flow using the presented readout, demonstrating the use of this technique in sensing applications. © 2013 American Institute of Physics. [http://dx.doi.org/10.1063/1.4792396] I. INTRODUCTION Micro/nano-mechanical resonators are considered to be well suited candidates for many sensing applications, especially for integrated systems, owing to their inherent advantages of low-power consumption, integratability, arrayability, and high sensitivity. Among the emerging appli- cations for micro/nano-mechanical resonators are detection of biomolecules and chemical compounds. 1 For instance, polymer-coated high-aspect (length to thickness) ratio clamped-clamped beam resonators with integrated piezoelec- tric transducers have been demonstrated to be highly respon- sive to low concentrations of volatile organic compounds. 2 Clearly, there exists a need to develop an energy-efficient approach to readout micro/nano-mechanical resonators to ful- fill their promise as integrated sensing elements. Ideally, the readout circuit needs to be capable of tracking miniscule changes in modal properties of the resonator while consum- ing minimum energy per measurement. Here, it is important to note that not only does the modal frequency provide a mea- sure of inertial and tensional effects on the resonator, 2 the quality factor of the resonance mode can also yield valuable information, especially to determine damping and energy loss effects, for example, due to either surface binding or pressure changes. 3 Therefore, it is desirable that the readout approach is also capable of detecting the quality factor. Although the sensitivity of resonators is highly favored by scaling into the micro/nanometer range, and piezoelec- tric transduction is considered to be compatible with such scaling, 4, 5 signal levels rapidly diminish as a result of scal- ing, especially relative to several sources of parasitic effects. 6 This is an important challenge still to be addressed from the readout circuit architecture side. Here, we explore the potential of adapting ring-down measurement 7, 8 to readout micro-mechanical resonators, compared with existing alternatives, and present in detail a low-power integrated readout circuit based on ring-down measurement. 9 The paper is organized as follows: Section II presents an electrical model of the resonators and Sec. III discusses the more commonly employed techniques for resonant detec- tion. Section IV details the operating principle of the proposed ring-down-based readout, and its circuit implementation is de- scribed in Sec. V. Section VI shows experimental results ob- tained using a prototype chip, and conclusions are drawn in Sec. VII. II. DEVICE CHARACTERISTICS The micro-machined resonant sensor used here is based on a silicon nitride (SiN) clamped-clamped beam with inte- grated piezoelectric transducer, as shown in Fig. 1(a). The de- vices, fabricated using standard microfabrication techniques, 2 have typical dimensions of 100 μm to 1000 μm in length, 20 μm to 100 μm in width, and 500 nm SiN thickness. The transducer layer is formed by aluminum nitride (AlN) sand- wiched between two metal electrodes, covering a quarter of the suspended region. Within a narrow bandwidth of the modal frequency, the admittance of a resonator can be modeled as a RLC tank (me- chanical resistance R m , capacitance C m , and inductance L m ) in parallel with a parasitic shunt capacitor C p which represents the capacitance of transducer patch, 10 as shown in Fig. 1(b). The real and imaginary components of admittance of the resonator (i.e., its conductance and susceptance), measured 0034-6748/2013/84(2)/025005/8/$30.00 © 2013 American Institute of Physics 84, 025005-1 Downloaded 05 Mar 2013 to 131.180.130.198. Redistribution subject to AIP license or copyright; see http://rsi.aip.org/about/rights_and_permissions
Transcript of An energy-efficient readout circuit for resonant sensors ...

REVIEW OF SCIENTIFIC INSTRUMENTS 84, 025005 (2013)
An energy-efficient readout circuit for resonant sensorsbased on ring-down measurement
Z. Zeng,1 M. A. P. Pertijs,2 and D. M. Karabacak1
1Holst Centre/imec, High Tech Campus 31, Eindhoven, The Netherlands2Electronic Instrumentation Laboratory/DIMES, Delft University of Technology, Delft, The Netherlands
(Received 4 January 2013; accepted 1 February 2013; published online 25 February 2013)
This paper presents an energy-efficient readout circuit for resonant sensors that operates based on atransient measurement method. The resonant sensor is driven at a frequency close to its resonancefrequency by an excitation source that can be intermittently disconnected, causing the sensor tooscillate at its resonance frequency with exponentially decaying amplitude. By counting the zerocrossings of this ring-down response, the interface circuit can detect the resonance frequency. Incontrast with oscillator-based readout, the presented readout circuit is readily able to detect qual-ity factor (Q) of the resonator from the envelope of the ring-down response, and can be used evenin the presence of large parasitic capacitors. A prototype of the readout circuit has been integratedin 0.35 μm CMOS technology, and consumes only 36 μA from a 3.3 V supply during a measure-ment time of 2 ms. The resonance frequency and quality factor of a micro-machined SiN resonatorobtained using this prototype are in good agreement with results obtained using impedance analy-sis. Furthermore, a clear transient response is observed to ethanol flow using the presented readout,demonstrating the use of this technique in sensing applications. © 2013 American Institute of Physics.[http://dx.doi.org/10.1063/1.4792396]
I. INTRODUCTION
Micro/nano-mechanical resonators are considered tobe well suited candidates for many sensing applications,especially for integrated systems, owing to their inherentadvantages of low-power consumption, integratability,arrayability, and high sensitivity. Among the emerging appli-cations for micro/nano-mechanical resonators are detectionof biomolecules and chemical compounds.1 For instance,polymer-coated high-aspect (length to thickness) ratioclamped-clamped beam resonators with integrated piezoelec-tric transducers have been demonstrated to be highly respon-sive to low concentrations of volatile organic compounds.2
Clearly, there exists a need to develop an energy-efficientapproach to readout micro/nano-mechanical resonators to ful-fill their promise as integrated sensing elements. Ideally, thereadout circuit needs to be capable of tracking minisculechanges in modal properties of the resonator while consum-ing minimum energy per measurement. Here, it is importantto note that not only does the modal frequency provide a mea-sure of inertial and tensional effects on the resonator,2 thequality factor of the resonance mode can also yield valuableinformation, especially to determine damping and energy losseffects, for example, due to either surface binding or pressurechanges.3 Therefore, it is desirable that the readout approachis also capable of detecting the quality factor.
Although the sensitivity of resonators is highly favoredby scaling into the micro/nanometer range, and piezoelec-tric transduction is considered to be compatible with suchscaling,4, 5 signal levels rapidly diminish as a result of scal-ing, especially relative to several sources of parasitic effects.6
This is an important challenge still to be addressed from thereadout circuit architecture side.
Here, we explore the potential of adapting ring-downmeasurement7, 8 to readout micro-mechanical resonators,compared with existing alternatives, and present in detaila low-power integrated readout circuit based on ring-downmeasurement.9
The paper is organized as follows: Section II presentsan electrical model of the resonators and Sec. III discussesthe more commonly employed techniques for resonant detec-tion. Section IV details the operating principle of the proposedring-down-based readout, and its circuit implementation is de-scribed in Sec. V. Section VI shows experimental results ob-tained using a prototype chip, and conclusions are drawn inSec. VII.
II. DEVICE CHARACTERISTICS
The micro-machined resonant sensor used here is basedon a silicon nitride (SiN) clamped-clamped beam with inte-grated piezoelectric transducer, as shown in Fig. 1(a). The de-vices, fabricated using standard microfabrication techniques,2
have typical dimensions of 100 μm to 1000 μm in length,20 μm to 100 μm in width, and 500 nm SiN thickness. Thetransducer layer is formed by aluminum nitride (AlN) sand-wiched between two metal electrodes, covering a quarter ofthe suspended region.
Within a narrow bandwidth of the modal frequency, theadmittance of a resonator can be modeled as a RLC tank (me-chanical resistance Rm, capacitance Cm, and inductance Lm) inparallel with a parasitic shunt capacitor Cp which representsthe capacitance of transducer patch,10 as shown in Fig. 1(b).The real and imaginary components of admittance of theresonator (i.e., its conductance and susceptance), measured
0034-6748/2013/84(2)/025005/8/$30.00 © 2013 American Institute of Physics84, 025005-1
Downloaded 05 Mar 2013 to 131.180.130.198. Redistribution subject to AIP license or copyright; see http://rsi.aip.org/about/rights_and_permissions

025005-2 Zeng, Pertijs, and Karabacak Rev. Sci. Instrum. 84, 025005 (2013)
0.995 1.000 1.005 1.010
6
8
10
12
100
102
104
106
108
Con
duct
ance
(μS
)
Normalized Frequency
Su
scep
tanc
e( μ
S)
(a)
(b)
Cp
CmLm Rm
200 µm
FIG. 1. (a) Scanning electron microscope image of resonator beams.(b) Measured (markers) and modeled (lines) electrical conductance and sus-ceptance of the resonator as a function of frequency (normalized), with insetshowing the equivalent circuit used.
using an impedance analyzer (Agilent 4249A), can be wellfitted using this electrical model, as shown in Fig. 1(b). Fromthis fit, the resonance frequency (fres) and the quality factor(Q) of a specific resonance mode can be determined as
fres = 1
2π√
LmCm
, (1)
Q = 1
Rm
√Lm
Cm
. (2)
For the resonators described above, typical values of fres
can range from 0.1 MHz to 2 MHz with quality factor Q inthe range of 50 to 600 in air, depending on dimensions andvibration modes of operation.
III. READOUT APPROACHES
There exist three main established approaches to mea-sure the modal frequency and quality factor of res-onators: impedance analysis, oscillator-based readout, andring-down measurement. Here, we discuss and comparethese approaches within the context of piezoelectric MEMSresonators.
A. Impedance analysis
Impedance analysis is the most commonly used tech-nique for characterization of resonant sensors using bench-topequipment.11, 12 The electrical impedance or admittance of theresonant sensor is measured over a narrow range of frequencyaround the modal frequency, recording both amplitude andphase response. The obtained complex impedance or conduc-tance is fitted with the transfer function to extract the equiva-lent circuit model and also, the resonance frequency and qual-ity factor, as described in Sec. II. While being very flexible inits operating range and providing accurate measurements ofthe spectral behaviors of the resonators, impedance analysistends to be a relatively time-consuming and computationallyintensive procedure, and is thus not readily applicable to low-power sensor applications.
B. Oscillator-based readout
Alternatively, a resonant element can be connected in apositive feedback loop with a sustaining amplifier to form acircuit that oscillates at a frequency determined by the me-chanical resonator. The sustaining amplifier ensures that themotional current from the transducer is stable by providing acontrolled actuation voltage that is matched in phase with thedetected current.11, 13, 14 The resulting oscillation frequencyis, therefore, very close to the resonance frequency, and canthen be measured by frequency counting. The oscillator-basedreadout scheme has been previously demonstrated to be veryaccurate in tracking the resonance frequency of the aforemen-tioned resonators.15, 16 However, several technical limitationsremain for this approach. It requires the sustaining amplifierto have a well-defined phase shift, which comes at the costof power consumption, typically around 1 mW for the res-onators discussed here. Moreover, with large electrical para-sitics, the phase shift of the resonator at resonance becomessmall and poorly defined, particularly in μm scale transduc-ers, making it difficult for the sustaining amplifier to providesufficient phase shift to sustain oscillation without additionalefforts of parasitic capacitance cancellation.15, 16 Furthermore,oscillator-based readout cannot readily provide informationabout the quality factor, which can be used to quantify damp-ing effects on the surface of the resonator or the functional-ization layer in some sensing applications.
C. Ring-down measurement
A ring-down measurement consists of two phases.7, 8
During a first excitation phase, the resonator is driven byan excitation source with a driving frequency within closevicinity of the desired modal frequency. During a secondphase, the source is disconnected, and the subsequent tran-sient response of the resonator is captured. The frequency ofthis ring-down signal ideally equals the resonance frequency.Its amplitude, which decays as the resonator losses energydue to the mechanical damping factor, contains informationabout the quality factor. To extract the resonance frequencyand quality factor, curve-fitting can be applied to the cap-tured ring-down signal.8 A less complex approach is to use
Downloaded 05 Mar 2013 to 131.180.130.198. Redistribution subject to AIP license or copyright; see http://rsi.aip.org/about/rights_and_permissions

025005-3 Zeng, Pertijs, and Karabacak Rev. Sci. Instrum. 84, 025005 (2013)
FIG. 2. Proposed architecture of the interface circuit, consisting of a switched excitation source, a resonant sensor with parasitics, a switched-capacitor current-to-voltage converter (using an operational trans-conductance amplifier), a comparator, and a digital counter.
frequency counting technique: the resonance frequency canbe calculated by counting the zero-crossings of the ring-downsignal,17 while the quality factor can be estimated by count-ing threshold-crossings of the ring-down signal at non-zerothreshold levels.18
Therefore, compared to impedance analysis, the ring-down measurement can extract the resonance frequency andquality factor by using computationally simpler countingtechniques. Compared to oscillator-based readout, the ring-down technique can be designed less sensitive to parasitics,can readily extract quality factor, and also operate with sig-nificantly lower power consumption. However, one disadvan-tage of this technique is that the resonance frequency needsto be approximately known a priori for efficient excitationof the resonator, although this limitation can be overcome bysearching for the frequency with maximum ring-down signalwithin a narrow frequency band, and hence finding the reso-nance mode.
Some approaches based on the ring-down measurementhave been previously reported in literature, using printed cir-cuit board (PCB) level implementations, and mainly focus-ing on quartz crystal resonators.17, 18 However, its applicationto micro-machined resonators, and its potential advantages interms of energy-efficient readout of resonators are largely un-explored. Furthermore, an integrated implementation of thetechnique has not been reported in literature, to the best of theauthors’ knowledge.
IV. OPERATING PRINCIPLE OF RING-DOWNDETECTION
The proposed readout architecture, shown in Fig. 2,consists of a front-end circuit (containing a switched exci-tation source, a resonant sensor, and a switched-capacitorcurrent-to-voltage converter), a comparator, and a digitalcounter. During a first phase φ1, the resonator is driven bythe excitation source. During a second phase φ2, the current-to-voltage converter records the resultant ring-down currentto characterize the series resonance.
A. Front-end operation
During the excitation phase φ1, the driving source pro-vides a voltage Vdrive (Fig. 3) at a frequency close to the reso-
nance frequency of the resonant sensor, thus storing energy inthe resonator. The rest of the circuit can be powered down inphase φ1 for reducing the operation power. At the end of thisphase, the excitation source is switched off. During the sub-sequent phase φ2, the energy stored in the resonator starts todissipate, generating a decaying sinusoidal ring-down current.If the driving frequency is perfectly matched to the resonancefrequency, the initial amplitude of this current equals Vext/Rm
(where Vext is the amplitude of the driving voltage). A loweramplitude is obtained if the driving frequency deviates fromthe resonance frequency. To convert this current into a volt-age, the resonator is connected to an integrator that acts asa current-to-voltage converter. The high values of Rm for theresonators we target is the main reason to choose an ampli-fier with a capacitive feedback instead of a resistive feedback,since the feedback resistor would have to be of the same orderof magnitude as Rm, and would therefore consume substantialdie area. A capacitor with an equivalent impedance consumesmuch less die area.
φ1
φ2
φ1d
N ringdown cycles
clk
M reference clock cycles
Vdrive
Vint
Vcomp @ Vthld1 N1 counts
Vthld2Vthld1
Vcomp @ Vthld2 N2 counts
Vcomp @ Vthld0
Vthld0
FIG. 3. Timing diagram of the readout, showing the control signals, the drivevoltage Vdrive, the output of the integrator Vint, the reference clock signal, andthe output of the comparator Vcomp for resonance frequency measurement andquality factor measurement.
Downloaded 05 Mar 2013 to 131.180.130.198. Redistribution subject to AIP license or copyright; see http://rsi.aip.org/about/rights_and_permissions

025005-4 Zeng, Pertijs, and Karabacak Rev. Sci. Instrum. 84, 025005 (2013)
To prevent charge stored on the parasitic shunt capaci-tor Cp from being integrated, the integrator is briefly kept inunity-gain configuration at the beginning of phase φ2 by a de-layed falling edge of phase φ1d (Fig. 3). As long as this delayis sufficiently long, the charge stored on Cp is fully dissipatedwithout causing an offset at the output of the integrator. Thiscomes at the acceptable cost of loss in the initial part of thering-down current. As a result, the operation of the circuit isindependent of the parasitics, provided the operational trans-conductance amplifier (OTA) of the integrator has sufficienttrans-conductance to ensure that the majority of the ring-downcurrent flows into the integration capacitor, rather than intothe parasitics. The integration of the ring-down current resultsa decaying sinusoidal ring-down voltage at the output of theintegrator.
B. Resonance frequency measurement
To determine the resonance frequency fres, the zero-crossings of the ring-down voltage Vint are detected by thecomparator (Fig. 2) while a zero-threshold level Vthld0 is ap-plied. The digital counter then counts the number of cyclesM of a reference clock with a clock frequency fclk during ameasurement time window consisting of a pre-defined num-ber N of ring-down cycles, as illustrated in Fig. 3. From this,the resonance frequency can be readily calculated as
fres = fclk · N
M. (3)
However, Eq. (3) is only accurate when the pre-definedmeasurement time window contains an integer number ofreference-clock cycles. Otherwise, it contains between M and(M + 1) cycles, corresponding to a quantization error of atmost one reference-clock cycle. This error can be reduced byincreasing fclk.
This counting approach is preferred over the alterna-tive of counting the number of ring-down cycles during apre-defined number of reference-clock cycles, which wouldlead to much larger quantization errors17 due to the fact thatthe detectable number of ring-down cycles is limited by therelatively modest quality factor of our resonators to a fewhundred.
To allow the comparator to detect as many zero-crossingsas possible, it is important to ensure that the threshold of thecomparator accurately matches with the steady-state valuethat the output of the integrator reaches at the end of thering-down signal. However, several offset sources make thissteady-state value hard to predict precisely. One offset sourceis related to the timing of the moment at which the current-to-voltage converter starts to integrate. Only when the unity-gainswitch (phase φ1d) of the integrator opens at the peak of thering-down current, the output of the integrator begins to ringdown at the steady state value, as a 90◦ phase shift is added bythe integration capacitance Cint. However, this cannot be guar-anteed, as the timing of the peak of the ring-down current isnot accurately known, because the exact resonance frequencyis unknown. Moreover, an unknown phase shift is introduceddue to the fact that the ring-down current divides between theshunt capacitor Cp and the finite input impedance of the in-
1d
φAZCint
Vthld
CAZ
OTAVint
Vcomp
Vint,AZ
φ1
φ2
φ1d
φAZ
Vintint
Vcomp
Vint,AZ
offset stored on CAZVthld
(a)
(b)
FIG. 4. (a) Circuit diagram of comparator auto-zeroing scheme, includingan auto-zeroing capacitor CAZ and a feedback switch controlled by phaseφAZ. (b) Associated timing diagram, demonstrating the control signals ofassociated switches, the output signal of the integrator before auto-zeroing(Vint) and after auto-zeroing (Vint,AZ), and the output signal of the comparatorVcomp.
tegrator, which will also cause an offset at the output of theintegrator.
To solve this offset issue, an auto-zeroing scheme is em-ployed, as illustrated in Fig. 4. The resonator is excited twice.After the first excitation, the resonator is allowed to ring downcompletely. The comparator is then configured in unity-gain(phase φAZ), causing the difference between the steady-stateoutput of the integrator and the input offset-voltage of thecomparator to be stored on an auto-zeroing capacitor (CAZ).After the second excitation, the front-end circuit is operated asdescribed before, and the comparator is operated as a regularcomparator. Since CAZ still stores the same voltage difference,the level-shifted Vint,AZ (Fig. 4) now has a steady-state valueequal to the threshold of the comparator. Therefore, the com-parator now precisely detects the zero-crossings, providing anaccurate calculation of the resonance frequency.
C. Quality factor measurement
For quality factor measurements, two non-zero thresholdlevels Vthld1 and Vthld2 are applied.18 By counting the corre-sponding number of pulses, N1 and N2, that appear at the out-put of the comparator, an estimation of the exponentially de-caying envelope can be made (Fig. 3). The quality factor canthen be calculated as
Q = π · N1 − N2
ln(Vthld2/Vthld1). (4)
Downloaded 05 Mar 2013 to 131.180.130.198. Redistribution subject to AIP license or copyright; see http://rsi.aip.org/about/rights_and_permissions

025005-5 Zeng, Pertijs, and Karabacak Rev. Sci. Instrum. 84, 025005 (2013)
V. EXPERIMENTAL PROTOTYPE
The prototype consists of a custom integrated circuit (IC)and a field-programmable gate array (FPGA). The custom ICcontains the integrator, the auto-zeroed comparator with theassociated switches and bias circuitry, as well as a voltagebuffer that can be used to monitor the output of the integra-tor during measurements. The counter and digital circuits togenerate the control signals for the switches have been im-plemented in the FPGA for flexibility, but could easily be co-integrated on the IC.
A. Integrator design
The integrator consists of an OTA with a programmablefeedback capacitor. The OTA is designed as simple as pos-sible, using a single common-source NMOS transistor M1
(Fig. 5(a)). To allow a maximum output swing, a helper am-plifier is used during phase φ1d to set the output voltage ofthe integrator to half of its supply (Vmid in Fig. 5). Instead ofshorting the integration capacitor, this approach pre-chargesit to an appropriate voltage to obtain a mid-supply reset levelat the output. This helper amplifier is disconnected from theintegrator and switched off during phase φ2 to save energy.Its implementation, shown in Fig. 5(b), consists of a pair ofPMOS transistors, one of which effectively acts as a folded-cascode transistor in the feedback path of M1. The feedbackcapacitance consists of three switchable capacitors in parallel,
so that it can be digitally programmed between 0.15 pF and1.05 pF to accommodate resonators with different mechanicalresistances Rm.
The finite off-resistance of the switches connected to thevirtual ground node of the integrator would give rise to a leak-age current that is integrated and causes a droop on the outputof the integrator, thus reducing the detection accuracy. To pre-vent this, nodes in the circuit that are potential sources of leak-age to the virtual ground are bootstrapped to a replica Vr ofthe virtual-ground voltage, which is generated using a diode-connected NMOS transistor M2 operating at the same over-drive voltage as the common-source NMOS transistor M1 ofthe OTA, as illustrated in Fig. 5(c).
B. Comparator design
The comparator consists of a cascoded telescopic pre-amp and a common-source gain stage, as shown in Fig. 6.During auto-zeroing, the pre-amp is operated in unity-gain tostore its input offset, in addition to the output offset voltage ofthe integrator, on the auto-zeroing capacitor CAZ.
C. FPGA and PCB implementation
For flexibility, the control signals, as well as the imple-mentation of the frequency counter, are generated off-chip us-ing a FPGA board. A reference clock of 50 MHz is applied on
Cp2
φ1
φ1φ2
φ2
φ1d
Cp1 Cp2
Cp
CmLm Rm
Vdrive
resonant sensorwith parasitics
VintCint3
Cint2
Cint1
Vmidφ1d
IB1
M1
Vmid
Vmid
φ1
φ2
φ1d
M1φ1
φ2
φ2
Vr
VrIB1
M2
IB2
Vr
(a)
(b) (c)
FIG. 5. (a) Circuit implementation of the integrator which consists of: a common-source NMOS transistor M1 as amplifier, a helper amplifier to define outputlevel of the integrator, and a switchable feedback capacitance. (b) Implementation of the helper amplifier. (c) Low-leakage implementation of the switchesconnected to the gate of M1 by using a replica Vr of the gate-source voltage of M1, generated using an extra NMOS transistor M2.
Downloaded 05 Mar 2013 to 131.180.130.198. Redistribution subject to AIP license or copyright; see http://rsi.aip.org/about/rights_and_permissions
025005-6 Zeng, Pertijs, and Karabacak Rev. Sci. Instrum. 84, 025005 (2013)
φAZ
Vthld
Vcomp
Vthld
VB1
VB2
Vint,AZ
Vint,AZ
φAZ
Vcomp
φAZ
VDD
φAZ
FIG. 6. Circuit implementation of the auto-zeroed comparator, which consists of a cascoded telescopic pre-amp and a common-course second stage.
board to accomplish the frequency counting. This referenceclock is also used to generate all the control signals for theon-chip switches. A total measurement time of 1 ms is usedfor excitation and counting.
The FPGA also provides a square wave excitation signalwhich is filtered on a test PCB and applied to the resonatorvia switches integrated on chip. Moreover, adjustable thresh-old levels for the comparator are also produced on the PCBusing resistive dividers which can be selected by using a pro-grammable multiplexer.
VI. EXPERIMENTAL RESULTS
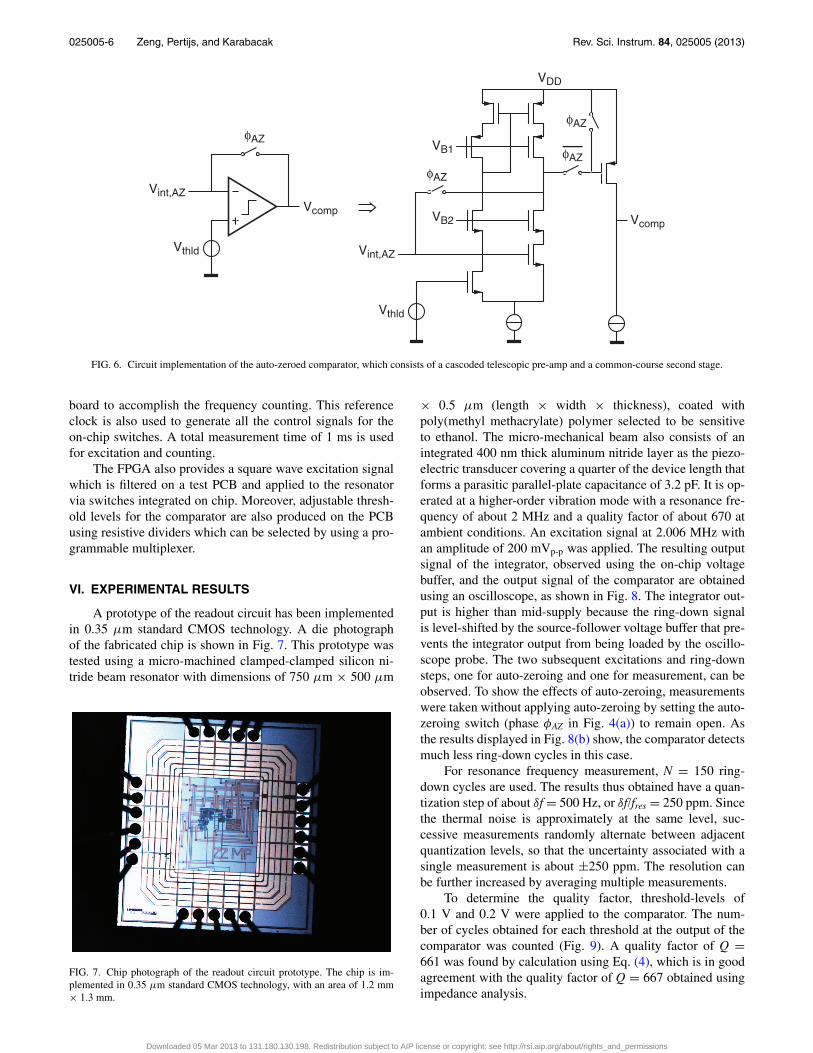
A prototype of the readout circuit has been implementedin 0.35 μm standard CMOS technology. A die photographof the fabricated chip is shown in Fig. 7. This prototype wastested using a micro-machined clamped-clamped silicon ni-tride beam resonator with dimensions of 750 μm × 500 μm
FIG. 7. Chip photograph of the readout circuit prototype. The chip is im-plemented in 0.35 μm standard CMOS technology, with an area of 1.2 mm× 1.3 mm.
× 0.5 μm (length × width × thickness), coated withpoly(methyl methacrylate) polymer selected to be sensitiveto ethanol. The micro-mechanical beam also consists of anintegrated 400 nm thick aluminum nitride layer as the piezo-electric transducer covering a quarter of the device length thatforms a parasitic parallel-plate capacitance of 3.2 pF. It is op-erated at a higher-order vibration mode with a resonance fre-quency of about 2 MHz and a quality factor of about 670 atambient conditions. An excitation signal at 2.006 MHz withan amplitude of 200 mVp-p was applied. The resulting outputsignal of the integrator, observed using the on-chip voltagebuffer, and the output signal of the comparator are obtainedusing an oscilloscope, as shown in Fig. 8. The integrator out-put is higher than mid-supply because the ring-down signalis level-shifted by the source-follower voltage buffer that pre-vents the integrator output from being loaded by the oscillo-scope probe. The two subsequent excitations and ring-downsteps, one for auto-zeroing and one for measurement, can beobserved. To show the effects of auto-zeroing, measurementswere taken without applying auto-zeroing by setting the auto-zeroing switch (phase φAZ in Fig. 4(a)) to remain open. Asthe results displayed in Fig. 8(b) show, the comparator detectsmuch less ring-down cycles in this case.
For resonance frequency measurement, N = 150 ring-down cycles are used. The results thus obtained have a quan-tization step of about δf = 500 Hz, or δf/fres = 250 ppm. Sincethe thermal noise is approximately at the same level, suc-cessive measurements randomly alternate between adjacentquantization levels, so that the uncertainty associated with asingle measurement is about ±250 ppm. The resolution canbe further increased by averaging multiple measurements.
To determine the quality factor, threshold-levels of0.1 V and 0.2 V were applied to the comparator. The num-ber of cycles obtained for each threshold at the output of thecomparator was counted (Fig. 9). A quality factor of Q =661 was found by calculation using Eq. (4), which is in goodagreement with the quality factor of Q = 667 obtained usingimpedance analysis.
Downloaded 05 Mar 2013 to 131.180.130.198. Redistribution subject to AIP license or copyright; see http://rsi.aip.org/about/rights_and_permissions

025005-7 Zeng, Pertijs, and Karabacak Rev. Sci. Instrum. 84, 025005 (2013)
0 0.2 0.4 0.6 0.8 1 1.2 1.4 1.6 1.80
1
2
3
Vo
ltag
e (V
)
1.205 1.206 1.206 1.206 1.207 1.208 1.208 1.208 1.2090
1
2
3
Time (ms)
0 0.2 0.4 0.6 0.8 1 1.2 1.4 1.6 1.80
1
2
3
Vo
ltag
e (V
)
1.217 1.218 1.218 1.218 1.219 1.22 1.22 1.22 1.2210
1
2
3
(a)
(b)
FIG. 8. Transient measurements obtained using an oscilloscope: bufferedintegrator output (decaying sinusoidal wave); comparator output (squarewave); and zoom-in of the signals (a) with auto-zeroing and (b) withoutauto-zeroing.
Figure 10 shows the measured resonance frequency shiftand relative change of the resonance frequency as a functionof the dc bias voltage applied across the resonator. This fre-quency shift is due to a stress formation within the length re-stricted beam.2 The bias dependency of 0.035%/V found us-ing the ring-down circuit agrees well with the results obtainedusing an impedance analysis (0.03%/V).
Figure 11 shows the transient response of the resonatorin a dry nitrogen flow during exposure to ethanol at 1000 ppm
0 0.2 0.4 0.6 0.8 1 1.2 1.4 1.6 1.80
1
2
3
Vo
ltag
e (V
)
Time (ms)
0 0.2 0.4 0.6 0.8 1 1.2 1.4 1.6 1.80
1
2
3
Vo
ltag
e (V
)
(a)
(b)
FIG. 9. Quality factor measurement results (decaying sinusoidal wave atthe buffered output of the integrator and square wave at the output ofthe comparator), when a threshold-level of (a) 0.1 V and (b) 0.2 V wasapplied.
−1 −0.5 0 0.5 1 1.5 2−0.04
−0.02
0
0.02
0.04
0.06
0.08
DC Bias (V)
Rel
ativ
e C
han
ge
(%)
Fre
qu
ency
Sh
ift
(Hz)
−400
−800
1600
400
0
1200
800
FIG. 10. Measured resonance frequency shift and its relative change, withrespect to the resonance frequency with 0 V across the resonator, as a functionof dc bias voltage using the presented interface (dashed line with diamondmarker) and impedance analysis (solid line with circle marker).
concentration. For each data point of this transient response,an average resonance frequency of 400 measurements wastaken to reduce the measurement uncertainty, by ∼20 times,to ±12.5 ppm. This leads to a measurement time of about1 s. The modal frequency measured as 2 MHz shifted to2.12 MHz in dry nitrogen flows as a result of known sensitiv-ity of the coating to humidity. When the resonator is exposedto the ethanol vapor, the modal frequency is decreasing due tothe absorption of the volatile compound in the polymer coat-ing, as previously described in detail.2 The ethanol flow wasapplied twice, and the resonator was exposed to dry air aftereach exposure to demonstrate the recovery.
The circuit implemented on chip consumes 36 μA froma 3.3 V supply. This corresponds to about 120 nJ per mea-surement step of 1 ms. This can be further reduced by opti-mizing the circuit and reducing the measurement time. Eventhough this number does not include the excitation and count-ing circuitry, the energy consumed by these components is notexpected to be dominant in the final system.
0 10 20 30 40 50 602.113
2.115
2.117
2.119
2.121
2.123
2.125
Time (min)
Res
on
ance
fre
qu
ency
(M
Hz)
FIG. 11. Transient response of the resonator to ethanol exposure using thepresented readout circuit. The modal frequency decreases during ethanol ex-posure due to the absorption of the volatile compound in the polymer coatingof the resonator.
Downloaded 05 Mar 2013 to 131.180.130.198. Redistribution subject to AIP license or copyright; see http://rsi.aip.org/about/rights_and_permissions

025005-8 Zeng, Pertijs, and Karabacak Rev. Sci. Instrum. 84, 025005 (2013)
VII. CONCLUSIONS
A readout circuit for micro-mechanical resonant sensorshas been presented here. In contrast with oscillator-based in-terfaces, the presented readout circuit can handle resonatorswith a large parasitic capacitance, and can readily be used toextract both the resonance frequency and quality factor us-ing counting techniques while consuming significantly lessenergy. A low-energy integrated prototype of the readout cir-cuit was realized in 0.35 μm CMOS technology. The readoutcircuit was demonstrated to be able to detect the frequencyof a 2 MHz resonator with 500 Hz resolution for a singlering-down measurement, within a 1 ms long measurementat an energy consumption of 120 nJ. There clearly exists atrade-off between improving the accuracy of the readout cir-cuit by averaging multiple measurements and reducing energyconsumption.
Furthermore, quality factor and dc sensitivity measure-ments obtained using this chip, in combination with a MEMSresonator, are in good agreement with results from bench-topelectronics. Finally, the chemical detection potential of thesystem has been demonstrated with a sensor element coatedwith a polymer functionalization layer, during an exposure toethanol. The sensing system can detect low-ppm concentra-tions of vapors. The low energy consumption of the readoutcircuit makes ring-down-based interfacing a promising ap-proach for readout of resonant sensors in energy-constrainedapplications.
ACKNOWLEDGMENTS
The authors thank Ms. Yvonne van Andel for fabricationof resonators, Mr. Zu-yao Chang for his help in PCB design
and measurements, and Ling Sieben-Xu for assistance in de-vice characterization setup.
1P. S. Waggoner and H. G. Craighead, Lab Chip 7, 1238–1255 (2007).2D. M. Karabacak, S. H. Brongersma, and M. Crego-Calama, Lab Chip 10,1976–1982 (2010).
3D. M. Karabacak, V. Yakhot, and K. L. Ekinci, Phys. Rev. Lett. 98, 254505(2007)
4S. C. Masmanidis, R. B. Karabalin, I. De Vlaminck, G. Borghs, M. R. Free-man, and M. L. Roukes, Science 317, 780–783 (2007).
5R. B. Karabalin, M. H. Matheny, X. L. Feng, E. Defaÿ, G. Le Rhun, C.Marcoux, S. Hentz, P. Andreucci, and M. L. Roukes, Appl. Phys. Lett. 95,103111 (2009).
6K. L. Ekinci, Small 1, 786–797 (2005).7M. Rodahl, F. Höök, A. Krozer, P. Brzezinski, and B. Kasemo, Rev. Sci.Instrum. 66, 3924–3930 (1995).
8M. Rodahl and B. Kasemo, Rev. Sci. Instrum. 67, 3238–3241 (1996).9M. A. P. Pertijs, Z. Zeng, D. M. Karabacak, M. Crego-Calama, and S. H.Brongersma, “An energy-efficient interface for resonant sensors based onring-down measurement,” 2012 IEEE International Symposium on Circuitsand Systems (ISCAS), 20–23 May 2012, pp. 990–993.
10H. A. C. Tilmans, J. Micromech. Microeng. 7, 285–309 (1997).11K. E. Wojciechowski, Ph.D. Dissertation, University of California, Berke-
ley, 2005.12A. O. Niedermayer, E. K. Reichel, and B. Jakoby, Sens. Actuators, A 156,
245–250 (2009).13J. Verd, A. Uranga, G. Abadal, J. L. Teva, F. Torres, J. L. Lopez, E. Perez-
Murano, J. Esteve, and N. Barniol, IEEE Electron Device Lett. 29, 146–148(2008).
14C. Hagleitner, D. Lange, A. Hierlemann, O. Brand, and H. Baltes, IEEE J.Solid-State Circuits 37, 1867–1878 (2002).
15V. Petrescu, J. Pettine, D. M. Karabacak, M. Vandecasteele, M. C. Calama,and C. Van Hoof, “Power-efficient readout circuit for miniaturized elec-tronic nose,” 2012 IEEE International Solid-State Circuits Conference Di-gest of Technical Papers (ISSCC), 19–23 February 2012, pp. 318–320.
16J. Pettine, M. Patrascu, D. M. Karabacak, M. Vandecasteele, V. Petrescu,S. H. Brongersma, M. Crego-Calama, and C. Van Hoof, Sens. Actuators, A189, 496–503 (2013).
17K. Zeng, K. G. Ong, C. Mungle, and C. A. Grimes, Rev. Sci. Instrum. 73,4375–4380 (2002).
18K. Zeng and C. A. Grimes, Rev. Sci. Instrum. 75, 5257–5261 (2004).
Downloaded 05 Mar 2013 to 131.180.130.198. Redistribution subject to AIP license or copyright; see http://rsi.aip.org/about/rights_and_permissions