An empirical study of green GSCM practices amongst …modir3-3.ir/article-english/article300.pdf ·...
24
An empirical study of green supply chain management practices amongst UK manufacturers Diane Holt Queen’s University Management School, Queen’s University Belfast, Belfast, UK, and Abby Ghobadian Henley Business School, Henley-on-Thames, UK Abstract Purpose – The purpose of this paper is to examine the extent and nature of greening the supply chain (SC) in the UK manufacturing sector; and the factors that influence the breadth and depth of this activity. Design/methodology/approach – Based on the findings from a sample of manufacturing organisations drawn from the membership of The Chartered Institute for Purchasing and Supply. Data are collected using a questionnaire, piloted and pre-tested before distribution with responses from 60 manufacturing companies. Findings – On average manufacturers perceive the greatest pressure to improve environmental performance through legislation and internal drivers (IDs). The least influential pressures are related to societal drivers and SC pressures from individual customers. Green supply chain management (GSCM) practices amongst this “average” group of UK manufacturing organisations are focusing on internal, higher risk, descriptive activities, rather than proactive, external engagement processes. Environmental attitude (EA) is a key predictor of GSCM activity and those organisations that have a progressive attitude are also operationally very active. EA shows some relationship to legislative drivers but other factors are also influential. Operational activity may also be moderated by organisational contingencies such as risk, size, and nationality. Research limitations/implications – The main limitation to this paper is the relatively small manufacturing sample. Practical implications – This paper presents a series of constructs that identify GSCM operational activities companies to benchmark themselves against. It suggests which factors are driving these operational changes and how industry contingencies may be influential. Originality/value – This paper explores what is driving environmental behaviour amongst an “average” sample of manufacturers, what specific management practices take place and the relationships between them. Keywords Manufacturing industries, Environmental management, Supply chain management, Sustainable development, United Kingdom Paper type Research paper The current issue and full text archive of this journal is available at www.emeraldinsight.com/1741-038X.htm The authors gratefully acknowledge the assistance of The CIPS in the collection of the data reported in this paper and all the companies that participated. All views expressed in this paper reflect those of the authors only. GSCM practices amongst UK manufacturers 933 Received August 2008 Revised December 2008 Accepted February 2009 Journal of Manufacturing Technology Management Vol. 20 No. 7, 2009 pp. 933-956 q Emerald Group Publishing Limited 1741-038X DOI 10.1108/17410380910984212
Transcript of An empirical study of green GSCM practices amongst …modir3-3.ir/article-english/article300.pdf ·...
An empirical study of greensupply chain managementpractices amongst UK
manufacturersDiane Holt
Queen’s University Management School, Queen’s University Belfast,Belfast, UK, and
Abby GhobadianHenley Business School, Henley-on-Thames, UK
Abstract
Purpose – The purpose of this paper is to examine the extent and nature of greening the supply chain(SC) in the UK manufacturing sector; and the factors that influence the breadth and depth of this activity.
Design/methodology/approach – Based on the findings from a sample of manufacturingorganisations drawn from the membership of The Chartered Institute for Purchasing and Supply.Data are collected using a questionnaire, piloted and pre-tested before distribution with responses from60 manufacturing companies.
Findings – On average manufacturers perceive the greatest pressure to improve environmentalperformance through legislation and internal drivers (IDs). The least influential pressures are related tosocietal drivers and SC pressures from individual customers. Green supply chain management (GSCM)practices amongst this “average” group of UK manufacturing organisations are focusing on internal,higher risk, descriptive activities, rather than proactive, external engagement processes. Environmentalattitude (EA) is a key predictor of GSCM activity and those organisations that have a progressiveattitude are also operationally very active. EA shows some relationship to legislative drivers but otherfactors are also influential. Operational activity may also be moderated by organisational contingenciessuch as risk, size, and nationality.
Research limitations/implications – The main limitation to this paper is the relatively smallmanufacturing sample.
Practical implications – This paper presents a series of constructs that identify GSCM operationalactivities companies to benchmark themselves against. It suggests which factors are driving theseoperational changes and how industry contingencies may be influential.
Originality/value – This paper explores what is driving environmental behaviour amongst an“average” sample of manufacturers, what specific management practices take place and therelationships between them.
Keywords Manufacturing industries, Environmental management, Supply chain management,Sustainable development, United Kingdom
Paper type Research paper
The current issue and full text archive of this journal is available at
www.emeraldinsight.com/1741-038X.htm
The authors gratefully acknowledge the assistance of The CIPS in the collection of the datareported in this paper and all the companies that participated. All views expressed in this paperreflect those of the authors only.
GSCM practicesamongst UK
manufacturers
933
Received August 2008Revised December 2008
Accepted February 2009
Journal of Manufacturing TechnologyManagement
Vol. 20 No. 7, 2009pp. 933-956
q Emerald Group Publishing Limited1741-038X
DOI 10.1108/17410380910984212

IntroductionEnvironmental sustainability is one of the defining issues of this, and future decades.The following quote from Gordon Brown clearly demonstrates this point in his speechdelivered to the United Nations Ambassadors on April 20, 2006 (Brown, 2006):
Environmental sustainability is not an option – it is a necessity. For economies to flourish, forglobal poverty to be banished, for the well-being of the world’s people to be enhanced – not justin this generation but in succeeding generations – we have a compelling and ever more urgentduty of stewardship to take care of the natural environment and resources on which oureconomic activity and social fabric depends.
Corporate environmental management has typically focused on managing internalenvironmental practices. Attention is increasingly shifting towards the management ofan organisation’s impacts outside the boundaries of the firm, into the management ofupstream and downstream activities. Globalisation fuelled by technological advancesis reshaping the competitive landscape. Individual businesses no longer compete assolely autonomous entities, but rather as supply chains (SCs), therefore, the ultimatesuccess of a single business will depend on management’s ability to integrate theorganisation’s intricate network of business relationships (Lambert et al., 1998; Oliverand Webber, 1982).
This paper examines how organisations are responding to calls for improvements inenvironmental sustainability through the management of their SCs, focusing on asample of UK manufacturers. The paper considers two key research questions:
RQ1. The extent and nature of greening of the SC in the manufacturing sector.
RQ2. Factors that influence the breadth and depth of greening of themanufacturing SC.
Supply chain management (SCM) displays typical characteristics of a subject at earlystages of evolution including definitional diversity and lack of conceptual clarity(Gibson et al., 2005). A number of researchers have attempted to produce a unifieddefinition by systematically examining collection of proposed definitions (Bechtel andJayaram, 1997; Mentzer et al., 2001). Despite these efforts there is no clear consensus asto the definition of SCM. For the purpose of this study we adopted the followingdefinition presented by Lambert et al. (1998, p. 1) defining SCM as “the integration ofkey business processes from end-user through original suppliers that provideproducts, services, and information that add value for customers and otherstakeholders.” This definition has similarities with the definition developed byGibson et al. (2005, p. 22) through a survey of SC practitioners. They defined SCM as“encompassing the planning and management of all activities involved in sourcing andprocurement, conversion, demand creation and fulfilment, and all logistic managementactivities” and they went on to suggest that SCM also includes:
[. . .] coordination and collaboration with channel partners, which can be suppliers,intermediaries, third-party service providers, and customers. In essence, SCM integratessupply and demand management within and across companies.
The similarities between the two definitions and the method used for theirdevelopment are a measure of robustness and offers strong justification for adoption ofthe definition.
JMTM20,7
934

The challenge is to operationalise the definition of SCM. To this end Lambert et al.(1998) identified three closely interrelated elements to support the definition theyproposed and adapted for the purposes of this paper. The three elements are:
(1) SC business processes. These are activities that produce a specific output ofvalue to stakeholders.
(2) SCM components. Managerial variables by which business processes areintegrated and managed across the SC.
(3) SC structure. This is the network of members of SC.
The SCM concept is underpinned by system theory (Chandra and Tumanyan, 2005),with our chosen definition implicitly predicted on the system theory. The general systemcomponents include: input, output, process, mechanism, agent, function, andenvironment (Figure 1). Systems theory is also a key aspect of the philosophical andconceptual roots of environmental management (after O’Riordan, 1981). Much of thesustainability agenda is driven by the recognition that impacts in one part of a systemwith have repercussions elsewhere.
Table I examines each of these components in a “green” SC. The elements of thesystem and the three elements of SCM were combined and used to guide identification ofrange of managerial practices that might occur in a SC. In addition, the combination ofsystem theory and elements of SCM highlighted the potential influence of internal andexternal factors upon SCM.
SCM is a relatively new concept and green supply chain management (GSCM) is anewer concept. Little structured literature review exists on GSCM, only recently havereview-orientated papers emerged (Carter and Rogers, 2007; Seuring and Muller, 2008;Srivastava, 2007). Seuring and Muller (2008) review the green supply chain literatureand note that only eight partial literature review papers have been published over thelast 13-year period. However, their review specifically excludes papers primarilyfocused on reverse logistics and purchasing. The review presented by Srivastava (2007)focuses primarily on reverse logistics, whilst Carter and Rogers (2007) focus on the linkto performance. A special edition of the Journal of Operations Management considers therole of GSCM within operations management (Linton et al., 2007). As Waller (1999) notesenvironmental issues potentially affect every aspect of the SC. Yet much ofthe embryonic GSCM research has tended to focus on upstream activities, conversionprocesses, or the downstream activities rather than adopting a holistic systemapproach propagated by SCM. This runs counter to the integrative green SCM research
Figure 1.System components of
the supply chain
ProcessInput Output
Mechanism
Function Environment
Source: Chandra and Tunmanyan (2005)
Agent
GSCM practicesamongst UK
manufacturers
935

philosophy argued by many (Beamon, 1999; van Hoek, 1999; Wu and Dunn, 1995), andsystems thinking (Chandra and Tumanyan, 2005; O’Riordan, 1981).
Table II identifies the key empirical GSCM studies that influenced the researchreported in this paper. It indicates a clear bias towards an upstream or downstreamresearch focus concentrating on green purchasing or green logistics. However, a trendis emerging of more recent studies that adopt this wider, holistic perspective (Chien andShih, 2007; Rao, 2002; Zhu and Sarkis, 2004; Zhu et al., 2005, 2007) focusing mostly onISO14001 certified and/or manufacturing firms in China, Taiwan, and South-East Asia.Many studies (Carter and Carter, 1998; Carter and Ellram, 1998; Zsidisin and Siferd,2001) suggest that green supply chain research should move away from anecdotalstudies and adopt theoretically grounded and empirical research. This trend is alsoemerging in the more recent studies detailed in Table II amongst the Asian-basedstudies.
Apart from focusing on a narrower aspect of GSCM (such as purchasing orlogistics), the USA has provided the sampling frame for many of the previous empiricalstudies. Furthermore, few of these studies are cross-sectoral with most focusing on oneor two sectors (such as the Zhu et al., Murphy et al., and Carter et al. studies) withmanufacturing-orientated firms (i.e. the most frequent sectoral choice to study). Allthese point to a need for studies that are predicated on clear definition and SCM model,adopt an integrated approach to greening of SCM, consider a wide mix of industry
Components Properties Green supply chain in manufacturing
Input Physical item, information, or service thatis necessary to start a process
Reduced volumes and wastage of rawmaterials. Supplier management
Output Physical item, information or service thatresults from, processing an input. Theoutput is related to the totalaccomplishment of the function
Management of reverse logistics and greenoutbound logistics
Process Flows, transformations, conversions, ororder of steps, which transforms and inputinto an output
Internal environmental operationsmanagement practices of eco-efficiency
Environment Physical or sociological factors withinwhich the system elements operate. Itrelates to resource requirements, bothphysical and human
Drivers that influence the adoption ofgreen practices from within theorganisation and the external environment
Agent Computational, or human resources forcarrying the process. Can be a physicalobject or a logical object such as a role
Green champions that promote initiatives,influential CEOs, specific job roles topromote environmental behaviourincluding management of suppliers
Mechanism Physical or local facilitators in thegeneration of an output. Planning orworkflow activities that are carried out tofacilitate the process and organize in asystematic manner
Could include the mapping of waste by-products, supplier assessmentquestionnaires, accreditation to anenvironmental management standard
Function Mission, aim, purpose or primary concernof the system
Overall function is to provide the desiredoutput which has a lower environmentalburden/footprint
Source: Chandra and Tumanyan (2005)
Table I.Systems componentsof the SC and examplesin a “green” SC
JMTM20,7
936

types (including “average” rather than best practice examples) and provide a picturefrom other geographic locations.
The combination of elements of SCM proposed by Lambert et al. (1998), the Chandraand Tumanyan (2005) systems-based model of SCM shown in Figure 1, a review of theliterature on GSCM (selected examples are in Table II) and examination of a range ofpublished case examples of best-practice GSCM activities led us to develop the modelshown in Figure 2. The model simply suggests that depth and breadth of these
Autry et al. (2001) Retail, electronic goods, USA, reverse logistics)Baylis et al. (1998a, b, c) Manufacturing and processing, SMEs, South Wales, and green
purchasingBowen et al. (2001a) Mixed sectors including manufacturing, UK, and SCM
capabilitiesCarter and Carter (1998) Consumer products and manufacturing, USA, and green
purchasingCarter and Jenning (2002) Consumer products and manufacturing, USA, and socially
responsibly purchasingCarter et al. (1998) Consumer products and manufacturing, US Germany, and green
purchasingCarter et al. (2000) Consumer products and manufacturing, USA, environmental
purchasing, and firm performanceChien and Shih (2007) Electronics manufacturers, Taiwanese, GSCM practices, and
performanceFlorida (1996) Manufacturing, US Japanese, and environmentally conscious
manufacturingHill (1997) Manufacturing, UK, Yorkshire and Humberside, environmental
pressure from SCKlassen and Whybark (1999) Furniture manufacturing, USA, and environmental technology
investmentLivingstone and Sparks (1994) Export industries, Scotland, Germany, and environmental
legislation/packagingMin and Galle (1997) Mixed sectors including manufacturing, USA, and green
purchasing/recycled packagingMurphy and Poist (2000) Manufacturing and merchandising, Canada, UK, USA, EU, and
green logisticsMurphy et al. (1994, 1995, 1996) Manufacturing and merchandising, USA, and green logisticsPrendergast and Pitt (1996) Mixed including manufacturing, UK, and marketing and
environmentRao (2002) Mixed sectors including manufacturing, SE Asia, and green
supplyRoberts (1996) Individual consumers, USA, and environmental behaviourStrong (1995) Retail, UK, and green purchasingTheyel (2001) Chemical, USA, and customer-supplier relationshipsYoung and Kiekliewiez-Young(2001)
Mixed including manufacturing, USA, EU, and sustainabilitypractices
Ytterhus et al. (1996) Services, Norway, and customer-supplier relationshipsZhu and Sarkis (2004) Manufacturing, Chinese, GSCM, and performanceZhu et al. (2007) Manufacturing, Chinese, and GSCM implementationZhu et al. (2005) Manufacturing, Chinese, drivers, and GSCM practices and
performanceZsidisin and Hendrick (1998) Mixed including manufacturing, USA, UK, and environmental
purchasing
Table II.Selected empirical,
questionnaire-basedresearch studies
on aspects of greensupply
GSCM practicesamongst UK
manufacturers
937

practices (SCM components) adopted are a function of external (open system view oforganisation) and internal environment (management component). In another word thetotality of inputs to the system (including agent, mechanism, and functions) results inoutputs (practices). These outputs are measured by considering GSCM practices fromwithin the whole system (upstream, downstream, and transformation).
The model proposes that the extent and type of these GSCM outputs are influencedby internal and external factors. Little previous empirical research categorises thedrivers of upstream or downstream green supply chain operational activity (Carter andEllram, 1998; Elwood and Case, 2000; Green et al., 1996; Lanoie and Tanguay, 2000).The wider literature on drivers of environmental management in organisations canalso be considered (Canning and Hanmer-Lloyd, 2001; Henriques and Sadorsky, 1999;Hall, 2000; IM, 1998). Whilst Bowen et al. (2001a) provide a useful summary on thebenefits of GSCM practices. The perceived benefits of environmental management arealso identified by authors such as Holt (1998) and Rao (2002).
All these previous studies use subtly different constructs to measure or identify theexternal and internal drivers/benefits of environmental management or some aspectsof GSCM. However, all of these constructs can be grouped into four external categories:legislative, competitive, societal, and SC. The literature also suggests that differenttypes of drivers have different relative levels of importance, for instance legislation ismost frequently cited as the most influential external driver (ED) (IM, 1998; Murphyet al., 1995; Rao, 2002).
Carter and Ellram (1998) also stress the need to examine internal factors (IF) as wellas external environmental factors driving green logistics. Inside an organisation,pressure from employees, leadership from environmentally committed managementand perception of possible environmental risk might all contribute to changes inenvironmental practices in organisations. IDs may be influenced by:
. top/middle management support (Carter et al., 1998; Ghobadian et al., 2001);
. general employee’s concern (Baylis et al., 1998a);
. influential individuals such as the chief executive officer (CEO) or “greenchampions” (Drumwright, 1994; Ogbonna and Harris, 2001; Preston, 2001); and
. an environmentally committed organisational culture (Gavaghan et al., 1998;Green et al., 1998; Lippmann, 1999).
Figure 2.GSCM pressure/responsemodel
Green supply chain management operational responses
Environmental policyProcess design and redesign (environmental operations management)Supplier assessment, performance evaluation and selection strategies
Supplier education, mentoring, coaching and dissemination of best practiceGreen logistics programmes (including reverse logistics)
Development of industrial networks
Internal factors
Internal driversEnvironmental attitude
Supplier obstaclesInternal obstacles
External drivers
Supply chainlegislative
societalcompetitive
JMTM20,7
938
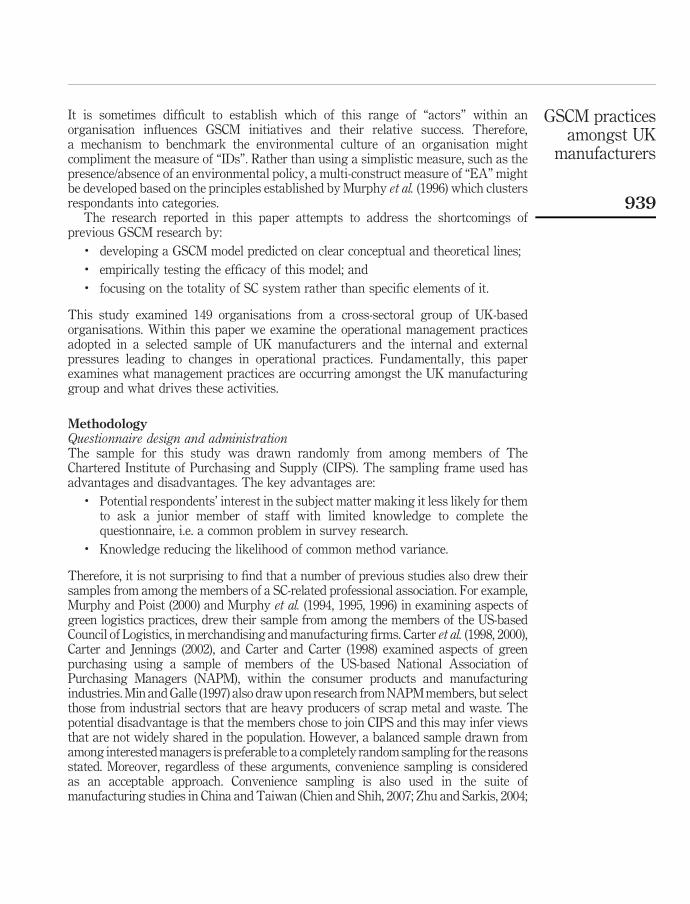
It is sometimes difficult to establish which of this range of “actors” within anorganisation influences GSCM initiatives and their relative success. Therefore,a mechanism to benchmark the environmental culture of an organisation mightcompliment the measure of “IDs”. Rather than using a simplistic measure, such as thepresence/absence of an environmental policy, a multi-construct measure of “EA” mightbe developed based on the principles established by Murphy et al. (1996) which clustersrespondants into categories.
The research reported in this paper attempts to address the shortcomings ofprevious GSCM research by:
. developing a GSCM model predicted on clear conceptual and theoretical lines;
. empirically testing the efficacy of this model; and
. focusing on the totality of SC system rather than specific elements of it.
This study examined 149 organisations from a cross-sectoral group of UK-basedorganisations. Within this paper we examine the operational management practicesadopted in a selected sample of UK manufacturers and the internal and externalpressures leading to changes in operational practices. Fundamentally, this paperexamines what management practices are occurring amongst the UK manufacturinggroup and what drives these activities.
MethodologyQuestionnaire design and administrationThe sample for this study was drawn randomly from among members of TheChartered Institute of Purchasing and Supply (CIPS). The sampling frame used hasadvantages and disadvantages. The key advantages are:
. Potential respondents’ interest in the subject matter making it less likely for themto ask a junior member of staff with limited knowledge to complete thequestionnaire, i.e. a common problem in survey research.
. Knowledge reducing the likelihood of common method variance.
Therefore, it is not surprising to find that a number of previous studies also drew theirsamples from among the members of a SC-related professional association. For example,Murphy and Poist (2000) and Murphy et al. (1994, 1995, 1996) in examining aspects ofgreen logistics practices, drew their sample from among the members of the US-basedCouncil of Logistics, in merchandising and manufacturing firms. Carter et al. (1998, 2000),Carter and Jennings (2002), and Carter and Carter (1998) examined aspects of greenpurchasing using a sample of members of the US-based National Association ofPurchasing Managers (NAPM), within the consumer products and manufacturingindustries. Min and Galle (1997) also draw upon research from NAPM members, but selectthose from industrial sectors that are heavy producers of scrap metal and waste. Thepotential disadvantage is that the members chose to join CIPS and this may infer viewsthat are not widely shared in the population. However, a balanced sample drawn fromamong interested managers is preferable to a completely random sampling for the reasonsstated. Moreover, regardless of these arguments, convenience sampling is consideredas an acceptable approach. Convenience sampling is also used in the suite ofmanufacturing studies in China and Taiwan (Chien and Shih, 2007; Zhu and Sarkis, 2004;
GSCM practicesamongst UK
manufacturers
939

Zhu et al., 2005, 2007) all of whom used access to a group of managers to complete theirsurvey instruments.
Data were collected using a survey instrument designed to identify the GSCMpractices in organisations. These organisations deploy upstream, within theirtransformation process, and downstream to enhance their environmental performanceand the internal and external factors that might influence depth and breadth of practicesdeployed (Figure 2). Several steps were taken to ensure validity. First, whereverpossible, research questions from prior studies were used to improve the validity of theresearch instrument (in particular Carter and Carter, 1998; Carter and Ellram, 1998;Elwood and Case, 2000; Green et al., 1996; Hall, 2000; IM, 1998; Lanoie and Tanguay,2000; Min and Galle, 1997; Murphy et al., 1995, 1996). Second, the questionnaire was sentto the CIPS environmental panel for perusal and comments. The questionnaire wasmodified to reflect the feedback received. Third, the modified questionnaire was pilotedusing a sample of CIPS companies to assess the structure, length, and appropriateness ofthe questions used (with ten pilot responses received from a range of sectors).
The questionnaire was sent to the CEO or the senior manager of 1,457 organisationsdrawn randomly from the CIPS database. The sample selected included a broad range ofsectors and company sizes. Within this sample there were 461 manufacturingorganisations.
There were a total of 60 usable responses from the manufacturing sample comprisinga response rate of 13 percent. The remaining 89 respondents in the larger sample werefrom a range of sectors including utilities and the public sector. t-tests of the variablesmeasuring the external pressures, IF and operational practices found no significantdifferences between the manufacturing group and the non-manufacturing group( p , 0.01).
Tabachnick and Fidell (2007, p. 123) discuss the ratio of cases to independentvariables and the issues associated with smaller sample sizes. This is a limitation withinthe study but the total number of respondents was similar to a range of previous studiesthat used statistical analysis including Klassen and Whybark (1999), Rao (2002), andZsidisin and Hendrick (1998). Wisner and Tan (2000) surveyed members of the NAPM.In a similar manner to our study and concluded that their response rate of 6.7 percent(n ¼ 101) was satisfactory given the complexity and length of the questionnaire. Forza(2002) examines the relationship between sample size, significance level and statisticalpower stating that relationships with a medium association at a statistical power of0.8 require a sample of size of 44 (a , 0.05) to 62 (a , 0.01) and a very strong associationrequires a smaller sample size than this. Therefore, whilst the manufacturing sample isrelative small, it remains a valid size for this exploratory study and has much in commonwith related studies in the published literature.
Carter et al. (1998) note that non-response bias is a potential limitation in surveyresearch, even if there are relatively high response rates. The Armstrong and Overton(1977) protocols were used to test for non-response bias by comparing the responses ofearly and late respondents. The anonymous nature of the questionnaire and the UK DataProtection Act in place at the CIPS prevented a “slimmed” down version of thequestionnaire being mailed to non-respondents (Carter and Jenning, 2002). Therefore, ina similar manner to the study by Autry et al. (2001) the final quartile of responses iscompared using t-tests with the first three-quarters of the sample of respondents order toassess non-response bias. t-tests were conducted on 15 scale variables created to capture
JMTM20,7
940
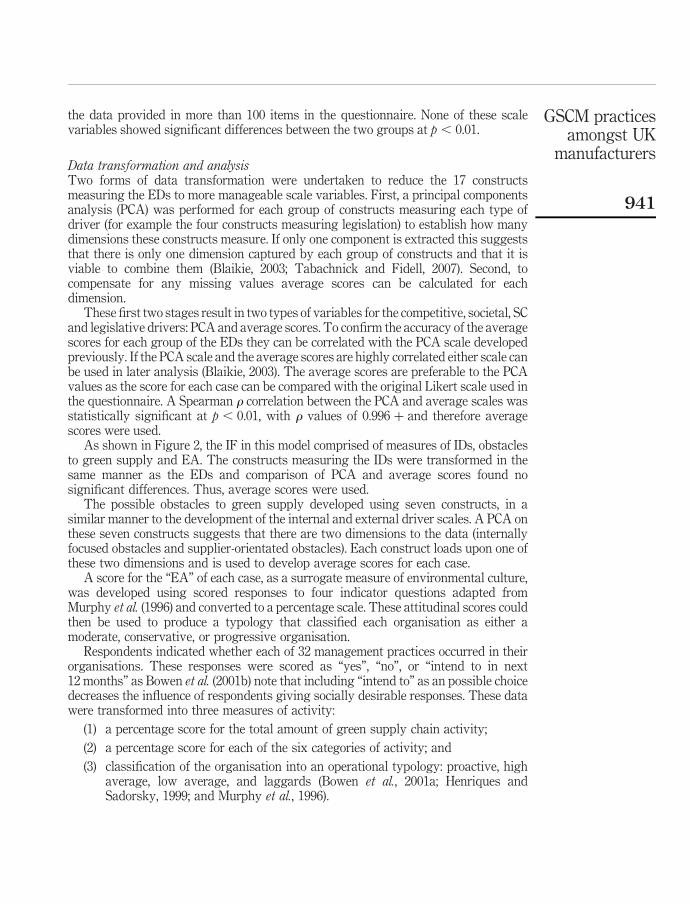
the data provided in more than 100 items in the questionnaire. None of these scalevariables showed significant differences between the two groups at p , 0.01.
Data transformation and analysisTwo forms of data transformation were undertaken to reduce the 17 constructsmeasuring the EDs to more manageable scale variables. First, a principal componentsanalysis (PCA) was performed for each group of constructs measuring each type ofdriver (for example the four constructs measuring legislation) to establish how manydimensions these constructs measure. If only one component is extracted this suggeststhat there is only one dimension captured by each group of constructs and that it isviable to combine them (Blaikie, 2003; Tabachnick and Fidell, 2007). Second, tocompensate for any missing values average scores can be calculated for eachdimension.
These first two stages result in two types of variables for the competitive, societal, SCand legislative drivers: PCA and average scores. To confirm the accuracy of the averagescores for each group of the EDs they can be correlated with the PCA scale developedpreviously. If the PCA scale and the average scores are highly correlated either scale canbe used in later analysis (Blaikie, 2003). The average scores are preferable to the PCAvalues as the score for each case can be compared with the original Likert scale used inthe questionnaire. A Spearman r correlation between the PCA and average scales wasstatistically significant at p , 0.01, with r values of 0.996 þ and therefore averagescores were used.
As shown in Figure 2, the IF in this model comprised of measures of IDs, obstaclesto green supply and EA. The constructs measuring the IDs were transformed in thesame manner as the EDs and comparison of PCA and average scores found nosignificant differences. Thus, average scores were used.
The possible obstacles to green supply developed using seven constructs, in asimilar manner to the development of the internal and external driver scales. A PCA onthese seven constructs suggests that there are two dimensions to the data (internallyfocused obstacles and supplier-orientated obstacles). Each construct loads upon one ofthese two dimensions and is used to develop average scores for each case.
A score for the “EA” of each case, as a surrogate measure of environmental culture,was developed using scored responses to four indicator questions adapted fromMurphy et al. (1996) and converted to a percentage scale. These attitudinal scores couldthen be used to produce a typology that classified each organisation as either amoderate, conservative, or progressive organisation.
Respondents indicated whether each of 32 management practices occurred in theirorganisations. These responses were scored as “yes”, “no”, or “intend to in next12 months” as Bowen et al. (2001b) note that including “intend to” as an possible choicedecreases the influence of respondents giving socially desirable responses. These datawere transformed into three measures of activity:
(1) a percentage score for the total amount of green supply chain activity;
(2) a percentage score for each of the six categories of activity; and
(3) classification of the organisation into an operational typology: proactive, highaverage, low average, and laggards (Bowen et al., 2001a; Henriques andSadorsky, 1999; and Murphy et al., 1996).
GSCM practicesamongst UK
manufacturers
941

Research findingsThis paper seeks to address two key questions. In the first section of these findings weexplore the breadth and depth of the components of the GSCM pressure/responsemodel shown in Figure 2. Second, we provide some initial analysis of the potentialrelationships between these factors in the model.
Nature and extent of GCSMExternal and internal drivers. Table III indicates the rank order for the mean score forvarious individual constructs used to examine the internal and external drivers ofGSCM. Legislative pressures are the highest ranked, followed by IF, competitive, SC,and finally societal.
5 – extremely important, 1 – not important Mean (man) SD Rank
LegislationInfluence of UK’s current environmental legislation 4.20 0.97 1EU’s current environmental legislation 3.93 1.16 2Forthcoming environmental legislation 3.47 1.09 8Possible environmental legislation in the future 3.12 1.18 14Average rank 6.25Internal driversIn order to reduce the health and safety risk associated with our goods,services or operational practices 3.83 1.09 4In order to reduce the public’s perceived risk associated with ourcompany 3.41 1.16 9Culture of the organisation promotes environmental responsibility 3.32 1.14 10The CEO (or equivalent) commitment to environmental improvement 3.23 1.29 11Pressure from employees 2.48 1.02 22Average rank 11.2CompetitiveTo perform better than our competitors or equivalent institutions 3.65 1.35 5Provides new market opportunities 3.17 1.38 12To match the activities of competitors 3.10 1.37 15Provides operational cost savings 2.95 1.37 17Average rank 12.25Supply chainRequirements of organisations that you supply to 3.53 1.36 7Encouragement from organisations that you supply goods andservices to 3.13 1.20 13Pressure from individual consumers/service users 2.71 1.27 19Influence of your own suppliers that provide goods and services toyour organisation 2.60 1.06 21Average rank 15SocietalMaintaining or presenting an environmentally or socially responsibleimage 3.57 1.13 6Public opinion/societal expectation 2.77 1.21 18Pressure from green action groups (such as Greenpeace or Friends ofthe Earth) 2.18 1.20 23Pressure from the insurance industry 3.05 1.18 16Pressure from shareholders or investors (when applicable) 2.68 1.19 20Average rank 16.6
Table III.Relative importanceof individual itemscapturing the internaland external driversof GSCM
JMTM20,7
942

The findings suggest that legislative drivers exert the most perceived pressure onmanufacturing organisations, which mirrors the findings of similar studies (Baylis et al.,1998a, b; Davies, 1996; Ghobadian et al., 2001; Henriques and Sadorsky, 1996; Lammingand Hampson, 1996; Min and Galle, 1997; Preuss, 2001; Welford and Gouldson, 1993;Zhu and Geng, 2001). Potential risk associated with health and safety is also highlyranked (fourth), which may reflect the extensive legislation associated with theseaspects in manufacturers.
Societal pressures are ranked as the least influential factors, apart from the constructof presenting an environmental responsible image (which has some links with theconstruct measuring risk). But pressures from most societal stakeholders are rankedquite low. The influence of the SC amongst manufacturers is relatively highly ranked(seventh) which perhaps reflects the higher risk aspects of manufacturing and targetingenvironmental improvements through SC pressure from other companies in the SC.Whereas, influence from individual consumers is amongst the lowest ranked factor(19th) and perhaps reflects the distance manufacturers experience from the end-users astheir products are most often passed along the value chain to distributors and retailers.
Table III also indicates that within each category of pressures driving activity thereare varying levels of influence. For instance, the role of a “green” CEO (11th) ororganisation culture (10th) is much more highly ranked than that of employees as awhole (22nd). This enforces the comments of authors such as Drumwright (1994) andOgbonna and Harris (2001) that organisational champions are important in drivingchange and that their managerial position in the organisation is also crucial.
Operational practices. Table IV identifies the percentage of respondents thatundertook each of the specific GSCM operational practices. These practices aregrouped into sub-categories of activity that recognises that not all organisationsundertake the same GSCM practices. Within each category there are also gradedactivities where some actions such as recycling toner cartridges (ranked first overall)would be more likely than the action of accrediting to an environmental managementstandard, which requires a greater resource commitment (19th).
Within the categories of activity the internal operational practices were the mostcommon overall for both sets reflecting the concentration on internal practices first, wherethere are the win-win performance aspects of the triple bottom line approach so prevalentin industry. This suggests that even the most inactive of organisations is addressing theseinternal operations management actions first. It is questionable however whether suchactions are related to GSCM or really just operational efficiencies that make economicsense. Within manufacturing organisations the second most popular group of activities isassociated with logistics, which is not unrealistic given the nature of their operations, forinstance “Using recyclable pallet systems” is relatively highly ranked (7th).
Supplier assessment and evaluation practices are the third most popular group ofactivities with informal assessment of suppliers (ranked 9th) much more likely than aformal system (ranked 18th). It should be noted that this was not a sample of leadingedge companies (Rao, 2002) but a mixed, more “average” sample and thus perhapsrepresents a more accurate picture of actual practice than the best of the best scenariosoften used in such studies. Informal assessment requires less formalised monitoringand is less resource intensive.
The policy dimension is captured by the fourth aspect, which shows again a clearbias towards the less formal embedding of environmental/social policies into activity
GSCM practicesamongst UK
manufacturers
943

Operational practices – % that undertook that activity % Rank
Internal environmental management practicesWe recycle toner cartridges in the offices 88.1 1We actively manage the disposal of packaging wastes 85.0 2We actively manage the disposal of all solid wastes in the organisation 84.5 3Paper recycling in offices is standard practice 82.8 4We are required by law to control the disposal of some of our wastes(e.g. medical waste) 75.9 5Energy efficiency measures are adopted for lighting and heating 74.6 6We have accredited to an environmental management standard such asISO14001 or EMAS 42.6 16Average rank 5.3LogisticsWe ask suppliers to use recyclable pallet system when they deliversupplies to us 62.3We have energy efficiency systems in operation in our warehouses 48.0 10We consider environmental matters generally in our transport decisions 43.6 14We expect our suppliers to take back their packaging or pallet systemsthey use to supply goods to us 43.1 15We plan the routes of our vehicles in order to reduce environmentalimpacts 31.7 20We have invested in vehicles that are designed to have reducedenvironmental impacts 26.2 22Average rank 14.7Supplier assessment and evaluationWe assess the environmental acceptability and performance of oursuppliers informally in our assessment criteria 53.7 9We assess the environmental acceptability and performance of oursuppliers in a formal process 37.9 18We set environmental criteria that suppliers must meet 23.7 25Average rank 17.3Green procurement and logistics policyWe consider ethical and human rights/welfare issues informally in ourpurchasing decisions 60.7 8We have a green purchasing or logistics guidelines that recommend theenvironment is considered 46.4 11We consider ethical and human rights/welfare issues formally in ourpurchasing decisions 25.0 23We have a formal policy on green procurement/purchasing 23.7 24We are bound by external purchasing directives (e.g. the EC procurementdirective or franchise agreements) 22.8 26We have a formal policy on green logistics/transport 12.5 30Average rank 20.3Supplier education, coaching and mentoringWe have received environmental guidance from our own customers 44.8 12We communicate to our suppliers our environmental and/or ethicalcriteria for goods and services we buy 44.1 13We educate our suppliers through written material 31.0 21We have been the recipient of educational workshops and visits by ourcustomers to educate us on what environmental improvements can bemade 14.3 28
(continued )
Table IV.Operational practicesamongst manufacturersin rank order
JMTM20,7
944
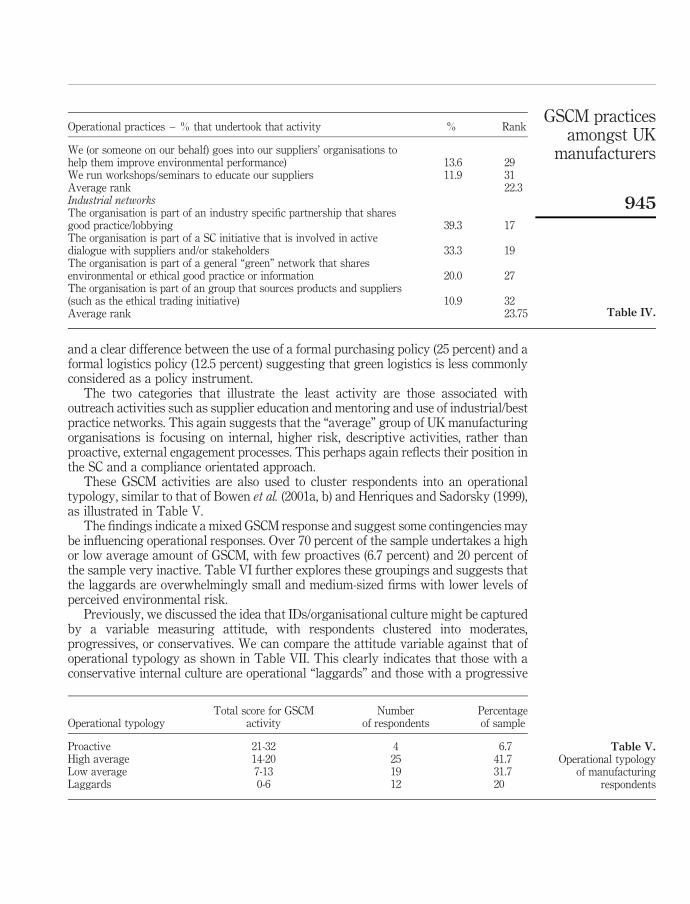
and a clear difference between the use of a formal purchasing policy (25 percent) and aformal logistics policy (12.5 percent) suggesting that green logistics is less commonlyconsidered as a policy instrument.
The two categories that illustrate the least activity are those associated withoutreach activities such as supplier education and mentoring and use of industrial/bestpractice networks. This again suggests that the “average” group of UK manufacturingorganisations is focusing on internal, higher risk, descriptive activities, rather thanproactive, external engagement processes. This perhaps again reflects their position inthe SC and a compliance orientated approach.
These GSCM activities are also used to cluster respondents into an operationaltypology, similar to that of Bowen et al. (2001a, b) and Henriques and Sadorsky (1999),as illustrated in Table V.
The findings indicate a mixed GSCM response and suggest some contingencies maybe influencing operational responses. Over 70 percent of the sample undertakes a highor low average amount of GSCM, with few proactives (6.7 percent) and 20 percent ofthe sample very inactive. Table VI further explores these groupings and suggests thatthe laggards are overwhelmingly small and medium-sized firms with lower levels ofperceived environmental risk.
Previously, we discussed the idea that IDs/organisational culture might be capturedby a variable measuring attitude, with respondents clustered into moderates,progressives, or conservatives. We can compare the attitude variable against that ofoperational typology as shown in Table VII. This clearly indicates that those with aconservative internal culture are operational “laggards” and those with a progressive
Operational practices – % that undertook that activity % Rank
We (or someone on our behalf) goes into our suppliers’ organisations tohelp them improve environmental performance) 13.6 29We run workshops/seminars to educate our suppliers 11.9 31Average rank 22.3Industrial networksThe organisation is part of an industry specific partnership that sharesgood practice/lobbying 39.3 17The organisation is part of a SC initiative that is involved in activedialogue with suppliers and/or stakeholders 33.3 19The organisation is part of a general “green” network that sharesenvironmental or ethical good practice or information 20.0 27The organisation is part of an group that sources products and suppliers(such as the ethical trading initiative) 10.9 32Average rank 23.75 Table IV.
Operational typologyTotal score for GSCM
activityNumber
of respondentsPercentageof sample
Proactive 21-32 4 6.7High average 14-20 25 41.7Low average 7-13 19 31.7Laggards 0-6 12 20
Table V.Operational typology
of manufacturingrespondents
GSCM practicesamongst UK
manufacturers
945
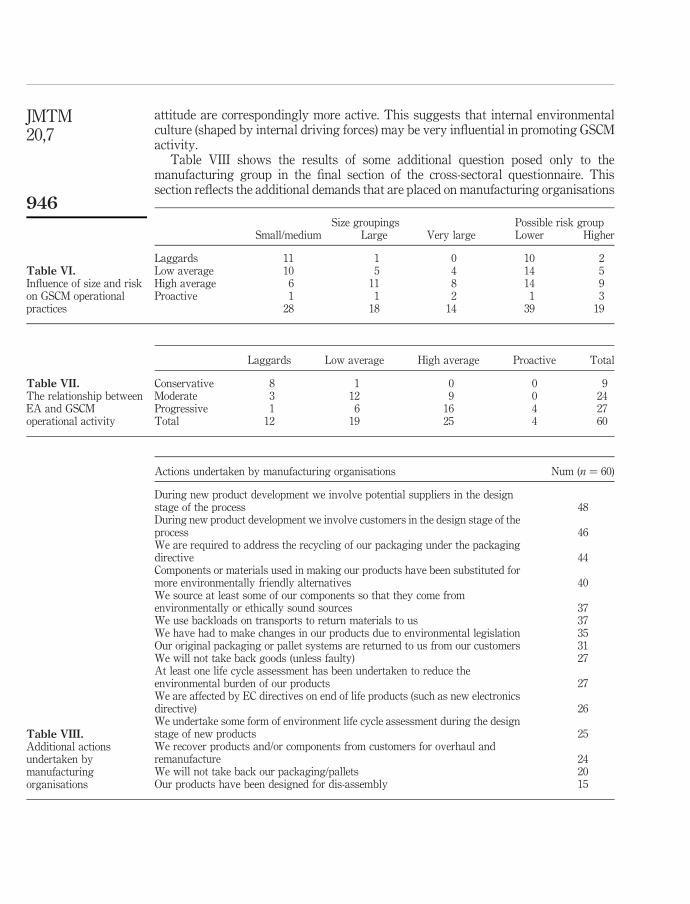
attitude are correspondingly more active. This suggests that internal environmentalculture (shaped by internal driving forces) may be very influential in promoting GSCMactivity.
Table VIII shows the results of some additional question posed only to themanufacturing group in the final section of the cross-sectoral questionnaire. Thissection reflects the additional demands that are placed on manufacturing organisations
Size groupings Possible risk groupSmall/medium Large Very large Lower Higher
Laggards 11 1 0 10 2Low average 10 5 4 14 5High average 6 11 8 14 9Proactive 1 1 2 1 3
28 18 14 39 19
Table VI.Influence of size and riskon GSCM operationalpractices
Laggards Low average High average Proactive Total
Conservative 8 1 0 0 9Moderate 3 12 9 0 24Progressive 1 6 16 4 27Total 12 19 25 4 60
Table VII.The relationship betweenEA and GSCMoperational activity
Actions undertaken by manufacturing organisations Num (n ¼ 60)
During new product development we involve potential suppliers in the designstage of the process 48During new product development we involve customers in the design stage of theprocess 46We are required to address the recycling of our packaging under the packagingdirective 44Components or materials used in making our products have been substituted formore environmentally friendly alternatives 40We source at least some of our components so that they come fromenvironmentally or ethically sound sources 37We use backloads on transports to return materials to us 37We have had to make changes in our products due to environmental legislation 35Our original packaging or pallet systems are returned to us from our customers 31We will not take back goods (unless faulty) 27At least one life cycle assessment has been undertaken to reduce theenvironmental burden of our products 27We are affected by EC directives on end of life products (such as new electronicsdirective) 26We undertake some form of environment life cycle assessment during the designstage of new products 25We recover products and/or components from customers for overhaul andremanufacture 24We will not take back our packaging/pallets 20Our products have been designed for dis-assembly 15
Table VIII.Additional actionsundertaken bymanufacturingorganisations
JMTM20,7
946

in relation to product design. The table suggests a bias towards processes related todesign specifications and legislative requirements (such as the packaging directive)but less emphasis on proactive tools such as life cycle assessment or product takebackand recovery. This perhaps then confirms the value of legislation around products thattake back such as the waste electrical and electronic equipment directive.
Factors influencing breadth and depth of GSCMThe previous sections have described the findings associated with each of the individualconstructs within the model shown in Figure 2. This next section explores the potentialrelationships between these and various moderating factors to examine the efficacy ofthe model. The lack of previous empirical work from a total SC perspective with a biastowards homogeneous groupings has represented samples with limited variety in theirorganisational contingencies and little empirical investigation of the moderatinginfluence of these.
Does nationality affect GSCM practices? Kolk et al. (2001) note differences inenvironmental reporting by the world’s top 250 companies, primarily based in the West,based on nationality and sector. Much of the empirical GSCM research is dominatedby studies from the West especially the USA (such as Murphy and Carter).The non-Western studies from authors such as Rao, Zhu, Sarkis, and Geng all suggestthat there are key differences between organisational responses in different sectorsaround the world. However, as Zhu et al. (2005, 2007) and Chien and Shih (2007) notemuch of the world’s manufacturing base is predicted to move towards the Asian regions.If IDs and environmental culture are very influential, these are surely shaped by culturalnorms in the host country or perhaps the parent firm. Therefore, considering nationalityas a surrogate measure of this may be a fruitful avenue to explore.
Within the sample 48 firms identified themselves as UK controlled, i.e. based in andcontrolled by, a UK headquarters or overseas headquarters with devolved policy andstrategy making at a local level, whereas 12 firms were controlled by various overseashead offices from seven countries. This data set is not sufficient to statistically test thenon-UK group but differences are apparent when the data is explored and may suggestthat some aspects of national identity influence the operational practices in a differenthost country. Therefore, future work should examine the moderating influence ofnationality of parent firm and the moderating influence of the in-country location.
Does size affect GSCM? We have already seen in the previous section that mostoperational laggards are smaller sized organisations. This supports authors such asBaylis et al. (1998a, b, c) and Hillary (2000) who suggest size may be a limiting factor togreen operational activity and may also be considered a moderating factor with smallerorganisations less active.
There were 29 (48.3 percent) small or medium manufacturers (,250 employees),18 large firms (250-999 employees) and 13 very large firms (1,000 þ ). The mean rankscores in Table IX suggest that the very large manufacturers (1,000 þ employees)experience the greatest amount of external pressure from societal and legislativedrivers and as the size of the company increases so do the levels of external pressurefrom these drivers. EA mimics this pattern with largest manufacturers having themost progressive EA/culture. The total amounts of GSCM operational activity and ineach of the sub groupings (except supplier education) are greatest in the largestmanufacturers (1,000 þ ) and least in the small and medium enterprises (SMEs) (,250).
GSCM practicesamongst UK
manufacturers
947

In all cases SMEs undertake the least amount of GSCM operational activity. Thismirrors the findings of much of the general environmental management literature thatsuggests SMEs experience less pressure and adopt less green operational practices.
The role of environmental risk and impact. Of the 26 GSCM empirical studiesdetailed in Table II, 21 of these specifically investigate one or more manufacturinggroups. Often the justification for this sample is that these organisations representhigher levels of risk and impact. However, this thesis may not be accurate for allmanufacturing firms and therefore considering risk and environmental impact asmoderating factors may be a fruitful aspect to explore. In addition these factors mayprovide a more useful classification for predicting environmental activity than sectoror size as these measures cross “rigid” size and sector classifications. Command andcontrol environmental legislation targets specific high risk/impact processes andproducts, rather than company size or broad sector.
The level of possible environmental risk and environmental impact of theorganisation are “self-perception” measures by each organisation. It could be arguedthat it is the perception of external and internal pressures by an organisation thatgoverns organisational behaviour. The dirtier, higher risk industries such as thechemical sector would be expected through legislative pressure to be more active inenvironmental management activities. However, green pressure group lobbying/orcriticism on a specific issue aimed at a retail organisation (such as Nike) or lightmanufacturing company (perhaps associated with a more local concern such aspollution of a local river), might lead to a perception by that organisation of a high levelof environmental risk and subsequently influence behaviour – even though theirprocesses are relatively less “damaging” than for instance a chemical company.Therefore, this measure allows potential environmental risk and impact to be includedas a relative perception measure by each organisation.
Each respondent was required to self designate the potential level of environmentalrisk and impact of their organisations. A Mann Whitney U test shows some interestingtrends but these are not conclusive due to the lack of comparability between theself-diagnostic classifications. Three elements of the model demonstrate statisticallysignificant differences between negligible/low and moderate/high environmental riskat p , 0.05: supplier obstacles (SOs), total green supply operational activity and EA.
Asymp. Mean rank scoresElements of pressure response model x 2 df sig. SME Large Very large
GSCM operational activity (%) 16.73 2 0.000 * 21.2 37.0 42.3Supplier education coaching and mentoring (%) 9.36 2 0.009 * 23.3 38.2 33.0Green procurement and logistics policy (%) 11.21 2 0.004 * 23.1 35.7 39.9Internal environmental operations management (%) 13.55 2 0.001 * 23.3 32.2 44.2Green logistics (%) 10.14 2 0.006 * 24.6 30.0 43.0Industrial networks (%) 6.28 2 0.043 * * 24.6 29.6 38.0Average score for legislation drivers 14.34 2 0.001 * 22.9 32.6 44.5Average score for societal drivers 10.46 2 0.005 * 23.3 34.8 40.6Average score IDs 9.97 2 0.007 * 22.8 36.8 37.1Environmental attitude (%) 15.37 2 0.000 * 21.8 36.0 42.3
Notes: *p , 0.01; * *p , 0.05
Table IX.Influence of size(Kruskal Wallis test)
JMTM20,7
948

Higher risk manufacturers were operationally more active and had a more positiveinternal EA. SOs were more pronounced in the lower risk group ( p ¼ 0.035), perhapsdue to the lack of a risk imperative in this group leading to resistance and inactivity onthe part of suppliers.
Manufacturers with the higher levels of potential environmental impactdemonstrate statistically significant differences from the lower impact group in onlytwo elements of the model: IDs ( p ¼ 0.029) and SC pressure ( p ¼ 0.041). In bothinstances higher risk manufacturers experience greater levels of internal and SCpressure. None of the other drivers or the operational responses appears to be affectedby the level of potential environmental impact.
Future studies should incorporate this dimension of “risk” but mechanisms need tobe developed to provide comparable designations rather than those self selected, or away to triangulate these self designated measures. This is less problematic in countrieswhere compulsory environmental reporting of some form is available (such as the TRIindex in the USA) which can be used for such data triangulation.
What controls GSCM activity?Attitude, external and internal drivers. Figure 2 shows that GSCM practices are afunction of IF and EDs. The aggregate score of total GSCM activity (SGSCM) captureshow much activity is happening in each respondent organisation. EDs consist oflegislative (L), societal (S), SC and competitive factors (C). We also incorporate measuresof internal obstacles (IO) and SO. The model shows in Figure 2 can be summarized as:
SGSCM ¼ IF þ ED where IF ¼ ðEA; ID; SO; IOÞ and ED ¼ ðL; SC;C; SÞ:
The previous section has also suggested that there may be some moderating influenceby organisational contingencies such as size, nationality or levels of environmental riskand impact.
First, we must establish whether the EA variable and IDs are actually measuring thesame construct. Earlier we argued that the EA variable is used as a surrogate measureof the environmental “attitude” of the organisation, in the event that the IDs scale doesnot fully capture the complexity of intra-organisational factors. If the IDs and EA scalesmeasure the same concept they would be highly correlated. Whilst there is a significantcorrelation a bivariate regression between them produces a solution of r ¼ 0.634,explaining 40 percent of the variance between the two scales. This suggests that EAand the IDs, though highly correlated; measure slightly different aspects of the internalforces driving green supply management practices and both should be incorporated.
Having established that the measure of IDs and EA measure different aspects wenow question the relationship between EDs and the construct of EA. The fourcomponents of the EDs scale are used (legislative, SC, societal, and competitive) in astepwise multiple regression to produce an initial solution where the legislative scalespredicts 36 percent of the variance in the EA scale. The addition of the SC factors addsan additional 5 percent, explaining 41 percent of the total variance in the dataset(r ¼ 0.639). Entering all four driver scales in forced multiple regression produces a R 2
value of 0.421. Therefore, EA within the manufacturing group can be predicted mainlyby the legislative drivers, followed by SC drivers. However, this only explains 42 percentof the variance in the EA suggesting that whilst legislation has a major role in shapingEAs there are some other factors at play, suggesting a role for IDs. Therefore, predictingGSCM activity requires the incorporation of IDs, EA, and the EDs.
GSCM practicesamongst UK
manufacturers
949

Resultant GSCM operational practices. There is a highly significant relationshipbetween EA and resultant GSCM activity (R ¼ 0.665). This solution is improvedslightly by the addition of the IDs to the regression equation (R ¼ 0.696), with an R 2
value of 0.484. However, just EA alone is not enough to explain the variance in GSCMactivity in the sample, though it is clearly important. If all of the EDs and IF are addedto a stepwise multiple regression to predict total operational activity, EA remains theonly significant predictor (R ¼ 0.690) explaining 47.6 percent of variance. However,if all of the variables are forced into the equation the R 2 value improves explaining49.7 percent of the variance in GSCM activity. If EA is removed from the predictiveequation the R value drops dramatically to 0.532, with only the legislative factorsidentified as significant in the stepwise equation (R 2 ¼ 0.283).
The exploration of this model suggests that EA is a key variable to explore in moredetail. There is a clear correlation between some of the variables and GSCM activity,especially the EA and legislative drivers. However, the variability in the regressionequations still suggests that other factors are influential. Exploration of contingenciesof size, nationality and level of environmental risk all suggest that the model may bemoderating by these factors and this should be explored further. This finding suggeststhat organisations may respond differently to GSCM initiatives, especially thoseinitiated externally, based on their specific organisational contingencies and that thesemaybe a better predictor of GSCM response, and a better targeting tool for initiatives.The internal construct that measures EA is a key aspect to explore in future work andsuggests that organisational culture may be a key control over levels of GSCM activity.This is a significant finding as this suggests that it may be the internal, culture drivenfactors that promote the most GSCM activity. However, the influence of legislationdoes suggest that for some organisations this maybe a controlling factor, perhapsrelated to those larger and more visible high risk organisations.
ConclusionsThis paper sought to examine two key aspects: the extent and nature of GSCM in aselection of manufacturing organisations and the factors that may influence thisactivity. The exploration of this data set suggests some initial conclusions:
. That on average manufacturers perceived the greatest pressure to improveenvironmental performance through legislation and IDs.
. That the least influential pressures are related to societal drivers and SCpressures from individual customers.
. GSCM practices amongst this “average” group of UK manufacturingorganisations are focusing on internal, descriptive activities (such as internalenvironmental operations management control practices) rather than proactive,external engagement processes (such as supplier outreach).
. That EA is a key predictor of GSCM activity and those organisations that have aprogressive attitude are also operationally very active.
. That EA shows some relationship to legislative drivers but other factors are alsoinfluential.
. Operational activity may also be moderated by organisational contingenciessuch as risk, size and nationality.
JMTM20,7
950
The most common green supply chain practices focus on internal cost saving activities.There is less effort in the case of in-bound and out-bound logistics. This suggest that therea great deal more that manufacturing organisations can do in greening their SCs. One keyaspect might be greater awareness and dissemination of best practice that quantifies costsand benefits. The role of the “EA” variable suggests that engagement of managers iscrucial to drive forward an internal environmental culture and this might be facilitated bybuilding awareness, best practice examples and the establishment of green supplypurchasing bench marking clubs.
This study uses a relatively small manufacturing sample and should be replicatedin a larger group. Future studies should also seek to validate the influence of potentialenvironmental risk and impact by using universal measures that allow directcomparability. The statistical tests used in this paper are affected to some extent by thesmall sample size, especially multiple regression and further testing is necessary.
The dominant ED is legislation and potential health and safety risks are alsoinfluential moderating factors suggesting a reactive rather than pro-active stance bysome organisations. Lack of engagement with the SC through outreach activity is aninteresting finding and also suggests a compliance led approach. There is a clear focuson internal operational improvements – that relate mostly to operational efficienciesrather than proactive engagement with the SC. This suggests that few organisationsreach out to support their suppliers in a proactive, collaborative manner, and tendtowards supplier auditing.
Using the typologies of attitude and activity is also an interesting avenue to pursueand future work should examine the characteristics of these groups in more detail tosee if there are key contingencies that are more prevalent in the progressive andproactive groups. The characteristics of this data sample (the “average” nature ratherthan best practice) should be considered in future work. Another contingency that maybe influential is a measure of “distance” to the end consumer. For some organisationsindividual consumers were obviously not important suggesting that position withinthe SC could be important. It is clear that the contingencies we explored here (size, risk,and nationality) are leading to variability in GSCM activity and other factors may alsobe important. Thus, policy and legislative responses that consider GSCMpressures/drivers and responses amongst manufacturers to be homogeneous may beunder estimating the influence of such contingencies.
The ultimate aim of GSCM policy and practice is to improve the environmentalperformance of the SC and industry as a whole. Until we fully understand the forcesthat control the level and breadth of this activity it will be difficult to instigate policyinstruments that encourage and/or force improvements in such activity. Whilstlearning from best practice firms is a valuable way to learning the types of activitiesthat can take place, if we are to effect industry wide improvements we need to engagethe “average” manufacturer who is more akin to the respondents detailed in this study.
References
Armstrong, J.S. and Overton, T.S. (1977), “Estimating non-response bias in mail surveys”,Journal of Marketing Research, Vol. 14 No. 3, pp. 396-402.
Autry, C.W., Daugherty, P.J. and Richey, R.G. (2001), “The challenge of reverse logistics incatalog retailing”, International Journal of Physical Distribution & Logistics Management,Vol. 31 No. 1, pp. 26-37.
GSCM practicesamongst UK
manufacturers
951
Baylis, R., Connell, L. and Flynn, A. (1998a), “Company size, environmental regulation andecological modernisation: further analysis at the level of the firm”, Business Strategy andthe Environment, Vol. 7 No. 5, pp. 285-96.
Baylis, R., Connell, L. and Flynn, A. (1998b), “Sector variation and ecological modernisation:towards an analysis at the level of the firm”, Business Strategy and the Environment, Vol. 7No. 3, pp. 150-61.
Baylis, R., Connell, L. and Flynn, A. (1998c), “Small and medium enterprises the implications ofgreener purchasing”, in Russel, T. (Ed.), Greener Purchasing Opportunities andInnovations, Greenleaf, Sheffield.
Beamon, B.M. (1999), “Designing the green supply chain”, Logistics Information Management,Vol. 12 No. 4, pp. 332-42.
Bechtel, C. and Jayaram, J. (1997), “Supply chain management: a strategic perspective”,International Journal of Logistics Management, Vol. 8 No. 1, pp. 15-34.
Blaikie, N. (2003), Analyzing Quantitative Data, Sage, London.
Bowen, F.E., Cousins, P.D., Lamming, R.C. and Faruk, A.C. (2001a), “Horses for coursesexplaining the gap between theory and practice of green supply”, Greener ManagementInternational, Vol. 35, pp. 41-60.
Bowen, F.E., Cousins, P.D., Lamming, R.C. and Faruk, A.C. (2001b), “The role of supplymanagement capabilities in green supply”, Production and Operations Management,Vol. 10 No. 2, pp. 174-89.
Brown, G. (2006), Speech by the Rt Hon Gordon Brown MP, Chancellor of the Exchequer,to United Nations Ambassadors, New York, NY, April 20.
Canning, L. and Hanmer-Lloyd, S. (2001), “Managing the environmental adaptation process insupplier-customer relationships”, Business Strategy and the Environment, Vol. 10 No. 4,pp. 225-37.
Carter, C.R. and Carter, J.R. (1998), “Inter-organisational determinants of environmentalpurchasing: initial evidence from the consumer products industries”, Decision Science,Vol. 29 No. 3, pp. 659-84.
Carter, C.R. and Ellram, L.M. (1998), “Reverse logistics: a review of the literature and frameworkfor future investigation”, Journal of Business Logistics, Vol. 19 No. 1, pp. 85-102.
Carter, C.R. and Jenning, M.M. (2002), “Social responsibility and supply chain relationships”,Transportation Research Part E, Vol. 38 No. 1, pp. 37-52.
Carter, C.R. and Rogers, D.S. (2007), “A framework of sustainable supply chain management:towards new theory”, International Journal of Physical: Distribution & LogisticsManagement, Vol. 38 No. 5, pp. 360-87.
Carter, C.R., Ellram, L.M. and Ready, K.J. (1998), “Environmental purchasing: benchmarking ourGerman counterparts”, International Journal of Purchasing & Materials Management,Vol. 34 No. 4, pp. 28-38.
Carter, C.R., Kale, R. and Grimm, C.M. (2000), “Environmental purchasing and firm performance:an empirical investigation”, Transportation Research Part E: Logistics and TransportationReview, Vol. 36 No. 3, pp. 219-28.
Chandra, C. and Tumanyan, A. (2005), “Supply chain system taxonomy: a framework andmethodology”, Human Systems Management, Vol. 24 No. 4, pp. 245-58.
Chien, M.K. and Shih, L.H. (2007), “An empirical study of the implementation of green supply chainmanagement practices in the electrical and electronics industry and their relationship toorganizational performance”, International Journal of Environmental Science & Technology,Vol. 4 No. 3, pp. 383-94.
JMTM20,7
952
Davies, J.B. (1996), Product Stewardship and the Coming Age of Takeback, Cutter InformationCorporation, Arlington, MA.
Drumwright, M.E. (1994), “Socially responsible organisational buying: environmental concern asa non-economic buying criterion”, Journal of Marketing, Vol. 58, July, pp. 1-19.
Elwood, H. and Case, S. (2000), “Private sector pioneers: how companies are incorporatingenvironmentally preferable purchasing”, Greener Management International, Vol. 29,pp. 70-94.
Florida, R. (1996), “Lean and green: the move to environmentally conscious manufacturing”,California Management Review, Vol. 39 No. 1, pp. 80-105.
Forza, C. (2002), “Survey research in operations management a process based perspective”,International Journal of Operations & Production Management, Vol. 22 No. 2, pp. 152-94.
Gavaghan, K., Klein, R.C., Olson, J.P. and Pritchett, T.E. (1998), “The greening of the supplychain”, Supply Chain Management Review, Vol. 2 No. 2, pp. 77-84.
Ghobadian, A., Viney, H. and Holt, D. (2001), “Seeking congruence in implementing corporateenvironmental strategy”, International Journal of Environmental Technology andManagement, Vol. 1 No. 4, pp. 384-401.
Gibson, B.J., Mentzer, J.T. and Cook, R.L. (2005), “Supply chain management: the pursuit of aconsensus definition”, Journal of Business Logistics, Vol. 26 No. 2, pp. 17-25.
Green, K., Morton, B. and New, S. (1996), “Purchasing and environmental management:interactions, policies and opportunities”, Business Strategy and the Environment, Vol. 5,pp. 188-97.
Green, K., Morton, B. and New, S. (1998), “Case study green purchasing and supply policies: dothey improve companies’ environmental performance?”, Supply Chain Management, Vol. 3No. 2, pp. 89-95.
Hall, J. (2000), “Environmental supply chain dynamics”, Journal of Cleaner Production, Vol. 8No. 6, pp. 455-71.
Henriques, I. and Sadorsky, P. (1996), “The determinants of an environmentally responsive firm:an empirical approach”, Journal of Environmental Economics and Management, Vol. 30No. 3, pp. 381-95.
Henriques, I. and Sadorsky, P. (1999), “The relationship between environmental commitment andmanagerial perceptions of stakeholder importance”, Academy of Management Journal,Vol. 42 No. 1, pp. 87-99.
Hill, K.E. (1997), “Supply chain dynamics, environmental issues and manufacturing firms”,Environment and Planning, Vol. 29, pp. 1257-74.
Hillary, R. (2000), Small and Medium-Sized Enterprises and the Environment BusinessImperatives, Greenleaf, Sheffield.
Holt, D. (1998), “The perceived benefits of an environmental management standard”, BusinessProcess Management, Vol. 4 No. 3, pp. 204-13.
IM (1998), A Green and Pleasant Land? A Survey of Managers’ Attitudes to, and Experience of,Environmental Management, Institute of Managers, London.
Klassen, R.D. and Whybark, D.C. (1999), “The impact of environmental technologies onmanufacturing performance”, Academy of Management Journal, Vol. 42 No. 6, pp. 599-615.
Kolk, A., Walhain, S. and van de Wateringen, S. (2001), “Environmental reporting by the FortuneGlobal 250: exploring the influence of nationality and sector”, Business Strategy and theEnvironment, Vol. 10 No. 1, pp. 15-28.
GSCM practicesamongst UK
manufacturers
953

Lambert, D.M., Cooper, M.C. and Pagh, J.D. (1998), “Supply chain management: implementationissues and research opportunities”, International Journal of Logistic Management, Vol. 9No. 2, pp. 1-16.
Lamming, R. and Hampson, J. (1996), “The environment as a supply chain management issue”,British Journal of Management, Vol. 7, pp. S45-S62, (special issue).
Lanoie, P. and Tanguay, G.A. (2000), “Factors leading to green profitability”, GreenerManagement International, Vol. 31, pp. 39-50.
Linton, J.D., Klassen, R. and Jayaraman, V. (2007), “Sustainable supply chains: an introduction”,Journal of Operations Management, Vol. 25, pp. 1075-82.
Lippmann, S. (1999), “Supply chain environmental management elements for success”,Environmental Management, Vol. 6 No. 2, pp. 175-82.
Livingstone, S. and Sparks, L. (1994), “The new German packaging laws: effects on firmsexporting to Germany”, International Journal of Physical Distribution & LogisticsManagement, Vol. 24 No. 7, pp. 15-25.
Mentzer, J.T., DeWitt, W., Keebler, J.S., Soonhoong, M., Nix, N.W., Smith, C.D. and Zacharia, Z.G.(2001), “Defining supply chain management”, Journal of Business Logistics, Vol. 22 No. 2,pp. 1-25.
Min, H. and Galle, W. (1997), “Green purchasing strategies: trends and implications”,International Journal of Purchasing & Materials Management, Vol. 33 No. 3, pp. 10-17.
Murphy, P.R. and Poist, R.F. (2000), “Green logistics strategies: an analysis of usage patterns”,Transportation Journal, Vol. 40 No. 2, pp. 5-16.
Murphy, P.R., Poist, R.F. and Braunschwieg, C.D. (1994), “Management of environmental issuesin logistics: current status and future potential”, Transportation Journal, Vol. 34 No. 1,pp. 48-56.
Murphy, P.R., Poist, R.F. and Braunschwieg, C.D. (1995), “Role and relevance of logistics tocorporate environmentalism: an empirical assessment”, International Journal of PhysicalDistribution & Logistics Management, Vol. 25 No. 2, pp. 5-19.
Murphy, P.R., Poist, R.F. and Braunschwieg, C.D. (1996), “Green logistics: comparative view ofenvironmental progressives, moderates and conservatives”, Journal of Business Logistics,Vol. 17 No. 1, pp. 191-211.
Ogbonna, E. and Harris, L.C. (2001), “The founder’s legacy: hangover of inheritance?”, BritishJournal of Management, Vol. 12 No. 1, pp. 13-31.
Oliver, R.K. and Webber, M.D. (1982), “Supply chain management: logistics catches up withstrategy”, in Christopher, M. (Ed.), Logistics: The Strategic Issues, Chapman & Hall,London, reprinted 1992.
O’Riordan, T. (1981), Environmentalism, 2nd ed., Pion, London.
Prendergast, G. and Pitt, L. (1996), “Packaging, marketing, logistics and the environment:are there trade-offs”, International Journal of Physical Distribution & LogisticsManagement, Vol. 26 No. 6, pp. 60-72.
Preston, L. (2001), “Sustainability at Hewlett-Packard: from theory to practice”, CaliforniaManagement Review, Vol. 43 No. 3, pp. 26-37.
Preuss, L. (2001), “In dirty chains? Purchasing and greener manufacturing”, Journal of BusinessEthics, Vol. 34 Nos 3/4, pp. 345-59.
Rao, P. (2002), “Greening the supply chain: a new initiative in South East Asia”, InternationalJournal of Operations & Production Management, Vol. 22 No. 6, pp. 632-55.
JMTM20,7
954

Roberts, J.A. (1996), “Green consumers in the 1990’s profile and implications for advertising”,Journal of Business Research, Vol. 36, pp. 217-31.
Seuring, S. and Muller, M. (2008), “From a literature review to a conceptual framework forsustainable supply chain management”, Journal of Cleaner Production, Vol. 16 No. 15,pp. 1699-710.
Srivastava, S.K. (2007), “Green supply chain management: a state-of-the-art literature review”,International Journal of Management Reviews, Vol. 9 No. 1, pp. 53-80.
Strong, C. (1995), “Are grocery retail buyers making greener purchasing decisions”, GreenerManagement International, Vol. 11, July, pp. 103-12.
Tabachnick, B.G. and Fidell, L.S. (2007), Using Multivariate Statistics, 5th ed., Allyn & Bacon,Boston, MA.
Theyel, G. (2001), “Customer and supplier relations for environmental performance”, GreenerManagement International, Vol. 35, pp. 61-9.
van Hoek, R.I. (1999), “From reversed logistics to green supply chains”, Supply ChainManagement, Vol. 4 No. 3, pp. 129-34.
Waller, D.L. (1999), Operations Management A Supply Chain Approach, International ThomsonPress, London.
Welford, R. and Gouldson, A. (1993), Environmental Management and Business Strategy,Pitman, London.
Wisner, J.D. and Tan, K.C. (2000), “Supply chain management and its impact on purchasing”,Journal of Supply Chain Management, Vol. 36 No. 4, pp. 33-42.
Wu, H.-J. and Dunn, S.C. (1995), “Environmentally responsible logistics systems”, InternationalJournal of Physical Distribution & Logistics Management, Vol. 25 No. 2, pp. 20-38.
Young, A. and Kiekliewiez-Young, A. (2001), “Sustainable supply network management”,Corporate Environmental Strategy, Vol. 8 No. 3, pp. 260-8.
Ytterhus, B.E., Arnestad, P. and Lothe, S. (1996), “Environmental initiatives in the retailingsector: an analysis of supply chain pressures and partnerships”, Eco-Management andAuditing, Vol. 6 No. 4, pp. 181-8.
Zhu, Q. and Geng, Y. (2001), “Integrating environmental issues into supplier selection andmanagement a study of large and medium-sized state owned enterprises in China”,Greener Management International, Vol. 35, pp. 27-40.
Zhu, Q. and Sarkis, J. (2004), “Relationships between operational practices and performanceamongst early adopters of green supply chain management practices in Chinesemanufacturing enterprises”, Journal of Operations Management, Vol. 22, pp. 265-89.
Zhu, Q., Sarkis, J. and Geng, Y. (2005), “Green supply chain management in China: pressures,practices and performance”, International Journal of Operations & ProductionManagement, Vol. 25 No. 5, pp. 449-68.
Zhu, Q., Sarkis, J. and Kee-hung, L. (2007), “Initiatives and outcomes of green supply chainmanagement implementation by Chinese manufacturers”, Journal of EnvironmentalManagement, Vol. 85, pp. 179-89.
Zsidisin, G.A. and Hendrick, T.E. (1998), “Purchasing’s involvement in environmental issues:a multi-country perspective”, Industrial Management & Data Systems, Vol. 7, pp. 313-20.
Zsidisin, G.A. and Siferd, S.P. (2001), “Environmental purchasing: a framework for theorydevelopment”, European Journal of Purchasing & Supply Management, March, Vol. 7 No. 1,pp. 61-73.
GSCM practicesamongst UK
manufacturers
955
About the authorsDiane Holt joined Queen’s University Management School in May 2007 as a Lecturer inManagement and Sustainability as part of the university’s major initiative in sustainability.Her previous appointment was as a Principal Lecturer in Environmental Management atMiddlesex University Business School where she was based from 1996. Diane Holt is thecorresponding author and can be contacted at: [email protected]
Abby Ghobadian is Professor of Organisational Performance at Henley Business School.Previously, he was the Academic Dean of Henley Management College. Prior to joining Henleyhe was Professor of Management at Brunel University Business School.
JMTM20,7
956
To purchase reprints of this article please e-mail: [email protected] visit our web site for further details: www.emeraldinsight.com/reprints