An Empirical Analysis of the Design Case Law of the EU ...
35
ARTICLE An Empirical Analysis of the Design Case Law of the EU Member States Oliver Church . Estelle Derclaye . Gilles Stupfler Ó The Author(s) 2019 Abstract This article empirically examines the substantive decisions on all types of design rights from the courts of the 28 Member States since the entry into force of the Design Directive and the Design Regulation, up to and including August 2017. The article tests several hypotheses. Firstly, it uses descriptive statistics to examine claimants’ relative use of the type of design right, and the relationship between the type of design right as a function of the dimension of the design litigated upon. Secondly, the article uses inferential statistics to analyse the presence of differences in the proportion of designs found to be valid and infringed as a function of the level of the courts, the type of design right, the dimension of design and the level of specialisation of the judges. The article finds that overall the EU design system has been effective, and we use our analysis to highlight some further possible improvements. Keywords Design Á European Union Á Empirical Á National case law Á Inferential statistics O. Church Master of Mathematics Student, University of Nottingham, Nottingham, UK e-mail: [email protected] E. Derclaye (&) Ph.D.; Professor of Intellectual Property Law, Faculty of Social Sciences, University of Nottingham, Nottingham, UK e-mail: [email protected] G. Stupfler Ph.D.; Assistant Professor, Faculty of Science, School of Mathematical Sciences, University of Nottingham, Nottingham, UK e-mail: Gilles.Stupfl[email protected] 123 IIC https://doi.org/10.1007/s40319-019-00813-0
Transcript of An Empirical Analysis of the Design Case Law of the EU ...
ARTICLE
An Empirical Analysis of the Design Case Lawof the EU Member States
Oliver Church . Estelle Derclaye . Gilles Stupfler
� The Author(s) 2019
Abstract This article empirically examines the substantive decisions on all types of
design rights from the courts of the 28 Member States since the entry into force of
the Design Directive and the Design Regulation, up to and including August 2017.
The article tests several hypotheses. Firstly, it uses descriptive statistics to examine
claimants’ relative use of the type of design right, and the relationship between the
type of design right as a function of the dimension of the design litigated upon.
Secondly, the article uses inferential statistics to analyse the presence of differences
in the proportion of designs found to be valid and infringed as a function of the level
of the courts, the type of design right, the dimension of design and the level of
specialisation of the judges. The article finds that overall the EU design system has
been effective, and we use our analysis to highlight some further possible
improvements.
Keywords Design � European Union � Empirical � National case law � Inferential
statistics
O. Church
Master of Mathematics Student, University of Nottingham, Nottingham, UK
e-mail: [email protected]
E. Derclaye (&)
Ph.D.; Professor of Intellectual Property Law, Faculty of Social Sciences, University of Nottingham,
Nottingham, UK
e-mail: [email protected]
G. Stupfler
Ph.D.; Assistant Professor, Faculty of Science, School of Mathematical Sciences, University of
Nottingham, Nottingham, UK
e-mail: [email protected]
123
IIC
https://doi.org/10.1007/s40319-019-00813-0

1 Introduction
The Design Directive and Design Regulation1 (commonly and further referred to
as EU design legal framework) are now over 15 years old. So far little legal
empirical research has been done on the EU design legal framework, especially
on how the national courts have interpreted the substantive law. After 15 years,
there is enough litigation in the Member States to evaluate the EU legal system
empirically. There are several ways of doing so. One is to analyse the content of
the decisions in the Member States to see how the law is interpreted and if this
interpretation differs with regard to country, specialisation of the judge, and level
of court, among other factors. Another is to use descriptive and/or inferential
statistics to analyse data from design litigation using several factors. This article
performs the second type of empirical evaluation and we leave the first for a
later piece.2
This article examines the substantive decisions on all types of design rights
(registered, unregistered, national and Community hereafter abbreviated as RDR,
UKUDR, CUDR and CRDR) from the courts of the 28 Member States since the
entry into force of the Design Directive and Design Regulation until August
2017 included. With our dataset, our article tests several hypotheses. Firstly, it
paints a broad picture of the case law by determining the percentage of two- and
three-dimensional designs (hereinafter referred to as 2D and 3D) litigated upon,
how this latter percentage maps with unregistered and registered design rights,
and whether one type of design right is more litigated upon than others.
Secondly, the article attempts to project the direction of future national case law
on certain aspects of design rights in the EU, namely, the rate of invalidity and
infringement.
After setting out the methodology used – namely, the sample of data, coding and
analysis (Sect. 1) – Sect. 2.1 of this article examines claimants’ relative use of the
type of design right and also the relationship between the type of design right as a
function of the dimension of the design litigated upon. Section 2.2 analyses
qualitatively and quantitatively the decisions of the courts as a function of several
explanatory factors, with rigorous statistical tools. Specifically, it analyses the
presence of differences in the proportion of designs found valid and infringed as a
function of the level of the courts, the type of design right, the dimension of design
and the level of specialisation of the judges.
An important finding of the Economic Review of Industrial Design in Europe
(further referred to as the Economic Review), which was commissioned by the
European Commission, is that ‘‘[t]he greater the enforceability of an industrial
1 Directive 98/71/EC of 13 October 1998 on the legal protection of designs, OJ L289/28, 28 October
1998; Regulation 6/2002 of 12 December 2001 on Community designs, OJ L3/1, 5 January 2002.2 Although we can already say from our reading of the case law that overall, despite a few glitches, the
national courts are applying the Design Directive and Regulation in line with the EU courts’ case law.
123
O. Church et al.

design, the more likely a firm is to protect designs through this method, all else
being equal.’’3 By testing several hypotheses, our article examines the level of
enforceability of registered and unregistered designs rights across the Member
States and argues that the growing amount of design applications (even discounting
possible strategic applications) in the EU4 might be explained by the generally good
level of enforceability of designs in the EU Member States.
Our analysis thus shows that overall the EU design legal framework has been
effective for all types of design rights and dimension of objects. By effective, we
mean that design rights are no longer seen as the Cinderella of intellectual property
rights5 – indeed, owing to the national courts’ competent application of the
substantive law, they are used a lot. In other words: there are large numbers of
design applications and registrations, which do not appear to be strategic; litigation
numbers have grown steadily since the introduction of the EU design legal
framework; and designs are found valid and infringed in high proportions, with a
low rate of overruling.6 This is a virtuous circle, as the courts’ competent
application of the law encourages designers to apply for designs. That said, our
analysis does not mean that the system cannot be improved. As surveys indicate,
improvements in harmonising procedures both for applying and enforcing designs
are desirable.7 If such fixes were made, the EU legal design system would certainly
be used even more. Also, as our sample does not include decisions by intellectual
property offices on validity, we cannot draw conclusions as to the correct
application of the substantive law nor the effectiveness across the globality of the
EU Member States’ legal systems.8
We recognise that conclusions drawn on the basis of litigated cases cannot be
extrapolated with certainty beyond such litigated cases, as litigation is only the tip of
what could be termed ‘‘the dispute iceberg’’. As studies done for the UK Intellectual
Property Office (UKIPO) show, only a small number of designers end up pursuing
infringers, and they do not always have to actually go to court because cease and
3 European Economics (2016), p. 49 and restated at p. 83.4 Ibid, pp. 51–56 (graphs of design applications to 2013) and EUIPO annual reports at https://euipo.
europa.eu/ohimportal/en/annual-report and WIPO intellectual property statistics at www.wipo.int/ipstats/
en. While in many Member States the number of design applications has gone down, they have been
replaced by applications at EUIPO.5 Massa and Strowel (2003).6 See Fig. 4, Sect. 3, number of decisions per 100 million people, which shows a rising trend, though
plateauing in more recent years.7 European Economics (2016), pp. 169–170.8 In some countries, namely Bulgaria, Croatia, the Czech Republic, Estonia (as of 11 March 2019),
Hungary and Poland, intellectual property offices have exclusive competence in relation to validity,
although their decisions can be appealed to the courts. Our sample contains only those appeals if any.
123
An Empirical Analysis of the Design Case Law of the EU…

desist letters often are sufficient to stop the infringers from infringing.9 In addition,
it is clear that claimants rely on other forms of intellectual property to protect their
designs, as will be shown in Sect. 3.10 The data we collected relates to litigation
where at least one type of design right was relied on, but the decisions show that in
many cases claimants also relied on other intellectual property rights in addition to
relying on the design right(s). Therefore, our database is the tip of the ‘‘litigation
iceberg’’ because we did not collect decisions relying solely on intellectual property
rights other than design rights to protect designs.
1.1 State of the Art: Previous Legal Empirical Studies on EU Design Law
Empirical legal research in the field of intellectual property is burgeoning.11 As
Ilanah Fhima and Catrina Denvir noted in 2015 ‘‘[t]o give an idea of the prevalence
of such studies, a search in Hein Online for ‘empirical’ (title) and ‘intellectual
property’ (text) returned the following relevant results: Simpson and Petherbridge
(2014), Rogers (2013), Lippman (2013), Rantenen (2013).’’12 A similar search in
the Westlaw UK database at the time of submission of this article gave 39 articles,
mostly from after 2015 (including that of Fhima and Denvir). In the field of designs,
empirical legal research is only in its embryonic stage. None of the papers cited by
Fhima and Denvir – and none of those found in this search in Westlaw UK – is
about design law, except one on the case law of the EU courts.13
Empirical legal studies on designs are very recent and have been commissioned
by government bodies. Most studies have been commissioned by the UKIPO and
they remain largely focused on the economics of designs, including on applications
and registrations rather than the law.14 They also examine mainly the UK situation.
Within those studies very little has been done by way of case law analysis. The most
9 Baumgart et al. (2018), p. 5 (‘‘However, it appears that disputes are not as common as the incidence of
infringement itself. While most designers and design rights owners had experienced infringement – and
experienced revenue losses as a consequence – fewer than 10% of our respondents had been involved in a
dispute. […] Most infringers will cease and desist when challenged by the design right owner, usually
permanently. However, larger companies were more likely to ignore an infringement claim or allege that
a design wasn’t valid’’). A previous UKIPO study also suggested this, see Carter-Silk and Lewiston
(2012), p. 71. European Economics (2016), p. 169 also reports that some survey respondents chose not to
sue because of the cost.10 See also for the UK, The Big Innovation Centre (2012), Executive Summary, p. 4.11 Fhima and Denvir (2015), p. 313, note 19.12 Ibid.13 Cornwell (2016).14 See Baumgart et al, supra note 9. In 2011, the UKIPO published three studies on designs in the UK
and one comparing the UK with a few other countries, namely: BOP Consulting (2011); Moultrie and
Livesey (2011); Haskel and Pesole (2011); Bascavusoglu-Moreau and Tether (2011). Two other reports
from UKIPO came out in 2012: Carter-Silk and Lewiston, supra note 9 and Thompson et al. (2012).
123
O. Church et al.

detailed study in this respect dates from June 201815 and was commissioned to
remedy the lack of data on design infringement in the UK, as noted by previous UK
commissioned research reports.16 Part of this 2018 study analyses UK case law from
2013 to 2017.17 Previous legal empirical research was done by one of the authors of
this article in 2012 on all published UK decisions from 1999 to 2012.18 We are not
aware of other empirical legal studies on national design litigation in other Member
States.19 At the EU level, the European Commission commissioned two studies with
the aim to inform a possible reform of the EU design legal framework, namely, the
Legal Review of Industrial Design in Europe20 (further referred to as Legal Review)
and the Economic Review,21 but these only address some aspects of the design legal
regime – including to some extent national case law – and do not review the
situation in all Member States.22 The Legal Review arguably also suffers from some
deficiencies which means it may not be a totally reliable basis.23
In summary, no systematic empirical study has been made of how the national
courts of all the Member States apply the directive and regulation. This article aims
to fill this gap by presenting a statistical analysis of a large database of design
decisions across the EU.
1.2 Hypotheses
Our article looks at 19 hypotheses. We chose these hypotheses to test whether the
EU design legal framework is effective – i.e. is used by a large number of litigants,
and the main aspects of substantive law (validity and infringement) are well applied
by courts. This means checking whether claimants litigate on all design types (2D
and 3D), and design right types (RDR, CRDR, CUDR, UKUDR); whether courts
generally uphold the validity of designs (which shows that claimants do not apply
for designs or sue frivolously); whether courts generally apply the law correctly
15 Baumgart et al, supra note 9.16 Moultrie, supra note 14; and Collopy (2014), 81–82 as noted in Baumgart et al., supra note 9, p. 7.17 See Baumgart et al, supra note 9, p. 99.18 Derclaye (2013).19 At least in English. No relevant ones published post-2002 apart from the above mentioned UKIPO
commissioned studies were cited in the Economic Review’s bibliography.20 DG Growth, Legal Review on Industrial Design Protection in Europe, Final Report, MARKT2014/
083/D, 2016, at http://ec.europa.eu/growth/content/legal-review-industrial-design-protection-europe-0_
en.21 See supra note 3.22 The Legal Review examines 15 Member States namely Austria, the Czech Republic, Denmark,
France, Germany, Italy, Lithuania, Luxembourg, the Netherlands, Poland, Portugal, Spain, Slovenia,
Sweden and the United Kingdom. See Legal Review, 19. The Economic Review examines all Member
States, but its coverage varies for every question: it is sometimes comprehensive, sometimes only partial.23 Hartwig (2018), p. 336.
123
An Empirical Analysis of the Design Case Law of the EU…

(shown by a low rate of overruling, and by not differentiating between 2D and 3D
designs); and whether specialised courts are biased or not.
Descriptive statistics
H1 The vast majority of designs litigated24 upon are 3D.
H2 CUDR litigation relates in majority to 2D designs.
H3 The majority of 2D design litigation is on clothing.
H4 There is more litigation overall on RDR than CRDR.
H5 In the big markets, claimants prefer to litigate on CRDR than RDR.
Inferential statistics
H6 Decisions are more likely to be affirmed than reversed.
H7 Courts are more likely to find designs valid than invalid.
H8 Designs are not more likely to be found valid by lower courts than higher
courts.
H9 The proportion of designs found valid by courts is stable over time. The
proportion of designs found infringed is stable over time.
H10 The proportion of designs found valid by courts is higher for registered
designs.
H11 The proportion of designs found valid by courts does not depend on their
dimension.
H12 Designs are more likely to be found infringed than not infringed.
H13 Unregistered designs are more likely to be found infringed than registered
designs.
H14 Designs registered nationally are no less likely to be found infringed than all
other designs’ rights.
H15 First instance courts do not declare infringements more often than courts of
appeal and supreme courts.
H16 Higher courts find more designs which are valid but not infringed than
designs which are valid and infringed.
H17 The rate of overruling is higher if the judge/court is not specialised.
24 By ‘‘litigation’’, we mean a dispute between the same parties over the same design that does or does
not go to all court levels. So, a litigation can mean in some cases just one decision, and in others it can
mean two or three, sometimes four decisions if the case goes on remand to the court of appeal after having
gone to the Supreme Court.
123
O. Church et al.

H18 The amount of designs held valid is higher if the judge/court is specialised.
H19 The amount of designs held infringed is lower if the judge/court is
specialised.
1.3 Methodology
1.3.1 Sample
Our sample consists of decisions on substantive design law of the judicial and
administrative courts at all levels25 in the 28 Member States that have been
published between 28 October 2001 (the date of entry into force of the Design
Directive) and 31 August 2017 inclusive.26 This covers roughly 15 years of
application of the EU design legal framework. The decisions are those which have
been handed down only on substantive aspects of design law (namely Arts. 1–13
and 15 of the Design Directive and corresponding articles in the Design
Regulation).27,28 The relevant publicly accessible legal databases in every Member
State have been used as well as the European Union Intellectual Property Office
(EUIPO) database of national case law.29 For the UK and Ireland, Bailii.org, Lawtel
and Westlaw were used. In Belgium, the Netherlands and Spain, we used the public
databases and completed the data with, respectively, the Jura, boek9.nl and
Aranzadi databases, because the public databases are far from complete. Westlaw
was also used to find national decisions from EU Member States reported in relevant
academic journals, namely, the European Intellectual Property Review (EIPR) and
the International Review of Intellectual Property and Competition Law (IIC).30
25 Apart from France, where first instance decisions were not gathered unless there was an appeal. For
more details, see below in this section.26 No decisions were found in Luxembourg.27 These include only decisions on the merits and preliminary proceedings, not decisions which are
purely procedural or criminal proceedings. Court decisions only sending references to the Court of Justice
of the European Union (CJEU) – i.e. the national decision is only stating the questions and there is no
other substantial discussion – were also excluded.28 In some countries, first instance and sometimes second instance decisions are not published, so we
gathered information from second and third instance decisions when we could and inputted this
information when coding.29 See https://euipo.europa.eu/eSearchCLW/#advanced/national.30 We did not use the design database of Darts-IP (Darts), because Darts is a private subscription-only
database not generally available to academics via their university library subscriptions, and the price of
such a subscription was not acceptable to our funding body. In any case, the Darts design database’s
coverage is less comprehensive than ours for some countries, as evidenced by an examination of the data
published in the Legal Review extracted from the Darts database itself, and by a comparison of our
dataset with the information on Darts dataset on the Darts web site. According to Darts web site as of 6
November 2018, their database has case law from Bulgaria since 2012, while our first case dates from
2011; Slovakia since 2012 compared with us since 2006; Sweden since 2010 compared with us since
2002. In addition, the Darts web site states that for Austria, Croatia, Luxembourg and Slovakia the
number of design decisions is high but not optimal. See https://www.darts-ip.com/how-we-do-it/. It is of
course possible for other researchers to carry out the same research as in this article using the Darts
database to confirm or invalidate it.
123
An Empirical Analysis of the Design Case Law of the EU…

Our data consists in 2255 court decisions overall. There are 1408 litigated cases
i.e. not counting the appeals to second and third instance courts nor preliminary
decisions if they are followed by a decision on the merits. These numbers take into
account all the design rights the claimant relied on in the same litigation, and so are
higher than the number of decisions handed down by a court as such. In other words,
a court can decide in a single judgment that several design rights are infringed in a
single court case, so it makes several decisions in a single judgment. The number of
judgments (therefore not splitting the judgment to give all decisions it contains per
type of design right) is as follows: 2113 judgments and 1315 litigated cases.
Decisions involving designs which were not based on UKUDR, CUDR, CRDR
or RDR were not included in the sample.31 Decisions from the intellectual property
offices (IPOs) were excluded not only because of their sheer number (and often lack
of availability) but also because they do not decide infringement. Decisions dating
from 28 October 2001 onwards, but applying the old law, were not included in the
sample unless they applied both the old law (on validity) and the new law (on
infringement). In particular, French decisions applying the old law wrongly – i.e.
where the new law should apply – were not included in the sample.32
Cost constraints meant that it was not possible to collect unpublished/unreported
decisions; in any case, a substantial proportion of unreported decisions are either
irrelevant for our purposes (e.g. purely procedural), or less interesting because they
do not contain much discussion of the law. Such decisions would thus have
contaminated our sample. Finally, it cannot be excluded that in certain countries the
number of decisions we actually found is lower than the number of decisions
reported, because the search functions of public databases make it difficult to reach
all the relevant decisions. It is nonetheless our appreciation that the size and scope
of our database allow us to draw reliable statistical conclusions as to how courts
apply the law.
31 In other words, decisions based on protection and/or infringement of a design only by copyright, only
by patent, only by unfair competition law, or only by trademark are not included. But decisions involving
one or more of those four design rights and also involving copyright, patent, trade mark, unfair
competition or other rights are included in the sample.32 This means that many French decisions were excluded, as for a relatively long period at the start of the
new system (a few years), some French courts misapplied the EU design legal framework. Whereas they
could have been included in order to obtain statistical information on the number of litigations, type of
design, type of design right, judge specialisation etc., these decisions were excluded because they were
not helpful to determine the application of the law. Because of the large amount of decisions in France
and our budget limitations, we did not collect first instance court decisions which were not appealed.
Since the number of decisions in France is the highest among all Member States even with those decisions
excluded, we decided that the French data should be kept for our analysis.
123
O. Church et al.

1.3.2 Data
The relevant categories of data collected for each decision are as follows: names of
the parties; dimension of the design (2D or 3D); type of design (e.g. textile pattern,
footwear, label, furniture); date of the decision; court level; whether the decision is
affirmed or overruled; whether the courts or judges are specialised in intellectual
property law or not; type of design right (RDR, CRDR, CUDR, national
unregistered, namely only UKUDR33); whether the design was found invalid by
the court; whether the design was found infringed by the court; whether the claimant
sued on the basis of other intellectual property rights or unfair competition; and
whether – over the period under review – a (or several) national measure(s) in-
creased or decreased the cost of going to court to litigate designs.
1.3.3 Coding
The gathering, reading and summarising of the decisions was done by research
assistants34 who were all given the same Excel template with the same categories of
data (as described above in Sect. 1.3.2) and the same detailed instructions. These
included how to search for decisions in databases, what information to summarise in
a judgment, and what data to include in the tables and how. The assistants first
summarised the main facts and rulings of the decisions in English. For each decision
and each category, information which was not available or not clearly discernible
from the decision (e.g. type of design, type of design right, whether the judge was
specialised) was reported as ‘‘unknown’’. Where the category of data was not
applicable – which was the case in a small proportion of the decisions for the
‘‘Valid’’ and ‘‘Infringed’’ items – it was reported as ‘‘not applicable’’.35 The data
was then coded, imported and analysed using the open-source statistical software
R.36
As an example, here is one line (uncoded) of the database showing an Austrian
case:
33 In the EU, the concept of national unregistered design right only exists in the UK.34 The assistants were all law students with training in intellectual property law or practising lawyers
specialised in intellectual property law. They were all native speakers of the language of the decisions
they were assigned to work on (e.g. Dutch/Flemish assistants summarised Dutch decisions, French/
Belgian francophone assistants translated French decisions) with excellent command of English.35 Such decisions were then used in the statistical analysis unless the focus was on the particular
category(ies) where an ‘‘unknown’’ or ‘‘not applicable’’ was reported, in which case they were discarded.36 A coding manual, making the link between the database of decisions in Excel and its coded version in
R, was elaborated jointly by the authors. Pilot coding was conducted by E. Derclaye and G. Stupfler prior
to final coding to clear potential issues concerning the coding and ensure the reliability of the analysis.
Problematic instances were captured by the software and discussed and resolved by the team. The final
coding was done by O. Church and E. Derclaye on the basis of information provided by research
assistants in English in the Excel tables. The information in the tables was double-checked by E. Derclaye
on the basis of the assistants’ summaries of the decisions and queries resolved between assistants and E.
Derclaye. Detailed information about how the coding was done is recorded in the coding manual attached
to the database and is available on request.
123
An Empirical Analysis of the Design Case Law of the EU…

No
.N
ame
Dim
ensi
on
Des
ign
type
Dat
eC
ou
rtA
ffirm
edo
r
ov
erru
led
Sp
ecia
lise
dju
dg
e/
cham
ber
/co
urt
Val
idIn
frin
ged
Ty
pe
of
des
ign
rig
ht
Oth
erri
gh
ts
inv
olv
ed-
1O
LG
9.1
2.2
00
4
1R
18
3/0
4w
‘‘R
ain
dan
ce’’
2D
Sh
ow
er
hea
d
9D
ecem
ber
20
04
Co
urt
of
app
eal
No
No
Yes
Yes
CR
DR
No
ne
123
O. Church et al.

1.3.4 Analysis and Limitations
We use statistical methodology to analyse the data in two ways: we start by using
descriptive statistics to paint a general picture of the data; and we then employ
inferential statistical techniques to model relationships within our data. Our results
either confirm or invalidate our hypotheses. When possible our results also confirm
or reject results from the existing empirical literature on designs. To avoid data
being counted twice and so leading to false results, we counted litigations rather
than decisions where appropriate (H1–5). But to find out the proportion of
specialised judges handing down decisions, or how many decisions were valid or
infringed, we counted all decisions (H6–19).
A very fine stratified analysis is not advisable in the current state of our database:
due to low sample sizes, it is not reasonable to, for example, consider the behaviour
of the supreme courts on unregistered designs only, or consider separately each
category of design (fashion, automotive, household, outdoors…).37 Similarly,
certain factor levels sometimes have little to no data, potentially resulting in
unbalanced sample sizes as well as in difficulties in comparing results between
countries.38More generally, the samples for some countries are very small, which in
most cases prevents us from calculating insightful country-specific statistics. This is
why our statistics typically relate to the data for the 27 Member States overall.39
2 Results
2.1 Descriptive Statistics
Hypotheses 1–5 examine the proportion of 2D and 3D designs in litigations, the
relative proportions of type of design right relied upon by claimants and the
relationship between type of design right and dimension of the design litigated
upon.
The hypothesis that the vast majority (90.9%)40 of designs litigated upon are 3D
is confirmed. Thus, a corresponding 9.1% of designs litigated upon are 2D
designs.41
37 This will, of course, become possible in the future with updated versions of the database containing
more data.38 For instance, only 168 decisions dealt with two-dimensional designs, compared to 1872 dealing with
three-dimensional designs. This amounts to only 8.2% of decisions focusing on two-dimensional designs:
in Finland, this is even 0% as no decisions were concerned with two-dimensional designs, making this
factor impossible to use in modelling Finnish decisions only. The confidence in statistical results on two-
dimensional designs is therefore automatically lower than in those on three-dimensional designs.39 Only seven Member States saw more than 50 litigations over our observation period: France (341),
Germany (127), Italy (173), the Netherlands (193), Romania (51), Spain (64) and the UK (63).40 All percentages are reported discounting the unknowns. Each time, in a footnote, we add the
percentage of unknowns.41 In 7.6% of cases the dimension is unknown.
123
An Empirical Analysis of the Design Case Law of the EU…

The second hypothesis, that CUDR litigation relates in majority to 2D designs, is
not confirmed. Most CUDR litigation (78.8%) is on 3D designs42 and 21.2% of
CUDR are litigated on 2D designs. The preferred design right for 2D designs
(42.2%) is RDR.43 Besides, in this sample of data, we found that given that a design
was 2D, it was litigated upon a CUDR in 39.4% of the litigations.44 The proportion
of CUDRs litigated upon globally is 15.9%.
All these findings tell two things. First, both the litigation and the registration
statistics would seem to show, again unsurprisingly, that copyright retains its full
role for 2D designs. Designers probably sue on the basis of copyright more often
than CUDR for 2D designs, which makes sense as copyright is the traditional
protection for such designs and is easier to obtain for 2D designs than 3D designs in
some Member States.45 Second, the CUDR is useful for 3D designs too despite its
short (three-year) term of protection. This confirms practising lawyers’ statements46
and industry surveys47 that CUDR is a valuable tool for all types of designs,
including 3D designs.
Use of (including litigation upon) CUDR for 3D designs should be higher in
countries where copyright only protects works of applied art if they display artistic
merit, thus very rarely because this protection requirement is higher than the standard
lower requirement of originality for copyright works (Germany, Italy, Portugal and
the UK are the best examples). Our litigation statistics show at the 95% confidence
level (the p value is\ 0.001, using a test for comparing proportions) that this may
very well be the reason.48 Indeed, the proportion of 3D designs litigated upon that are
CUDR is: Germany 17.6%, Italy: 20.1%, Portugal: 10%, UK: 9.3%.49 Compared
with the three countries with the next highest amount of litigation – namely Bulgaria
(2.3%), Poland (5.8%), Romania (2%) – which protect 3D designs at the normal level
of originality, the proportions in Germany, Italy, Portugal and the UK are
substantially higher. Only the Netherlands is higher (20%). By comparison, the
overall proportion in all the Member States is 13.9%.50 For the UK however, the low
percentage of CUDR litigation (10.4%) makes sense as this is compensated by the
42 Unknowns 6.5%.43 Unknowns 2.8%.44 Unknowns 2.8%.45 In Portugal, Italy and the UK, for instance, works of applied art must also display artistic merit, a
requirement that the copyright holders of other works do not have to prove.46 Based on conversations with D. Stone, from Allen and Overy LLP and S. Ashby, from Wiggin LLP.47 European Economics (2016), p. 70 and Fig. 6.23 (‘‘There were no respondents indicating that they
protected their designs through copyrights. Going from bottom to top, the results presented rely on 84, 79,
83, 82, 0, 86 and 91 responses’’) shows that designers/design companies use CUDR as much as the CRDR
and both CRDR and CUDR a bit less than RDR. The survey also shows that respondents use trade marks,
both EUTM and national, more than designs rights to protect their designs. ibid, 104–106 and Fig. 7.6 and
7.7 shows that designers/design companies often prefer unregistered design rights in majority to avoid
cost, procedural complexity and the administrative burdens of registration. Surveys for the figures are
respectively based on 74 and 58 replies. The relative strength of the reasons (e.g. unregistered design is
well-suited for the lifecycle) vary per sector. The Economic Review details this at pp. 104–106.48 We decided to leave this inferential statistic here since it is clearly linked to the descriptive statistics.49 Unknowns: Italy 7.3%, Portugal 10%, 0% elsewhere.50 Unknowns 2.2%.
123
O. Church et al.

high number of UKUDR litigation, namely 53.2% UKUDR (compared to 19.5%
RDR and 16.9% CRDR).51 For the other countries, a possible explanation could be
that claimants do not think of using CUDR instead of copyright for 3D designs
because they are unaware of it (something that seems confirmed at least for the UK52)
or else that these are also registered (1% of claimants rely on CUDR and RDR, 2.35%
rely on CUDR and CRDR). Interestingly, in France, the country of the ‘‘unity of art’’
– where, before the Design Directive, copyright and design right were assimilated
(namely that if copyright’s conditions were fulfilled, design rights were too and vice
versa) - while copyright remains well used, CUDR is used substantially too (in 13.7%
of the litigations). But CUDR is hardly used in combination with CRDR or RDR (in
just one litigation for each combination).
The third hypothesis that the majority of 2D design litigation relates to clothing is
confirmed: we find that 50.5% of 2D design litigation relates to clothing (note that
we included footwear in clothing).
The proportion of 2D designs litigation related to clothing as opposed to other
types of products is shown in the table below.
Country % of clothing in 2D Number of decisions with 2D designs
Croatia 33.3 3
Denmark 66.7 3
France 38.4 26
Germany 38.5 13
Italy 60.0 20
Netherlands 58.8 17
Portugal 50.0 2
Spain 55.6 9
UK 100 2
In the other countries which have 2D litigation, i.e. in two-thirds of the Member
States, none relates to clothing. This may be explained by the reliance on copyright.
One related interesting finding is that Italy has the most litigation on 2D design in
the sample (20 litigations with only one case going to the court of appeal) and
mainly in the field of fashion (15 out of 20 i.e. 75%). It does not have the highest
percentage of 2D design litigation proportionately per country but compared to the
51 No unknowns.52 In the 2018 UKIPO report, supra note 9, the highest proportion of respondents replying about their
awareness of intellectual property rights (800 replies) was for the CUDR: 34% were unaware of it
compared with 29% for UKUDR, 26% for CRDR, 9% for UKRDR; copyright, patent and trademarks
were all below 1%. See also BOP consulting, supra note 14, pp. 19–20 stating that awareness of design
rights seems to be higher in Germany than UK. In the UK, while designers are aware of them, they often
do not use them because they do not know the details of the law. These findings are based on 26
interviews with designers, design companies, lawyers and economists and staff working at WIPO and
design trade associations in the UK, France, Germany. Ibid, p. 4.
123
An Empirical Analysis of the Design Case Law of the EU…

other two countries with a comparable amount of litigation i.e. the Netherlands
(8.3%) and Germany (10.2%), Italy’s is somewhat higher (11.9%). In addition, 18 of
20 claimants are Italian. This finding is not surprising as fashion is a major part of
Italy’s economy.53
The fourth hypothesis that there is more litigation overall on RDR than on CRDR
is confirmed. The fifth hypothesis that CRDR is more popular to litigate upon is not
confirmed for the big markets because it is not the case for France, Germany and the
UK, even if it is the case for Italy, the Netherlands and Spain.
There is more litigation on RDR (47.4%) than on CRDR (33.7%).54 The
Economic Review has relatively similar proportions based on 34 answers to a
survey asking claimants what forms of protection they used to initiate legal action.55
However, RDR is very popular overall compared to CRDR in countries which have
a smaller market. It makes sense since many markets are mainly or purely national.
The Economic Review draws this conclusion for filings.56 Our data tends to show
that this is also reflected in the litigation. That said, RDR holds quite an important
place in the Member States where there is the most litigation, namely, France
(67.6% of the litigation is on RDR as opposed to 18.8% CRDR57), Germany (43.9%
RDR as opposed to 35.6% on CRDR58), Italy (26.1% RDR as opposed to 44.7%
CRDR59), the Netherlands (22.1% RDR as opposed to 51.2% CRDR60) and Spain
(39.1% RDR as opposed to 47.8% CRDR61).
In the UK, UKUDR is extremely popular as claimants rely on it in 53.2% of the
litigation. So UKUDR outdoes CUDR (10.4%), RDR (19.5%) and CRDR
(16.9%).62 In addition, the proportion of litigation in the UK based on more than
one design right, whatever the combination, is 15.9%.63 There is not enough data to
see if the reliance on UKUDR increases or decreases over time, as the UK sample is
too small. A potential explanation of the success of UKUDR over at least CUDR is
that it generally lasts 10 years64 as opposed to CUDR which lasts three years, and
UKUDR can be more interesting/protective on certain aspects for the claimants
(mainly, no requirement of visibility for component parts, fewer grounds of
53 See e.g. https://fashionunited.it/statistiche-moda-italia; Focus sulla moda (2012–2017), Mediobanca,
Milan, 14 February 2018, ca. 4% of Italy’s GDP.54 Unknowns 2.8%.55 European Economics (2016), pp. 120–121 Table 8.4: data based on designers/design companies
surveyed say they use 26% RDR, 21% CRDR, 12% CUDR, national unregistered design 6% (copyright
18%, national trade mark 12%, EU trade mark 9%, 3% are unsure and 6% prefer not to answer).56 European Economics (2016), p. 83.57 Unknowns 3.4%.58 No unknowns.59 Unknowns 7.4%.60 Unknowns 3.3%.61 Unknowns 1.4%.62 No unknowns.63 No unknowns.64 Sec. 216 UK Copyright Act.
123
O. Church et al.
invalidity, and the infringement test can be more favourable as in some cases an
average consumer test is used).65
2.2 Inferential Statistics
We now move to the inferential statistics. The statistical significance of our results
is analysed at the 95% confidence level (or equivalently, at the 5% type I error
level). Note that in all inferential statistics but one (see Sect. 2.2.3., hypothesis 15),
including or leaving out France does not change the results. We thought it was
important to check this because, as we stated in Sect. 1.3.1, France has by far the
most litigation compared to the other Member States and 100% of the cases were
appealed to the Court of Appeal, so it may have skewed the results.
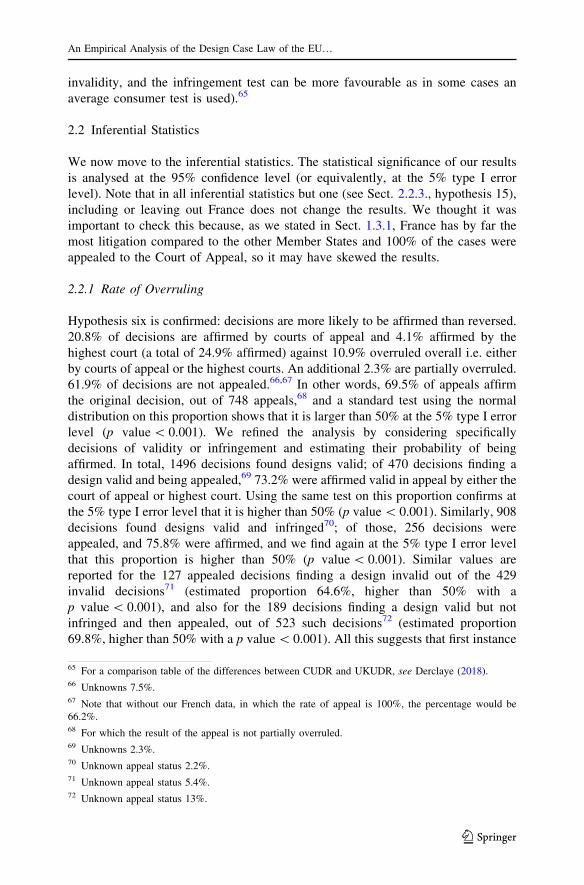
2.2.1 Rate of Overruling
Hypothesis six is confirmed: decisions are more likely to be affirmed than reversed.
20.8% of decisions are affirmed by courts of appeal and 4.1% affirmed by the
highest court (a total of 24.9% affirmed) against 10.9% overruled overall i.e. either
by courts of appeal or the highest courts. An additional 2.3% are partially overruled.
61.9% of decisions are not appealed.66,67 In other words, 69.5% of appeals affirm
the original decision, out of 748 appeals,68 and a standard test using the normal
distribution on this proportion shows that it is larger than 50% at the 5% type I error
level (p value\ 0.001). We refined the analysis by considering specifically
decisions of validity or infringement and estimating their probability of being
affirmed. In total, 1496 decisions found designs valid; of 470 decisions finding a
design valid and being appealed,69 73.2% were affirmed valid in appeal by either the
court of appeal or highest court. Using the same test on this proportion confirms at
the 5% type I error level that it is higher than 50% (p value\ 0.001). Similarly, 908
decisions found designs valid and infringed70; of those, 256 decisions were
appealed, and 75.8% were affirmed, and we find again at the 5% type I error level
that this proportion is higher than 50% (p value\ 0.001). Similar values are
reported for the 127 appealed decisions finding a design invalid out of the 429
invalid decisions71 (estimated proportion 64.6%, higher than 50% with a
p value\ 0.001), and also for the 189 decisions finding a design valid but not
infringed and then appealed, out of 523 such decisions72 (estimated proportion
69.8%, higher than 50% with a p value\ 0.001). All this suggests that first instance
65 For a comparison table of the differences between CUDR and UKUDR, see Derclaye (2018).66 Unknowns 7.5%.67 Note that without our French data, in which the rate of appeal is 100%, the percentage would be
66.2%.68 For which the result of the appeal is not partially overruled.69 Unknowns 2.3%.70 Unknown appeal status 2.2%.71 Unknown appeal status 5.4%.72 Unknown appeal status 13%.
123
An Empirical Analysis of the Design Case Law of the EU…

courts generally have applied the law correctly or at least that courts of appeal were
not minded to overrule the lower court decisions. This also means that courts have
agreed with claimants and that claimants have been likely to have their design rights
found valid and infringed in appeal. From this it is possible to say that it has been
worthwhile for parties to register or use designs as a type of protection for their
creations – i.e. the EU system has been so far effective.
2.2.2 Validity
Hypothesis seven is confirmed: courts are more likely to find designs valid than
invalid. Overall, courts find 77.7% of design rights (whether registered, unregis-
tered, national or Community) valid. In addition, the proportions by type of design
right found valid are very similar: RDR 75.8%, CUDR 75.1%, CRDR: 81.4% and
UKUDR 87.5% were found valid. Besides, 80.6% of those litigations where the type
of design right is unknown found the design valid.73 The percentages can also be
calculated at the different court levels:
Hypothesis eight is confirmed: designs are not more likely to be found valid by
lower courts than higher courts (Table 1).
A Pearson Chi-squared test (with two degrees of freedom) reveals that at the 5%
type I error level, the probability of a design being declared valid does not depend
on court level (p value: 0.051). Removing the French data, in which all the decisions
are appealed, does not change this statistical conclusion (p value: 0.065). We
wanted to ensure that there was no difference when leaving out France because all
the French decisions in our data are appealed, and France represents the largest
number of decisions in our data, so it might have skewed the results. A further
comparison test of proportions between first instance courts and courts of
appeal/supreme courts (France included) allows us to conclude that at the 5%
type I error level designs are not more likely to be found valid by lower courts than
the higher courts, that is courts of appeal and supreme courts (p value: 0.363).
These findings may also tell us a few other things. First, they can tell us that
courts are generally pro-right holder (the proportion of design rights found valid is
larger than 50% at the 5% type I error level, p value\ 0.001). It is generally
difficult to determine whether courts in countries typically seen as pro-IPR holder
(or pro-protection) are more likely to find designs valid. However, according to a
UKIPO report, the perception of interviewees is that German and French courts are
pro-right holder when it comes to designs, and that UK courts are not seen as
Table 1 Number of valid/invalid decisions per court level (EU-wide)
Invalid Valid % Valid
First instance 237 843 78.1
Court of appeal 153 566 78.7
Supreme/highest court 39 87 69.0
73 The type of design right was unknown for 2.8% of decisions.
123
O. Church et al.

‘‘design-right-friendly’’.74 We also asked academics specialised in IP law of certain
major countries (Germany, Italy, Poland, Portugal, Spain) whether they thought
their judges were pro-right holder or not.75 Most of our data on the rate of validity
confirm these perceptions for the following pro-intellectual property right holder
countries: Germany 87.3% (on 221 decisions); Italy 74.1% (on 193 decisions);
Spain 74.3% (on 86 decisions); France 75.1% (on 607 decisions); although the data
for Poland (61.5% on 39 decisions) does not. As to the two countries which we
investigated and accordingly are not pro-intellectual property right holder, our data
does not statistically confirm the perceptions for Portugal (41.7% on 12 decisions –
note also that validity is unknown in half the decisions in Portugal),76 and our data
invalidates the hypothesis for the UK (83.5% on 91 decisions).
Second, our results tell us that not having an ex ante full-blown examination like
in patent law does not mean that designs are more likely to be invalid, and therefore
that it is not necessary to introduce such ex ante examination. The Legal Review
was of this opinion already on the basis of the 15 Member States reviewed.77 We
can confirm this is the case for all Member States. According to our data, not having
an ex ante examination (most Member States do not have one) does not seem to
affect the validity of designs.
Third, they can tell us that the designs system has been effective: designs are
overall registered genuinely, i.e. not strategically in the sense that registrants do not
intentionally file invalid designs.78 By contrast, Filitz et al. have found out in
relation to Germany via a qualitative study (interviews with managers of German
firms and their legal advisors), that at least one industry – the footwear industry –
appears to use designs mostly strategically.79 More research is needed to find out
whether other industries act this way (our coding was not sufficiently precise and
consistent across countries and industries to determine this), but according to their
same qualitative study, the German automotive and power and gardening tools
industries do not register designs strategically. Our data indicates that 81.2% of
footwear designs litigated upon were found valid (out of 101 data points in all
Member States80) and 69.6% of these valid designs were found infringed (out of 79
valid designs in all Member States). The sample size, however, is too low for us to
74 BOP Consulting, supra note 14, p. 21. The report is based on 26 interviews with designers, design
companies, lawyers and economists, staff working at WIPO and design trade associations in the UK,
France, Germany. The same perception about UK courts is reported in Carter-Silk and Lewiston, supra
note 9, p. 71 (this part of their study is based 55 responses to a survey).75 For Italy, Germany, Poland, Portugal and Spain respectively, we asked one academic in each of these
countries for their opinion (email correspondence on file with the authors).76 The p values are\ 0.001 for Germany, Italy, Spain and France, 0.100 for Poland and 0.386 for
Portugal.77 Legal Review, p. 109.78 Even in countries where the competence on validity belongs exclusively to intellectual property offices
or is shared between them and the courts, because the decisions of intellectual property offices are often
appealed to the courts and those decisions are included in our sample.79 Filitz et al. (2015), pp. 1199–1201.80 An additional 19 had an unknown validity result.
123
An Empirical Analysis of the Design Case Law of the EU…

reach a meaningful conclusion as to whether these observed increased percentages
of valid and infringed decisions for footwear designs are significant.
Hypothesis nine is confirmed: The proportion of designs found valid by courts is
stable over time, and likewise for the proportion of designs found infringed.
It clearly appears from Fig. 1 that after 2006, the proportion of designs being
declared valid in court has essentially remained stable, and likewise the proportion
of infringed designs has remained stationary over the observation period. We
therefore decided to drop time as an explanatory variable for the proportions of
valid and infringed designs at European level. It is not surprising that the
proportions of designs found valid and found infringed are stable over time as there
has not been an EU decision during the observation period that would have had a
substantial effect over the rate of validity or infringement.
Hypothesis 10 is not confirmed: The proportion of designs found valid by courts
is not higher for registered designs. Total counts of valid/invalid designs depending
on type of design right are reported in Table 2. A Pearson Chi squared test (with
three degrees of freedom) reveals that, at the 5% type I error level, the probability of
Fig. 1 Observed proportion of valid designs (solid line) and infringed designs (dashed line) per year,from January 2004 to August 2017 included
123
O. Church et al.

a design being declared valid depends on the type of design right (p value: 0.015).
More precisely, designs registered at EU level were estimated to be more likely to
be declared valid than other designs, and so are UK unregistered designs. In terms of
inferential statistics, the probability of a registered design (RDR/CRDR) being
found valid, estimated at 77.9%, is not, at the 5% type I error level, higher than the
probability of a unregistered design (CUDR/UKUDR) being found valid, estimated
at 77.0% (p value: 0.394).81 The first finding is puzzling because the procedure at
the EUIPO to register designs is not strict, and this is also the case in most Member
States, so whether the design is registered at national or EU level should not matter
as regards its validity. One reason for the high percentage of valid UKUDR could be
that the claimant can a posteriori tailor his design to what has been infringed, and so
make it so limited that it will rarely be invalid as the part relied on is so small.
Our rate of validity and of decisions affirmed on validity (Sect. 2.2.2 above)
show that designers/design companies are generally confident that their designs are
valid and are therefore not afraid to sue infringers. Our data confirms a finding of a
survey of 135 respondents in the UK who were asked why they chose not to start
legal proceedings. The least likely reason was uncertainty about validity of their
registered design right (8.9%) or unregistered design right (3%).82 Our data suggests
that this reason holds well in all Member States. That said, national surveys would
be welcome to confirm our findings. Our findings at the same time go against those
of the Economic Review which state that some designers may be reluctant to bring
proceedings as they are uncertain of the validity of their designs.83
Finally, we queried whether the dimension of the design was a factor in finding
validity. The total counts of valid/invalid designs depending on dimension of
designs are reported in Table 3. A Pearson Chi-squared test (with one degree of
Table 2 Number of valid/invalid decisions per type of design right (EU-wide)
Type of design right Invalid Valid %Valid
CUDR 66 199 75.1
RDR 237 741 75.8
CRDR 110 481 81.4
UKUDR 6 42 87.5
81 14.2% of registered designs (aggregate number of national and Community) have unknown validity
and 12.3% of unregistered designs (aggregate number of national and Community) have unknown
validity.82 See Baumgart, supra note 9, p. 71, ‘‘Q29: If you chose not to start proceedings, why? Please select all
that apply. If not applicable, please skip and move to the next question.’’83 European Economics (2016), pp. 111–112 and 116 (‘‘The key similarity between the UK, Germany
and the EU (OHIM) enforcement procedures is that none of them checks the validity or novelty of
national or community designs while registering them. Hence, some designers might be hesitant in taking
their infringers to court for the sheer uncertainty regarding the proof of originality of their designs.’’) but
the Economic Review’s suggestion could be extrapolated to most Member States as most do not have an
ex ante examination either, only five do. On this last point, see Legal Review, p. 109.
123
An Empirical Analysis of the Design Case Law of the EU…

freedom) reveals that, at the 5% type I error level, the probability of a design being
declared valid does not depend on the dimension of the design (p value: 0.677).
Hypothesis 11 is confirmed: The proportion of designs found valid by courts does
not depend on their dimension. Therefore, the intuition that 3D designs would be
found invalid more often than 2D designs, because they are functional and more
likely to be falling into the excluded subject-matter, is not confirmed. Most
probably, again, designers/companies are careful to register only those designs they
think are valid.
2.2.3 Infringement
Hypothesis 12 is confirmed: Designs are more likely to be found infringed than not
infringed. Indeed, 63.5% of designs overall across Member States are infringed
while 36.5% are not84 (p value of the comparison test\ 0.001).
The hypothesis that the rate of finding designs infringed is higher in pro-
intellectual property right holder countries is confirmed for the following countries:
Italy 83.9%; Spain 77.8%, France 66.2% and Germany 59.9%.85 Even if the
percentage is high in Poland (75%), the sample size is so small in this case that it is
more prudent not to draw a firm statistical conclusion from this estimate. As regards
countries which are not pro-intellectual property right holder: no firm statistical
conclusion can be drawn for Portugal (100%) because of the low sample size (5
decisions and all designs rights were infringed), but this sub-hypothesis is not
confirmed for the UK (63.9%).86 The breakdown in the UK is interesting: 85.7% of
CUDR (7 decisions) are infringed against 71.4% of RDR (14 decisions); 41.6% of
CRDR (12 decisions); and 56.4% UKUDR (39 decisions); but no firm statistical
conclusion can be drawn for the UK in relation to this breakdown because of low
sample sizes.
Compared to the 77.7% of designs found valid, 63.5% of infringed designs is a
substantially lower percentage in statistical terms. One reason for this lower
percentage for infringement could be that many cases of borderline infringement are
litigated.87
Table 3 Number of valid/invalid decisions depending on dimension of designs (EU-wide)
Dimension Invalid Valid %Valid
2D 34 104 75.4
3D 361 1230 77.3
84 Percentages related to infringements; unknowns 4.3%.85 Percentages of unknown infringed decisions: France: 2.0%, Germany: 3.1%, Poland: 33.3%, UK:
5.3%. Portugal, Spain and Italy, no unknowns.86 With unknowns, the p values are: France\ 0.001, Germany 0.015, Italy\ 0.001, Spain\ 0.001, UK
0.033. Without unknowns, the p values are: France\ 0.001, Germany 0.0042, Italy\ 0.001 (no change),
Spain\ 0.001 (no change), UK 0.0092.87 This is the view of five specialist practising lawyers respectively from Austria, Lithuania, Italy,
Portugal and Poland (answers on file with the authors).
123
O. Church et al.

The breakdown of number of infringements per type of design right88 is as
follows:
Hypothesis 13 is confirmed: unregistered designs are more likely to be found
infringed than registered designs. However, hypothesis 14 is not confirmed because
designs registered nationally are less likely to be found infringed than all the other
types of design rights (Table 4).
An analysis based on the Pearson Chi-squared test (with three degrees of
freedom) reveals that, at the 5% type I error level, the probability of a design being
declared infringed depends on the type of design right (p value\ 0.001).
Unregistered designs were found more likely to be infringed than registered ones
(p value of the proportion comparison test\ 0.001). Designs registered at the
national level were found less likely to be infringed than all the others (p value of
the proportion comparison test\ 0.001). Additionally, infringement levels of RDR
were found lower than those of CRDR at the 5% type I error level (p value of the
proportion comparison test: 0.013). It is intriguing that RDR are found less often
infringed than CRDR as well as all other design rights. There does not seem to be a
simple explanation for this result; it would be useful to gather additional data, such
as surveys, to explain this finding.
Why is it that overall unregistered design rights are more easily infringed?
According to a study for the UKIPO on UK designs, people are less aware of CUDR
and UKUDR so infringe them more.89 This study only examined the UK, but it may
be indicative of the same reason in other countries too, as our results appear to
show. Registered designs are available for anyone to check in the respective register
and therefore it is easier to determine what is protected or not, and either refrain
from infringing or design around to avoid infringement. In some countries the
likelihood of a court finding a design right infringed is very low, for instance 6.7%
in Slovenia (15 decisions), Austria 23.1% (13 decisions), Romania 28.6% (91
decisions), Greece 34.6% (26 decisions) and Finland 42.9% (21 decisions). Another
country where the rate is relatively low is Germany (59.9%). All the other Member
States are above that rate.
Table 4 Number of infringed/not infringed decisions per type of design right (EU-wide)
Design right Not infringed Infringed % Infringed
CUDR 43 153 78.1
RDR 289 400 58.1
CRDR 168 308 64.7
UKUDR 14 25 64.1
88 Unknowns CUDR: 1.5%, unknowns RDR: 7.0%, unknowns CRDR: 1%, unknowns UKUDR: 7.1%.89 See Baumgart, supra note 9, pp. 33, 58–59, 68–69 [based on surveys with ca. 800 replies and 24
interviews with design right holders, though for the answer that they are infringed more often because
infringers did not think they were infringing only 3 replies (23.1%) were received out of 13 compared to
‘‘don’t know’’ (61.5%) and other reasons (30.8%)].
123
An Empirical Analysis of the Design Case Law of the EU…

This low percentage is not in general owed to the fact that the judges are not
specialised in some of these countries (in Austria most judges are specialised and in
Romania 98.9% are). However, as the sample sizes for these countries are small, it
is not possible to draw firm statistical conclusions on this basis.
We therefore queried whether this low level of infringement may be due to a
higher proportion of 3D designs being in this category of non-infringed designs.
Indeed, a reason for the lower percentage of infringed decisions could be that 3D
designs are more often mainly or entirely functional.
The total counts of infringed/not infringed designs depending on dimension of
designs90 are reported in Table 5. We found, using a proportion comparison test,
that at the 5% type I error level, the probability of a design being declared infringed
is higher for 2D designs (p value: 0.0058).
We explored this further by modelling the proportion of infringed decisions as a
function of the proportion of 3D designs per country with more than 15 decisions on
infringement over the observation period. The results are represented in Fig. 2,
where the solid line is the fitted line using a logit-binomial Generalised Linear
Model, which was found to be significant at the 5% error level (p value\ 0.001).
This figure shows that the rate of infringement decreases as the proportion of 3D
designs increases.
A main reason behind this finding is that 3D designs being functional, it is easier
for competitors to design around them and thus escape infringement. Another reason
why 2D designs are more likely infringed than 3D designs is that 2D designs are
often not registered (and therefore not as easily discoverable), and copyists are
unaware of design protection on those, so they do not know they are actually
infringing. A related reason why unregistered designs are more often found
infringed is that, since they are not registered, their scope is more ‘‘flexible’’
compared with registered designs. Indeed, an unregistered design’s scope is
determined by the product as marketed, whereas a registered design’s scope is fixed
at the time of application by the documents filed by the designer. The marketed
product may be slightly different or evolve over time compared to the one depicted
in the application. Our data seems to confirm this, as the proportion of 2D designs
litigated upon which are not registered overall is 39.4%, compared with 17.5% of
3D designs litigated upon91 which are not registered. The finding that a much larger
proportion of 2D designs litigated upon are unregistered correlates well with the
previous findings in this subsection that unregistered designs are more likely to be
found infringed than registered ones.
Table 5 Number of infringed/not infringed decisions depending on dimension of designs (EU-wide)
Dimension Not infringed Infringed % Infringed
2D 23 77 77.0
3D 437 733 62.6
90 Unknowns 2D: 3.8%, unknowns 3D: 4.9%.91 Unknowns 2D: 2.7%, unknowns 3D: 3.0%.
123
O. Church et al.

We then queried whether infringement depends on court level. Hypothesis 15 is
not confirmed EU-wide: first instance courts do not declare infringements more
often than second and third instance courts.
The total counts of infringed/not infringed designs depending on court level are
reported in Table 6.92 A Pearson Chi squared test (with two degrees of freedom)
was carried out on the count data of infringed/not infringed designs and we found
that, at the 5% type I error level, the probability of a design being declared infringed
does not depend on court level (p value: 0.141).
We carried out the same Pearson Chi-squared test with two degrees of freedom
on the count data of infringed/not infringed designs without including France and
we found that, at the 5% type I error level, the probability of a design being declared
infringed depends on court level (p value: 0.0081), and first instance courts declare
infringements more often (65.6% in first instance, and 55.5% in appeal across court
of appeal and supreme court; p value of the proportion comparison test: 0.0012). We
Fig. 2 Proportion of infringed designs as a function of the proportion of designs ruled on that were 3D,calculated per country. The solid line is the line of best fit provided by the Generalised Linear Model
92 Unknowns: 1st instance 1.8%, court of appeal 5.5%, highest court 21.8%.
123
An Empirical Analysis of the Design Case Law of the EU…

decided to exclude France here because it contains by far the most litigation and
each decision is appealed.
First instance courts find infringement more often, but not because there are more
cases by non-specialist judges, since 31.9% only are not specialist (more on this in
Sect. 2.2.4 below). One reason may be that first instance judges know that the case
can be appealed and that the courts of appeal will be more careful in judging the
design infringement, or that borderline cases go to the higher courts more often.
This data also means that it makes sense for a defendant to appeal (although the
problem often is whether defendants have the means to do so). The fact that 57.3%
of decisions are not appealed shows that either parties comply or settle, possibly
because the cases are borderline, or the appeal costs are prohibitive. On designs
which were infringed or not infringed, the data is as follows: of the 828 decisions by
first instance courts, 535 are appealed so 64.6% of first instance court decisions on
infringement are appealed to the court of appeal; and of those, 68 court of appeal
decisions so 12.7% go to the highest court on matters of infringement. The
proportion of infringed designs in courts of appeal and/or supreme courts is higher
than 50%, which invalidates hypothesis 16.
2.2.4 Judge Specialisation and Level of Court
We also looked at whether judges dealing with design cases are specialised or not as
studies suggest that specialised intellectual property courts decide cases ‘‘more
efficiently, faster, with better quality, higher consistency and more predictability of
outcomes in the eyes of the system’s stakeholders.’’93 Quantitative data on the
effects of specialised intellectual property courts is limited94; our article aims to fill
this gap for design rights.
Our data shows that most judges (68.1%) are specialised, while 31.9% are not
specialised.95 By specialised, we mean (and coded accordingly) that the court is an
intellectual property court or a court that has intellectual property in its competences
Table 6 Number of infringed/not infringed decisions per court level
Court level Not infringed Infringed % Infringed
(a) (EU-wide)
First instance 292 536 64.7
Court of appeal 199 336 62.8
Highest court 32 36 52.9
(b) (without France)
First instance 223 426 65.6
Court of appeal 126 158 55.6
Highest court 23 28 54.9
93 See de Werra (2016), p. 25 and references cited including a number of studies. See also European
Union Intellectual Property Office (2018), pp. 2, 27.94 European Union Intellectual Property Office (2018), supra note 96, p. 3.95 Unknowns 12.1%.
123
O. Church et al.

and frequently renders decisions on intellectual property law. In this latter case, the
judges are not only dealing with intellectual property cases but also with other areas
of the law and have or have developed an expertise in the intellectual property field.
Non-specialised judges are obviously competent by law to judge intellectual
property cases but have not developed expertise in the field owing to the rarity of
cases in this area that they have to judge. So, for example, in France, the Court of
Appeal of Poitiers is not considered to be specialised because it has only rendered
three judgments in the area of designs in the period we considered. The only
specialised Court of Appeal in France is the second chamber of the 5th pole of the
Paris Court of Appeal.
Our data invalidates the Economic Review which, based on the literature and
their own survey, finds that one of the weaknesses of the design framework is the
lack of specialised judges in the Member States.96
A comparison test on the estimated rates of overruling depending on judge
specialisation revealed that, at the 5% type I error level, non-specialised judges
overrule more often (34.3%) than specialised judges (25.4%; p value: 0.0119).
Hypothesis 17 is therefore confirmed. The findings might imply that it is
problematic for parties if judges are not specialised, in the sense that the latter do
overrule more than specialised judges.
Second, we looked at the total counts of valid and invalid designs depending on
judge specialisation (see Table 7). A comparison of proportions test reveals that the
probability of a design being declared valid is, at the 5% type I error level, higher
for specialised judges (p value\ 0.001).
To get a further idea of the influence of judge specialisation on the proportion of
valid decisions, we calculated, for each EU country, the proportion of valid designs
and the proportion of decisions examined by a specialised judge, and represented
these quantities in Fig. 3. Any country with less than 15 decisions was excluded for
statistical accuracy. The solid line is the fitted line using a logit-binomial
Generalised Linear Model, which was found to be significant at the 5% type I error
level (p value\ 0.001). Therefore, hypothesis 18 is confirmed also at country level:
the amount of designs held valid is higher if the court is specialised.
Table 7 Number of valid/invalid decisions depending on specialisation (EU-wide)
Specialisation Invalid Valid %Valid
Non-specialised 174 395 69.4
Specialised 243 1029 80.9
96 European Economics (2016), p. 125. Our findings also go against a 2011 OECD study stating that
‘‘that businesses regard the competence of the courts as a considerable obstacle to enforcing their
intellectual property rights because judges are often not up to date on the legislation and they very rarely
have an in-depth understanding of the IPR discussed.’’ Summary of the OECD study by the Economic
Review at p. 118. However, specialised courts have been put in place in some Nordic countries and the
UK since that study, which may contribute to explain some of these findings, as the OECD study also
added that: ‘‘in the Nordic countries, issues on IPR are handled by the general courts and the judges that
are to handle a case of IPR often do so for the first time’’. Summary of the OECD study by the Economic
Review at p. 118.
123
An Empirical Analysis of the Design Case Law of the EU…

Third, we looked at the total counts of data of infringed and not infringed designs
and we found that, at the 5% type I error level, the probability of a design being
declared infringed does not depend on judge specialisation (p value approximately
1; see Table 8). Therefore, hypothesis 19 is not confirmed. We reach the same
conclusion with a refined analysis concerning first instance or courts of appeal97
only (p values respectively 0.252 and 0.314).
Table 8 Number of infringed/not infringed decisions depending on specialisation (EU-wide)
Specialisation Not infringed Infringed % Infringed
Non-specialised 132 235 64.0
Specialised 360 636 63.9
Fig. 3 Proportion of valid designs as a function of the proportion of cases ruled on by a specialisedjudge, calculated per country. The solid line is the line of best fit provided by the Generalised LinearModel
97 Namely excluding Supreme Courts.
123
O. Church et al.

This finding is interesting because there is a theory according to which
specialised judges are more biased towards right holders,98 which would seem to be
confirmed at valid level but not at the infringed level. However, there is another
theory according to which specialised patent judges are less likely to find
infringement than non-specialised judges (at least in the US).99 This theory is not
verified here. Regarding infringement, there may be another, perhaps more
plausible, explanation which is related to our findings above; it may simply be
because claimants are litigating only when they are certain that their designs are
valid but not in all cases as certain that they are infringed.
Finally, to further check the validity of our analysis we asked a practising lawyer
(intellectual property specialist) in each Member State whether the rate of decisions
going to court could have changed owing to a national measure increasing or
decreasing the cost of going to court. Only in three countries (Austria, the Czech
Republic, and Romania100) was there a measure which could have influenced such
access. However, in these countries, the samples are very small (see Sect. 1.3.4
above) so it is not possible to draw firm statistical conclusions.
3 Conclusion
The overall conclusion we can draw from our findings is that the EU design legal
framework has been effective over the first 15 years of its existence.
Some of our results drawn from inferential statistics were expected. Since
copyright is the protection of choice for 2D products, it is normal that most
claimants sue for design infringement of 3D, not 2D designs. Likewise, it is not
surprising that most 2D design litigation relates to clothing, as many 2D designs will
be patterns on clothing or footwear, and it makes sense, in view of the big clothing
market, to register a 2D design for clothing. Certain results are more interesting.
98 Petersen and Schovsbo (2010) and Schovsbo et al. (2015), Lee and Zhang (2017), pp. 907–908, 921,
suggesting that specialised intellectual property courts may be more biased towards right holders or suffer
from the bias of specialists but noting that this bias has not been seen in the specialised Chinese
intellectual property courts yet. See also further references at their notes 45 and 46 of literature criticising
the Court of Appeal of the Federal Circuit in the USA and the Unified Patent Court in Europe (both
specialised patent courts) for their potential bias. See also de Werra supra note 96, p. 28 and references
cited; European Union Intellectual Property Office (2018), supra note 96, pp. 9, 17, concluding at 27 that
studies did not find such strong evidence and that to remedy this potential bias, a solution is keeping some
general civil/commercial cases in the workload of judges also deciding intellectual property cases.99 Lemley et al. (2014), p. 1155: ‘‘As judges gain experience with patent cases, they are less likely to rule
for patentees on infringement. Our finding is strong and highly significant, robust across districts, across
time, and across areas of technology. This both challenges existing assumptions about forum shopping in
patent cases and suggests that specialized patent trial courts may benefit accused infringers over
patentees’’.100 In Austria a measure was taken which increased the cost of bringing a case to the Supreme Court in
2007. In the Czech Republic, an amendment of the Civil Procedure Code in 2009 decreased the security
for preliminary measures which could facilitate the access to the courts. In Romania, on 28 June 2013, the
judicial stamp duty fees were raised. The Romanian practising lawyer we contacted did not think this
could have made a difference in the number of design cases going to court as the increase in the duty was
not very high.
123
An Empirical Analysis of the Design Case Law of the EU…

First, compared to RDR (649 litigations) and CRDR (461 litigations), there are 217
litigations on CUDR. This is far less than for the registered rights, which comes as
no surprise, but not so low as to make CUDR irrelevant. Second, CUDRs are used
mostly for 3D designs. More generally, the objects litigated upon under a CUDR
were very varied, from car parts to chocolate bars and from bait bags to forklifts,
and 33% of CUDR litigation focused on for fashion items (we included clothing,
footwear, glasses and handbags; including wallets, watches and jewellery, the
percentage increases to 39.6%). This tends to confirm the intuition that CUDR is
well used in the fashion industry, where items become outdated fast and thus where
registering is less appealing or perceived as unnecessary.
Two more unexpected results are that there is more litigation on RDRs than
CRDRs and that RDRs are still relevant in big markets. Two reasons may explain
this. First, some RDRs may be owned by small and medium-sized enterprises
(SMEs) which have limited budgets or do not wish to expand and thus do not wish
or need to register at EUIPO. Second, it may be that some designs are cultural or
local, in other words their use is geographically limited and thus limited to a handful
of markets. Our sample of data does not currently allow us to assess whether this is
the case. We rule out a third reason, namely, that the designers/companies file a
design both at EU and national level, since this is not reflected in the litigation
statistics (only 3.5% of claimants sue on the bases of RDR and CRDR101). In any
case, our findings tend to show that the current system seems well-suited to the
different needs of the various design industries, and the fact that all the design rights
are well used shows that the design system has so far worked well.
Our inferential statistics show that the EU legal framework has also functioned
well on the validity front. Courts are more likely to find designs valid than invalid
and decisions are also more likely to be affirmed than reversed. This shows that a
lack of ex ante examination has not led to more invalidated designs, and there seems
to be an absence, overall, of strategic registration. These two aspects seem to be
confirmed by the fact that the proportion of designs found valid does not depend on
their dimension.
The results for infringement are qualitatively similar to those on validity. Designs
are more likely to be found infringed than not infringed, and first instance courts do
not find designs more often infringed than higher courts. However, compared to the
proportion of valid designs, the proportion of designs found infringed is lower,
which may well be because more borderline cases go to the courts and are fought
harder. Although we did analyse our results in the light of the opinions of selected
intellectual property practitioners across the EU Member States, a precise
assessment of why the proportion of infringement is lower than that of validity
would require more data (such as surveys). Foreseeably, unregistered designs are
more likely to be found infringed than registered designs as, unlike unregistered
designs, they are available on the register for all competitors to check. 2D designs
are also more likely to be infringed; this correlates well with the level of
unregistered designs being found infringed more often than registered designs, as
2D designs are also less often registered. Higher courts do not find designs less often
101 Excluding unknowns.
123
O. Church et al.

valid nor less often infringed than lower courts. That said, when leaving France out,
higher courts declare designs less often infringed. Surveys would help to find out
exactly why this is the case (Fig. 4).
Further evidence that the EU design legal framework has functioned satisfac-
torily is given by the number of litigations, which has steadily grown per year and
has now reached a level where it has plateaued.
The data for the countries with the most litigation is given in Fig. 5. The amount
of litigation varies within countries but within the EU generally the number of
litigations has increased over the observation period. This suggests that a more
precise monitoring, specific to each country, is an interesting avenue for further
research.
The growing – and then stable – number of litigations overall, and the
stable proportion of litigations finding designs valid and infringed over time,102
shows that designers have relied with confidence on the EU design legal framework.
Fig. 4 Number of litigations per 100 million people over time across Member States. Note that the 2017data is only available until August 2017
102 See Fig. 1 above.
123
An Empirical Analysis of the Design Case Law of the EU…

Our litigation data thus maps well with the increasing number of design applications
in the EU overall (all designs rights included103). Designs are thus used, worth
litigating upon, and found valid and infringed in high proportions. This confirms the
general conclusion drawn by the Legal Review.104 This also confirms the findings of
the Economic Review and OECD studies of 2011 which conclude that ‘‘enforce-
ment seems to be the most important factor cited by firms when deciding whether to
acquire a formal intellectual property right’’; in other words, good enforcement of
design rights leads to a high number of design applications.105 The fact that
Fig. 5 Number of litigations per 100 million people over time for countries with the most litigation(France, Germany, Italy, the Netherlands, Romania, Spain and the UK)
103 As stated above in Sect. 1, the number of registered design rights has generally decreased overall in
the Member States (with more in some and less in others) but with a commensurate increase in the
number of CRDR applications.104 Legal Review, p. 156.105 Relevant findings of the ‘‘OECD Studies on SMEs and Entrepreneurship Intellectual Assets and
Innovation’’ as summarised by the Economic Review, European Economics (2016), p. 118.
123
O. Church et al.

claimants enforced designs consistently over these 15 years also shows that overall,
they believe that designs protect their creations well enough. As the Economic
Review’s surveys found out,
[t]he most significant influence on decisions to apply to protect designs,
irrespective of the method of protection, across all respondents is the level of
protection it grants, while the least important factors are the costs of enforcing
protection and the costs of obtaining protection. We found no substantial
variation in the importance of the four factors across respondents from
different sectors or regions.106
Our findings seem to confirm this. However, this is an overall assessment; there
may be differences on a country-by-country basis. The Economic Review also notes
that
[s]ome respondents stated that this limited scope of protection [by the
industrial design rights system] means that it is difficult to secure a level of
protection that would ensure that their design provides a competitive
advantage. In turn, some companies have questioned whether it is rational
for them to pay for an industrial design when their competitors can produce
goods that appear almost identical to the consumer.107
The Economic Review does not indicate where those respondents operate, but
these reactions may well be country-specific. For example, these opinions seem to
be reflected in the UK; the lower level of litigation compared to other large
countries may be explained not only by the cost of the court procedure, but also by
the lower level of enforcement than in other countries. Our statistics show that
neither the Court of Appeal nor the Supreme Court have ever found a CRDR or
RDR infringed since October 2001, culminating with the Trunki litigation last
decided by the Supreme court.108 Only one CUDR was ever found infringed at
appeal level.109 Three of the UKIPO studies point in the same direction and recoup
themselves on these points. One study commissioned by the UKIPO where 32 firms
were surveyed found that ‘‘[t]here is strong evidence from the firms, and specifically
‘design-intensive’ firms that registered designs are difficult to defend. Very few of
the firms that had experienced designs being copied took successful action in
defending against this copying.’’110 Most firms surveyed said that they do not take
action because it is too costly and some said that the perception is that design rights
do not give a broad scope of protection, adding that because of this, they are less
likely to register designs.111 Another UKIPO study also shows that one of the main
106 European Economics (2016), p. 107.107 European Economics (2016), p. 168.108 Magmatic v. PMS International [2013] EWHC 1925, reversed by [2014] EWCA Civ 181, affirmed by
[2016] UKSC 12 (involving the famous Trunki child rolling suitcase).109 Landor & Hawa International v. Azure Designs [2006] EWCA Civ 1285.110 Moultrie 2011, supra note 14, p. 1.111 Ibid, p. 18. In the sample of the 32 firms surveyed, only 10 took actions against infringers and 6 were
successful.
123
An Empirical Analysis of the Design Case Law of the EU…

reasons for not suing is the cost and the unpredictability of design law.112 In yet
another of the UKIPO studies (based on 26 interviews with designers, design
companies, lawyers, economists, and staff working at WIPO and design trade
associations in the UK, France and Germany), the perception is that design
enforcement is more costly in the UK than in Germany and France, and that ‘‘these
perceptions decrease an owner’s expected value of defending a design right, and
ultimately reduce the incentive to register at all in the UK’’.113
As a consequence, at the level of single countries, there appears to be room for
improvement, as indicated by UKIPO studies, the Economic and Legal Reviews.114
Some respondents to the surveys and the drafters of the Economic Review equally
suggest procedural changes, at both filing and enforcement levels, including cost,
rather than substantive law changes.115 These suggestions are in accordance with
the results of the surveys done in the UKIPO studies discussed above and with the
rate of infringement at the UK Court of Appeal and Supreme Court. The Legal
Review, however, adds that even if overall the design system functions well, there
is some confusion at the national level on certain terms such as ‘‘informed user’’
and ‘‘overall impression’’, and recommends guidelines within the recitals of the
Design Directive to remedy this.116 Our results showing a lower rate of
infringement may point towards that direction. Our reading of all the national
case law shows that such confusion exists to some extent in some Member States,
although it seems to progressively recede, most probably owing to the case law of
the EUIPO and the EU courts and the national courts’ growing experience in the
new EU design legal framework. That being said, guidelines on the scope of
protection and infringement test would be very welcome, because they are still
interpreted differently in some countries. We leave a more detailed analysis of the
case law on this aspect for another article117; let us note that there are already some
excellent initiatives taken by EUIPO, such as the convergence project in relation to
the filing procedure118 and the series of seminars and symposia organised for
112 Carter-Silk and Lewiston (2012), supra note 9, p. 71.113 BOP consulting, supra note 14, p. 22.114 Legal Review, pp. 154–165.115 European Economics (2016), pp. 168–172 (noting that some respondents to the surveys and
interviews complained about the time it takes for a dispute to be resolved in the courts and the cost of
litigation. ‘‘One possible explanation for this difference of opinion may be that the enforcement process is
cheaper, quicker and more effective in some European countries than in others. Indeed, some respondents
noted that the enforcement process works well in the Netherlands and suggested that it should be used as a
model for a harmonised regime across Europe’’).116 Legal Review, p. 156.117 Derclaye (2020).118 Convergence Project on Graphic Representation of Designs, at https://euipo.europa.eu/ohimportal/
en/news?p_p_id=csnews_WAR_csnewsportlet&p_p_lifecycle=0&p_p_state=normal&p_p_mode=view&
p_p_col_id=column-1&p_p_col_count=2&journalId=2922696&journalRelatedId=manual/.
123
O. Church et al.

national judges to meet, learn and exchange knowledge, information, judgments
and best practice, and also to achieve greater judge specialisation.119 These
meetings will undoubtedly also reduce disparities in the application of the
substantive law. The EUIPO’s initiatives should be applauded and the EUIPO
should be encouraged to carry them on and intensify them. In addition, and to
achieve these same aims, it would be good to increase the number of national and
pan-European informal meetings and conferences for lawyers and judges, whether
organised solely for one group or for both.
Apart from the above policy recommendations to be carried out at national and
EU level, we would recommend to further improve the application of the law, by
providing specific intellectual property training to judges. Our findings show that,
on the one hand, specialised judges find designs valid more often. On the other
hand, specialised judges do not find designs less or more often infringed than non-
specialised ones. We would also therefore recommend that Member States introduce
specialised courts for RDRs too (as they already exist for Community designs) as
the tunnel vision and pro-right holder bias of specialised courts commonly decried
in the literature120 does not seem to show up at least for designs. Pro-right holder
bias does exist in some countries however (but is not linked to court specialisation)
and would need to be tackled, for instance through the judges’ meetings/training.
Further research to check whether the EU design legal framework works well
should examine how parties also rely on other rights related to design rights –
namely patent, trade mark, copyright and unfair competition – and what the
outcome is: does the claimant lose more often on the basis of the design
right(s) rather than other intellectual property rights, or does the reverse conclusion
hold? Our data shows that many litigants rely on some or more of these rights when
litigating over design rights: per litigation, 40.08% used unfair competition,
including slavish imitation; 27.45% used copyright; 6.69% used trademark; and
2.43% used patents. Our findings confirm the survey from the Economic Review on
this point.121 We leave a detailed analysis of this case law on this particular issue for
another paper.
Acknowledgements This study was made possible thanks to funding from the Research Priority Area
‘‘Data Driven Discovery’’, University of Nottingham awarded to E. Derclaye and G. Stupfler. We are
grateful to a team of research assistants who helped summarising the decisions in English and provided
answers to queries. Some wish to remain anonymous, the others are: Mikko Antikainen, Denisa Assefova,
Carlos Sebastian Barreto Cifuentes, Tristan Branellec, Lara Burghgraeve, Antoine Camilleri, Jack
Darroch, Stephanie de Potter, Linnea Dejemo, Thomas Espeel, Paweł Halwa, Helena Haag, Vibeke Huus
Rosenquist, Edita Ivanauskiene, Florian Jacques, Dimitar Karaikov, Ursa Kranjc, Oscar Lisshagen,
Mireia Moreso, Dorottya Paku, Maria Papavasileou, Michaela Papouskova, Eduard Pavel, Maxence
Poivre, Razvan Popa, Andrea Radonjanin, Lars Segato, Romy Siebelink, Eva Skufca, Gabor Soos, Sona
Surmova, Katlin Taimsaar, Eugenia Tonello, Alexandra van Lier, Catarina Videira Louro, and Laura
Valtere. Grateful thanks also to commercial judges from Barcelona, Antoine Camilleri, Ramon Casas,
119 Information about the seminars is at https://euipo.europa.eu/ohimportal/en/web/observatory/
knowledge-building. The objectives of the judges’ seminars are in short to learn, share and network. A
more detailed list can be found at https://euipo.europa.eu/tunnel-web/secure/webdav/guest/document_
library/observatory/documents/Judges_events/Judges_Seminar_09-2017_sum_en.pdf.120 See supra note 97.121 European Economics (2016), pp. 69–73, 121, 125.
123
An Empirical Analysis of the Design Case Law of the EU…

Gina Gracaric, Marie-Christine Janssens, Anne Emmanuelle Kahn, Marko Kapetanovic, Pascal Kamina,
Pavel Koukal, Nari Lee, Matthias Leistner, David Musker, Ansgar Ohly, Antoon Quaedvlieg, Eduard
Pavel, Ana Ramalho, Marco Ricolfi, Irini Stamatoudi, Shane Smyth, David Stone, Tatiana Synodinou and
Daniel Westman who kindly provided information about procedural aspects of design law in their
respective countries. Many thanks also to an anonymous referee, Tomas Eichenberg and Natalia
Zebrowska of DG Growth for their comments on a previous version of this paper. Our sincere apologies if
we missed anyone in this very long list. All errors remain ours.
Open Access This article is distributed under the terms of the Creative Commons Attribution 4.0
International License (http://creativecommons.org/licenses/by/4.0/), which permits unrestricted use, dis-
tribution, and reproduction in any medium, provided you give appropriate credit to the original
author(s) and the source, provide a link to the Creative Commons license, and indicate if changes were
made.
References
Bascavusoglu-Moreau E, Tether B (2011) Registered designs and business performance – exploring the
link. An Intellectual Property Office report. London. https://www.gov.uk/government/publications/
the-economics-of-design-rights. Accessed 13 Dec 2018
Baumgart S, Coutts N, Soetendrop R (2018) Research into designs infringement: attitudes and behaviour
of design rights owners towards infringement. UK Intellectual Property Office. London. https://
www.gov.uk/government/publications/research-into-design-infringement. Accessed 13 Dec 2018
BOP Consulting (2011) Design rights, an international comparison. UKIPO (Ed.). The economics of
design rights. An Intellectual Property Office report. London. https://www.gov.uk/government/
publications/the-economics-of-design-rights. Accessed 13 Dec 2018
Carter-Silk A, Lewiston M (2012) The development of design law: past and future. UK Intellectual
Property Office. London. https://www.gov.uk/government/publications/the-development-of-design-
law-past-and-future. Accessed 13 Dec 2018
Collopy D (2014) Measuring infringement of intellectual property rights. UK Intellectual Property Office.
London. https://assets.publishing.service.gov.uk/government/uploads/system/uploads/attachment_
data/file/325020/IP_Measuring_Infringement.pdf. Accessed 13 Dec 2018
Cornwell J (2016) Under-referred, under-reasoned, under-resourced? Re-examining eu design law before
the court of justice and general court. Intellect Prop Q 4:318–351
de Werra J (2016) Specialised intellectual property court-issues and challenges. Global Perspectives for
the Intellectual Property System. CEIPI-ICTSD, 2:25
Derclaye E (2013) A decade of registered and unregistered design rights decisions in the UK: What
conclusions can we draw for the future of both types of rights? 3 IP Theory 144
Derclaye E (2018) CUDR and CRDR post-brexit from a UK and EU perspective. J Intellect Prop Pract
13(4):325–331
Derclaye E (2020) EU design law: transitioning towards coherence? 15 years of national case law. In:
Bruun N, Dinwoodie G, Levin M, Ohly A (eds) Transition and coherence in intellectual property
law. Cambridge University Press, Cambridge
DG Growth (2016) Legal review on industrial design protection in Europe. Final Report. MARKT2014/
083/D. http://ec.europa.eu/growth/content/legal-review-industrial-design-protection-europe-0_en.
Accessed 13 Dec 2018
European Economics (2016) Economic review on industrial design in Europe. http://ec.europa.eu/growth/
content/economic-review-industrial-design-europe-0_en. Accessed 13 Dec 2018
European Union Intellectual Property Office (2018) Specialised IP rights jurisdictions in the Member
States, a compilation of available studies
Fhima I, Denvir C (2015) An empirical analysis of the likelihood of confusion factors in European trade
mark law. Int Rev Intellect Prope Compet Law 46(3):310–339
Filitz R, Henkel J, Tether B (2015) Protecting aesthetic innovations? An exploration of the use of
registered community designs. Res Policy 44:1192
123
O. Church et al.

Hartwig H (2018) The ‘‘legal review on industrial design protection in Europe’’: a closer look. J Intellect
Prop Pract 13(4):332
Haskel J, Pesole A (2011) Design services, design rights and design life lengths in the UK. UK IPO (Ed)
The economics of design rights. An Intellectual Property Office Report. London. https://www.gov.
uk/government/publications/the-economics-of-design-rights. Accessed 13 Dec 2018
Lee N, Zhang L (2017) Specialised IP courts in China—Judicial Governance of Intellectual Property
Rights. Int Rev Intellect Prop Compet Law 48(8):900
Lemley M, Li S, Urban J (2014) Does familiarity breed contempt among judges deciding patent cases?
Stanf Law Rev 66:1121–1157
Massa C, Strowel A (2003) Community design: Cinderella revamped. Eur Intellect Prop Rev 25(2):68–78
Moultrie J, Livesey F (2011) Design right case studies. UK IPO (Ed.). The economics of design rights. An
Intellectual Property Office Report. London. https://www.gov.uk/government/publications/the-
economics-of-design-rights. Accessed 13 Dec 2018
Petersen C, Schovsbo J (2010) On law and policy in a European and European Union Patent Court
(EEUPC)—What will it do to patent law and what will patent law do to it? Working paper. https://
papers.ssrn.com/sol3/papers.cfm?abstract_id=1572521. Accessed 13 Dec 2018
Rantenen J (2013) Recalibrating our empirical understanding of inequitable conduct. IP Theory 3:98
Rogers E (2013) Substantially unfair: an empirical examination of copyright substantial similarity
analysis among the federal circuits. Mich St L Rev 2013:893
Schovsbo J, Petersen C, Riis T, Salung C (2015) The Unified Patent Court: pros and cons of
specialisation—is there a light at the end of the tunnel (vision)? Int Rev Intellect Prop Compet Law
46(3):271
Simpson D, Petherbridge L (2014) An empirical study of the use of legal scholarship in the Supreme
Court Trademark Jurisprudence. Cardozo L Rev 35:931
The Big Innovation Centre (2012) UK design as a global industry: international trade and intellectual
property. UK Intellectual Property Office, London
Thompson S, Sissons A, Montgomery L (2012) UK design as a global industry: international trade and
intellectual property. UK Intellectual Property Office. London. https://eprints.qut.edu.au/52682/.
Accessed 13 Dec 2018
Publisher’s Note Springer Nature remains neutral with regard to jurisdictional claims in publishedmaps and institutional affiliations.
123
An Empirical Analysis of the Design Case Law of the EU…