Affinities: Uncovering Audience Interest Insights Beyond Demographics

AfC
PRV
a
AAA
KSPMIB
1
ilefiaaa
pl
h1
Journal of Molecular Graphics and Modelling 53 (2014) 118–127
Contents lists available at ScienceDirect
Journal of Molecular Graphics and Modelling
j ourna l h om epa ge: www.elsev ier .com/ locate /JMGM
n electronic environment and contact direction sensitive scoringunction for predicting affinities of protein–ligand complexes inontour®
eter R. Lindblom, Guosheng Wu, Zhijie Liu, Kam-Chuen Jim, John J. Baldwin,ichard E. Gregg, David A. Claremon, Suresh B. Singh ∗
itae Pharmaceuticals, 502 West Office Center Drive, Fort Washington, PA 19034, United States
r t i c l e i n f o
rticle history:ccepted 14 July 2014vailable online 28 July 2014
eywords:coring functionrotein–ligand interactionsolecular orbitals
nteraction zonesinding energy
a b s t r a c t
Contour® is a computational structure-based drug design technology that grows drug-like molecules byassembling context sensitive fragments in well-defined binding pockets. The grown molecules are scoredby a novel empirical scoring function developed using high-resolution crystal structures of diverse classesof protein–ligand complexes and associated experimental binding affinities. An atomic model bearingfeatures of the valence bond and VSEPR theories embodying their molecular electronic environment hasbeen developed for non-covalent intermolecular interactions. On the basis of atomic hybridization andpolarization states, each atom is modeled by features representing electron lone pairs, p-orbitals, andpolar and non-polar hydrogens. A simple formal charge model was used to differentiate between polarand non-polar atoms. The interaction energy and the desolvation contribution of the protein–ligandassociation energy is computed as a linear sum of pair-wise interactions and desolvation terms. Thepair-wise interaction energy captures short-range positive electrostatic interactions via hydrogen bonds,electrostatic repulsion of like charges, and non-bond contacts. The desolvation energy is estimated bycalculating the energy required to desolvate interaction surfaces of the protein and the ligand in the
complex. The scoring function predicts binding energies of a diverse set of protein–ligand complexes usedfor training with a correlation coefficient of 0.61. It also performs equally well in predicting associationenergies of a diverse validation set of protein–ligand complexes with a correlation coefficient of 0.57,which is equivalent to or better than 12 other scoring functions tested against this set including X-Score,GOLD, and DrugScore.© 2014 Elsevier Inc. All rights reserved.
. Introduction
The ideal goal in the field of computational molecular modelings to be able to accurately predict binding affinity of any givenigand to a protein binding site within experimental error. Bothxperimental and theoretical investigations have led to the identi-cation of physically defined molecular forces responsible for the
ssociation of proteins and ligands [1,2]. The shape, electrostatics,nd solvent play primary roles in the association of proteins and lig-nds. The complexation process is also facilitated by the favorableAbbreviations: MM-GBSA, molecular mechanics/generalized born surface area;H, polar hydrogen; nH, non-polar hydrogen; pLP, polar lone pair; nLP, non-polar
one pair.∗ Corresponding author. Tel.: +1 215 461 2048; fax: +1 215 461 2006.
E-mail address: [email protected] (S.B. Singh).
ttp://dx.doi.org/10.1016/j.jmgm.2014.07.010093-3263/© 2014 Elsevier Inc. All rights reserved.
desolvation energy of the interfacial surfaces of the protein and theligand. The binding forces are driven by complementary favorableinteractions and opposed by repulsive forces. The evidence forthe former is available through X-ray structures of protein–ligandcomplexes, however it is not straightforward to observe the latterexperimentally. The conformational entropy of the protein andthat of the ligand also contribute significantly toward free energyof binding [3,4]. There are reported treatments in the literature tocapture the contribution of the conformational entropy [3–5].
The protein–ligand association processes has been simulatedvia free energy perturbation calculations and molecular dynamicscalculations in explicit solvent [6]. However, more common appli-cation of FEP calculations has been for calculating relative binding
affinities [7–9]. Even though both approaches use rigorous statis-tical mechanics treatment to estimate free energy of binding, theystill take several days to months to calculate binding affinities, andhence are not practical for routine drug design applications.
r Graphics and Modelling 53 (2014) 118–127 119
qpacfaXdvliwleimt
impitavotoTboa
csoTwtoTpodtchp
abtsTarsm
gpctgi
Table 1The zone types and their corresponding charges are given. Key, pH = polar hydro-gen, nH = non-polar hydrogen, pLP = polar lone pair, nLP = non-polar lone pair, and� = represent p-orbitals. See text and Appendix for further description of the zones.
Type Charge
pH 1nH 0pLP −1
P.R. Lindblom et al. / Journal of Molecula
A more practical approach has been to use scoring functions foruick assessment of binding affinities of tens to millions of com-ounds in virtual screening experiments. These functions, thoughpproximate, do empirically capture the free energy terms thatontribute toward binding affinity. A large variety of empirical,orce-field, and stochastic based functions have been formulated,nd a significant number of these functions were developed using-ray structures of protein–ligand complexes and experimentallyetermined Kd, Ki, and IC50 values [10–44]. The binding affinityalues are reliably determined through experiment from high mil-imolar to picomolar range. The weaker end of the activity ranges limited by the solubility of a given compound and the accuracy
ith which the affinity can be assessed in saturating conditions forow concentrations of protein. On the other hand, the more potentnd of the activity range is limited by the ability to detect activityn a given biological assay, and the poor accuracy associated with
easurements at very low concentrations of the compound andhe protein.
Scoring functions differ in the way they treat the effects involvedn the protein–ligand binding process. However, one thing com-
on among the majority is that they use X-ray crystal structures ofrotein–ligand complexes and their associated experimental bind-
ng affinities to obtain combinations of interaction energy termshat correlate with free energy of binding. The choice of the inter-ction energy terms, the training set, the training methods, andalidation with external data sets is critical to their applicabilityutside the training set. The derivation of a linear sum of interac-ion energy terms is a convenience, and is valid for conformationsf proteins and ligands in the vicinity of near-native conformations.he prediction of ligand conformation close to the experiment cane achieved through extensive sampling, however the predictionf the protein conformation appropriate for a given ligand is stilln unsolved problem.
Scoring functions trained on diverse classes of protein–ligandomplexes were used to rank order molecular designs targeting apecific protein [10,11]. Scoring functions are used to make a pri-ri determination whether a compound would be active or not.here are a lot of physical and chemical reasons why a compoundill not exhibit activity against a given target; such as conforma-
ional flexibility, electrostatic repulsion, desolvation energy, pKa
f a charged moiety, inappropriate stereochemistry, solubility, etc.he common use of scoring functions is to rank order docked com-ounds [45]. Some scoring functions perform well on some classesf proteins, while some perform better on others in rank orderingocked compounds in them [45,46]. A common approach has beeno use consensus among a handful of scoring functions to selectompounds. In general the scoring functions were developed toandle non-covalent interactions, though some treatments includeroteins with metal containing binding sites [47].
We developed an improved scoring function to assess bindingffinity of compounds that get grown or assembled in the proteininding sites with Contour [48]. Contour is a structure-based designechnology that grows drug-like molecules by assembling contextensitive fragments in well-defined binding pockets of proteins.he molecular assembly process in the binding site is carried out by
combinatorially efficient growth algorithm, and the selection ofelevant grown molecules is assisted by a novel chemically intuitivecoring function. Contour is also capable of docking and scoringolecules in protein binding sites.The first generation of Contour scoring function was a coarse-
rained knowledge-based function trained on X-ray structures ofrotein–ligand complexes and associated affinity data [48]. The
ontact density distributions generated from interatomic interac-ions within 5 A formed the basis for the scoring function. The latesteneration of Contour scoring function captures the classical chem-cal and physical principles of interatomic interactions. An atomicnLP 0� 0
model borrowing features from valence bond and VSEPR theorieshas been developed to represent the molecular electronic environ-ment. The molecular orbitals of atoms are modeled by a physicalconstruct called zones, and they represent electron lone pairs,p-orbitals, polar and non-polar hydrogens based on the atomichybridization and polarity. A simple formal charge model wasused to define polar zones (N and O atoms), and null charge fornon-polar zones (carbon, halogen, and sulfur atoms). This atomicdescription was adopted for both the protein and the ligand atoms.The input data contained protein–ligand complexes, alternate non-native conformations of ligands as decoys, and affinity data. Thisinput data fit using a support vector bounding algorithm gener-ated the scoring function. A cross-validated training procedure afteriterative fitting led to a linear sum of pair-wise interatomic interac-tions including hydrogen bonds, electrostatic repulsion, non-polarattraction, and non-polar repulsion, and a surface area based des-olvation energy term.
2. Theory and methodology
Contour employs a novel growth algorithm for efficientlysearching very large chemical and conformational space for assem-bling drug-like molecules. Molecules are grown within a proteinbinding site starting from a user positioned starting fragment.Grown molecules are scored using the scoring function describedbelow.
2.1. Contour scoring function
2.1.1. Directional contact modelContour scoring function is based on a directional contact model
in which both distance and orientation are used to characterizethe geometry of atom–atom interactions. The directional modelcaptures the basic molecular interactions such as hydrogen bond,short-range electrostatic repulsion, non-polar interaction, desol-vation effect, and screening of long-range interactions by theshort-range ones. The convenience of the model is that it facili-tates the computation of hydrogen bonding geometry, and a novelapproach to calculate surface area.
The zones representing atomic features of a given heavy atomare based on the electronic orbital hybridization state of a givenatom in its molecular environment. This description of atomicrepresentation results in the following 4 categories of zones: (1)heavy atom zone (HA) representing the direction of the bond vec-tor to another heavy atom, and thus inaccessible for interaction; (2)polar hydrogen (pH (q+)) and non-polar hydrogen (nH (q0)) zones;(3) polar lone pair (pLP (q−)) and non-polar lone pair (nLP (q0))zones,); and (4) � zones representing p-orbitals (� (q0)); all of themschematically shown in the Appendix (Fig. 1). All polar zones arisefrom either a nitrogen or an oxygen atom, and depending upon the
hybridization state either have a polar hydrogen zone with positivecharge or a negative polar lone pair zone(s) with a negative charge.The non-polar zones from all the other heavy atoms get assigneda zero charge (Table 1). The charges for the weak interactions are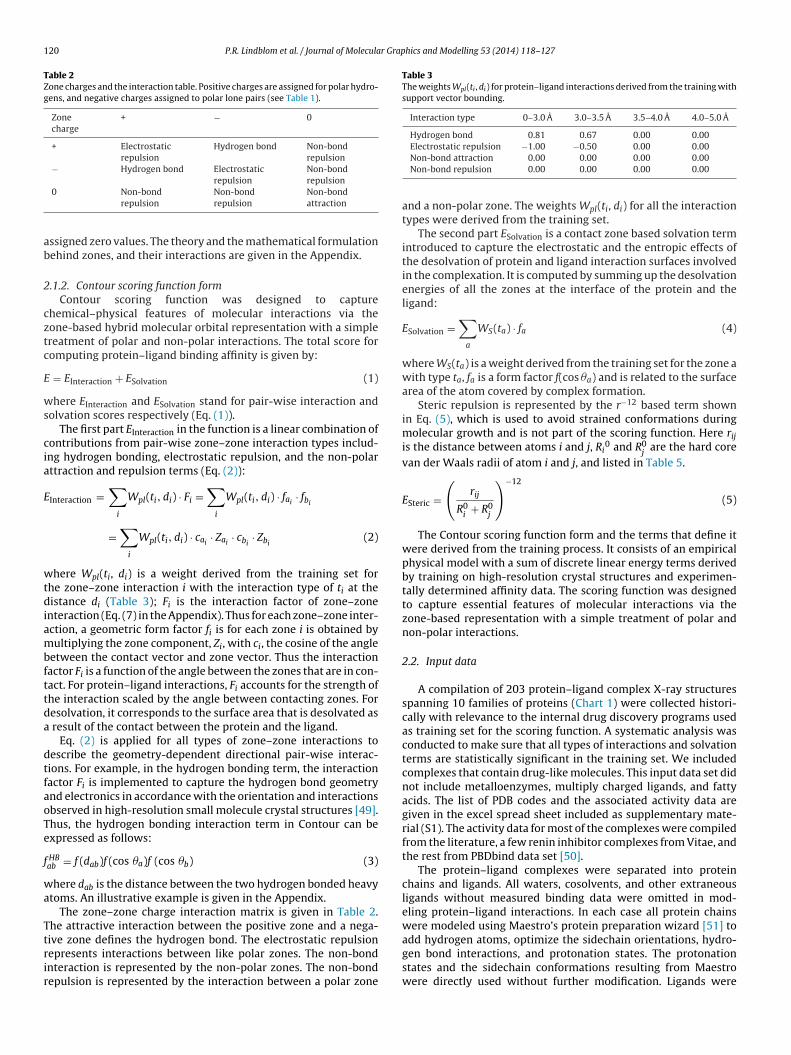
120 P.R. Lindblom et al. / Journal of Molecular Graphics and Modelling 53 (2014) 118–127
Table 2Zone charges and the interaction table. Positive charges are assigned for polar hydro-gens, and negative charges assigned to polar lone pairs (see Table 1).
Zonecharge
+ − 0
+ Electrostaticrepulsion
Hydrogen bond Non-bondrepulsion
− Hydrogen bond Electrostaticrepulsion
Non-bondrepulsion
ab
2
cztc
E
ws
cia
E
wtdiambfttda
dtfaoTe
f
wa
Ttrir
Table 3The weights Wpl(ti , di) for protein–ligand interactions derived from the training withsupport vector bounding.
Interaction type 0–3.0 A 3.0–3.5 A 3.5–4.0 A 4.0–5.0 A
Hydrogen bond 0.81 0.67 0.00 0.00Electrostatic repulsion −1.00 −0.50 0.00 0.00
0 Non-bondrepulsion
Non-bondrepulsion
Non-bondattraction
ssigned zero values. The theory and the mathematical formulationehind zones, and their interactions are given in the Appendix.
.1.2. Contour scoring function formContour scoring function was designed to capture
hemical–physical features of molecular interactions via theone-based hybrid molecular orbital representation with a simplereatment of polar and non-polar interactions. The total score foromputing protein–ligand binding affinity is given by:
= EInteraction + ESolvation (1)
here EInteraction and ESolvation stand for pair-wise interaction andolvation scores respectively (Eq. (1)).
The first part EInteraction in the function is a linear combination ofontributions from pair-wise zone–zone interaction types includ-ng hydrogen bonding, electrostatic repulsion, and the non-polarttraction and repulsion terms (Eq. (2)):
Interaction =∑
i
Wpl(ti, di) · Fi =∑
i
Wpl(ti, di) · fai· fbi
=∑
i
Wpl(ti, di) · cai· Zai
· cbi· Zbi
(2)
here Wpl(ti, di) is a weight derived from the training set forhe zone–zone interaction i with the interaction type of ti at theistance di (Table 3); Fi is the interaction factor of zone–zone
nteraction (Eq. (7) in the Appendix). Thus for each zone–zone inter-ction, a geometric form factor fi is for each zone i is obtained byultiplying the zone component, Zi, with ci, the cosine of the angle
etween the contact vector and zone vector. Thus the interactionactor Fi is a function of the angle between the zones that are in con-act. For protein–ligand interactions, Fi accounts for the strength ofhe interaction scaled by the angle between contacting zones. Foresolvation, it corresponds to the surface area that is desolvated as
result of the contact between the protein and the ligand.Eq. (2) is applied for all types of zone–zone interactions to
escribe the geometry-dependent directional pair-wise interac-ions. For example, in the hydrogen bonding term, the interactionactor Fi is implemented to capture the hydrogen bond geometrynd electronics in accordance with the orientation and interactionsbserved in high-resolution small molecule crystal structures [49].hus, the hydrogen bonding interaction term in Contour can bexpressed as follows:
HBab = f (dab)f (cos �a)f (cos �b) (3)
here dab is the distance between the two hydrogen bonded heavytoms. An illustrative example is given in the Appendix.
The zone–zone charge interaction matrix is given in Table 2.he attractive interaction between the positive zone and a nega-
ive zone defines the hydrogen bond. The electrostatic repulsionepresents interactions between like polar zones. The non-bondnteraction is represented by the non-polar zones. The non-bondepulsion is represented by the interaction between a polar zoneNon-bond attraction 0.00 0.00 0.00 0.00Non-bond repulsion 0.00 0.00 0.00 0.00
and a non-polar zone. The weights Wpl(ti, di) for all the interactiontypes were derived from the training set.
The second part ESolvation is a contact zone based solvation termintroduced to capture the electrostatic and the entropic effects ofthe desolvation of protein and ligand interaction surfaces involvedin the complexation. It is computed by summing up the desolvationenergies of all the zones at the interface of the protein and theligand:
ESolvation =∑
a
WS(ta) · fa (4)
where WS(ta) is a weight derived from the training set for the zone awith type ta, fa is a form factor f(cos �a) and is related to the surfacearea of the atom covered by complex formation.
Steric repulsion is represented by the r−12 based term shownin Eq. (5), which is used to avoid strained conformations duringmolecular growth and is not part of the scoring function. Here rijis the distance between atoms i and j, Ri
0 and R0j
are the hard corevan der Waals radii of atom i and j, and listed in Table 5.
ESteric =(
rij
R0i
+ R0j
)−12
(5)
The Contour scoring function form and the terms that define itwere derived from the training process. It consists of an empiricalphysical model with a sum of discrete linear energy terms derivedby training on high-resolution crystal structures and experimen-tally determined affinity data. The scoring function was designedto capture essential features of molecular interactions via thezone-based representation with a simple treatment of polar andnon-polar interactions.
2.2. Input data
A compilation of 203 protein–ligand complex X-ray structuresspanning 10 families of proteins (Chart 1) were collected histori-cally with relevance to the internal drug discovery programs usedas training set for the scoring function. A systematic analysis wasconducted to make sure that all types of interactions and solvationterms are statistically significant in the training set. We includedcomplexes that contain drug-like molecules. This input data set didnot include metalloenzymes, multiply charged ligands, and fattyacids. The list of PDB codes and the associated activity data aregiven in the excel spread sheet included as supplementary mate-rial (S1). The activity data for most of the complexes were compiledfrom the literature, a few renin inhibitor complexes from Vitae, andthe rest from PBDbind data set [50].
The protein–ligand complexes were separated into proteinchains and ligands. All waters, cosolvents, and other extraneousligands without measured binding data were omitted in mod-eling protein–ligand interactions. In each case all protein chainswere modeled using Maestro’s protein preparation wizard [51] to
add hydrogen atoms, optimize the sidechain orientations, hydro-gen bond interactions, and protonation states. The protonationstates and the sidechain conformations resulting from Maestrowere directly used without further modification. Ligands were
P.R. Lindblom et al. / Journal of Molecular Graphics and Modelling 53 (2014) 118–127 121
Arabinose bindi ngproteinsAspartyl Proteases
Elastases
kinases
Nuclear hormonereceptorsOligo-pep�debinding proteinsOther
Ribose bindingproteinsSerine proteases
T4 lysozym es
Ct
pottewcpc
2
dCvcTsitirwbom
z
wm
3
3
p(thn
0
5
10
15
20
0 1 2 3 4 5 6 7 8
Freq
uenc
y (%
)
Cont act Dista nce (Å)
Contact zo ne ty pes
All
Hbond
ERe p
NBa�
NBrep
05
1015202530
0 1 2 3 4 5
Freq
uenc
y (%
)
Contact Distance (Å )
Hydroge n bond atom types
All
N-N
N-O
O-O
a
b
Chart 2. Histogram plots of zone–zone interactions from the protein–ligand X-ray
hart 1. Distribution of protein families from protein–ligand complexes used in theraining set.
rocessed with Maestro tool Assign-bond-orders [52]. The bondrders and protonation states were visually checked, and the pro-onation states of positively charged species were determined byhe bond orders and the expected pKa of the atom at pH 7. Forach ligand at least 25 distinct conformations were generatedith Contour growth algorithm. In the training process the X-ray
onformation served as the best scoring conformer, while the com-uted conformations were treated as non-native or decoys andonstrained to score less than the X-ray conformer.
.3. Support vector bounding
An algorithm designed to take input data with activity values,iscrete bounds, and classification criteria was used to generate theontour scoring function. This methodology is a hybrid of supportector machine and support vector regression methods, in whichlassification and regression modeling techniques are combined.he algorithm shares several advantages of both these techniques,uch as a sparse solution space, absence of local minima, the abil-ty to control the capacity of the system to prevent overfitting, andhe ability to model non-linear functions using linear operationsn a kernel-induced feature space [53]. Through fitting the sco-ing function with the training set, the algorithm will generate theeights for zone–zone interaction and zone solvation descriptors,
ut it also will provide the z-scores representing the significancef the descriptors to the models. The z-scores are determined fromulti-fold cross validations using equation 6:
(i) = �(i)�(i)
(6)
here �(i) is the mean of computed weights for descriptor i fromulti-fold cross validations and �(i) is the standard deviation.
. Results
.1. Scoring function model generation
The zones used for protein–ligand interactions are as follows:olar hydrogen (pH), non-polar hydrogen (nH), polar lone pair
pLP), non-polar lone pair (nLP), and � (p-orbitals). These zoneshus allow four major types of protein–ligand interactions: theydrogen bond, electrostatic repulsion, non-bond interaction, andon-bond repulsion (Tables 1–2). Accordingly zone desovlationtraining set generated using the Contour’s atomic contact model and 8 A cutoff: (a)distribution of all zone–zone interactions and (b) distribution of hydrogen bondinteraction types.
effects are represented by protein polar zone, protein non-polarzone, ligand polar zone, and ligand non-polar zone.
3.2. Distance-dependent distribution of zone–zone interactions
In order to visualize the distribution of zone–zone interactiondistances in the input X-ray structures of protein–ligand complexesin the training set we computed the interaction distances using an8 A cut-off and our contact model (Chart 2). It is interesting to note,not unexpectedly, that all the zone–zone contacts from the den-sity plot are in the range of 2.4–5.0 A (Chart 2a). The non-bondinteractions including non-bond attraction and non-bond repul-sion display a normal distribution within 5.0 A. Also worth notingis that the occurrence of electrostatic repulsion in the X-ray struc-tures is rare. This is consistent with the idea that protein–ligandassociation is mainly driven by attractive forces with minimal orno repulsive forces. As expected the hydrogen bond interactionslargely fall within a narrow range of 2.4–3.5 A with the highestpeak observed at 2.8 A (Chart 2b). On the basis of this distribu-tion 4 distance bins were proposed: 0–3.0 A, 3.0–3.5 A, 3.5–4.0 A,and 4.0–5.0 A. Thus, a total of 20 descriptors were used in derivingthe final scoring function that include 16 zone–zone interactionsarising from 4 types of interactions for 4 distance bins, and 4 des-olvation terms.
3.3. Training of Contour scoring function
The support-vector bounding algorithm was applied to all20 descriptors computed from the 203 X-ray structures ofprotein–ligand complexes and their decoys to derive descrip-tor weights by simultaneously fitting to the associated bindingconstants. The iterative process of fitting a random set of 80% ofthe input data set followed by the prediction of the binding affin-ity for the rest of the 20% of the data set was continued until
the weights achieved convergence. The descriptors that exhib-ited significant contributions to the prediction of binding affinityof protein–ligand complexes were identified using z-score, whichled to the selection of terms with non-zero weights including 2
122 P.R. Lindblom et al. / Journal of Molecular Graphics and Modelling 53 (2014) 118–127
Fig. 1. Contour scores for renin inhibitor from the X-ray structure (PDB code 3Q3T). The pKi of the compound is 7.44 and the predicted Contour score is 7.52. For each atom,the Contour score is summed up to show their binding contribution.
Table 4The weights WS(ti) solvation derived from training. The negative weights repre-sent penalty for desolvating polar zones, and positive weights represent benefit indesolvating non-polar zones.
Interaction type Non-polar desolvation Polar desolvation
hfoosiitm81s(ff
fi
THfi
0.0
2.0
4.0
6.0
8.0
10.0
12.0
0.0 2.0 4. 0 6.0 8. 0 10.0 12. 0
Pred
icte
d Co
ntou
r Sco
re
Experimental pKi
Training Pe rformanc e
Renin Complexes
Other Complexes
Chart 3. Performance of the Contour scoring function on the training set, wherepKi is defined as −log(Ki). The Contour score is expressed as −log(Ki) predicted. The
from the strong ones (<1 �M) leads the scores to be reliable in iden-tifying grown molecules that are most likely to exhibit activity.
Ligand zones 0.08 −0.14Protein zones 0.08 −0.14
ydrogen bond and 2 electrostatic repulsion terms (≤3 A, 3.0–3.5 A)or the protein–ligand interactions, and 4 non-polar and polar des-lvation terms for ligand and protein zones. Thus there were a totalf 8 parameters or descriptors used as input for training the finalcoring function with the entire training set. The final zone–zonenteraction descriptors, and their associated weights are shownn Table 3, and the weights associated with the zone desolvationerms are shown in Table 4. The final Contour score is approxi-
ately equivalent to pKi (−log Ki). For example, scores of 6.0, 7.0,.0, 9.0, and 10.0 correspond to binding constants of 1000, 100, 10,.0, and 0.1 nM respectively. Fig. 1 illustrates the calculated Contourcores for a renin compound VTP-000026080, where the −log Kiexpt.) is 7.44 and the computed score is 7.52. The contributionrom hydrogen bonding is 3.88, and that from desolvation is 3.65or the computed score.
The predictive performance of the final model of the scoringunction for the 203 protein–ligand complexes in the training sets shown in Charts 3 and 4. The model shows a correlation of 0.61
able 5ard core van der Waals radii used in steric function adopted from Amber 4.0 forceeld [63].
Element Radius
H 1.0C 1.6N 1.5O 1.4P 1.9S 1.85F 1.4Cl 1.8Br 1.85I 2.1B 1.6Metal ions 1.7
correlation of the above prediction is 0.61, and RMSE of 1.20. The solid line runsthrough the origin for reference, and the dashed lines above and below mark the2.0 log units from this reference line.
indicating an acceptable level of accuracy of the estimation of bind-ing affinities. A clear separation of the weak binders (>1000 mM)
Thus, Contour scoring function serves the purpose of identifyingcompounds that are worth pursuing.
0
20
40
60
80
100
1.50 to 3.000.00 to 1.50-1.50 to 0.00-4.5 to -1.5
Distribu�on of predic�onerrors
Chart 4. Distribution of differences in predicted versus experimental values. Thenegative values indicate that the scoring function is underpredicting the activity,and the positive values conversely indicate overprediction. The scoring functionpredicts equal to or less than the experimental value in 56% of the cases, however75% of the predictions are within 1.5 log of the observed values.

P.R. Lindblom et al. / Journal of Molecular Graphics and Modelling 53 (2014) 118–127 123
0
2
4
6
8
10
12
0 2 4 6 8 10 12
Pred
icte
d Co
ntou
r Sco
re
Experimen tal pKi
Contou r Pe rformance on 11 7Compl exes fr om PD Bbind
Chart 5. Contour scoring function performance on a validation set of 117pCo
3p
ttgTfit
Fcoauamm3
0123456789
10
-150 -100 -50 0
pIC5
0
MM-G BSA Energ y (kCal/mol)
A - Pr ime MM-G BSA
0
2
4
6
8
10
0 2 4 6 8 10pI
C50
Contou r Score
B - Co ntou r
Chart 6. Correlation plots for 128 X-ray structures of non-peptidic BACE1 inhibitors.In panel A, the calculated interaction energies with MM-GBSA plotted against IC50
rotein–ligand complexes [35]. The solid line and the dashed lines as defined inhart 3. Contour score is meant to be equivalent to pKi . A correlation of 0.57 isbserved with this data set and an RMSE of 1.61.
.4. Scoring function validation: external validation set ofrotein–ligand complexes
A physically meaningful and reasonably accurate scoring func-ion developed with a careful choice of molecular descriptors, and araining process identified interaction energy terms that have tan-ible relationship to the association process of proteins and ligands.
his was further buttressed by a solid performance of the scoringunction with a good correlation between the theory and the exper-ment. A scoring function thus derived boosted our confidence toest its predictive power on protein–ligand complexes not in theig. 2. Crystal structure of human transthyretin complexed with bromophenol (PDBode 1e5a), an outlier in Chart 5. Contour predicted an activity of 2.7 versus 7.6bserved for the bromophenol shown in the structure. This example appears to ben outlier for most of the scoring functions tested by Cheng et al. [35]. Two monomernits of the protein bound to bromophenol with lysines from each monomer inter-cting with the hydroxyl of bromophenol. The non-polar residues shown for theonomer on the top are symmetrically opposite to the ones from the secondonomer on the bottom. The picture was rendered using Accelrys’ Discovery Studio
.5 [62].
values. The energies with MM-GBSA were calculated using the protein from pdbcode 2OHU [61] and X-ray bound conformations of ligands. The strain energy cor-rection was not used. The MM-GBSA energies were computed with Prime programin Maestro interface from Schrodinger Inc. [52]. A correlation of 0.66 and root meansquared error (RMSE) of 0.97 was obtained with the Prime MM-GBSA protocol. In
Panel B, Contour scores plotted against the IC50 values, with a correlation of 0.55and an RMSE of 1.11.training set. The performance of the scoring function was tested ona diverse set of protein–ligand complexes.
Contour’s performance on this validation set with a correlationof 0.57 is remarkably similar to that on the training set (Chart 5).This robust performance gave us the confidence that the scoringfunction devised most likely has interaction terms and the formu-lation that are transferable and reliable enough to use for scoringprotein–ligand complexes outside the training set. Contour scoringfunction performance is among the best scoring functions in theliterature displaying good scoring power (Table 6). This ability toscore protein–ligand complexes not in the training set, has allowedus to apply it to successfully design inhibitors for renin, 11� HSD-1enzyme, LXR agonists, and BACE1 inhibitors [48,53–59].
The worst predicted activity for the complexes from pdb codes2i0d and 1e5a are off by ∼5 log units. The examination of the struc-ture from 1e5a reveals that the compound bromophenol boundto the human transthyretin has the phenolic hydroxyl hydrogenbonded with the lysines from the two monomers, and the restof the molecule interacting with non-polar residues (Fig. 2). Thepresence of two bromine atoms adjacent to the hydroxyl groupwould be treated as partially screened interaction with lysines, andthe bromines treated as non-polar atoms may not electrostaticallycontribute with the Contour scoring function. The structure from
2i0d contains a large ligand with most of the multiple polar groupsinteracting poorly with the protein. It appears that in this case Con-tour assigned a large desolvation penalty for these polar groups.
124 P.R. Lindblom et al. / Journal of Molecular Graphics and Modelling 53 (2014) 118–127
R² = 0.809 2
-100
-80
-60
-40
-20
0
0 2 4 6
MM
-GBS
A Sc
ore
(kca
l/m
ol)
Pki
R² = 0.94 61
0
1
2
3
4
5
6
7
0 2 4 6
Cont
our S
core
Pki
R² = 0.7513
-140-120-100
-80-60-40-20
0
0 5 10MM
-GBS
A Sc
ore
(kca
l/m
ol)
Pki
R² = 0.8712
01234567
0 5 10
Cont
our S
core
Pki
R² = 0.3046
-100
-80
-60
-40
-20
0
0 2 4 6 8MM
-GBS
A Sc
ore
(kca
l/m
ol)
Pki
R² = 0.493 2
012345678
0 2 4 6 8Co
ntou
r Sco
rePki
R² = 0.00 2
-60
-50
-40
-30
-20
-10
0
0 2 4 6
MM
-GBS
A Sc
ore
(kca
l/m
ol)
Pki
R² = 0.4 082
00.5
11.5
22.5
33.5
44.5
0 2 4 6
Cont
our S
core
Pki
1a 1b
2a 2b
3a 3b
4a 4b
C ng funi roteinh chieve
Os
3M
t
hart 7. Comparison of the activity predictions by MM-GBSA and Contour scorinhibitors were taken from the crystal structures and then superimposed into the pigh correlations with R2 greater than 0.7 for two series, and in addition, Contour a
bviously these two cases support a need for an improved chargingcheme.
.5. Scoring and ranking power of Contour versus that of
M-GBSAA reliable performance of the Contour scoring function beyondhe training data set was further examined to validate the scoring
ction for 4 congeneric series of BACE-1 inhibitors. Conformations of the BACE1 conformation from 2OHU crystal structure. Both MM-GBSA and Contour obtainedd reasonable performance for the other 2 series.
power with a diverse set of crystal structures of BACE1 inhibitorcomplexes, and a more challenging test with a congeneric seriesof BACE1 inhibitors without crystal structures. BACE1 complexcrystal structures with a broad range of activity (mM–nM), as
demonstrated with the training set, provided a very good chancefor the Contour scoring function to perform well. As expected a0.55 correlation was obtained with BACE1 inhibitor complexes(Chart 6). As a comparator we used the OPLS force field based
P.R. Lindblom et al. / Journal of Molecular Grap
Table 6Comparison of Contour scoring function performance versus other scoring functions[35].
Scoring function Correlation R Correlation R2 95% confidenceinterval
Contour 0.75 0.57 0.25DS::Jain 0.40 0.16 0.34DS:LigScore2 0.54 0.29 0.32DS::LUDI3 0.50 0.25 0.32DS::PLP1 0.66 0.44 0.28DS::PMF 0.62 0.38 0.29DrugscoreCSD::PairSurf 0.69 0.49 0.27GOLD::ASP 0.59 0.35 0.30GOLD::ChemScore 0.41 0.17 0.34GOLD::GoldScore 0.15 0.02 0.37GlideScore::XP 0.07 0.005 0.37
McwCsofCha2pM
4
mcTtaats
dthtrota
zad
5sowb
rem
protein stability and ligand binding, Acc. Chem. Res. 34 (5) (2001) 379–388.[6] R.O. Dror, R.M. Dirks, J.P. Grossman, H. Xu, D.E. Shaw, Biomolecular simulation: a
computational microscope for molecular biology, Annu. Rev. Biophys. 41 (2012)
SYBYL::ChemScore 0.58 0.34 0.30X-Score1.2::HMScore 0.73 0.53 0.26
M-GBSA protocol from the Prime program to score these BACE1rystal structures [60]. This protocol yielded a better performanceith a correlation of 0.66, however qualitatively similar to that ofontour’s performance (Chart 6). After comparing the structuralimilarity and binding poses of the ligands, four congeneric subsetsf BACE1 crystal structures were created. These subsets were usedor a detailed head-to-head comparison of the performances ofontour and MM-GBSA. Both MM-GBSA and Contour obtainedigh correlations with R2 great than 0.7 for two series, and inddition, Contour achieved reasonable performance for the other
subsets (Chart 7). It is encouraging that Contour shows a robusterformance close to the best MM-GBSA protocol available fromaestro [52]. This data is provided in the Supplementary Table S3.
. Discussion
A novel zone based interaction model, representing the hybridolecular orbitals, allowed us to capture a qualitative physi-
al model that is sensitive to electronic environment of atoms.his model is capable of qualitatively representing the atoms andheir interaction effects relevant for protein:ligand complexes. Andvantage of this physical model is its ability to capture inter-tomic interactions that are sensitive to the hybridization state ofhe atoms involved, which is not possible with a conventional hardphere model of atoms.
The explicit lone pair representation allows us to capture theirectional interaction of hydrogen bonds much more accuratelyhan those without them. The formal charges assigned for theydrogen bond donor and the lone pairs are simple, but not consis-ent with quantum mechanical calculations. So a more reasonableepresentation of the charges for these moieties should be basedn a suitable choice of a quantum mechanical method to partitionhese charges rationally to represent the zone polarity appropri-tely.
In the current model, halogens, F, Cl, Br, and I, are givenero charge with no positive interaction benefit in protein–ligandffinity calculation. However, their only contribution comes fromesolvation.
The contact model used here accounts for interactions up toA, and the interactions beyond this distance are assumed to be
creened. This assumption may be a good approximation in aque-us medium with high dielectric, but in the protein environmenthere long-range interactions could play a significant role in the
inding affinity of ligands this could pose a challenge.
Despite the above limitations mentioned above the features rep-esented by the Contour scoring function are able to capture keylements of binding interactions as demonstrated by its perfor-ance on the training set and the validation examples presented
hics and Modelling 53 (2014) 118–127 125
in this account. The scoring power of Contour is among the bestas judged by its performance on the validation set from Wang’slab (Table 6) [35]. This ability is key to the success of our scoringfunction in identifying compounds designed by Contour’s growthalgorithm that have the likelihood of exhibiting activity. A modi-fication is needed to improve the ranking power for it to be moreuseful for lead optimization, which comprises the majority of thedrug design efforts. A careful examination of the mispredictions,mostly on the weaker side of affinity, appears due to the simpleelectrostatic model adopted by the scoring function. For instance,electrostatic repulsion arising due to the misassignment of formalcharge on the terminal oxygen atom of the carbamate group, andon certain ether oxygens, etc., for renin inhibitors lead to incorrectaffinity predictions. Another source of error is the inappropriateconformational preferences assigned due to lack of proper torsionalparameters.
5. Conclusion
Contour scoring function consists of a unique physical modelwith electronic zones consistent with hybridization states of atoms.This model offers advantage over hard sphere models by providinga means to capture intermolecular interactions sensitive to direc-tion and orientation of atoms. A simple electrostatic charge modeladopted for the atomic zones predicts affinities of protein–ligandcomplexes consistently well across validation sets. Contour’s bind-ing affinity predictive power is comparable to the best scoringfunctions in the literature. The examination of mispredicted activ-ities points to a need for an improved charge model in futuredevelopment.
Acknowledgments
We thank Jun Shimada, Alexei Ischenko, David Lawson, Yua-jie Ye, Jean-Pierre Wery, Zhongren Wu, Brian Mckeever, Kristi Fan,Yajun Zheng, Colin Tice, Larry Dillard, Yuri Bukthiyarov, RichardHarrison, and Jerry McGeehan for their help. We acknowledge valu-able discussions with William Jorgensen of Yale University andEugene Shakhnovich of Harvard University. We are grateful toRenxiao Wang of Shangai Institute of Organic Chemistry for pro-viding us with the PDBbind validation set and the full set of scores.
Appendix A. Supplementary data
Supplementary data associated with this article can befound, in the online version, at http://dx.doi.org/10.1016/j.jmgm.2014.07.010.
References
[1] A. Fersht, Enzyme Structure and Mechanism, 2nd ed., W.H. Freeman and Com-pany, New York, 1985, pp. 475.
[2] H. Gohlke (Ed.), Protein–Ligand Interactions, vol. 53, Wiley-VCH Verlag GmbH& Co. KGaA, Weinheim, 2012, pp. 1–339.
[3] H.X. Zhou, M.K. Gilson, Theory of free energy and entropy in noncovalent bind-ing, Chem. Rev. 109 (9) (2009) 4092–4107.
[4] K.W. Harpole, K.A. Sharp, Calculation of configurational entropy with aBoltzmann-quasiharmonic model: the origin of high-affinity protein–ligandbinding, J. Phys. Chem. B 115 (30) (2011) 9461–9472.
[5] M.J. Stone, NMR relaxation studies of the role of conformational entropy in
429–452.[7] P. Kollman, Free energy calculations: applications to chemical and biochemical
phenomena, Chem. Rev. 93 (7) (1993) 2395–2417.[8] W.L. Jorgensen, Efficient drug lead discovery and optimization, Acc. Chem. Res.
42 (6) (2009) 724–733.

1 r Grap
[
[
[
[
[
[
[
[
[
[
[
[
[
[
[
[
[
[
[
[[
[
[
[
[
[
[
[
[
[
[
[
[
[
[
[
[
[
[
[
[
[
[
[
[
[
[
[
[
26 P.R. Lindblom et al. / Journal of Molecula
[9] J.D. Chodera, D.L. Mobley, M.R. Shirts, R.W. Dixon, K. Branson, V.S. Pande,Alchemical free energy methods for drug discovery: progress and challenges,Curr. Opin. Struct. Biol. 21 (2) (2011) 150–160.
10] H.J. Bohm, The development of a simple empirical scoring function to estimatethe binding constant for a protein–ligand complex of known three-dimensionalstructure, J. Comput. Aided Mol. Des. 8 (3) (1994) 243–256.
11] D.K. Gehlhaar, G.M. Verkhivker, P.A. Rejto, C.J. Sherman, D.B. Fogel, L.J. Fogel,S.T. Freer, Molecular recognition of the inhibitor AG-1343 by HIV-1 protease:conformationally flexible docking by evolutionary programming, Chem. Biol. 2(5) (1995) 317–324.
12] G. Jones, P. Willett, R.C. Glen, Molecular recognition of receptor sites using agenetic algorithm with a description of desolvation, J. Mol. Biol. 245 (1) (1995)43–53.
13] A.N. Jain, Scoring noncovalent protein–ligand interactions: a continuous dif-ferentiable function tuned to compute binding affinities, J. Comput. Aided Mol.Des. 10 (5) (1996) 427–440.
14] M.D. Eldridge, C.W. Murray, T.R. Auton, G.V. Paolini, R.P. Mee, Empirical scoringfunctions: I. The development of a fast empirical scoring function to estimatethe binding affinity of ligands in receptor complexes, J. Comput. Aided Mol. Des.11 (5) (1997) 425–445.
15] G. Jones, P. Willett, R.C. Glen, A.R. Leach, R. Taylor, Development and vali-dation of a genetic algorithm for flexible docking, J. Mol. Biol. 267 (3) (1997)727–748.
16] H.J. Bohm, Prediction of binding constants of protein ligands: a fast method forthe prioritization of hits obtained from de novo design or 3D database searchprograms, J. Comput. Aided Mol. Des. 12 (4) (1998) 309–323.
17] G.M. Morris, D.S. Goodsell, R.S. Halliday, R. Huey, W.E. Hart, R.K. Belew,A.J. Olson, Automated docking using a Lamarckian genetic algorithm andan empirical binding free energy function, J. Comput. Chem. 19 (14) (1998)1639–1662.
18] I. Muegge, Y.C. Martin, A general and fast scoring function for protein–ligandinteractions: a simplified potential approach, J. Med. Chem. 42 (5) (1999)791–804.
19] H. Gohlke, M. Hendlich, G. Klebe, Knowledge-based scoring function to predictprotein–ligand interactions, J. Mol. Biol. 295 (2) (2000) 337–356.
20] T.J. Ewing, S. Makino, A.G. Skillman, I.D. Kuntz, DOCK 4.0: search strategies forautomated molecular docking of flexible molecule databases, J. Comput. AidedMol. Des. 15 (5) (2001) 411–428.
21] R. Wang, L. Lai, S. Wang, Further development and validation of empirical sco-ring functions for structure-based binding affinity prediction, J. Comput. AidedMol. Des. 16 (1) (2002) 11–26.
22] B.A. Grzybowski, A.V. Ishchenko, J. Shimada, E.I. Shakhnovich, From knowledge-based potentials to combinatorial lead design in silico, Acc. Chem. Res. 35 (5)(2002) 261–269.
23] R.A. Friesner, J.L. Banks, R.B. Murphy, T.A. Halgren, J.J. Klicic, D.T. Mainz,M.P. Repasky, E.H. Knoll, M. Shelley, J.K. Perry, D.E. Shaw, P. Francis, P.S.Shenkin, Glide: a new approach for rapid, accurate docking and scoring. 1.Method and assessment of docking accuracy, J. Med. Chem. 47 (7) (2004)1739–1749.
24] C. Zhang, S. Liu, Q. Zhu, Y. Zhou, A knowledge-based energy function forprotein–ligand, protein–protein, and protein–DNA complexes, J. Med. Chem.48 (7) (2005) 2325–2335.
25] H.F. Velec, H. Gohlke, G. Klebe, DrugScore(CSD)-knowledge-based scoring func-tion derived from small molecule crystal data with superior recognition rate ofnear-native ligand poses and better affinity prediction, J. Med. Chem. 48 (20)(2005) 6296–6303.
26] W.T. Mooij, M.L. Verdonk, General and targeted statistical potentials forprotein–ligand interactions, Proteins: Struct. Funct. Bioinf. 61 (2) (2005)272–287.
27] A. Krammer, P.D. Kirchhoff, X. Jiang, C.M. Venkatachalam, M. Waldman,LigScore: a novel scoring function for predicting binding affinities, J. Mol.Graphics Modell. 23 (5) (2005) 395–407.
28] S.Y. Huang, X. Zou, An iterative knowledge-based scoring function to predictprotein–ligand interactions: I. Derivation of interaction potentials, J. Comput.Chem. 27 (15) (2006) 1866–1875.
29] I. Muegge, PMF scoring revisited, J. Med. Chem. 49 (20) (2006) 5895–5902.30] P. Pfeffer, H. Gohlke, DrugScoreRNA—knowledge-based scoring function
to predict RNA–ligand interactions, J. Chem. Inf. Model. 47 (5) (2007)1868–1876.
31] C.A. Sotriffer, P. Sanschagrin, H. Matter, G. Klebe, SFCscore: scoring functions foraffinity prediction of protein–ligand complexes, Proteins: Struct. Funct. Bioinf.73 (2) (2008) 395–419.
32] S. Raub, A. Steffen, A. Kamper, C.M. Marian, AIScore chemically diverseempirical scoring function employing quantum chemical binding ener-gies of hydrogen-bonded complexes, J. Chem. Inf. Model. 48 (7) (2008)1492–1510.
33] I. Reulecke, G. Lange, J. Albrecht, R. Klein, M. Rarey, Towards an integrateddescription of hydrogen bonding and dehydration: decreasing false positivesin virtual screening with the HYDE scoring function, ChemMedChem 3 (2008)885–897 (1870-7187 (electronic)).
34] O.V. Stroganov, F.N. Novikov, V.S. Stroylov, V. Kulkov, G.G. Chilov, Lead
finder: an approach to improve accuracy of protein–ligand docking, bindingenergy estimation, and virtual screening, J. Chem. Inf. Model. 48 (12) (2008)2371–2385.35] T. Cheng, X. Li, Y. Li, Z. Liu, R. Wang, Comparative assessment of scoring func-tions on a diverse test set, J. Chem. Inf. Model. 49 (4) (2009) 1079–1093.
[
hics and Modelling 53 (2014) 118–127
36] S.Y. Huang, X. Zou, Inclusion of solvation and entropy in the knowledge-basedscoring function for protein–ligand interactions, J. Chem. Inf. Model. 50 (2)(2010) 262–273.
37] M. Xue, M. Zheng, B. Xiong, Y. Li, H. Jiang, J. Shen, Knowledge-based scoring functions in drug design. 1. Developing a target-specificmethod for kinase–ligand interactions, J. Chem. Inf. Model. 50 (8) (2010)1378–1386.
38] G. Neudert, G. Klebe, DSX: a knowledge-based scoring function for theassessment of protein–ligand complexes, J. Chem. Inf. Model. 51 (10) (2011)2731–2745.
39] Y.T. Tang, G.R. Marshall, PHOENIX: a scoring function for affinity predictionderived using high-resolution crystal structures and calorimetry measure-ments, J. Chem. Inf. Model. 51 (2) (2011) 214–228.
40] Q. Shen, B. Xiong, M. Zheng, X. Luo, C. Luo, X. Liu, Y. Du, J. Li, W. Zhu, J. Shen, H.Jiang, Knowledge-based scoring functions in drug design: 2. Can the knowledgebase be enriched? J. Chem. Inf. Model. 51 (2) (2011) 386–397.
41] Z. Zheng, K.M. Merz, Ligand Identification Scoring Algorithm (LISA), J. Chem.Inf. Model. 51 (6) (2011) 1296–1306.
42] J.D. Durrant, J.A. McCammon, NNScore 2.0: a neural-network receptor–ligandscoring function, J. Chem. Inf. Model. 51 (11) (2011) 2897–2903.
43] L. Li, B. Wang, S.O. Meroueh, Support vector regression scoring ofreceptor–ligand complexes for rank-ordering and virtual screening of chemicallibraries, J. Chem. Inf. Model. 51 (9) (2011) 2132–2138.
44] A. Hamza, N.-N. Wei, C.-G. Zhan, Ligand-based virtual screening approach usinga new scoring function, J. Chem. Inf. Model 52 (4) (2012) 963–974.
45] G.L. Warren, C.W. Andrews, A.-M. Capelli, B. Clarke, J. LaLonde, M.H. Lambert,M. Lindvall, N. Nevins, S.F. Semus, S. Senger, G. Tedesco, I.D. Wall, J.M. Woolven,C.E. Peishoff, M.S. Head, A critical assessment of docking programs and scoringfunctions, J. Med. Chem. 49 (20) (2006) 5912–5931.
46] R.D. Smith, J.B. Dunbar, P.M.-U. Ung, E.X. Esposito, C.-Y. Yang, S. Wang, H.A.Carlson, CSAR benchmark exercise of 2010: combined evaluation across allsubmitted scoring functions, J. Chem. Inf. Model. 51 (9) (2011) 2115–2131.
47] S.A. Hayik, R. Dunbrack, K.M. Merz, Mixed quantum mechanics/molecularmechanics scoring function to predict protein–ligand binding affinity, J. Chem.Theory Comput. 6 (10) (2010) 3079–3091.
48] A. Ishchenko, Z. Liu, P. Lindblom, G. Wu, K.-C. Jim, R.D. Gregg, D.A. Claremon,S.B. Singh, Structure-based design technology contour and its applica-tion to the design of renin inhibitors, J. Chem. Inf. Model. 52 (8) (2012)2089–2097.
49] F. Allen, The Cambridge structural database: a quarter of a million crystalstructures and rising, Acta Crystallogr. Sect. B: Struct. Sci. 58 (3 Part 1) (2002)380–388.
50] R. Wang, X. Fang, Y. Lu, S. Wang, The PDBbind database: collection of bindingaffinities for protein–ligand complexes with known three-dimensional struc-tures, J. Med. Chem. 47 (12) (2004) 2977–2980.
51] Schrödinger Suite 2006 Protein Preparation Wizard, Schrödinger, LLC, NewYork, NY.
52] Schrödinger Maestro Graphical User Interface, Maestro Version 2006,Schrödinger, LLC, New York, NY.
53] Z. Liu, P. Lindblom, D.A. Claremon, S.B. Singh, Structure-based design tech-nology CONTOUR and its application to drug discovery Innovations inBiomolecular Modeling and Simulations, vol. 2, The Royal Society of Chemistry,Cambridge, 2012, pp. 265–280 (Chapter 11).
54] Z. Xu, S. Cacatian, J. Yuan, R.D. Simpson, L. Jia, W. Zhao, C.M. Tice, P.T. Flaherty, J.Guo, A. Ishchenko, S.B. Singh, Z. Wu, B.M. McKeever, B.B. Scott, Y. Bukhtiyarov,J. Berbaum, J. Mason, R. Panemangalore, M.G. Cappiello, R. Bentley, C.P. Doe,R.K. Harrison, G.M. McGeehan, L.W. Dillard, J.J. Baldwin, D.A. Claremon, Opti-mization of orally bioavailable alkyl amine renin inhibitors, Bioorg. Med. Chem.Lett. 20 (2) (2009) 694–699.
55] C.M. Tice, Z. Xu, J. Yuan, R.D. Simpson, S.T. Cacatian, P.T. Flaherty, W. Zhao, J.Guo, A. Ishchenko, S.B. Singh, Z. Wu, B.B. Scott, Y. Bukhtiyarov, J. Berbaum, J.Mason, R. Panemangalore, M.G. Cappiello, D. Muller, R.K. Harrison, G.M. McGee-han, L.W. Dillard, J.J. Baldwin, D.A. Claremon, Design and optimization of renininhibitors: orally bioavailable alkyl amines, Bioorg. Med. Chem. Lett. 19 (13)(2009) 3541–3545.
56] C.M. Tice, W. Zhao, P.M. Krosky, B.A. Kruk, J. Berbaum, J.A. Johnson, Y.Bukhtiyarov, R. Panemangalore, B.B. Scott, Y. Zhao, J.G. Bruno, L. Howard, J.Togias, Y.J. Ye, S.B. Singh, B.M. McKeever, P.R. Lindblom, J. Guo, R. Guo, H.Nar, A. Schuler-Metz, R.E. Gregg, K. Leftheris, R.K. Harrison, G.M. McGeehan,L. Zhuang, D.A. Claremon, Discovery and optimization of adamantyl carba-mate inhibitors of 11beta-HSD1, Bioorg. Med. Chem. Lett. 20 (22) (2010)6725–6729.
57] Z. Xu, C.M. Tice, W. Zhao, S. Cacatian, Y.J. Ye, S.B. Singh, P. Lindblom, B.M.McKeever, P.M. Krosky, B.A. Kruk, J. Berbaum, R.K. Harrison, J.A. Johnson,Y. Bukhtiyarov, R. Panemangalore, B.B. Scott, Y. Zhao, J.G. Bruno, J. Togias,J. Guo, R. Guo, P.J. Carroll, G.M. McGeehan, L. Zhuang, W. He, D.A. Clare-mon, Structure-based design and synthesis of 1,3-oxazinan-2-one inhibitorsof 11beta-hydroxysteroid dehydrogenase type 1, J. Med. Chem. 54 (17) (2011)6050–6062.
58] L. Jia, R.D. Simpson, J. Yuan, Z. Xu, W. Zhao, S. Cacatian, C.M. Tice, J. Guo, A.Ishchenko, S.B. Singh, Z. Wu, B.M. McKeever, Y. Bukhtiyarov, J.A. Johnson, C.P.
Doe, R.K. Harrison, G.M. McGeehan, L.W. Dillard, J.J. Baldwin, D.A. Claremon,Discovery of VTP-27999, an alkyl amine renin inhibitor with potential for clin-ical utility, ACS Med. Chem. Lett. 2 (10) (2011) 747–751.59] J. Yuan, R.D. Simpson, W. Zhao, C.M. Tice, Z. Xu, S. Cacatian, L. Jia, P.T. Fla-herty, J. Guo, A. Ishchenko, Z. Wu, B.M. McKeever, B.B. Scott, Y. Bukhtiyarov,

r Grap
[[
[
P.R. Lindblom et al. / Journal of Molecula
J. Berbaum, R. Panemangalore, R. Bentley, C.P. Doe, R.K. Harrison, G.M. McGee-han, S.B. Singh, L.W. Dillard, J.J. Baldwin, D.A. Claremon, Biphenyl/diphenylether renin inhibitors: filling the S1 pocket of renin via the S3 pocket, Bioorg.
Med. Chem. Lett. 21 (16) (2011) 4836–4843.60] Prime Version 3.1, Schrödinger, LLC, New York, NY, 2012.61] M. Congreve, D. Aharony, J. Albert, O. Callaghan, J. Campbell, R.A. Carr, G. Ches-
sari, S. Cowan, P.D. Edwards, M. Frederickson, R. McMenamin, C.W. Murray, S.Patel, N. Wallis, Application of fragment screening by X-ray crystallography to
[
hics and Modelling 53 (2014) 118–127 127
the discovery of aminopyridines as inhibitors of beta-secretase, J. Med. Chem.50 (6) (2007) 1124–1132.
62] Discovery Studio, Discovery Studio Version 3.5.0.12158, Accelrys, Inc., San
Diego, CA, 2012.63] W.D. Cornell, P. Cieplak, C.I. Bayly, I.R. Gould, K.M. Merz Jr., D.M. Ferguson,D.C. Spellmeyer, T. Fox, J.W. Caldwell, P.A. Kollman, A second generation forcefield for the simulation of proteins, nucleic acids, and organic molecules, J. Am.Chem. Soc. 117 (1995) 5179–5197.