An electronic clock for correlated noise corrections
13
Nuclear Instruments and Methods in Physics Research A 443 (2000) 451}463 An electronic clock for correlated noise corrections W.J. Llope*, N. Adams, K.K. Kainz T.W. Bonner Nuclear Laboratory, Rice University, MS 315, 6100 S. Main Street, Houston, TX 77005-1892, USA Received 26 August 1999; accepted 22 October 1999 Abstract An inexpensive and portable approach is presented to measure the time of occurrence of an experimental event as measured by a speci"c electronic clock. The clock resets in active synchronization with the experimental AC-power cycle. This allows an e$cient and complete correction for correlated noise contributions to pulse area and time measurements of detector channels equipped with PhotoMultiplier Tubes. The electronic board that was developed will be described. The performance for the treatment of correlated noise in experimental data taken at the BNL-AGS facility, and analyses of spectral decompositions of this noise, will also be described. ( 2000 Elsevier Science B.V. All rights reserved. PACS: 84.30.Ng; 7.50.-e; 89.20.#a Keywords: Noise; Correlated; Common mode; AC line; Ground loop; ADC pedestal; 60 Hz; Synchronized electronic clock 1. Introduction Despite dedicated e!orts to insure otherwise, a voltage ripple with the same frequency as the main AC power line (60 Hz in the US) but a complicated shape and amplitude may exist on the electrical ground used in an experiment. The cause of the ripple is the existence somewhere in the experiment of at least one electrical path between the experimental ground and other grounds. These `dirtya grounds may be at di!erent mean voltages relative to the experimental ground and may be correlated with the AC power with di!erent phases, line shapes and amplitudes. Generally, experimen- ters use oscilloscopes and voltmeters to locate * Corresponding author. unwanted electrical connection(s) in the experiment that tie the experimental ground to dirty grounds. The most egregious paths can generally be located and removed in this manner, and the grounds may hence appear very clean when only the experiment itself is fully powered up. During an actual run, however, the experimental ground may be compro- mised in ways beyond the control of the experimen- ters. The contaminating voltage ripple is a noise current which may di!er for di!erent detectors in the experiment and for di!erent elements of any given detector, and may be weakly time dependent over periods of hours. The digitization in an Ana- log-Digital Converter (ADC) of the total charge of electrical pulses from active detector elements is then made versus a baseline ground that itself car- ries current. This smears ADC data, possibly signif- icantly, and makes less signi"cant all quantities inferred from it. The custom circuit developed to 0168-9002/00/$ - see front matter ( 2000 Elsevier Science B.V. All rights reserved. PII: S 0 1 6 8 - 9 0 0 2 ( 9 9 ) 0 1 1 6 4 - X
Transcript of An electronic clock for correlated noise corrections
Nuclear Instruments and Methods in Physics Research A 443 (2000) 451}463
An electronic clock for correlated noise corrections
W.J. Llope*, N. Adams, K.K. Kainz
T.W. Bonner Nuclear Laboratory, Rice University, MS 315, 6100 S. Main Street, Houston, TX 77005-1892, USA
Received 26 August 1999; accepted 22 October 1999
Abstract
An inexpensive and portable approach is presented to measure the time of occurrence of an experimental event asmeasured by a speci"c electronic clock. The clock resets in active synchronization with the experimental AC-power cycle.This allows an e$cient and complete correction for correlated noise contributions to pulse area and time measurementsof detector channels equipped with PhotoMultiplier Tubes. The electronic board that was developed will be described.The performance for the treatment of correlated noise in experimental data taken at the BNL-AGS facility, and analysesof spectral decompositions of this noise, will also be described. ( 2000 Elsevier Science B.V. All rights reserved.
PACS: 84.30.Ng; 7.50.-e; 89.20.#a
Keywords: Noise; Correlated; Common mode; AC line; Ground loop; ADC pedestal; 60 Hz; Synchronized electronic clock
1. Introduction
Despite dedicated e!orts to insure otherwise,a voltage ripple with the same frequency as themain AC power line (60 Hz in the US) but acomplicated shape and amplitude may exist on theelectrical ground used in an experiment. The causeof the ripple is the existence somewhere in theexperiment of at least one electrical path betweenthe experimental ground and other grounds. These`dirtya grounds may be at di!erent mean voltagesrelative to the experimental ground and may becorrelated with the AC power with di!erent phases,line shapes and amplitudes. Generally, experimen-ters use oscilloscopes and voltmeters to locate
*Corresponding author.
unwanted electrical connection(s) in the experimentthat tie the experimental ground to dirty grounds.The most egregious paths can generally be locatedand removed in this manner, and the grounds mayhence appear very clean when only the experimentitself is fully powered up. During an actual run,however, the experimental ground may be compro-mised in ways beyond the control of the experimen-ters. The contaminating voltage ripple is a noisecurrent which may di!er for di!erent detectors inthe experiment and for di!erent elements of anygiven detector, and may be weakly time dependentover periods of hours. The digitization in an Ana-log-Digital Converter (ADC) of the total charge ofelectrical pulses from active detector elements isthen made versus a baseline ground that itself car-ries current. This smears ADC data, possibly signif-icantly, and makes less signi"cant all quantitiesinferred from it. The custom circuit developed to
0168-9002/00/$ - see front matter ( 2000 Elsevier Science B.V. All rights reserved.PII: S 0 1 6 8 - 9 0 0 2 ( 9 9 ) 0 1 1 6 4 - X
address this problem for Experiment 896 [1] at theBNL-AGS, and its performance for correlatednoise corrections, is described here.
Detector channels involving PhotoMultiplierTubes (PMTs) are particularly sensitive to suchground contaminations, as PMTs are nearly per-fect ampli"ers. Depending on certain factors suchas the widths of ADC gates that are used, even a fewmillivolts of correlated noise can signi"cantlyworsen the ADC resolution both on the pedestaland for hits. The Time of Flight (TOF) system inBNL-AGS Experiment 896 is composed of &190Bicron BC404 plastic scintillator slats of variousdimensions each read out by two PMTs(Hamamatsu R2076 or 1398 depending on the slat).The signals from the E896 TOF System havea width of &10 ns FWHM and peak at about!300 mV for single hits of relativistic chargeZ"1 particles. This implies that the integratedcharge in a typical PMT pulse for a Z"1 hit is inthe order of 45 pC into 50 ). For this system, theADC gate width used is 200 ns wide. If the ripple inthe ground at the time of a particle hit is 2 mV, theintegral within the same 200 ns wide gate is &8 pCinto 50 ), which is &10% of the charge measuredfor hits and time dependent. Depending on howADC information from a particular detector is usedin subsequent analyses, correlated noise may thushave far reaching implications. The resolution onthe charge DZD/e of particles striking (thin) E896TOF slats, inferred from the TOF ADC values, canbe worsened. Corrections to the TOF timing in-formation based on the ADC information, i.e.`slewinga corrections, [2] would be degraded,worsening the TOF timing performance. There areother detectors in E896 that include the PMTread-out of scintillation or Cherenkov light. Thesedetectors include the Multi-Functional NeutronSpectrometer (MUFFINS), the Beam Counters(BCs), the Exit Charge Detector (ECD), and theMuLTiplicity detector (MLT). Correlated noise de-grades DZD/e measurements and the quality of theslewing corrections for the MUFFINs and BCdata, and degrades inferences on the event central-ity based on the MLT and ECD data.
This paper is organized as follows. Section 2 de-scribes the apparent symptoms of a correlatednoise problem, using as an example those in experi-
mental data collected by the E896 Collaboration[1] during the Spring 1998 run of 11.5 GeV/c/N197Au beams at the BNL-AGS. As alluded toabove, the E896 experiment is composed of manydi!erent subsystems arranged in a mechanicallyand electrically complicated con"guration. Thereare two large spectroscopic magnets in E896, andmany more beam line magnets nearby. As will beshown, correlated noise is rampant in E896 duringfull beam-on running conditions, although the ex-perimental grounds are clean otherwise. The gen-eral solution chosen to combat this problem o%ineinvolves custom electronics which are described inSection 3. Sections 4 and 5 describe the resultsobtained when this information was inserted intothe E896 data stream during full beam-on runningconditions. The summary and conclusions are pre-sented in Section 6.
2. The symptom
In general, an ADC pedestal for the PMT-equip-ped detector channel has contributions from theintrinsic o!sets of the ADC itself, and the PMTsdark current. For the Hamamatsu R2076 and 1398PMTs and the LeCroy 1885F ADCs used in theE896 TOF System, these contributions typicallyresult in a pedestal variance in the order of 3}5ADC channels. A correlation between the pedestalsof di!erent detector channels is the unambiguoussignature of correlated noise, also known as `com-mon mode noise,a or `ground loops.a
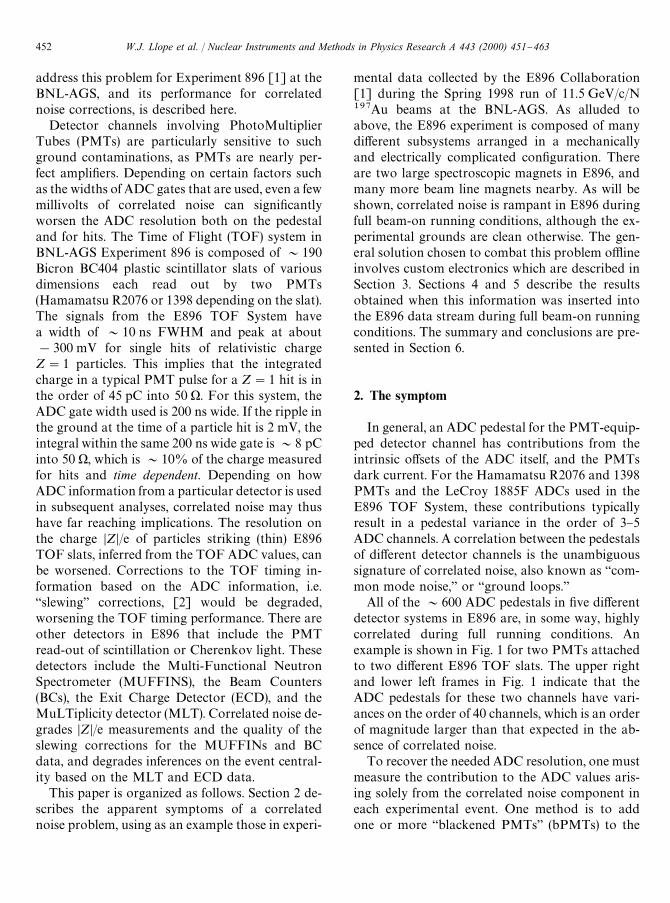
All of the &600 ADC pedestals in "ve di!erentdetector systems in E896 are, in some way, highlycorrelated during full running conditions. Anexample is shown in Fig. 1 for two PMTs attachedto two di!erent E896 TOF slats. The upper rightand lower left frames in Fig. 1 indicate that theADC pedestals for these two channels have vari-ances on the order of 40 channels, which is an orderof magnitude larger than that expected in the ab-sence of correlated noise.
To recover the needed ADC resolution, one mustmeasure the contribution to the ADC values aris-ing solely from the correlated noise component ineach experimental event. One method is to addone or more `blackened PMTsa (bPMTs) to the
452 W.J. Llope et al. / Nuclear Instruments and Methods in Physics Research A 443 (2000) 451}463
Fig. 1. Two typical ADC pedestal distributions for two channels in the E896-TOF System during the Au98 run (upper right and lowerleft), and their correlation in two dimensions (upper left). The axes out of the page are logarithmic.
detector, and digitizing these in ADCs exactlyas if these bPMTs were attached to active ele-ments. Such blackened PMTs are optically isolatedby de"nition, but as they are mechanically andelectrically part of the detector, the ADC valuesmeasured are, up to (time-independent) o!sets,exactly the correlated noise contribution event byevent.
If the correlation between the ADC pedestalfrom an active channel and that from a bPMTchannel is su$ciently strong and single valued (i.e.something like the left frame in Fig. 2, the ADC
values in active channels can be corrected withsome e$ciency for the correlated noise contribu-tion using the value of the bPMT in each experi-mental event. One makes two passes through theexperimental data. First one records the correlationbetween the ADC values for the active channelversus the ADC values from a bPMT, in only thoseevents when the active channel is known to be notstruck by a particle. Once this dependence versusone (or more) bPMTs is known for each activechannel, in the second pass through the datathe bPMT correction can be applied to the active
W.J. Llope et al. / Nuclear Instruments and Methods in Physics Research A 443 (2000) 451}463 453
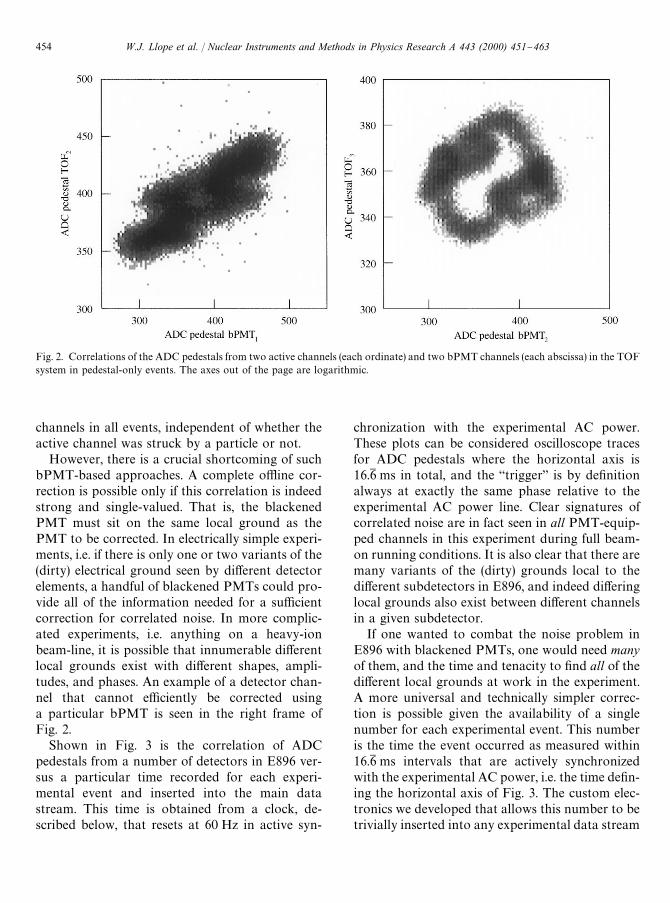
Fig. 2. Correlations of the ADC pedestals from two active channels (each ordinate) and two bPMT channels (each abscissa) in the TOFsystem in pedestal-only events. The axes out of the page are logarithmic.
channels in all events, independent of whether theactive channel was struck by a particle or not.
However, there is a crucial shortcoming of suchbPMT-based approaches. A complete o%ine cor-rection is possible only if this correlation is indeedstrong and single-valued. That is, the blackenedPMT must sit on the same local ground as thePMT to be corrected. In electrically simple experi-ments, i.e. if there is only one or two variants of the(dirty) electrical ground seen by di!erent detectorelements, a handful of blackened PMTs could pro-vide all of the information needed for a su$cientcorrection for correlated noise. In more complic-ated experiments, i.e. anything on a heavy-ionbeam-line, it is possible that innumerable di!erentlocal grounds exist with di!erent shapes, ampli-tudes, and phases. An example of a detector chan-nel that cannot e$ciently be corrected usinga particular bPMT is seen in the right frame ofFig. 2.
Shown in Fig. 3 is the correlation of ADCpedestals from a number of detectors in E896 ver-sus a particular time recorded for each experi-mental event and inserted into the main datastream. This time is obtained from a clock, de-scribed below, that resets at 60 Hz in active syn-
chronization with the experimental AC power.These plots can be considered oscilloscope tracesfor ADC pedestals where the horizontal axis is16.61 ms in total, and the `triggera is by de"nitionalways at exactly the same phase relative to theexperimental AC power line. Clear signatures ofcorrelated noise are in fact seen in all PMT-equip-ped channels in this experiment during full beam-on running conditions. It is also clear that there aremany variants of the (dirty) grounds local to thedi!erent subdetectors in E896, and indeed di!eringlocal grounds also exist between di!erent channelsin a given subdetector.
If one wanted to combat the noise problem inE896 with blackened PMTs, one would need manyof them, and the time and tenacity to "nd all of thedi!erent local grounds at work in the experiment.A more universal and technically simpler correc-tion is possible given the availability of a singlenumber for each experimental event. This numberis the time the event occurred as measured within16.61 ms intervals that are actively synchronizedwith the experimental AC power, i.e. the time de"n-ing the horizontal axis of Fig. 3. The custom elec-tronics we developed that allows this number to betrivially inserted into any experimental data stream
454 W.J. Llope et al. / Nuclear Instruments and Methods in Physics Research A 443 (2000) 451}463
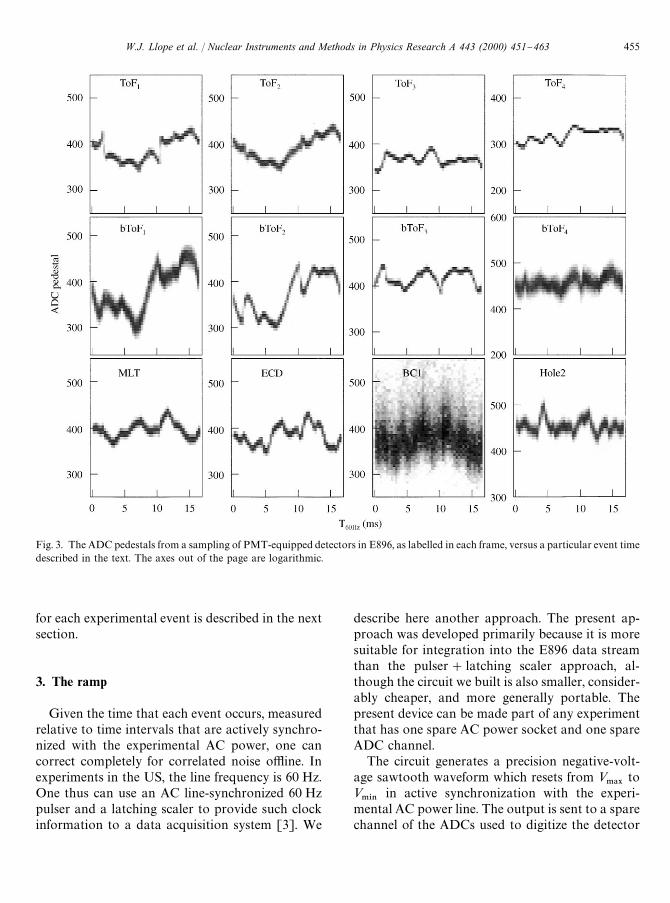
Fig. 3. The ADC pedestals from a sampling of PMT-equipped detectors in E896, as labelled in each frame, versus a particular event timedescribed in the text. The axes out of the page are logarithmic.
for each experimental event is described in the nextsection.
3. The ramp
Given the time that each event occurs, measuredrelative to time intervals that are actively synchro-nized with the experimental AC power, one cancorrect completely for correlated noise o%ine. Inexperiments in the US, the line frequency is 60 Hz.One thus can use an AC line-synchronized 60 Hzpulser and a latching scaler to provide such clockinformation to a data acquisition system [3]. We
describe here another approach. The present ap-proach was developed primarily because it is moresuitable for integration into the E896 data streamthan the pulser#latching scaler approach, al-though the circuit we built is also smaller, consider-ably cheaper, and more generally portable. Thepresent device can be made part of any experimentthat has one spare AC power socket and one spareADC channel.
The circuit generates a precision negative-volt-age sawtooth waveform which resets from <
.!9to
<.*/
in active synchronization with the experi-mental AC power line. The output is sent to a sparechannel of the ADCs used to digitize the detector
W.J. Llope et al. / Nuclear Instruments and Methods in Physics Research A 443 (2000) 451}463 455
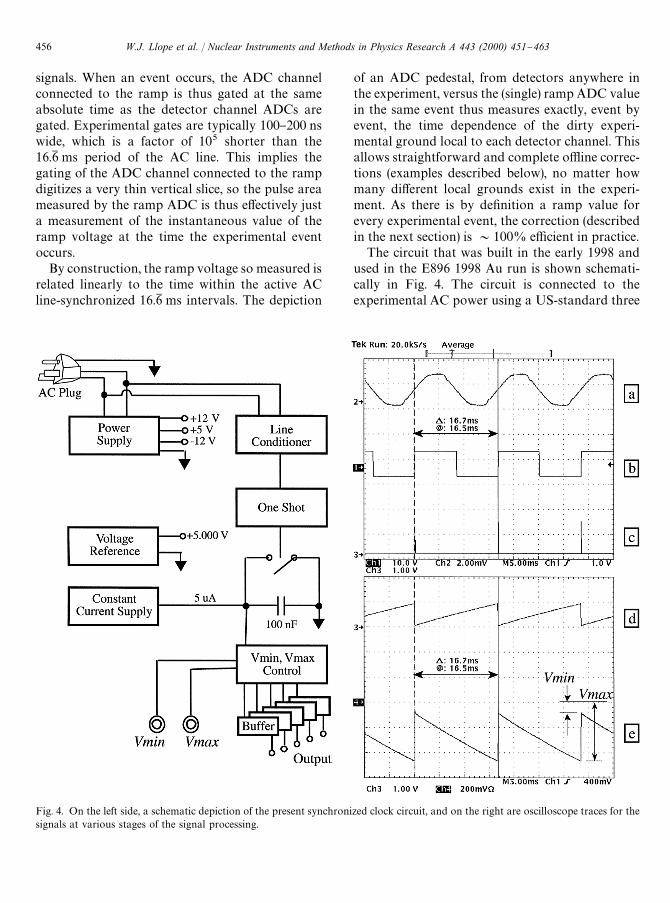
Fig. 4. On the left side, a schematic depiction of the present synchronized clock circuit, and on the right are oscilloscope traces for thesignals at various stages of the signal processing.
signals. When an event occurs, the ADC channelconnected to the ramp is thus gated at the sameabsolute time as the detector channel ADCs aregated. Experimental gates are typically 100}200 nswide, which is a factor of 105 shorter than the16.61 ms period of the AC line. This implies thegating of the ADC channel connected to the rampdigitizes a very thin vertical slice, so the pulse areameasured by the ramp ADC is thus e!ectively justa measurement of the instantaneous value of theramp voltage at the time the experimental eventoccurs.
By construction, the ramp voltage so measured isrelated linearly to the time within the active ACline-synchronized 16.61 ms intervals. The depiction
of an ADC pedestal, from detectors anywhere inthe experiment, versus the (single) ramp ADC valuein the same event thus measures exactly, event byevent, the time dependence of the dirty experi-mental ground local to each detector channel. Thisallows straightforward and complete o%ine correc-tions (examples described below), no matter howmany di!erent local grounds exist in the experi-ment. As there is by de"nition a ramp value forevery experimental event, the correction (describedin the next section) is &100% e$cient in practice.
The circuit that was built in the early 1998 andused in the E896 1998 Au run is shown schemati-cally in Fig. 4. The circuit is connected to theexperimental AC power using a US-standard three
456 W.J. Llope et al. / Nuclear Instruments and Methods in Physics Research A 443 (2000) 451}463
prong plug. The AC voltage is shown, attenuatedby 100 dB, as trace (a) in this "gure. The neutraland phase lines from the AC plug are sent toa power supply, which provides the low voltagesused by the circuit, and to a line conditioner. Theline conditioner searches for the time at which theexperimental AC power crosses zero volts frombelow, and generates a bipolar square wave inphase with this time, and hence with the AC powercycle, as seen in trace (b). The bipolar square waveis sent to a `one-shot,awhich controls a switch. Theleading edges of the one-shot output, shown intrace (c), open the switch and falling edges close theswitch.
A voltage reference and a constant current sup-ply continuously add charge to a 100 nF capacitor(trace d), and by a related amount to the rest of thecircuit. This produces the precision voltage ramp,shown in trace (e). When the next 60 Hz cyclebegins, i.e. on a leading edge of trace (b), the oneshot closes the switch and discharges the capacitor.When the circuit senses the capacitor is fully dis-charged, which approximately 3 ls later, the one-shot reopens the switch and the output (trace e)returns to <
.*/. Current then begins #owing into
the capacitor again, charging it and producing anoutput voltage that again becomes more negativein precise linearity with the time within the presentAC cycle.
The synchronization is active, occurring inde-pendently for each cycle of the AC power. Thus,in principle there is nothing in the presentcircuit that makes it speci"c to 60 Hz line fre-quencies. The device should work without modi"-cation for others, such as are used in experimentsabroad.
The discharging of the capacitor implies a `deadtimea of the circuit of &3 ls/16.61 ms, or about0.02%. The current out of the constant currentsupply is generated against a 5.000 V voltage refer-ence, which holds the voltage on the capacitorprecise to one part in a few thousand. This impliesthat the circuit provides the time within the ACline-synchronized 16.61 ms periods with a resolutionof a few microseconds. Such a time resolution issu$cient to correct for typical correlated noiselevels } typically one needs su$cient statistical cer-tainty in only 50}100 bins of the 60 Hz time in
order to perform a complete correction (as shownbelow).
The value of <.*/
and <.!9
are adjustable viaexternally mounted potentiometers. This allows thedevice to be trivially implemented in other experi-ments, which may use ADC gates of di!erentwidths or ADC modules with di!erent full scaleranges or charge conversion factors. The presentcircuit uses bu!ers to produce "ve copies of theramp signal, each of which was sent to a sparechannel in "ve di!erent TOF ADC modules in theE896 TOF system. In the end only one outputchannel was actually needed, as the circuit provedto be very stable and its data easy to understand.
The circuit is packaged in a small metal box withexternal signal connectors and the pots for the<
.*/and <
.!9control, which is shown in Fig. 5.
The cost was on the whole about $100.
4. The performance
The event-inclusive distribution of ADC valuesfor the ADC channel connected to the presentramp circuit should, except for spill-structure orother known event trigger time correlations, beessentially #at. Such a distribution for one data-taking run from the E896 Au98 run is shown inFig. 6. The raw ramp ADC distribution is shown inthe solid histogram. The dashed histogram depictsthe same ramp ADC distribution following thesubtraction of the two intrinsic pedestals in the(dual range) LRS 1885F ADCs. This subtractionwas done following a measurement of these twointrinsic pedestals for each ADC channel usingcalibration logic internal to the ADC and a Tcl/Tkscript [4].
Based on the dashed histogram in Fig. 6, thetimes t
0at which new 60 Hz cycles begin (and
the ramp resets to the voltage <.*/
) are identi"edas those events with a pedestal-subtracted rampADC value of 0. The time 16.61 ms later is identi"edas an pedestal-subtracted ramp ADC value of&15 000. Thus the event time, ¹
60 H;, in mil-
liseconds relative to the AC cycle is then computedfrom the intrinsic pedestal-subtracted ramp ADCvalues in each event, ADC
3!.1, simply from
¹60 H;
"(16.67 ms)HADC3!.1
/15 000. This is how the
W.J. Llope et al. / Nuclear Instruments and Methods in Physics Research A 443 (2000) 451}463 457
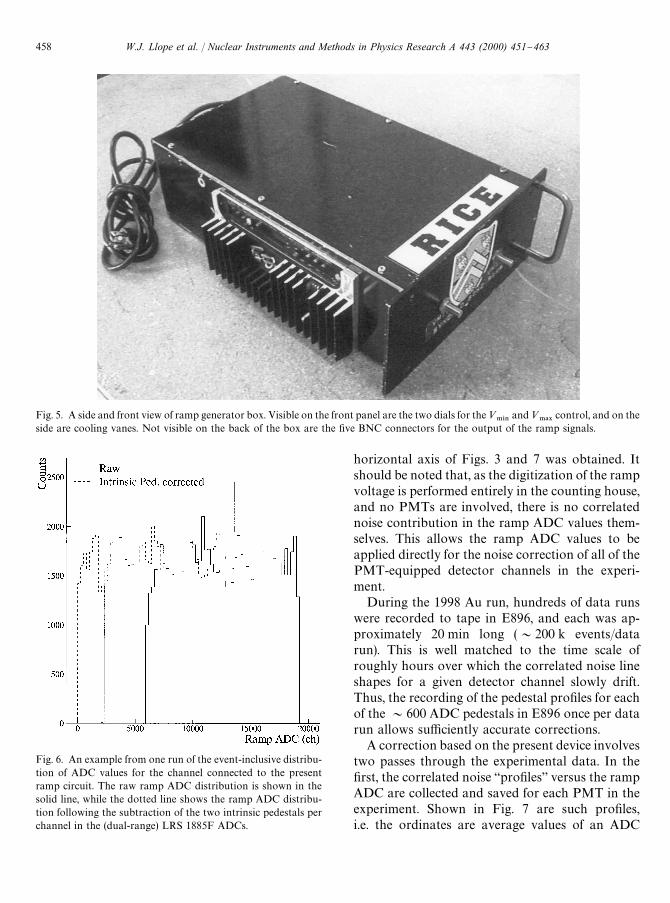
Fig. 5. A side and front view of ramp generator box. Visible on the front panel are the two dials for the<.*/
and<.!9
control, and on theside are cooling vanes. Not visible on the back of the box are the "ve BNC connectors for the output of the ramp signals.
Fig. 6. An example from one run of the event-inclusive distribu-tion of ADC values for the channel connected to the presentramp circuit. The raw ramp ADC distribution is shown in thesolid line, while the dotted line shows the ramp ADC distribu-tion following the subtraction of the two intrinsic pedestals perchannel in the (dual-range) LRS 1885F ADCs.
horizontal axis of Figs. 3 and 7 was obtained. Itshould be noted that, as the digitization of the rampvoltage is performed entirely in the counting house,and no PMTs are involved, there is no correlatednoise contribution in the ramp ADC values them-selves. This allows the ramp ADC values to beapplied directly for the noise correction of all of thePMT-equipped detector channels in the experi-ment.
During the 1998 Au run, hundreds of data runswere recorded to tape in E896, and each was ap-proximately 20 min long (&200 k events/datarun). This is well matched to the time scale ofroughly hours over which the correlated noise lineshapes for a given detector channel slowly drift.Thus, the recording of the pedestal pro"les for eachof the &600 ADC pedestals in E896 once per datarun allows su$ciently accurate corrections.
A correction based on the present device involvestwo passes through the experimental data. In the"rst, the correlated noise `pro"lesa versus the rampADC are collected and saved for each PMT in theexperiment. Shown in Fig. 7 are such pro"les,i.e. the ordinates are average values of an ADC
458 W.J. Llope et al. / Nuclear Instruments and Methods in Physics Research A 443 (2000) 451}463
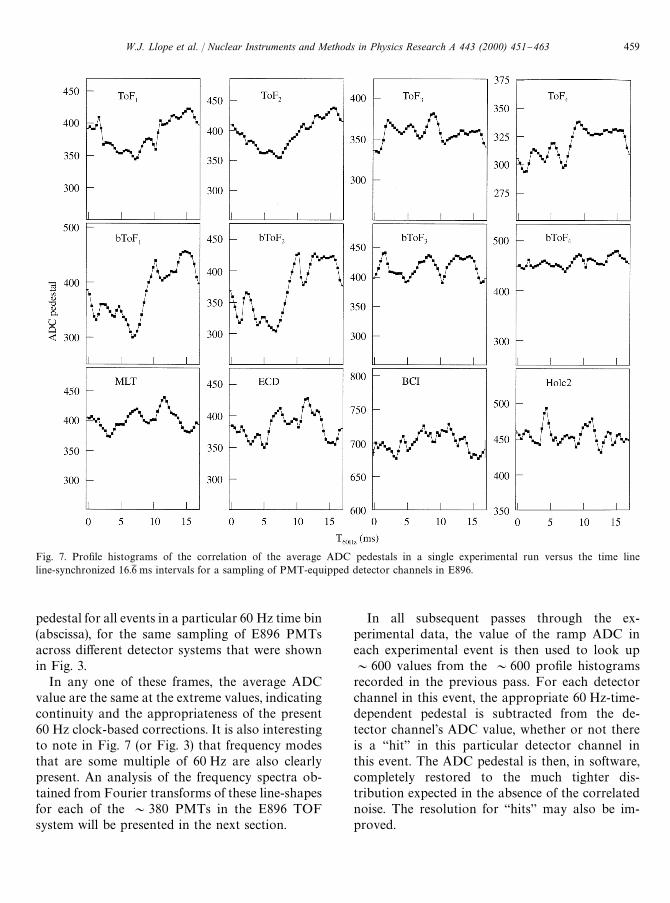
Fig. 7. Pro"le histograms of the correlation of the average ADC pedestals in a single experimental run versus the time lineline-synchronized 16.61 ms intervals for a sampling of PMT-equipped detector channels in E896.
pedestal for all events in a particular 60 Hz time bin(abscissa), for the same sampling of E896 PMTsacross di!erent detector systems that were shownin Fig. 3.
In any one of these frames, the average ADCvalue are the same at the extreme values, indicatingcontinuity and the appropriateness of the present60 Hz clock-based corrections. It is also interestingto note in Fig. 7 (or Fig. 3) that frequency modesthat are some multiple of 60 Hz are also clearlypresent. An analysis of the frequency spectra ob-tained from Fourier transforms of these line-shapesfor each of the &380 PMTs in the E896 TOFsystem will be presented in the next section.
In all subsequent passes through the ex-perimental data, the value of the ramp ADC ineach experimental event is then used to look up&600 values from the &600 pro"le histogramsrecorded in the previous pass. For each detectorchannel in this event, the appropriate 60 Hz-time-dependent pedestal is subtracted from the de-tector channel's ADC value, whether or not thereis a `hita in this particular detector channel inthis event. The ADC pedestal is then, in software,completely restored to the much tighter dis-tribution expected in the absence of the correlatednoise. The resolution for `hitsa may also be im-proved.
W.J. Llope et al. / Nuclear Instruments and Methods in Physics Research A 443 (2000) 451}463 459
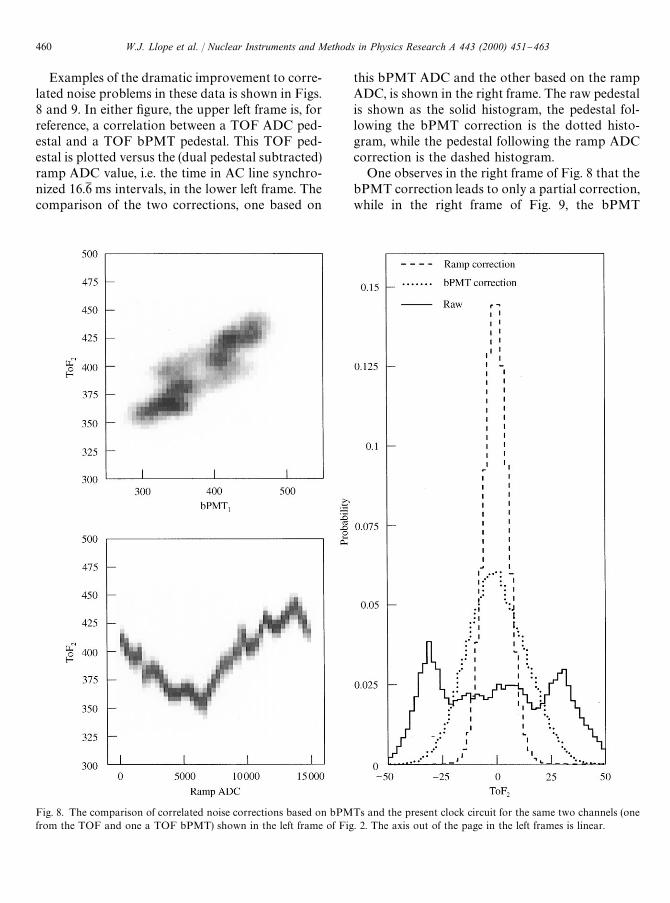
Fig. 8. The comparison of correlated noise corrections based on bPMTs and the present clock circuit for the same two channels (onefrom the TOF and one a TOF bPMT) shown in the left frame of Fig. 2. The axis out of the page in the left frames is linear.
Examples of the dramatic improvement to corre-lated noise problems in these data is shown in Figs.8 and 9. In either "gure, the upper left frame is, forreference, a correlation between a TOF ADC ped-estal and a TOF bPMT pedestal. This TOF ped-estal is plotted versus the (dual pedestal subtracted)ramp ADC value, i.e. the time in AC line synchro-nized 16.61 ms intervals, in the lower left frame. Thecomparison of the two corrections, one based on
this bPMT ADC and the other based on the rampADC, is shown in the right frame. The raw pedestalis shown as the solid histogram, the pedestal fol-lowing the bPMT correction is the dotted histo-gram, while the pedestal following the ramp ADCcorrection is the dashed histogram.
One observes in the right frame of Fig. 8 that thebPMT correction leads to only a partial correction,while in the right frame of Fig. 9, the bPMT
460 W.J. Llope et al. / Nuclear Instruments and Methods in Physics Research A 443 (2000) 451}463
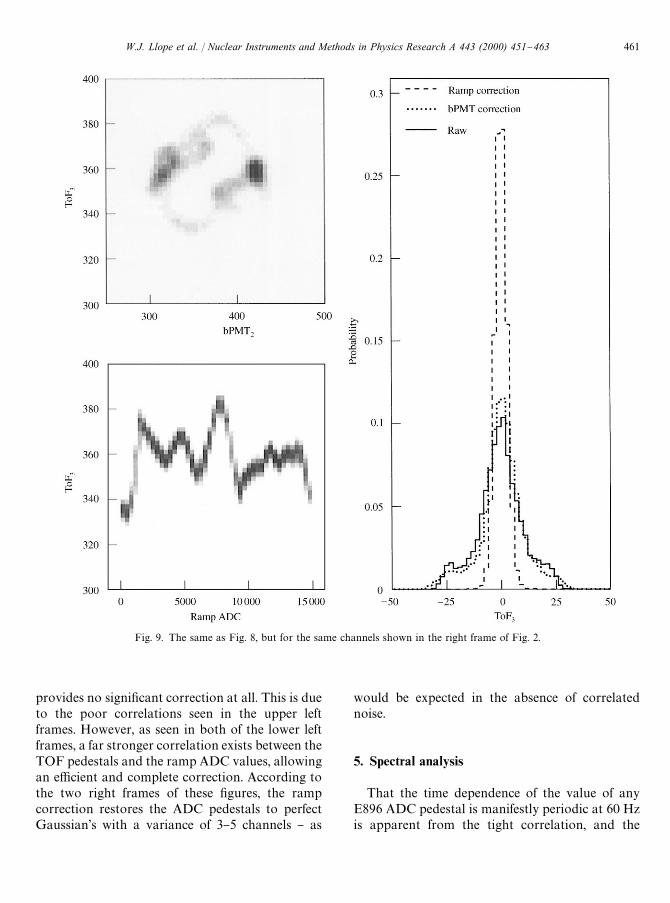
Fig. 9. The same as Fig. 8, but for the same channels shown in the right frame of Fig. 2.
provides no signi"cant correction at all. This is dueto the poor correlations seen in the upper leftframes. However, as seen in both of the lower leftframes, a far stronger correlation exists between theTOF pedestals and the ramp ADC values, allowingan e$cient and complete correction. According tothe two right frames of these "gures, the rampcorrection restores the ADC pedestals to perfectGaussian's with a variance of 3}5 channels } as
would be expected in the absence of correlatednoise.
5. Spectral analysis
That the time dependence of the value of anyE896 ADC pedestal is manifestly periodic at 60 Hzis apparent from the tight correlation, and the
W.J. Llope et al. / Nuclear Instruments and Methods in Physics Research A 443 (2000) 451}463 461
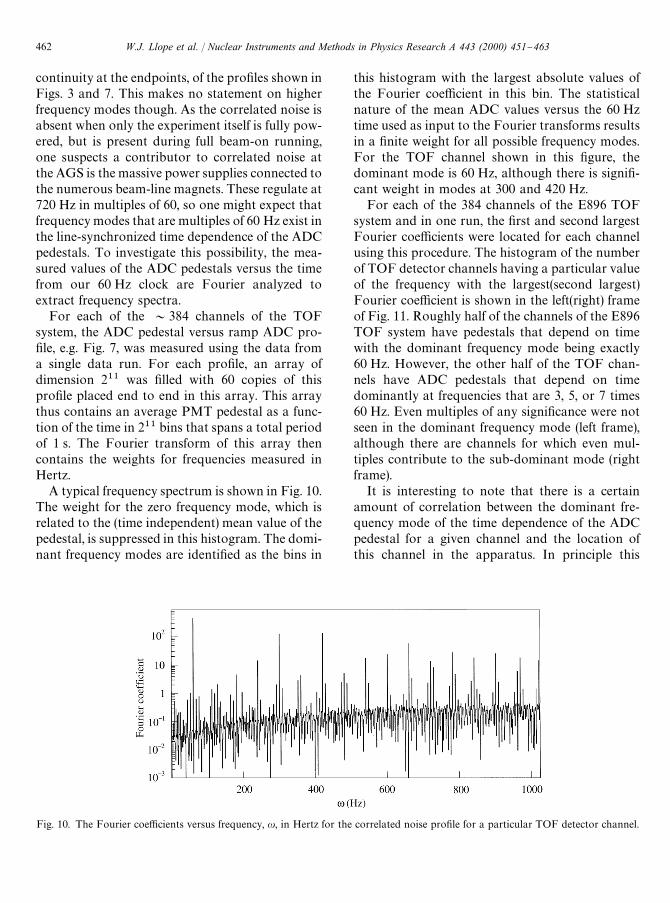
Fig. 10. The Fourier coe$cients versus frequency, u, in Hertz for the correlated noise pro"le for a particular TOF detector channel.
continuity at the endpoints, of the pro"les shown inFigs. 3 and 7. This makes no statement on higherfrequency modes though. As the correlated noise isabsent when only the experiment itself is fully pow-ered, but is present during full beam-on running,one suspects a contributor to correlated noise atthe AGS is the massive power supplies connected tothe numerous beam-line magnets. These regulate at720 Hz in multiples of 60, so one might expect thatfrequency modes that are multiples of 60 Hz exist inthe line-synchronized time dependence of the ADCpedestals. To investigate this possibility, the mea-sured values of the ADC pedestals versus the timefrom our 60 Hz clock are Fourier analyzed toextract frequency spectra.
For each of the &384 channels of the TOFsystem, the ADC pedestal versus ramp ADC pro-"le, e.g. Fig. 7, was measured using the data froma single data run. For each pro"le, an array ofdimension 211 was "lled with 60 copies of thispro"le placed end to end in this array. This arraythus contains an average PMT pedestal as a func-tion of the time in 211 bins that spans a total periodof 1 s. The Fourier transform of this array thencontains the weights for frequencies measured inHertz.
A typical frequency spectrum is shown in Fig. 10.The weight for the zero frequency mode, which isrelated to the (time independent) mean value of thepedestal, is suppressed in this histogram. The domi-nant frequency modes are identi"ed as the bins in
this histogram with the largest absolute values ofthe Fourier coe$cient in this bin. The statisticalnature of the mean ADC values versus the 60 Hztime used as input to the Fourier transforms resultsin a "nite weight for all possible frequency modes.For the TOF channel shown in this "gure, thedominant mode is 60 Hz, although there is signi"-cant weight in modes at 300 and 420 Hz.
For each of the 384 channels of the E896 TOFsystem and in one run, the "rst and second largestFourier coe$cients were located for each channelusing this procedure. The histogram of the numberof TOF detector channels having a particular valueof the frequency with the largest(second largest)Fourier coe$cient is shown in the left(right) frameof Fig. 11. Roughly half of the channels of the E896TOF system have pedestals that depend on timewith the dominant frequency mode being exactly60 Hz. However, the other half of the TOF chan-nels have ADC pedestals that depend on timedominantly at frequencies that are 3, 5, or 7 times60 Hz. Even multiples of any signi"cance were notseen in the dominant frequency mode (left frame),although there are channels for which even mul-tiples contribute to the sub-dominant mode (rightframe).
It is interesting to note that there is a certainamount of correlation between the dominant fre-quency mode of the time dependence of the ADCpedestal for a given channel and the location ofthis channel in the apparatus. In principle this
462 W.J. Llope et al. / Nuclear Instruments and Methods in Physics Research A 443 (2000) 451}463
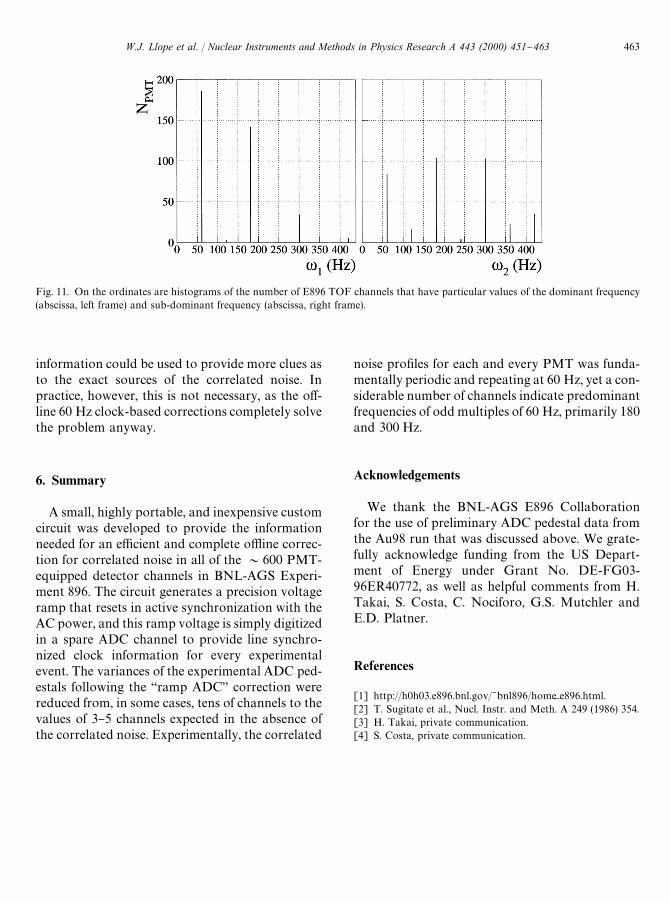
Fig. 11. On the ordinates are histograms of the number of E896 TOF channels that have particular values of the dominant frequency(abscissa, left frame) and sub-dominant frequency (abscissa, right frame).
information could be used to provide more clues asto the exact sources of the correlated noise. Inpractice, however, this is not necessary, as the o!-line 60 Hz clock-based corrections completely solvethe problem anyway.
6. Summary
A small, highly portable, and inexpensive customcircuit was developed to provide the informationneeded for an e$cient and complete o%ine correc-tion for correlated noise in all of the &600 PMT-equipped detector channels in BNL-AGS Experi-ment 896. The circuit generates a precision voltageramp that resets in active synchronization with theAC power, and this ramp voltage is simply digitizedin a spare ADC channel to provide line synchro-nized clock information for every experimentalevent. The variances of the experimental ADC ped-estals following the `ramp ADCa correction werereduced from, in some cases, tens of channels to thevalues of 3}5 channels expected in the absence ofthe correlated noise. Experimentally, the correlated
noise pro"les for each and every PMT was funda-mentally periodic and repeating at 60 Hz, yet a con-siderable number of channels indicate predominantfrequencies of odd multiples of 60 Hz, primarily 180and 300 Hz.
Acknowledgements
We thank the BNL-AGS E896 Collaborationfor the use of preliminary ADC pedestal data fromthe Au98 run that was discussed above. We grate-fully acknowledge funding from the US Depart-ment of Energy under Grant No. DE-FG03-96ER40772, as well as helpful comments from H.Takai, S. Costa, C. Nociforo, G.S. Mutchler andE.D. Platner.
References
[1] http://h0h03.e896.bnl.gov/˜bnl896/home}e896.html.[2] T. Sugitate et al., Nucl. Instr. and Meth. A 249 (1986) 354.[3] H. Takai, private communication.[4] S. Costa, private communication.
W.J. Llope et al. / Nuclear Instruments and Methods in Physics Research A 443 (2000) 451}463 463


![arXiv:1310.6045v1 [quant-ph] 22 Oct 2013gain a signi cant improvement of clock performance by preparing atoms in quantum correlated states (e.g., spin squeezed states [3]). Here we](https://static.fdocuments.us/doc/165x107/5f1d87fa83f7476ca33e00df/arxiv13106045v1-quant-ph-22-oct-2013-gain-a-signi-cant-improvement-of-clock.jpg)