An efficient data filtering strategy for easy metabolite ...
26
HAL Id: hal-01594553 https://hal.archives-ouvertes.fr/hal-01594553 Submitted on 26 Sep 2017 HAL is a multi-disciplinary open access archive for the deposit and dissemination of sci- entific research documents, whether they are pub- lished or not. The documents may come from teaching and research institutions in France or abroad, or from public or private research centers. L’archive ouverte pluridisciplinaire HAL, est destinée au dépôt et à la diffusion de documents scientifiques de niveau recherche, publiés ou non, émanant des établissements d’enseignement et de recherche français ou étrangers, des laboratoires publics ou privés. An effcient data filtering strategy for easy metabolite detection from the direct analysis of a biological fluid using Fourier transform mass spectrometry Estelle Rathahao, Sandra Alves, Laurent Debrauwer, Jean Pierre Cravedi, Alain Paris To cite this version: Estelle Rathahao, Sandra Alves, Laurent Debrauwer, Jean Pierre Cravedi, Alain Paris. An effcient data filtering strategy for easy metabolite detection from the direct analysis of a biological fluid using Fourier transform mass spectrometry. Rapid Communications in Mass Spectrometry, Wiley, 2017, 31 (6), pp.485-494. 10.1002/rcm.7812. hal-01594553
Transcript of An efficient data filtering strategy for easy metabolite ...
HAL Id: hal-01594553https://hal.archives-ouvertes.fr/hal-01594553
Submitted on 26 Sep 2017
HAL is a multi-disciplinary open accessarchive for the deposit and dissemination of sci-entific research documents, whether they are pub-lished or not. The documents may come fromteaching and research institutions in France orabroad, or from public or private research centers.
L’archive ouverte pluridisciplinaire HAL, estdestinée au dépôt et à la diffusion de documentsscientifiques de niveau recherche, publiés ou non,émanant des établissements d’enseignement et derecherche français ou étrangers, des laboratoirespublics ou privés.
An efficient data filtering strategy for easy metabolitedetection from the direct analysis of a biological fluid
using Fourier transform mass spectrometryEstelle Rathahao, Sandra Alves, Laurent Debrauwer, Jean Pierre Cravedi,
Alain Paris
To cite this version:Estelle Rathahao, Sandra Alves, Laurent Debrauwer, Jean Pierre Cravedi, Alain Paris. An efficientdata filtering strategy for easy metabolite detection from the direct analysis of a biological fluid usingFourier transform mass spectrometry. Rapid Communications in Mass Spectrometry, Wiley, 2017, 31(6), pp.485-494. �10.1002/rcm.7812�. �hal-01594553�
1
An efficient data filtering strategy for easy metabolite detection from the direct analysis
of a biological fluid using Fourier transform mass spectrometry
Estelle Rathahao-Paris1,*, Sandra Alves2, Laurent Debrauwer3,4, Jean-Pierre Cravedi3
and Alain Paris5
1 UMR Ingénierie Procédés Aliments, AgroParisTech, Inra, Université Paris-Saclay, 91300
Massy, France;
2 Sorbonne Universités, Université Pierre et Marie Curie, Institut Parisien de Chimie
Moléculaire, UMR8232, 4 Place Jussieu, 75252 Paris, France;
3 Toxalim, Université de Toulouse, INRA, INP-ENVT, INP-EI-Purpan, Univ. Toulouse 3
Paul Sabatier, 31027 Toulouse, France;
4 Axiom Platform, MetaToul-MetaboHUB, National Infrastructure for Metabolomics and
Fluxomics, 31027 Toulouse, France;
5 Sorbonne Universités, Muséum national d’Histoire naturelle, CNRS, UMR7245 MCAM,
75005 Paris, France.
* Correspondance to: E. Rathahao-Paris,
Laboratoire de Chimie Analytique, AgroParisTech, Inra, UMR1145 GENIAL, 16, rue Claude
Bernard, 75231 Paris Cedex 05, France.
E-mail: [email protected]
Short title of up to 70 characters: Data filtering strategy for metabolite detection from
DI-HRMS data

2
Abstract
RATIONALE
High throughput analyses require an overall analytical workflow including robust and high
speed technical platform but also dedicated data processing tools able to extract the relevant
information. This work aimed at evaluating post-acquisition data mining tools for selective
extraction of metabolite species from direct introduction high resolution mass spectrometry
data.
METHODS
Investigations were performed on spectral data in which seven metabolites of vinclozolin, a
dicarboximide fungicide containing two chloride atoms, were previously manually identified.
The spectral data obtained from direct introduction (DI) and high resolution mass
spectrometry (HRMS) detection were post-processed by plotting the mass defect profiles and
applying various data filtering methods based on accurate mass values.
RESULTS
Exploration of mass defect profiles highlighted, in a specific plotting region the presence of
compounds containing common chemical elements and pairs of conjugated and non-
conjugated metabolites resulting from classical metabolic pathways.
Additionally, the judicious application of mass defect and/or isotope pattern filters removed
many interfering ions from DI-HRMS data, greatly facilitating the detection of vinclozolin
metabolites. Compared to previous results obtained by manual data treatment, three additional
metabolites of vinclozolin were detected and putatively annotated.
CONCLUSIONS
Tracking simultaneously several specific species could be efficiently performed using data
mining tools based on accurate mass values. The selectivity of the data extraction was
improved when the isotope filter was used for halogenated compounds, facilitating metabolite
ion detection even for low abundance species.
Keywords: mass defect, data mining, direct introduction mass spectrometry, Fourier
transform mass spectrometry, metabolite identification
3
Introduction
Nowadays, human exposure to external factors, i.e. environment and diet or lifestyle, is one of
the major issues in public health. The study of the xenometabolome is useful for evidencing
such exposure and particularly to assess the simultaneous exposure to mixtures of several
contaminants (e.g., pesticides, drugs or persistent organic pollutants). A rapid approach
including efficiency, selectivity and sensitivity is required to perform characterization of the
xenometabolome, especially for large scale analysis in cohort studies. Targeted acquisition
methods for detection and quantitative analysis of residues have been reported, which allow
the simultaneous screening of several families of compounds.1
Mass spectrometry with on-line liquid chromatography, gas chromatography or capillary
electrophoresis (i.e. LC/MS, GC/MS or CE/MS) has been the most often used approach in
metabolite studies, but the use of on-line separation techniques greatly limits the throughput
of analyses. Direct introduction mass spectrometry (DIMS) enabling mass spectrum
acquisition in a few minutes is a valuable high throughput approach.3 Such direct analyses
require appropriated ionization techniques for performing rapid mass spectral acquisition.4
Most of them are atmospheric pressure sources. Typically, the ambient ionization techniques
such as direct analysis in real-time (DART), desorption electrospray (DESI) and extractive
electrospray ionization (EESI) can be applied for direct analysis of complex mixtures with
limited or no sample preparation. Their applications in many different fields (e.g., forensics,
environmental and drug studies) have been reported. 5 Nevertheless, the electrospray
ionization (ESI) coupled to chromatography system is the method commonly used in
metabolite studies but is increasingly used in the DIMS approach.6-10ESI is sensitive to
matrix effects since all compounds present in the matrix, including endogenous components
as well as xenobiotics and their metabolites, undergo simultaneously the ionization process.
Hence, ionization competition between different compounds occurs, leading to ion
suppression phenomenon. In addition to the sample dilution, which reduces the matrix effects,
the use of Fourier transform mass spectrometry (FTMS) instruments, providing high
performances as mass resolving power and dynamic range, can reduce the drawbacks of
,2 However, such approaches
have some limitations such as the cost of trace analyses and the limitation of the search for
new markers, which may reflect exposure to new contaminants or to a combined exposure to
several xenobiotics. Therefore, global approaches combining metabolite fingerprinting with
appropriate data processing tools seem to be the most suitable for the rapid screening of
expected as well as unknown markers of exposure to toxicants.

4
DIMS approach. The distinction of isobaric ions (i.e. same nominal mass but different
elemental compositions) and the simultaneous detection of a large number of species in the
same mass spectrum become possible with this instrumentation. However, the inability of
DIMS to distinguish isomers hampers metabolite identification even using the most powerful
instrument. The resulting mass spectral data remain complex and difficult to be interpreted
because of the large number of ions detected simultaneously in a single experiment,
potentially with close m/z values.
As well, to analyze such complex mass spectrum, data processing procedures based on mass
defect can be efficiently used to facilitate detection and selection of chemically-relevant
ions.11 The term ‘mass defect’, first introduced by E. Kendrick, refers to the difference
between the accurately measured m/z value and its nominal value.12 The Kendrick method has
been used to process high resolution mass spectrometry (HRMS) data. It is considered as a
data classification method, facilitating the distinction of homologous compounds having
different numbers of same base units. Kendrick plots have been successfully applied in the
field of petroleomics,13,14 and few examples have also been reported for organic matter15 and
metabolomic analyses. 16 Werner et al. reported the Kendrick plot of 7 000 compounds
extracted from the KEGG (Kyoto Encyclopedia of Genes and Genomes) database, resulting
in the classification of compounds in homologous series as illustrated for the carboxylic fatty
acids series.16 Alternatively, this method helps in the calculation of the elemental
compositions of high m/z ions based on the known elemental compositions of lower m/z ions
from the same series of compounds. Yet, due to the large chemical diversity of small
molecules constituting the metabolome, the Kendrick approach seems less appropriate for
detection of metabolites in metabolomics than for detection of apolar compounds in
petroleomics.
Afterwards, Zhang et al.17 used the mass defect based approach to process complex HRMS
data in drug metabolism studies. This approach called “mass defect filter” (MDF) is a data
filtering method using a defined mass defect window centered at the mass defect value of the
precursor compound ions.17-20 This allows to discard most of interfering ions. Such a data
mining tool facilitates detection and subsequent annotation of specific exogenous compounds
as well as their metabolites present in complex biological matrices.21 It has been successfully
applied for the selective detection of drug metabolites in various biological materials.17-22 It
has also been employed in the screening of contaminants in waste water,23,24 in the field of
lipidomics 25 and in natural product studies. 26 A recent study from Geng et al. 27 has

5
demonstrated the usefulness of MDF for the specific detection of traditional Chinese
medicine components and their corresponding in vivo metabolites from biological materials.
MDF is a real data filtering approach compared to the classical post-processing methods,
which generate extracted or reconstructed chromatograms of predicted ions (EIC) as a
visualization approach for detection of only expected ions.20 Hence, it represents an efficient
data mining tool for simplifying large mass spectral datasets. Above all, MDF enables to
detect both expected and unexpected metabolite species.
Until now, mass defect filtering has mainly been applied for post-processing complex data
generated from liquid or gas chromatography coupled to high resolution mass spectrometry.
Very few applications of MDF to mass spectral data acquired by DIMS technique have been
reported. Erve et al. tested the performances of DI-HRMS acquisition and data post-
processing techniques for evaluating ZipTip cleaning procedures applied to biological
matrices.8,9 In our previous work, the detection and characterization of seven metabolites of
vinclozolin [3-(3,5-dichlorophenyl)-5-methyl-vinyl-1, 3-oxazolidine-2,4-dione], a
dicarboximide fungicide, were manually performed on mass spectral data obtained by direct
analysis (DI-HRMS) of urine of rats treated with this compound.10 Additionally, an isotope
filtering procedure was tested, facilitating the detection of the seven vinclozolin metabolites
ions.
In this work, investigations were done on a data filtering strategy developed for DI-HRMS
data. First, the exploration of the mass defect profile was done to understand the distribution
of different species based on their mass defect values. The search for organic compounds
bearing common chemical elements and for metabolites generated from classical metabolic
pathways was performed. Then, different data filtering templates (i.e. mass defect and isotope
filters) were applied to evaluate their efficiency in selecting urinary metabolites of vinclozolin
from raw DI-HRMS data. Three new low abundance metabolites were then detected by this
strategy. Subsequent LC/MS and MS/MS (tandem mass spectrometry) experiments were
performed to consolidate the putative metabolite annotation.
Materials and Methods
Animal experimentation
Urine of rats treated with vinclozolin was obtained as already described.28 Three male rats
were individually housed in metabolic cages. They were fed by gavage with [14C]-vinclozolin

6
and unlabeled vinclozolin dissolved in dimethyl sulfoxide to obtain a final activity of
0.481 MBq [14C]-vinclozolin/kg and a 1 mg/mL final concentration of vinclozolin. Urine was
collected for 24 h and stored at -20 °C until analysis.
Analytical method
Mass spectrometric analyses were performed in negative ESI mode, using a hybrid ion trap
LTQ Orbitrap Fourier transform mass spectrometer (LTQ Orbitrap XL Thermo Fisher
Scientific, Bremen, Germany).
DIMS data were obtained from direct analysis of rat urine sample using high resolution mass
spectrometry with a mass resolving power (full width at the half maximum height, FWHM)
set at 60 000 for m/z 400. Both flow injection analysis (FIA) and LC/MS approach were
performed as described in previous work.10
MS/MS experiments were performed on both the monoisotopic and (M+2) isotope peaks of
vinclozolin metabolites using CID (collision-induced dissociation) conditions in the linear ion
trap (LTQ) device. The following parameters were used: isolation width of precursor ions of
2 u, activation time of 30 ms, and normalized collision energy of about 20 % (arbitrary units).
All CID experiments were carried out under high resolution detection with a mass resolving
power of 7 500 (FWHM) for m/z 400.
Data processing
The proprietary .raw data file format was first converted into .cdf format using the file
converter tool of Xcalibur 2.0.7 software (Thermo Fisher Scientific, Courtaboeuf, France).
The mass spectral data was further processed using a script written in R 3.1.2,29 a statistical
programming language (the script is freely available upon request). It was used to generate
the mass defect profiles by plotting the mass defect value of each peak versus the measured
m/z value. Different data filter templates were also created.
First, compounds containing specific chemical elements were searched based on the detection
of 12C/13C, 14N/15N, 16O/18O, 32S/34S and 35Cl/37Cl isotope ion pairs by selecting peaks
displaying a pre-defined m/z difference value: ∆ = 1.0034 ± 0.0002 u for 12C/13C isotopes,
∆ = 0.9970 ± 0.0002 u for 14N/15N isotopes, ∆ = 2.0042 ± 0.0002 u for 16O/18O isotopes,
∆ = 1.9958 ± 0.0002 u for 32S/34S isotopes and ∆ = 1.9970 ± 0.0002 u for 35Cl/37Cl isotopes.
Similarly, specific searches for peaks of the potential ion pairs corresponding to non-
conjugated and conjugated metabolites were performed. The following mass differences were

7
used: Δ = 176.0321 ± 0.0002 u for glucuronide conjugates, Δ = 79.9568 ± 0.0002 u for sulfate
conjugates, Δ = 255.9889 ± 0.0002 u for glucurono-sulfate conjugates,
Δ = 305.0682 ± 0.0002 u for glutathione conjugates, Δ = 119.0041 ± 0.0002 u for cysteine
conjugates and Δ = 161.0147 ± 0.0002 u for N-acetyl-cysteine conjugates.
Various data filtering methods were then employed to process the mass defect profiles.
A MDF using a mass defect window (i.e. either ± 0.050 u or ± 0.060 u) centered at -0.0113 u,
the theoretical mass defect value of the deprotonated vinclozolin (the theoretical accurate m/z
value of [M-H]- ions is 283.9887) was applied to eliminate species with mass defect values
outside the window used.
Alternatively, isotope pattern filter (IPF) templates were applied based on the accurate mass
difference of 1.9970 u between 35Cl and 37Cl using a ± 0.0003 u window for tracking M and
(M+2) diagnostic isotope ion pairs characteristic of species containing chlorine atom(s). A
complementary criterion was also added to specifically select dichlorinated species by taking
into account the relative isotope abundance of the (M+2) peak compared to the monoisotopic
one using the ratio interval ranging from 58 % to 70 %, i.e. 64 ± 6 %, which corresponds the
theoretical value for dichlorinated species.
The resulting processed data were converted into reconstituted mass spectrum format in order
to facilitate the comparison with the original data.
Results and Discussion
(Figure 1 near here)
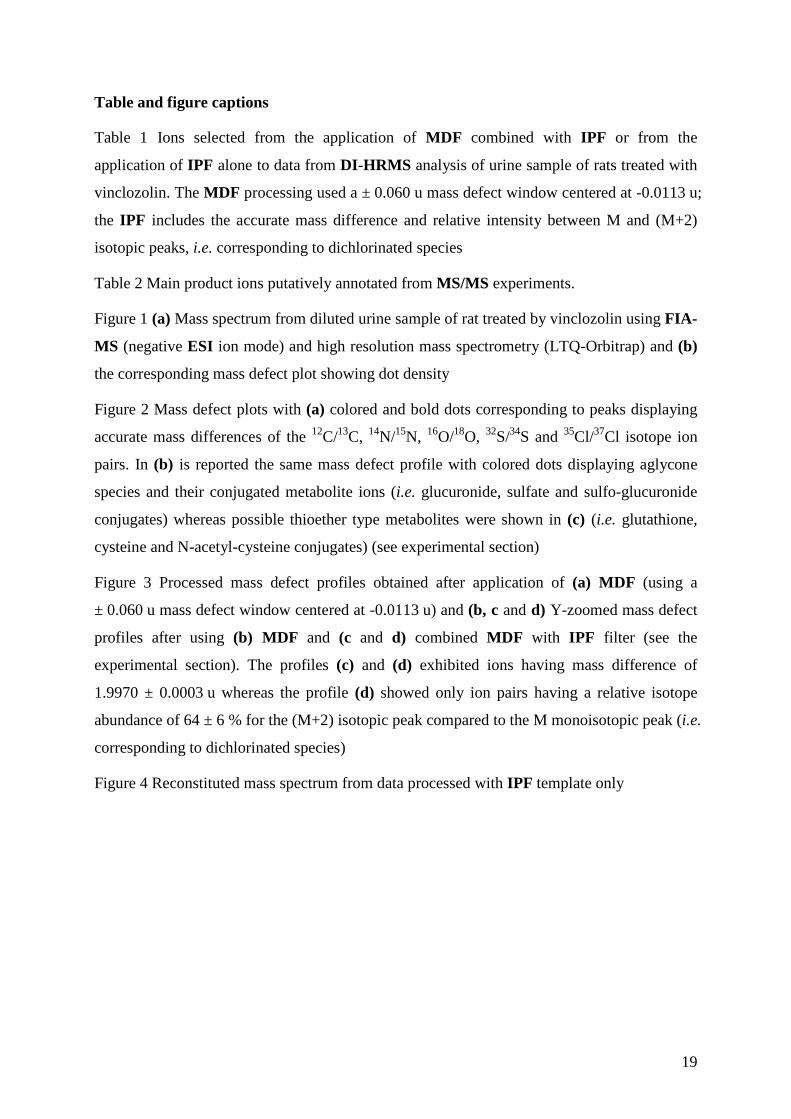
The mass spectrum of diluted urine of rats treated with vinclozolin is presented in Figure 1a.
This spectrum was obtained in previous work using DI-HRMS approach without neither prior
sample clean-up nor chromatographic separation.10 Seven metabolites of vinclozolin were
detected: M1, M4, M5 and M6 as non-conjugated metabolites, the sulfate conjugate of M5
and glucuronide conjugates of M4 and of M5 (Table 1). However, such manual search is
time consuming and cannot be easily applied for large size and complex spectral data,
especially when there are low abundance metabolites and presence of interfering ions with
m/z values close to that of metabolites.
Here, an automated data processing tool was built for performing a fast detection of
vinclozolin metabolites in urine sample from DI-HRMS data. From this dataset, the seven
8
previously annotated metabolites of vinclozolin (displayed as colored dots in the reported
figures) were scrutinized first to test the efficiency of the data filtering methods.
Mass defect profiles
The mass spectral data were processed in the mass defect scale, which consists in the
projection of projecting all detected signals in a two dimensional representation as proposed
by Zhang et al.,19 providing the so-called mass defect profile (Figure 1b and Figure 2). Each
dot represents a peak detected at an accurate m/z value and a specific mass defect value. From
the rat urine analyzed in this work, a region containing a high dot density is located at m/z
values lower than 600 u and mass defect values ranging from -0.10 to 0.20 u, as shown on the
dot density plot in the Figure 1b.
(Figure 2 near here)
In order to better understand the distribution of all dots across the mass defect profile, species
containing chemical elements commonly found in organic compounds such as C, N, O, S and
Cl were automatically searched and represented by colored dots in the Figure 2a. This
involved the search of isotope ion pairs having specific accurate mass differences between 12C
and 13C, 14N and 15N, 16O and 18O, 32S and 34S and 35Cl and 37Cl (with an error of 0.0004 u).
Most of these species were located inside a specific plotting region described above,
indicating the presence of most of species, which are characteristic of the sample, as reported
by Zhang et al.19 for several biological matrices (i.e. plasma, urine, bile, and feces). However,
the authors mentioned that dot distribution of common drugs overlapped dot cluster in the
mass defect profile of urine samples whereas better separation was observed for other
biological matrices. Here, the seven expected metabolites of vinclozolin were also detected in
the region of high dot density. The signals located outside the dense dot clusters may be
attributed to endogenous and contaminant compounds as demonstrated by the occurrence of
isotope ion pairs (e.g., 12C/13C in the Figure 2a). However, other dots characterized by
anomalous mass defect values were also detected, suggesting the presence of artifact peaks,
which could potentially result from Fourier transform experiments.30 It should be underlined
that mass defect profiles generated from LC/MS data displayed large dot densities forming
vertical lines at the low-mass threshold (i.e. about m/z 150), which should correspond to
artifact peaks generated from chemical noise.19 Such vertical lines were not observed from
our DI-HRMS data.

9
Alternatively, potential conjugate metabolite species can be selectively detected through the
search of known biotransformation reactions as proposed in Figure 2b and Figure 2c. These
metabolites can be selected by searching accurate mass differences corresponding to the mass
shifts resulting from classical metabolic pathways. For example, a Δ = 176.0321 ± 0.0002 u
m/z difference was used for tracking glucuronic acid conjugates and their corresponding non-
conjugated compounds in the Figure 2b. The colored dots corresponding to glucuronide,
sulfate, glucurono-sulfate, glutathione, cysteine and N-acetyl-cysteine conjugates and their
non-conjugated forms are mostly located in the same region of high dot density, which should
contain the most relevant chemical information of the biological matrices (Figure 2b and
Figure 2c). Here, conjugated vinclozolin metabolites (i.e. conjugated M4 and M5) as well as
their non-conjugated analogues (i.e. M4 and M5) were found among the detected species.
Thus, this approach enabling the simultaneous detection of conjugated and non-conjugated
metabolite pairs appears to be an efficient way to reveal the (combined) exposure to a (or
several) specific xenobiotic(s).
Nevertheless, data filtering methods such as MDF and other data mining tools can be applied
to process more efficiently such profiles.
Data filtering methods
As reported in the literature,20 most of metabolites produced from phase I or phase II
biotransformations display mass defect shifts within a ± 50 mu window relatively to the mass
defect value of the parent ion (excepted for glutathione conjugates which display a larger
mass defect shift, i.e. 68 mu). Here, a MDF window ranging from -0.060 u to 0.040 u was
applied, which is centered to the mass defect of the deprotonated vinclozolin.
The mass defect profile from DI-HRMS data contains more than 3400 dots (i.e. m/z values)
as shown in the Figure 1. The extraction procedure using the MDF template removed many
interfering ions leading to a strong reduction of the data size. The processed mass defect
profile is composed of 667 variables in which ions of six metabolites of vinclozolin are
detected, except the M5 glucuronide (data not shown). The mass defect of ions of this latter
metabolite (i.e. 47 mu for the m/z 468.0467 monoisotopic peak) is out of the prior MDF
window used. The selectivity of the MDF strongly depends on the closeness of the mass
defect values of metabolites to that of the parent molecule and that of the studied xenobiotics
relatively to that of endogenous compounds of biological matrices. Therefore, the choice of
MDF templates strongly depends on the specific class of metabolites to be selected, e.g.,

10
metabolites formed from minor changes (oxidation, methylation, demethylation…) have
small mass defect shifts relatively to that of the parent molecule. In the case of vinclozolin, a
restrained mass defect window cannot be applied due to the large isotope patterns of this
molecule and, most importantly, because of the already shown occurrence of sulfate and
glucuronic acid conjugates, which display large mass defect shifts compared to the parent
molecule mass defect. The mass defect value of monoisotopic ions of the M5 glucuronide (i.e.
47 mu) is 58 mu higher than that of deprotonated vinclozolin (i.e. -11 mu). Hence, a larger
MDF window (i.e. ± 0.060 u) ranging from -0.070 u to 0.050 u was used to retain ions of the
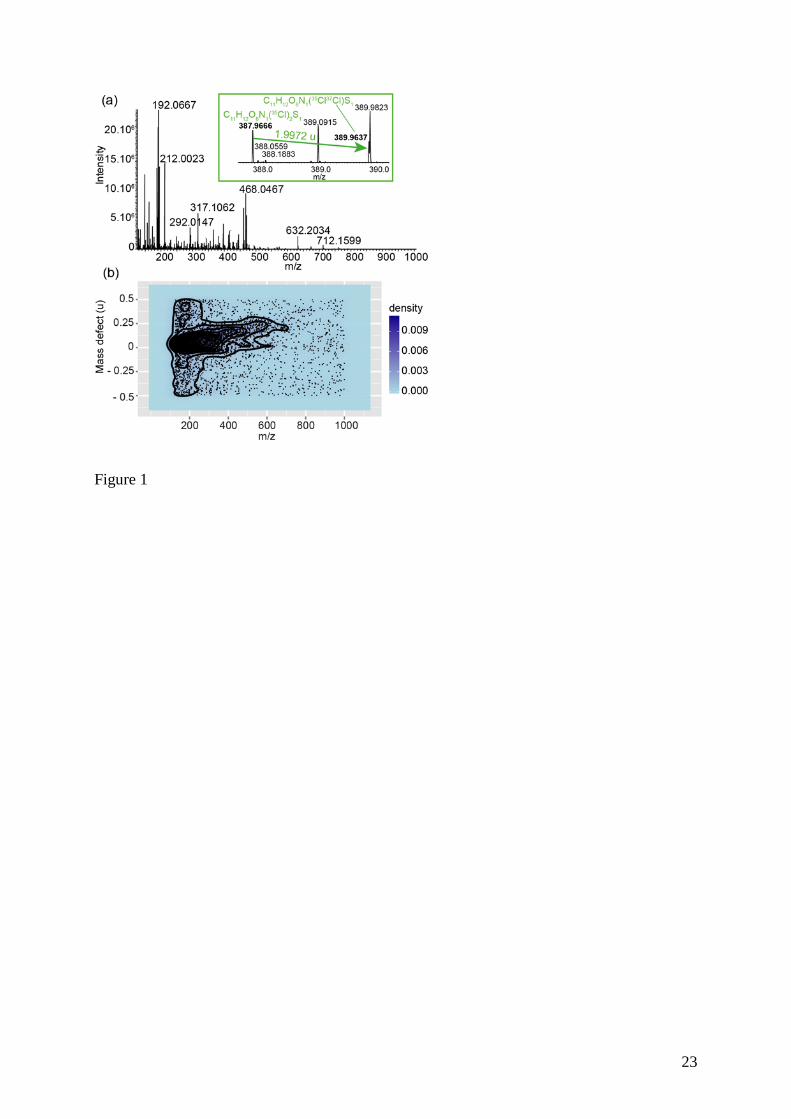
seven known vinclozolin metabolites. The resulting mass defect profile was composed of
about 796 variables, in which ions of the seven metabolites of vinclozolin were extracted
(Figure 3a and 3b). Nevertheless, hundreds of peaks likely corresponding to interferences (i.e.
endogenous compounds and contaminant species) overlapped the xenobiotic metabolite dots
in this mass defect profile.
(Figure 3 near here)
Obviously, the use of a generic MDF template was not sufficiently to remove many
interfering signals and to facilitate the detection of xenobiotic ions in urine sample, as
suggested by Zhang et al.19 The use of multiple MDF templates in parallel can also lead to a
more comprehensive detection of various classes of metabolites. Ruan and Zhu investigated
the bioactivation pathways of ticlopidine in rat liver microsomes using stable isotope-labeled
GSH adducts, LC/HRMS data acquisition and multiple MDF templates among which, the
filtering of doubly charged ions was applied to selectively detect GSH adducts.31 Note that the
structure of the studied parent compound should be carefully considered to ensure that
unexpected metabolites are not lost during the filtering process.20
Alternatively, MDF can be combined with other data mining tools to selectively extract
chemically relevant data.32-34 Here, a further data mining tool was performed by using an
isotope pattern filtering (IPF). Few applications of isotope filters have been reported.10,33-37
For example, IPFs allowed selective detection of organochlorides in environmental samples
from very large data sets produced by GC×GC–HRMS on a TOF instrument.37 However, to
the best of our knowledge, the use of IPF to process spectral data obtained from DIMS
experiments has never been reported until our previous work.10
Here, a combination of MDF (using a ± 0.060 u mass defect window) and IPF templates was
tested for facilitating detection of the expected vinclozolin metabolites and potentially

11
additional unknown metabolites which were not evidenced in our previous work.10 Indeed,
vinclozolin and its metabolites possess highly selective isotopic patterns. Hence, in addition to
MDF, the template based on the accurate mass difference between 35Cl and 37Cl isotopes was
applied, enabling the extraction of 100 dots (Figure 3c). Another IPF template taking into
account an additional pre-defined relative abundance of the (M+2) isotopic peak compared to
the monoisotopic peak was also performed in a similar way as Zhu et al.35 More precisely,
MDF was combined with an IPF template including both an accurate mass difference
window ranging from 1.9967 to 1.9973 u and a relative abundance of isotope pairs falling in
the 58 %-70 % range for searching specifically the dichlorinated species. The processed mass
defect profile is reported in the Figure 3d. A quite broad window (64 % ± 6 %) of relative
peak intensity was used here because of an uncertainty in the relative isotope abundance (RIA)
measurements even using FT/MS instrumentation. Indeed, a systematic error of about 20 %
has been reported for RIA determinations from complex mixture samples analyzed in LTQ-
Orbitrap instrument due to ion suppression phenomena and existence of a signal intensity
threshold.38 In addition, isotopes of common chemical elements constituting the molecule
such as C (at least two atoms), O, Cl and S atoms, contribute to the signal of the (M+2)
isotope peak, leading to an increase of the relative abundance of this peak (theoretical value of
63.9 % for dichlorinated species), especially when the mass resolving power used is not
enough for discriminating those (M+2) isotopic peaks.4
Anyway, the mass defect profile resulting from the application of both MDF and IPF
templates led to a drastic simplification of the dataset containing only 22 variables, among
them, the seven known metabolite ions were clearly predominant (Figure 3d), showing the
high selectivity of such data mining tools for processing DI-HRMS data. In addition, four
other patterns characteristic of dichlorinated species were selected. Their ion pairs (i.e.
monoisotopic and (M+2) isotopic peaks) were detected at i) m/z 159.9729 and 161.9699, ii)
m/z 289.9991 and 291.9964, iii) m/z 297.9347 and 299.9318 and iv) m/z 387.9666 and
389.9637. The examination of LC/MS experiments showed the co-elution of each ion pair (as
displayed by the extracted ion chromatograms based on the accurate m/z values of oxidized
form of M5 metabolite in the Figure S1 in supporting information), confirming their
chemical relation and then their putative belonging to the same dichloride isotopic pattern.
The m/z 159.9729 ions could be putatively annotated as the deprotonated 3,5-dichloro-aniline
species (with 1.6 ppm of mass error) coming from the M3 metabolite of vinclozolin.39 The
m/z 289.9991 ions could correspond to deprotonated species of oxidized form of M5
metabolite (i.e. M5 with one double bond or a ring formation) and could be annotated as

12
C11H10O4NCl2 with -0.3 ppm mass error. The latter m/z 387.9666 ions could be putatively
annotated as C11H12O8NCl2S (-0.2 ppm error), which may be ion formulae of ionized sulfate
conjugate of hydroxylated M5 metabolite. These three metabolites were not characterized as
urinary metabolites of vinclozolin in previous studies.10,28 Unfortunately, the m/z 297.9347
value did not give any plausible elemental composition by considering the vinclozolin moiety.
(Table 1 near here)
(Figure 4 near here)
To test the selectivity of IPF in our case, this latter data filter template (including the criteria
of accurate mass difference and relative abundance for chloride isotopes) was directly applied
on the unprocessed data (Table 1 and reconstituted mass spectrum from processed data in the
Figure 4). A significant reduction of the data size from more than 3400 to only 24 variables
was obtained, among them all ions (22 variables) selected from the previous processing using
the combination of MDF and IPF filters were still present. One additional dichloride isotopic
pattern was selected: the m/z 469.0502 and m/z 471.0471 ions should correspond to the (M+1)
and (M+3) isotopic peaks of the glucuronide acid conjugate of M5. This ion pair was not
selected when using MDF because the mass defect value of the m/z 469.0502 ions (slightly
higher than 50 mu) is outside the used MDF window (i.e. ranging from -0.070 u to 0.050 u).
This result demonstrated the high efficiency of IPF to extract selectively vinclozolin
metabolites.
Complementary LC/MS and MS/MS experiments
LC/MS and MS/MS experiments were further performed to consolidate the putative
annotation of the vinclozolin metabolites (Table 2). No MS/MS experiments could be
performed for low abundance ions of M1, M3 and M6 metabolites. Because of the stability of
the dichloroaniline structure, no decomposition from M3 metabolite ions could occur.
From LC/MS analysis, extracted ion chromatograms were generated by using the accurate
m/z values of the vinclozolin metabolites with mass tolerance of 5 ppm (Figure S1 in
supporting information). Several chromatographic peaks were detected at the same m/z value,
indicating the presence of isomer ions for almost vinclozolin metabolites. The existence of
isomers of vinclozolin metabolites (i.e. diastereoisomers as well as regio-isomers) has already
been reported in the previous metabolic work using radio-labelled parent compound.28 It
should be noted that in addition to those structural isomers, isobaric species may also be
detected (within the mass tolerance of 5 ppm used for EIC traces). Different ionic states of

13
vinclozolin metabolites could eventually exist since no organic or acid additives were added
to the chromatographic solvent to improve the separation. This probably explains the
detection of multiple chromatographic peaks for most of vinclozolin metabolites (Figure S1
in supporting information). To eventually resolve the isomer structure, LC/MS/MS
experiments were performed. The resulted fragmentation patterns did not allow to elucidate
the exact structure of isomers since almost identical MS/MS spectra were obtained for the
different chromatographic peaks detected at the same accurate m/z value. Only the
characterization of the conjugation type is provided by the formation of diagnostic product
ions and/or the loss of neutral. For example, sulfate conjugate species (i.e. M5 and
hydroxylated M5 sulfate) mainly decomposed by loss of SO3 into the formation of non-
conjugated species (i.e. m/z 292.0145 and m/z 308.0108 product ions from deprotonated M5
sulfate and hydroxylated M5 sulfate, respectively; Table 2). From glucuronide conjugates
(i.e. M4 and M5 glucuronides), m/z 235.0456 product ions were mainly formed under CID
conditions. These ions should correspond to deprotonated hydroxy-ethyl glucuronide
(C8H1108 formulae), but do not give indication about the exact position of the conjugation.
Nevertheless, the formation of these latter product ions suggest that conjugation may occur on
one of the two hydroxyl groups located on the positions 3 and 4 of the butanamide of M4 or
M5 metabolites.
The comparison of the MS/MS spectra of M5 and the possible oxidized form of M5
metabolites showed the main product ions detected at m/z values shifted by 2 u. The detection
of m/z 229.9798 fragment ions from m/z 290 parent ions (i.e. oxidized form of M5) instead of
m/z 231.9935 from m/z 292 parent ions (i.e. M5) suggested that one additional insaturation or
cyclization should occur within positions 1 and 2 of the butanamide moiety. A putative
structure involving a ring formation was proposed in the Table 2. Anyway, metabolite
identification cannot be performed without availability of authentic reference compounds,
according to the Metabolomics Standards Initiative (MSI).40
(Table 2 near here)
Conclusion
Our study constitutes one of the few examples of applications of dedicated data mining tools
based on the mass defect for processing HRMS data generated from direct analysis of
biological fluids without requiring any prior sample clean-up or chromatographic separation.
Such a data processing strategy showed a good selectivity for the complex HRMS data

14
extraction and greatly improved the detection of xenobiotics and that of their metabolites in
biological matrices.
In our model, the ability to resolve stable isotopes based on their accurate masses and relative
intensities demonstrated the high efficiency of the approach used for the selective detection of
urinary metabolites of vinclozolin. Interestingly, three additional metabolites, which have not
been characterized in the previous metabolic work using 14C-radiolabelled parent
compound,28 were detected and putatively annotated.
Although our model is a favorable case since vinclozolin displays a highly specific isotopic
pattern, such an approach can be applied for any compound displaying characteristic isotopic
pattern. Alternatively, stable isotopes can also be synthetically incorporated into biological
materials for screening specific compounds and their metabolites. Indeed, as shown in
proteomic studies, the “mass defect tags” method, as employed in bio-molecular analysis41
when using reactive molecules having discernable mass defect values, constitutes a very
attractive way for tracking desired labeled species.33,34,42.
Finally, such a high throughput metabolomic approach combining direct MS analysis of
biofluids and complementary data mining tools appears to be very promising for phenotyping
large cohorts and tracking exposure to various xenobiotics.
Anyway, it must be underlined that MDF and other data mining tools constitute a useful step
in the global strategy for screening and characterizing the structure of metabolites which
further requires complementary experiments and computational tools for metabolite identity
assignment, e.g., empirical formulae determination and/or the interpretation of their product
ion spectra. The molecular sites prone to biotransformation can be subsequently elucidated
using the structural information from the MSn experiments.
Acknowledgments
The authors thank Professor Douglas N. Rutledge for his interest in this study and for the
proof reading.

15
References
[1] M. Kellmann, H. Muenster, P. Zomer, H. Mol. Full scan MS in comprehensive qualitative and quantitative residue analysis in food and feed matrices: How much resolving power is required ? J. Am. Soc. Mass Spectrom. 2009, 20, 1464.
[2] E. van der Heeft, Y. J. C. Bolck, B. Beumer, A. W. J. Nijrolder, A. A. M. Stolker, M. W. F. Nielen. Full-scan accurate mass selectivity of ultra-performance liquid chromatography combined with time-of-flight and Orbitrap mass spectrometry in hormone and veterinary drug residue analysis. J. Am. Soc. Mass Spectrom. 2009, 20, 451.
[3] B. Habchi, S. Alves, A. Paris, D. N. Rutledge, E. Rathahao-Paris. How to really perform high throughput metabolomic analyses efficiently ? Trends Anal. Chem. 2016, 85,128.
[4] S. Alves, E. Rathahao-Paris, J. C. Tabet, Potential of Fourier transform mass spectrometry for high-throughput metabolomics analysis. in Adv. Bot. Res. (Ed: D. Rolin), Metabolomics coming of age with its technological diversity, Amsterdam, 2013, 67, pp. 219.
[5] H. Chen, G. Gamez, R. Zenobi. What Can We Learn from Ambient Ionization Techniques? J. Am. Soc. Mass Spectrom. 2009, 20, 1947.
[6] G. Madalinski, E. Godat, S. Alves, D. Lesage, E. Genin, P. Levi, J. Labarre, J. C. Tabet, E. Ezan, C. Junot. Direct introduction of biological samples into a LTQ-Orbitrap hybrid mass spectrometer as a tool for fast metabolome analysis. Anal. Chem. 2008, 80, 3291.
[7] J. Han, R. M. Danell, J. R. Patel, D. R. Gumerov, C. O. Scarlett, J. P. Speir, C. E. Parker, I. Rusyn, S. Zeisel, C. H. Borchers. Towards high-throughput metabolomics using ultrahigh-field Fourier transform ion cyclotron resonance mass spectrometry. Metabolomics. 2008, 4, 128.
[8] J. C. Erve, W. Demaio, R. E. Talaat. Rapid metabolite identification with sub parts-per-million mass accuracy from biological matrices by direct infusion nanoelectrospray ionization after clean-up on a ZipTip and LTQ/Orbitrap mass spectrometry. Rapid Commun. Mass Spectrom. 2008, 22, 3015.
[9] J. C. Erve, C. E. Bayer, L. Manzino, R. E. Talaat. Metabolite identification in rat brain microdialysates by direct infusion nanoelectrospray ionization after desalting on a ZipTip and LTQ/Orbitrap mass spectrometry. Rapid Commun. Mass Spectrom. 2009, 23, 4003.
[10] E. Rathahao-Paris, A. Paris, J. Bursztyka, J. P. Jaeg, J. P. Cravedi, L. Debrauwer, Identification of xenobiotic metabolites from biological fluids using flow injection analysis high-resolution mass spectrometry and post-acquisition data filtering. Rapid Commun. Mass Spectrom. 2014, 28, 2713.
[11] L. Sleno. The use of mass defect in modern mass spectrometry. J. Mass Spectrom. 2012, 47, 226.
[12] E. Kendrick. A mass scale based on CH2= 14.0000 for high resolution mass spectrometry of organic compounds. Anal. Chem. 1963, 35, 2146.
[13] C. A. Hughey, C. L. Hendrickson, R. P. Rodgers, A. G. Marshall. Kendrick mass defect spectrum: A compact visual analysis for ultrahigh-resolution broadband mass spectra. Anal. Chem. 2001, 73, 4676.
[14] A. G. Marshall, R. P. Rodgers. Petroleomics: Chemistry of the underworld. PNAS. 2008, 10, 18090.

16
[15] E. B. Kujawinski, M.; D. Behn. Automated analysis of electrospray ionization Fourier transform ion cyclotron resonance mass spectra of natural organic matter. Anal. Chem. 2006, 78, 4363.
[16] E. Werner, J. F. Heilier, C. Ducruix, E., Ezan, C. Junot, J. C. Tabet. Mass spectrometry for the identification of the discriminating signals from metabolomics: Current status and future trends. J. Chromatogr. B. 2008, 871, 143.
[17] H. Zhang, D. Zhang, K. Ray. A software filter to remove interference ions from drug metabolites in accurate mass liquid chromatography/mass spectrometric analyses. J Mass Spectrom. 2003, 38, 1110.
[18] M. Zhu, L. Ma, D. Zhang, K. Ray, W. Zhao, W. G. Humphreys, G. Skiles, M. Sanders, H. Zhang. Detection and characterization of metabolites in biological matrices using mass defect filtering of liquid chromatography/high resolution mass spectrometry data. Drug Metab. Dispos. 2006, 34, 1722.
[19] H. Zhang, M. Zhu, K. L. Ray, L. Ma, D. Zhang. Mass defect profiles of biological matrices and the general applicability of mass defect filtering for metabolite detection. Rapid Commun. Mass Spectrom. 2008, 22, 2082.
[20] H. Zhang, D. Zhang, K. Ray, M. Zhu. Mass defect filter technique and its applications to drug metabolite identification by high-resolution mass spectrometry, J. Mass. Spectrom. 2009, 44, 999.
[21] F. Cuyckens, R. Hurkmans, J.M. Castro‐Perez, L. Leclercq, R. J. Mortishire‐Smith. Extracting metabolite ions out of a matrix background by combined mass defect, neutral loss and isotope filtration. Rapid Commun. Mass Spectrom. 2009, 23, 327.
[22] Y. Liang, W. Xiao, C. Dai, L. Xie, G. Ding, G. Wang, Z. Meng, J. Zhang, A. Kang, T. Xie, Y. Liu, Y. Zhou, W. Liu, L. Zhao, J. Xu. Structural identification of the metabolites for strictosamide in rats bile by an ion trap-TOF mass spectrometer and mass defect filter technique. J. Chromatogr. B. 2011, 879, 1819.
[23] S. H. López, M. M. Ulaszewska, M. D. Hernando, M .J. Bueno, M. J. Gómez, A. R. Fernández-Alba. Post-acquisition data processing for the screening of transformation products of different organic contaminants. Two-year monitoring of river water using LC-ESI-QTOF-MS and GCxGC-EI-TOF-MS. Environ. Sci. Pollut. Res. Int. 2014, 21, 12583.
[24] M. J. Reid, J. A. Baz-Lomba, Y. Ryu, K .V. Thomas. Using biomarkers in wastewater to monitor community drug use: a conceptual approach for dealing with new psychoactive substances. Sc. Total Environ. 2014, 487, 651.
[25] T. Xie, Y. Liang, J. A, H. Hao, L. Liu, X. Zheng, C. Dai, Y. Zhou, T. Guan, Y. Liu, L. Xie, G. Wang. Post acquisition data processing techniques for lipid analysis by quadrupole time-of-flight mass spectrometry. J. Chromatogr. B. 2012, 905, 43.
[26] Z. M. Gu, L. Q. Wang, J. Wu. Mass Defect Filter - A New Tool to Expedite Screening and Dereplication of Natural Products and Generate Natural Product Profiles. Nat. Prod. J. 2011, 1, 135.
[27] J. L. Geng, Y. Dai, Z. H. Yao, Z. F. Qin, X. L. Wang, L. Qin, X. S. Yao. Metabolites profile of Xian-Ling-Gu-Bao capsule, a traditional Chinese medicine prescription, in rats by ultra performance liquid chromatography coupled with quadrupole time-of-flight tandem mass spectrometry analysis. J. Pharmaceut. Biomed. Anal. 2014, 96, 90.

17
[ 28 ] J. Bursztyka, L. Debrauwer, E. Perdu, I. Jouanin, J. P. Jaeg, J. P. Cravedi. Biotransformation of vinclozolin in rat precision-cut liver vices: Comparison with in vivo metabolic pattern. J. Agric. Food Chem. 2008, 56, 4832. [29] R Core Team (2014). R: A language and environment for statistical computing. R Foundation for Statistical Computing, Vienna, Austria. URL http://www.R-project.org/
[30] A. G. Marshall, C. L. Hendrickson, G. S. Jackson. Fourier transform ion cyclotron mass spectrometry: a primer. Mass Spectrom. Rev. 1998, 17, 1.
[ 31 ] Q. Ruan, M. Zhu. Investigation of bioactivation of ticlopidine using linear ion trap/Orbitrap mass spectrometry and an improved mass defect filtering technique. Chem. Res. Toxicol. 2010, 23, 909.
[ 32 ] H. K. Lim, J. Chen, C. Sensenhauser, K. Cook, V. Subrahmanyam. Metabolite identification by data-dependent accurate mass spectrometric analysis at resolving power of 60,000 in external calibration mode using an LTQ/Orbitrap. Rapid Comm. Mass Spectrom. 2007, 21, 1821.
[33] A. LeBlanc, T. C. Shiao, R. Roy, L. Sleno. Improved detection of reactive metabolites with a bromine-containing glutathione analog using mass defect and isotope pattern matching. Rapid Comm. Mass Spectrom. 2010, 24, 1241.
[34] C. Bueschl, B. Kluger, M. Lemmens, G. Adam, G. Wiesenberger, V. Maschietto, A. Marocco, J. Strauss, S. Bödi, G. G. Thallinger, R. Krska, R. Schuhmacher. A novel stable isotope labelling assisted workflow for improved untargeted LC-HRMS based metabolomics research. Metabolomics. 2014, 10, 754.
[35] P. Zhu, W. Tong, K. Alton, S. Chowdhury. An accurate-mass-based spectral-averaging isotope-pattern-filtering algorithm for extraction of drug metabolites possessing a distinct isotope pattern from LC-MS data. Anal. Chem. 2009, 81, 5910.
[36] F. Du, Q. Ruan, M. Zhu, J. Xing. Detection and characterization of ticlopidine conjugates in rat bile using high-resolution mass spectrometry: applications of various data acquisition and processing tools. J. Mass Spectrom. 2013, 48, 413.
[37] S. Hashimoto, Y. Zushi, A. Fushimi, Y. Takazawa, K. Tanabe, Y. Shibata. Selective extraction of halogenated compounds from data measured by comprehensive multidimensional gas chromatography/high resolution time-of-flight mass spectrometry for non-target analysis of environmental and biological samples. J. Chromatogr. A. 2013, 1282, 183.
[38] Y. Xu, J. F. Heilier, G. Madalinski, E. Genin, E. Ezan, J. C. Tabet, C. Junot. Evaluation of accurate mass and relative isotopic abundance measurements in the LTQ-Orbitrap mass spectrometer for further metabolomics database building. Anal. Chem. 2010, 82, 5490.
[39] S. Y. Szeto, N. E. Burlinson, J. E. Rahe, P. C. Oloffs. Kinetics of hydrolysis of the dicarboximide fungicide vinclozolin. J. Agric. Food Chem. 1989, 37, 523.
[40] L.W. Sumner, A. Amberg, D. Barrett, M. H. Beale, R. Beger, C.A. Daykin, T.W.-M. Fan, O. Fiehn, R. Goodacre, J.L. Griffin, T. Hankemeier, N. Hardy, J. Harnly, R. Higashi, J. Kopka, A.N. Lane, J.C. Lindon, P. Marriott, A.W. Nicholls, M.D. Reily, J.J. Thaden, M.R. Viant. Proposed minimum reporting standards for chemical analysis. Metabolomics. 2007. 3(3), 211.
[41] M. P. Hall, S. Ashrafi, I. Obegi, R. Petesch, J. N. Peterson, L. V. Schneider. ‘Mass defect’ tags for biomolecular mass spectrometry. J. Mass Spectrom. 2003, 38, 809.

18
[42] P.M. Cano, E.L. Jamin, S. Tadrist, P. Bourdaud'hui, M. Péan, L. Debrauwer, I.P. Oswald, M. Delaforge, O. Puel. New untargeted metabolic profiling combining mass spectrometry and isotopic labeling: application on Aspergillus fumigatus grown on wheat. Anal. Chem. 2013, 85, 8412.
19
Table and figure captions
Table 1 Ions selected from the application of MDF combined with IPF or from the
application of IPF alone to data from DI-HRMS analysis of urine sample of rats treated with
vinclozolin. The MDF processing used a ± 0.060 u mass defect window centered at -0.0113 u;
the IPF includes the accurate mass difference and relative intensity between M and (M+2)
isotopic peaks, i.e. corresponding to dichlorinated species
Table 2 Main product ions putatively annotated from MS/MS experiments.
Figure 1 (a) Mass spectrum from diluted urine sample of rat treated by vinclozolin using FIA-
MS (negative ESI ion mode) and high resolution mass spectrometry (LTQ-Orbitrap) and (b)
the corresponding mass defect plot showing dot density
Figure 2 Mass defect plots with (a) colored and bold dots corresponding to peaks displaying
accurate mass differences of the 12C/13C, 14N/15N, 16O/18O, 32S/34S and 35Cl/37Cl isotope ion
pairs. In (b) is reported the same mass defect profile with colored dots displaying aglycone
species and their conjugated metabolite ions (i.e. glucuronide, sulfate and sulfo-glucuronide
conjugates) whereas possible thioether type metabolites were shown in (c) (i.e. glutathione,
cysteine and N-acetyl-cysteine conjugates) (see experimental section)
Figure 3 Processed mass defect profiles obtained after application of (a) MDF (using a
± 0.060 u mass defect window centered at -0.0113 u) and (b, c and d) Y-zoomed mass defect
profiles after using (b) MDF and (c and d) combined MDF with IPF filter (see the
experimental section). The profiles (c) and (d) exhibited ions having mass difference of
1.9970 ± 0.0003 u whereas the profile (d) showed only ion pairs having a relative isotope
abundance of 64 ± 6 % for the (M+2) isotopic peak compared to the M monoisotopic peak (i.e.
corresponding to dichlorinated species)
Figure 4 Reconstituted mass spectrum from data processed with IPF template only

20
Table 1
Measured m/z
mass defect (mu)
(M+2)/M ratio (a)
Ion chemical formulae
Mass error (ppm)
Putative annotation
159.9729(d) 161.9699(d)
-27 -30
65 C6H4 NCl2 1.6 3,5-dichloroaniline (M3)
289.9991(d) 291.9964(d)
-1 -4
62 C11H10O4NCl2 -0.3 Oxidized M5 (or M5 with one double bond)
292,0147 294,0118
15 12
63 C11H12O4NCl2 -0.6 N-(3,5-dichlorophenyl)-2,3,4-trihydroxy-2-methyl-butanamide (M5)(b,c)
297.9347(d)
299.9318(d) -65 -68
63 Unknown -
301.9991 303.9961
-1 -4
61 C12H10O4NCl2 -0.3 2-(3,5-dichlorophenyl)-carbamoyl-oxy-2-methyl-3-
butenoic acid (M1)(b,c)
317.9940 319.9910
-6 -9
62 C12H10O5NCl2 -0.4 3-(3,5-dichlorophenyl)-5-(1,2-dihydroxyethyl)-5-methyl-1,3-oxazolidine-2,4-dione (M4)(b,c)
336.0045 338.0017
5 2
61 C12H12O6NCl2 -0.6 2-(3,5-dichlorophenyl)-carbamoyl-oxy-2-methyl-3,4-
dihydroxybutenoic acid, (M6)(b,c)
371.9714 373.9684
-29 -32
66 C11H12O7NCl2S -0.8 Sulfate conjugate of M5(c)
387.9666(d)
389.9637(d) -33 -36
65 C11H12O8NCl2S -0.2 Sulfate conjugate of hydroxylated M5
468.0467 469.0502(e)
470.0435 471.0471(e)
47 50 43 47
61 C17H20O10NCl2 -0.7 Glucuronic acid conjugate of M5(b,c)
494.0260 496.0228
26 23
69 C18H18O11NCl2 -0.5 Glucuronic acid conjugate of M4(b,c)
(a) Experimental values to be compared to the theoretical value of dichlorinated compound of 64%; Metabolite identity assignment from (b) Bursztyka et al.28 and (c) from Rathahao-Paris et al.10 (d) bold m/z values corresponding to dichloride isotopic patterns not detected in our previous studies10,28 (e) (M+1) or (M+3) isotopic peak of metabolite M5

21
Table 2
m/z value of parent ion and elemental composition of putative metabolite
Measured m/z values of product ions (ion relative abundance %)
Elemental composition of product ions (error in ppm)
Proposed structure and fragmentation of [M-H]- species
290 C11H10O4NCl2 Oxidized M5
229.9778 (100) C9H6O2NCl2 (0.8) Cl
Cl
NO OH
OH
O
229.9778
159.9730 (1) C6H4NCl2 (1.5)
292 C11H12O4NCl2 M5
231.9935 (100) C9H8O2NCl2 (- 0.9) Cl
Cl
NH
O
HO
OHOH
231.9935159.9729
131.0352
159.9729 (28) C6H4NCl2 (1.5) 131.0352 (21) C5H7O4 (1.7)
318 C12H10O5NCl2 M4
274.0037 (100) C11H10O3NCl2 (-2.4) Cl
Cl
NO
O
OHO
OH
257.9726
274.0037
257.9726 (2) C10H6O3NCl2 (-1.5) 246.0091 (43) C10H10O2NCl2 (-1.2) 215.9987 (2) C9H8ONCl2 (-0.8)
159.9728 (1) C6H4NCl2 (1.4) 372 C11H12O7NCl2S Sulfate conjugate of M5
a311.9502 (1) C9H8O5NCl2S (-1.3)
Cl
Cl
NH
O
HO
OROR
231.9935159.9728
138.9710
R=H or SO3
182.9969
a existence of other regio-isomers
292.0145 (100) C11H12O4NCl2 (-1.5) 231.9935 (2) C9H8O2NCl2 (-.9) 182.9969 (2) C4H7O6S (0.2) 159.9728 (2) C6H4NCl2 (1.1) 138.9710 (3) C2H3O5S (2.1)
388 C11H12O8NCl2S Sulfate conjugate of hydroxylated M5
308.0108 (100) C11H12O5NCl2 (3.2) No indication about sulfate and hydroxy group positions
468 C17H20O10NCl2 Glucuronic acid conjugate of M5
450.0358 (2) C17H18O9NCl2 (-1.3)
Cl
Cl
NH
O
HO
OROR
231.9936159.9728
235.0456
R=H or GlcA
292.0145 (6) C11H12O4NCl2 (-1.2) 235.0456 (100) C8H11O8 (-1.3) 231.9936 (4) C9H8O2NCl2 (-0.6) 217.0352 (1) C8H9O7 (-0.6) 193.0354 (5) C6H9O7 (-0.1) 175.0249 (2) C6H7O6 (0.4) 159.9728 (1) C6H4NCl2 (1.1)
494 C18H18O11NCl2 Glucuronic acid conjugate of M4
307.0668 (7) C11H15O10 (-1)
Cl
Cl
NO
O
O ROOR
235.0458
R=H or GlcA
307.0668
235.0458 (100) C8H11O8 (-0.7) 217.0353 (1) C8H9O7 (-0.2) 175.0250 (1) C6H7O6 (1.0)

22
23
Figure 1

24
Figure 2
25
Figure 3
Figure 4