An Economics-by-Design Approach Applied to a Heat Pipe ...
76
INL/EXT-21-63067 An Economics-by-Design Approach Applied to a Heat Pipe Microreactor Concept July 2021 Abdalla Abou-Jaoude Yasir Arafat Idaho National Laboratory, Advanced Reactor Technologies & Design Department Andrew Foss Brent Dixon Idaho National Laboratory, Integrated Energy & Market Analysis Department
Transcript of An Economics-by-Design Approach Applied to a Heat Pipe ...

INL/EXT-21-63067
An Economics-by-Design Approach Applied to a Heat Pipe Microreactor Concept
July 2021
Abdalla Abou-Jaoude
Yasir Arafat
Idaho National Laboratory, Advanced Reactor Technologies & Design Department
Andrew Foss
Brent Dixon
Idaho National Laboratory, Integrated Energy & Market Analysis Department
DISCLAIMER
This information was prepared as an account of work sponsored by an agency of the U.S. Government. Neither the U.S. Government nor any agency thereof, nor any of their employees, makes any warranty, expressed or implied, or assumes any legal liability or responsibility for the accuracy, completeness, or usefulness, of any information, apparatus, product, or process disclosed, or represents that its use would not infringe privately owned rights. References herein to any specific commercial product, process, or service by trade name, trade mark, manufacturer, or otherwise, does not necessarily constitute or imply its endorsement, recommendation, or favoring by the U.S. Government or any agency thereof. The views and opinions of authors expressed herein do not necessarily state or reflect those of the U.S. Government or any agency thereof.

INL/EXT-21-63067
An Economics-by-Design Approach Applied to a Heat Pipe Microreactor Concept
Abdalla Abou-JaoudeAndrew FossYasir ArafatBrent Dixon
Nuclear Science & Technology, Idaho National Laboratory
July 2021
Idaho National LaboratoryNuclear Science & Technology
Idaho Falls, Idaho 83415
http://www.inl.gov
Prepared for theU.S. Department of EnergyOffice of Nuclear Energy
Under DOE Idaho Operations OfficeContract DE-AC07-05ID14517

Page intentionally left blank

iii
EXECUTIVE SUMMARY
Microreactors present a potential paradigm shift in the nuclear industry. Emphasis thus far has been on large-scale multi-billion-dollar projects that cater solely to grid electricity market. These projects can be challenging to finance and execute. On the other hand, microreactors are intended to target a wide variety of smaller niche markets and are expected to be factory-fabricated and more readilydeployable. While diseconomies of scale for microreactors may tend to raise their costs per energy output (MWh) relative to large nuclear plants, offsetting gains can be expected from standardization, simplification, passive safety, lower radionuclide inventories, factory fabrication, fast installation, and low financing costs. To adequately assess these contributions, designers should have a different perspective on cost drivers than for large nuclear plants and can utilize novel approaches for systematic cost reduction.
To account for these important aspects of microreactors, this report proposes an economics-by-design approach that places economic considerations at the center of the design process. The methodology builds on existing frameworks such as design-to-cost and value engineering, expanding them to new markets (beyond the grid), new attributes (beyond costs alone), and introducing the approach at earlier points in the design cycle. Design parameters and technical specifications are systematically evaluated until costs meet market entry points, while also providing the high-priority performance attributes of the particular use case. Determining first-order estimates for different components early in the process enables designers to focus R&D efforts on the biggest overall costcontributors and components with the most cost uncertainty. The analysis isalways guided by market needs and threshold prices. In addition to microreactors, the approach is expected to be useful for other classes of nuclear reactors as well.
The analysis was applied to a concept found in the open literature (the Design A heat-pipe reactor). A comprehensive bottom-up estimate was generated by leveraging a new microreactor-specific code of accounts and a range of cost equations. The initial estimate for levelized cost of electricity (LCOE) unsurprisingly exceeded market ranges since the use case had prioritizedtechnological readiness over economic considerations in design choices. An alternate concept was then proposed, with various assumptions/targets made to reduce the largest cost contributors. Changes in the neutron spectrum, the power output, and building structures were found to make even the first-of-a-kind of this modified concept competitive with diesel generation in some remote communities. Learning rate (LR) assumptions indicated cost reductions achieved from sequential unit deployments could expand the range of competitiveness to include additional markets as deployments proceed.

iv
ACKNOWLEDGEMENTS
This research work was prepared for the U.S. Department of Energy (DOE) through Idaho National Laboratory (INL). This manuscript is authored by Battelle Energy Alliance, LLC under Contract No. DE-AC07-05ID14517 with DOE.
The authors would like to give special thanks to INL colleagues David Shropshire and Jason Hansen for their insightful discussions and feedback on this report. The authors would also like to acknowledge additional colleagues including Chumani Mokoena, Dona Guillen, Ahmad Al Rashdan, and others for their assistance in deriving estimates and correlations for cost algorithms.

v
CONTENTS
EXECUTIVE SUMMARY .................................................................................................................... iii
ACKNOWLEDGEMENTS.................................................................................................................... iv
ACRONYMS.......................................................................................................................................... x
1. Introduction ................................................................................................................................... 1
2. Microreactor Background............................................................................................................... 2
2.1 A New Paradigm in Nuclear ................................................................................................ 2
2.2 Distinctive Design and Deployment Aspects........................................................................ 2
2.3 Previous Cost Estimates for Microreactors........................................................................... 5
3. Economics-by-Design Approach .................................................................................................... 8
3.1 Methodology and Background............................................................................................. 8
3.2 Nuclear Economics: Cost Drivers ........................................................................................ 9
3.3 Identifying Target Markets ................................................................................................ 11
3.4 Economic Optimization of Reactor Design ........................................................................ 12
4. A Bottom-Up Estimate for Microreactor Design A....................................................................... 15
4.1 Background on Design A................................................................................................... 15
4.2 Previous Codes of Accounts and Microreactor Adaptations ............................................... 17
Previous COAs.................................................................................................................. 17
General COA .................................................................................................................... 18
4.3 Cost Equations .................................................................................................................. 20
4.4 Preliminary Bottom-Up Estimate for Design A.................................................................. 22
4.5 Identifying Cost Drivers .................................................................................................... 24
5. Application of Economics-by-Design to Design A ....................................................................... 27
5.1 Assessing Market Needs.................................................................................................... 27
Value Drivers Categories................................................................................................... 27
Segmenting the market ...................................................................................................... 27
Assessing Segment Compatibility...................................................................................... 28
5.2 Sensitivity Assessment ...................................................................................................... 30
Initial Fuel Loading........................................................................................................... 30
Reactor Building ............................................................................................................... 31
Heat Pipes ......................................................................................................................... 31
Instrumentation & Control (I&C)....................................................................................... 33
Neutron Reflector .............................................................................................................. 34
Interest 35
5.3 Modifying Design A to Fit the Market ............................................................................... 35

vi
5.4 Leveraging Economies of Multiples................................................................................... 41
5.5 Microreactor Value Chain ................................................................................................. 44
5.6 Microreactor Market Adoption Lifecycle........................................................................... 47
6. Conclusion................................................................................................................................... 49
References............................................................................................................................................. 50
Appendix A Microreactor Cost Estimation ............................................................................................ 53
Appendix B Microreactor Design Attributes .......................................................................................... 61
Attribute Value in Each Market Segment ........................................................................... 62
Inherent Attribute Competitiveness.................................................................................... 63

vii
FIGURES
Figure 1. Illustration of the “hub-spoke” model for fabricating and deploying microreactors. ...............................................................................................................4
Figure 2. Example layouts of heat pipe and gas-cooled microreactor designs. Taken from (McClure et al. 2015, HolosGen 2021)..........................................................................4
Figure 3. Microreactor cost estimates from NEI (2019). ..............................................................6
Figure 4. Microreactor levelized costs of electricity relative to current electricity price ranges (from [NEI 2019]). ............................................................................................6
Figure 5. Levelized breakdown of the different cost contributor in a reference LWR. Estimated total LCOE is $87/MWh. Data taken from (LucidCatalyst for ETI 2018). ...........................................................................................................................9
Figure 6. Remote communities in Canada relying on diesel (orange) or heavy oil (purple). Taken from (Natural Resources Canada 2021). ...........................................................11
Figure 7. Comparison of reactor design approaches: traditional vs. economics-by-design..........13
Figure 8. Different points in the process at which design decisions can impact the overall economics of a nuclear reactor concept. Note that some downstream choices can also impact upstream effects. ......................................................................................14
Figure 9. Illustration of Los Alamos National Laboratory’s Special Purpose Reactor concept, on which Design A is based (McClure et al. 2015)........................................15
Figure 10. Envisaged BOP for Design A, using a Brayton cycle with recuperator......................15
Figure 11. Cost breakdown by type for Design A LCOE, based on a bottom-up estimate. .........25
Figure 12. Design A LCOE contributions of the lower-level cost accounts. Each item is colored based on the level of confidence in the estimate: high (green), medium (yellow), or low (red)..................................................................................................26
Figure 13. Contribution of total uranium mass and enrichment on the overall LCOE of Design A. All other variables are held constant in this graph.......................................31
Figure 14. Contribution of the reactor building surface area and the underground distance to utilities on the overall LCOE of Design A. All other variables are held constant in this graph. .................................................................................................31
Figure 15. Contribution of the number of heat pipes and their unit price on the overall LCOE of Design A. All other variables are held constant in this graph........................32
Figure 16. Heat pipe unit costs as a function of first-of-a-kind cost and learning rates. ..............33
Figure 17. Contribution of the number of IO sensors and their unit price on the overall LCOE of Design A. All other variables are held constant in this graph........................33
Figure 18. Contribution of the I&C infrastructure on the overall LOCE of Design A as a function of the learning rate from each installation. All other variables are held constant in this graph. .................................................................................................34

viii
Figure 19. Contribution of reflector material and size to the overall LOCE of Design A. All other variables are held constant in this graph. ......................................................34
Figure 20. Contribution of reflector material and size to the overall LOCE of Design A. All other variables are held constant in this graph. ......................................................35
Figure 21. Changes in the cost breakdown structure for Design A’. ...........................................39
Figure 22. LCOE contributions of each account in Design A vs. Design A’...............................40
Figure 23. Percentage breakdown of the cost drivers in Design A vs. Design A’. ......................40
Figure 24. Assumed learning rate for Design A’, showing the break-even point to be competitive across different markets. ..........................................................................43
Figure 25. Microreactor value chain constituents.......................................................................44
Figure 26. Overview of the microreactor value chain.................................................................46
Figure 27. Potential microreactor adoption cycle. ......................................................................47
Figure 28. Battery discounting rates: evolution of unit costs as a function of the number of units purchased.......................................................................................................56
TABLES
Table 1. Representative parameters by reactor size. .....................................................................3
Table 2. Representative capital cost components for U.S. large nuclear plants (LucidCatalyst for ETI 2018)........................................................................................9
Table 3. Dynamics of cost drivers for microreactors vs. larger reactors based on their characteristics. ............................................................................................................10
Table 4. Design A specifications. ..............................................................................................16
Table 5. Generation IV International Forum code of accounts. ..................................................18
Table 6. Microreactor code of accounts for Design A. Items in blue highlight new additions to the GIF framework, and those in green are function-based generalizations of the item. .........................................................................................19
Table 7. Basis of estimates for direct costs relative to ACCERT. Additional information can be obtained in Appendix A. ..................................................................................21
Table 8. Overview of Design A project development costs. Underlined cost cells represent the sum of all corresponding sub-items. .......................................................22
Table 9. Overview of Design A direct costs. Underlined cost cells represent the sum of all corresponding sub-items. ............................................................................................22
Table 10. Overview of Design A indirect services, owner costs, supplementary costs, and financial costs. Underlined cost cells represent the sum of all corresponding sub-items. ...................................................................................................................23

ix
Table 11. Overview of Design A annualized costs (including O&M and refueling costs). Underlined cost cells represent the sum of all corresponding sub-items.......................24
Table 12. Overall summary of the primary cost categories and estimated LCOE for Design A. ...................................................................................................................24
Table 13. Attribute value analysis for the three market segments. ..............................................27
Table 14. Comparative analysis of microreactor attributes against current and future competitors.................................................................................................................28
Table 15. Desired attributes and requirement implications for microreactors. ............................30
Table 16. Sample microreactor design modification tradeoffs and considerations. .....................36
Table 17. Design modification and manufacturing/construction targets for the proposed Design A’. ..................................................................................................................37
Table 18. Overall summary of the primary cost categories and estimated LCOE for Design A’. ..................................................................................................................39
Table 19. Assumed learning rates for the different accounts of Design A’. ................................42
Table 20. Market price ranges in which Design A’ with learning rates can be competitive. Ranges are taken from (NEI 2019)..............................................................................44
Table 21. Costs assumed for reflector and shield. ......................................................................57
Table 22. I&C subcomponent costs based on INL expert judgment. ..........................................58
Table 23. Factory & field indirect support. ................................................................................58
Table 24. Comparison of fuel fabrication costs..........................................................................59
Table 25. Factory & field indirect support. ................................................................................60

x
ACRONYMS
ACCERT Algorithms for Capital Cost Estimation of Reactor Technologies
BOP Balance of Plant
CAPEX Capital Expenditures
COA Code of Accounts
D&D Deactivation & Decommissioning
DOE Department of Energy
DOD Department of Defense
EEDB Energy Economic Data Base
FOAK First-of-a-Kind
FTE Full-Time Equivalents
GIF Generation IV International Forum
HTGR High-Temperature Gas-Cooled Reactor
I&C Instrumentation and Controls
IO Input/Output
LCOE Levelized Cost of Electricity
LR Learning Rate
LWR Light-Water Reactor
NEI Nuclear Energy Institute
O&M Operation and Maintenance
ROB Remote Operating Base
SMR Small Modular Reactor
WACC Weighted Average Cost of Capital

1
An Economics-by-Design Approach Applied to a Heat Pipe Microreactor Concept
1. Introduction
As highlighted by multiple recent studies (e.g., MIT 2018, Lovering et al. 2016, LucidCatalyst for ETI 2018), economic factors are a major driver impacting the construction of new nuclear power, particularly in the U.S. This highlights the need for placing economic considerations (beyond only cost) to the design of new reactors. With new classes of reactors, notably microreactors, garnering increased attention, an approach that prioritize economic considerations will be crucial to their success. Each target market, however, also requires nuclear plant attributes that designs must satisfy alongside economic objectives. This report introduces the economics-by-design (EBD) methodology and applies it to a heat pipe microreactor concept. This approach proposes to push economic considerations to the forefront while also assessing potential trade-offs between cost minimization and performance objectives, such as refueling intervals. The methodology identifies the main cost drivers in an initial concept, then proposes design, technological, manufacturing, and other changes to increase the competitiveness and cater to market needs.
The report will start by introducing microreactors and providing some background on economic considerations of nuclear reactors in general. The EBD approach is then introduced and compared to existing literature in this area. Next, a microreactor code of account is built, based on guidelines from existing Generation IV International Forum (GIF) frameworks. The code of account is then leveraged to establish the first detailed bottom-up estimate for the target microreactor. While the estimates at this stage are approximate and intended as initial estimates, they do provide useful guidelines on trends and characteristics in reactor designs. Building on these initial estimates, the EBD methodology is applied to the given concept, and design changes are recommended to meet identified market needs. A comprehensive assessment is not considered in this study, but rather an assessment of options to meet potential cost targets, and an identification of future work areas to reduce uncertainties.
The main two goals of the report are: (1) to present and promote the EBD approach, includingshowcasing its application to a specific concept, and (2) to provide an initial detailed cost estimate for the example microreactor concept that can be refined in future work. An open-source heat pipe microreactor concept is leveraged as the case study in this report.

2
2. Microreactor Background
2.1 A New Paradigm in Nuclear
Microreactors have the potential to foster a paradigm shift in the nuclear industry, both on the demand side and on the supply side. By offering nuclear reactor concepts with radically smaller outputs,microreactors can target smaller, more remote markets, and mobile applications. Additionally, their smaller size can open new market opportunities due to simplifications in manufacturing, testing, safety requirements, deployment, and financing options. Diseconomies of scale, however, will likely make microreactor less competitive in traditional markets such as the grid.
Remote sites and other off-grid applications will likely be the primary initial focus of this new class of reactor. These applications can differ substantially from one another: some are larger, some are difficult to access (e.g., villages in Alaska), some would serve a single industrial entity (e.g., a mining operation), some would be used for rapid deployment in emergency situations, some would target military bases, and some may be targeting space-based power. Each of these different use cases entails specific needs and developing a one-size-fits-all microreactor solution that caters to all markets will likely be challenging. However, one key common aspect in most of these end cases is that the main currentcompetitor for microreactors is diesel generators, and customers are typically willing to pay a higher price for their electricity/energy. This translates to different market requirements (relative to standard large reactors) that may ultimately enable microreactors to compete successfully.
On the supply side, microreactors are expected to also foster significant changes to the traditional nuclear industry. While the normalized cost of microreactors per kW or MWh will likely be higher thanfor traditional large plants, microreactors are anticipated to achieve cost savings in various ways. By virtue of their size, they are likely to accelerate the factory-fabrication trend started by the movement toward small modular reactors (SMRs). Indeed, many concepts even envisage little to no onsite preparation for deployment, with most components assembled in a factory setting. In addition, the smaller size of these reactors directly translates to a smaller radioactive source term and lower decay heat source. This simplifies many of the safety requirements and facilitates the replacement of even more active systems with passive ones (e.g., replacing pumps with heat pipes). Together, component simplification and factory fabrication could ensure better cost/time controls relative to larger reactors and avoid the long construction times that plague the industry. Lastly, while the normalized cost of microreactors is expected to be higher than for traditional large plants, their overnight cost is still expected to be much lower. Amanageable turnkey cost with a shorter construction lead time would greatly reduce risk and facilitate the financing of these reactors.
Combined, these potential supply-side changes are likely to lead to substantial shifts in the way the nuclear industry typically operates. Rather than delivering large “projects” this new class of reactors will lead to delivering multiple small “products.” In other words, microreactors could be standardized and mass-produced under strict controls, as is the case in the aircraft industry, among others. It remains to be seen, however, whether microreactors designs can effectively compete in their targeted remote markets. The combination of a radically new product serving completely new markets encourages a reassessmentof the traditional design approach, with increased focus on economic considerations. This combination of novel microreactor aspects make them ideal candidates for the “economics-by-design” approach proposed in this report, which will investigate this issue and examine options/considerations for enabling economic competitiveness. The report will start by discussing in greater detail some of the distinctive technical features of microreactors, then introduces the novel approach.
2.2 Distinctive Design and Deployment Aspects
Historically, nuclear reactor designers have opted to approach the competitiveness of nuclear energy by delivering more energy per unit in order to benefit from economies of scale. In light of cost escalationsseen in large projects, especially from coordination challenges among numerous project participants

3
(Lovering et al. 2016, LucidCatalyst for ETI 2018), reactor designers have begun favoring smaller units that can be factory produced with better controls. Cost overruns on large projects led to the recent move toward SMRs, which typically generate electricity in the low 100s of MWe range, as shown in Table 1. Though many SMR components would be factory fabricated, some level of site-specific design and preparation is still envisaged (albeit to a lesser extent than for larger reactors). SMRs typically rely more heavily on passive safety and therefore benefit from certain design simplifications. Microreactors are expected to push this philosophy even further: a single unit would produce less than 20 MWe; its components would be predominantly built in a factory, with very minimal onsite construction planned beyond installation; and its low yield/source term can foster an even greater reliance on passive systems. Thus, micro-reactors are on the other end of the spectrum from GW-scale reactors, with factory fabrication, quick installation, and economy of multiples replacing the multi-year field construction and economy of scale approach.
Table 1. Representative parameters by reactor size.
Large Commercial Reactors1
Small Modular Reactors (SMRs)
Microreactors
Capacity >300 MWe 20–300 MWe <20 MWe235U enrichment ~5 wt% 5–19.75 wt% <19.75 wt%Fuel burnup 60 GWd/MTU >60 GWd/MTU <2 GWd/MTURefueling 18–24 months Continuous to never 3–30 yearsSpectrum Thermal Thermal/fast Thermal/fastCoolant Water Water, liquid metal, gas, salt Liquid metal, gas, saltStandardization Minimal Medium HighModularity Low/medium Medium HighPlant delivery Onsite, multi-year
constructionOnsite installation of modules,less construction
Onsite installation of plant, minimal construction
Operating staff >500/unit <500/unit 0–10/unitPlant lifetime >60 years >30 years 5–30 yearsSequential unit cost reductions
Slow Medium Fast
Notes: (1) Represents the majority of large commercial reactors in the world, but large experimental reactors have also been designed and built in the U.S. and elsewhere featuring other systems.
Microreactors were originally referred to as “Special Purpose Reactors,” as they were designed to cater to specific niche markets, including those for remote communities, emergency disaster response, military installations, and even space power. However, proposed use cases for microreactors haveexpanded to include coupling with renewables as part of the regional electric grid or microgrids, as well as the heat supply for industrial nonelectric applications (see Figure 1). A wide variety of concepts catering to specific use cases has sprung up as a result of this potential versatility, as discussed in Section 3.3.

4
Figure 1. Illustration of the “hub-spoke” model for fabricating and deploying microreactors.
Most microreactor concepts are expected to be factory manufactured, transportable within standard shipping containers, and relatively easy to install/deploy. Some vendors even envisage the whole balance of plant (BOP) to be contained within as few as one container, thus avoiding almost all onsite construction and civil work (e.g., HolosGen, eVinci). Others go even further, pursuing “mobile”configurations that are simple to remove and redeploy at another area of need, with little to no decommissioning requirements (e.g., defense-based concepts by X-energy, BWXT, and Westinghouse).
Microreactor designs feature a wide variety of attributes. In theory, any typical reactor technology can be employed for this class, from water-cooled to liquid-metal or molten-salt approaches. The most common microreactor types employ either heat pipes or gas to cool the reactor, while the core takes the form of a compact “block” surrounded by a reflector. Example illustrations of these two varieties are shown in Figure 2. Heat pipe microreactors rely on natural circulation to avoid using pumps or other active systems to extract heat from the reactor core, thus simplifying certain design aspects and promoting passive redundance in the design (if a heat pipe fails, the reactor design ensures that nearby ones can compensate for the corresponding reduction in heat removal capability). The low power density in this reactor class enables the usage of heat pipes, which are not typically encountered in SMRs or larger reactors (apart for decay heat removal). Both fast and thermal spectra heat-pipe concepts have beenproposed by industry. A range of different fuel types with a relatively higher enrichment of 235U (up to 19.75wt%) has been proposed for heat-pipe-based designs (e.g., UO2, UZr).
Figure 2. Example layouts of heat pipe and gas-cooled microreactor designs. Taken from (McClure et al. 2015,HolosGen 2021).
Core
Compressorstages
Turbinestages
Reactor vessel
Heat Pipe Design(INL Design A)
Gas-Cooled Design(HolosGen)

5
On the other hand, gas-cooled microreactors build upon the long history of high-temperature gas-cooled reactors (HTGRs). Many of these design variants do away with secondary loops and propose to use a single working fluid (usually He) to extract heat from the reactor and drive the turbine (or heat output, for nonelectric applications). In contrast with the range of fuel types proposed for heat pipeconcepts, the gas-based variety would rely almost exclusively on TRISO fuels, leveraging experience gained with HTGRs. The fuel particles are usually contained within a graphite matrix, though SiC has been proposed as an alternative. These microreactor varieties are almost exclusively thermal, relying on the graphite or hydrides (e.g., ZrH, YH) to moderate neutrons.
Overall, microreactors represent a new paradigm for the nuclear industry. Not only are they orders of magnitude smaller than standard reactors, they also open up new possibilities in the nuclear field. To start with, the much lower power density in the core leads to a greatly reduced decay heat source in the reactor, simplifying emergency core-cooling needs. Similarly, the source term contained within these reactors is also greatly reduced. Vendors rely on these aspects to justify multiple innovations in this reactor class,including substantial simplifications to safety and control needs, minimized human operational requirements, a very compact BOP, the ability to fabricate almost every component in a factory, reduced licensing risks, lessened construction time, and financing needs that are less daunting. As a result, proponents argue that microreactors reduce overall costs not only by shrinking the size of the reactor, but also by initiating this new design and operational paradigm.
In light of these changes, the economics of microreactors can be expected to differ fundamentally from those of typical large reactors, as discussed later in Section 2.1. The most pronounced difference is in the economics of fuel costs. The initial fuel load, a minor cost component in large reactors, can be a primary cost driver for microreactors, many of which expect to operate for several decades with the same fuel loading. Variable operating costs such as fuel are therefore lower for microreactors than for standard reactors. A hypothetical 8 MWth microreactor loaded with 2–3 metric tons of U (MT-U) and operating for 10 years without refueling would burn fuel on the order of ~2 GWd/MT-U. As shown above in Table 1, this is 30 times less than for a standard large reactor. Therefore, the fuel cost per unit of energy output is correspondingly around 30 times larger, without even accounting for the additional enrichment costs.
Furthermore, some components benefit from the reduced size of microreactors, especially the more labor-intensive ones. For example, containment is expected to be much less expensive per unit of power for a microreactor than for a larger one. Similarly, turbomachinery could be obtained off-the-shelf and benefit from design standardization. Furthermore, the smaller size of microreactors may offer a new manufacturing/construction paradigm for the nuclear industry, and microreactors could actually achieve economies of mass production via standardized, self-contained, modularized designs—something long dreamt of for SMRs and larger reactors. Proponents see the potential for delivering nuclear energy as a “product” rather than a “project.”
Because they differ from large reactors in both their design and deployment, cost accounting and cost reduction strategies for microreactors are also expected to differ. Self-contained, modular, simplified, standardized microreactors lend themselves more easily to the novel economics-by-design approach introduced in this report, as opposed to large, complex, site-customized, one-off nuclear plants. The general economics-by-design approach described in this report can, however, be applied to reactors of any size. Ultimately, it remains unclear whether the net effect of competing factors (some raising and others lowering costs per kWe for microreactors relative to large plants) would enable microreactors to have attractive value-propositions in a wide range of markets. Since previous top-down estimates reachedcontradictory conclusions regarding the cost of microreactors, a bottom-up estimate is a valuable additionto the overall discussion of the potential for microreactors, as discussed in the next subsection.
2.3 Previous Cost Estimates for Microreactors
Prior studies used various approaches to present microreactor cost estimates. Most used top-down approaches or other high-level estimations, without specific reference to microreactor designs and

6
deployment plans. The following is a summary of representative microreactor cost estimates from previous studies.
The Nuclear Energy Institute (NEI) (2019): NEI considered various possible parameters for calculating indicative values of microreactor costs. Each parameter ranged from low to high to capture the wide range of possibilities and uncertainty in microreactor design, deployment, and cost components. Parameters for the microreactor cost calculation included overnight capital cost, financing cost (interest during construction and/or return to equity investors), fuel, operating staff, and learning rates to reduce costs over time. As shown in the following figures, the results indicated that microreactor costs could fall below electricity prices in some areas (e.g., Alaska), thus demonstrating potential market viability, but this generic top-down approach lacked any reference to specific microreactor designs or deployment methods. Nor did it consider specific equipment (e.g., heat pipes and reflectors) within the capital costs, or other granularity within its broad cost categories.
Figure 3. Microreactor cost estimates from NEI (2019).
Figure 4. Microreactor levelized costs of electricity relative to current electricity price ranges (from [NEI 2019]).

7
Buongiorno (2021): The author developed baseline and sensitivity cost estimates for a generic microreactor, assuming a capacity of 5 MWe, fuel enrichment of 5% (in contrast with the typical microreactor enrichment of near 20% shown in this report), fuel burnup of 30 MWd/kgHM (higher than the typical microreactor fuel burnup shown in this report), a refueling interval of 2–20 years, a fabrication cost of $1,000–10,000/kWe, a plant installation cost of $1.7 million (equivalent to $340/kWe), an operating staff of 1–7 full-time equivalents (FTE), and a discount rate of 5 or 8%. Most cases led to levelized costs of electricity (LCOE) of $100–150/MWh, and the author notes that LCOE results below $100/MWh are theoretically possible given favorable combinations of input parameters—particularly a low fabrication cost, long refueling interval, and low discountrate.
Froese, Kunz, and Ramana (2020): The authors presented a cost estimate for a generic 3 MWe
nuclear plant, based on scaling the costs for large plants. As cited in this study, this approach was used earlier by engineering companies and researchers assessing the deployment opportunities for small nuclear plants in Canada. The scaling of capital costs adhered to the following relationship:
��������� = ��������� × ��������������
��������������
�.��
The authors used $8,100/kWe (in U.S. dollars) as the cost for large nuclear plants with a capacity of 1,000 MWe (or $8.1 billion in total). With the exponential parameter of 0.55, the cost for a generic plant with a capacity of 3 MWe was $331 million, or $110,000/kWe. This top-down approach did not account for any specific aspect of microreactor design, and it disregarded themicroreactors’ fundamental differences in terms of plant manufacturing and delivery relative to large nuclear plants.
This summary of previous studies demonstrates that, in the absence of specific designs, top-down cost estimates fail to provide a complete picture of the economics of microreactors. By contrast, the approachof this report applies detailed design and deployment information for a specific microreactor concept to a comprehensive bottom-up methodology. The objective is not necessarily to provide a single best estimate for the concept, but rather to highlight an economics-by-design approach more generally.

8
3. Economics-by-Design Approach
3.1 Methodology and Background
The economics-by-design (EBD) approach leverages existing strategies (e.g., design-to-cost, value engineering) to provide a systematic approach to incorporating market needs at an early stage of a nuclear design process. A three-step approach is advocated: (1) assessing cost drivers of the system, (2) recognizing market needs, and (3) optimizing design approaches, technology choices and performance characteristics to effectively compete in the targeted markets. Many reactor designers likely already implement this type of approach in their product lifecycle; this report intends to formalize the steps and showcase them in an example application. The approach lends itself particularly well for microreactors that have the ability to expand the reach of nuclear energy to new markets as highlighted in the previous section. However, the methodology is expected to be applicable to any reactor class.
The approach differs from others in the literature by applying the process in an integrated manner at early stages in the design process (i.e., preconceptual level) and by broadening the scope of markets (beyond the traditional grid) as well as attributes (beyond only cost and safety). EBD builds on the guidelines of the Design-to-Cost methodology (Jorgensen 2005, OECD 2020). The approach was leveraged by EDF (Electricte de France) in the conceptual design of the ‘EPR2’ (OECD 2020). Like the EBD approach, design-to-cost starts from an initial reactor (in this case the EPR design), assesses cost drivers, and recommends design changes that reduce these costs while maintaining adequate safety levels. The EBD approach differs in three key areas:
1. The design-to-cost methodology was applied to a relatively mature concept and only investigated relatively design changes such as the number of auxiliary safety systems that have limited impact on other design aspects in the reactor (these design choices referred to as ‘downstream’ in this report). By contrast, the EBD proposes to also optimize fundamental choices (e.g., the fuel type, reactor spectrum) and is therefore more suited early-on in the design process.
2. Whereas the design-to-cost approach was mainly applied to a single market in the nuclear domain (the traditional electricity grid), the EBD can be leveraged to a wide range of markets/conditions. This may lead to different market considerations as highlighted in point #3.
3. The design-to-cost singles out two main parameters to optimize against: cost and safety. The EBD methods proposes to expand this to other attributes (e.g., reliability, transportability) that are relevant for the competitiveness of a concept. This is particularly important in the case of microreactors targeting markets where cost is not the only important factor (e.g., defense).
Product developers across many industries have well-established approaches for aligning product costs with market price points (e.g., Ramanujam and Tacke 2016, Ulrich et al. 2019). For instance, ‘value engineering’ proposes a systematic and organized approach for meeting market needs (and providing the necessary functions) at the lowest cost possible. To ensure market competitiveness, technology choices and design options for nuclear reactors should be guided by this principle. Starting with a base design, key cost drivers should be identified and quantified. Different components, materials, and methods should then be carefully screened to identify areas of potential substitution using less expensive alternatives. Similarly, ‘producibility engineering’ highlights the need to ensure that a design can be manufactured using existing capabilities, and a defined cost. It involves cost vs. performance tradeoff studies to assess suitable design characteristics. It is important for these design philosophies to be incorporated into the EBD approach to improving the competitiveness of nuclear concepts.
The following subsections will describe in greater detail the three-step approach advocated by EBD to increase the competitiveness of a concept. First, a conceptual design starting point is necessary to ground the analysis and identify cost drivers. Then, an assessment of market needs is needed to identify important

9
attributes beyond the traditional ones (e.g., costs). Lastly, these considerations are incorporated to drive down the cost of a concept and improve some of its attributes.
3.2 Nuclear Economics: Cost Drivers
The first step in the EBD methodology is to assess the primary cost drivers in a technology. Analyses of historical cost outcomes for large nuclear plants in the U.S. and around the world, as conducted in (LucidCatalyst for ETI 2018), (MIT 2018) and others, indicate that plant design customization, construction project management, onsite labor, and interest during construction are large cost drivers. Novel designs should attempt to reduce these cost drivers to the extent possible. Table 2, adapted from (LucidCatalyst for ETI 2018) based on data representative of U.S. large nuclear plant construction projects in the 1970s and 80s, shows the three largest capital cost categories as indirect services, direct costs (consisting of equipment, materials, and labor), and capitalized financial costs. The codes of accounts shown in the left column of the table are discussed in Section 4.2. The levelized costs of electricity (LCOE) showing the contributions of each account is plotted in Figure 5 including refueling, operating costs etc.
Table 2. Representative capital cost components for U.S. large nuclear plants (LucidCatalyst for ETI 2018).
ID Capital Cost Category Normalized Cost
10 Project development $137/kWe
20 Direct costs $2,267/kWe
30 Indirect services $2,542/kWe
40 Operating staff recruitment, training, etc. $687/kWe
50 Capitalized supplementary costs, incl. initial fuel $69/kWe
60 Capitalized financial costs $1,168/kWe
Total capital costs $6,870/kWe
Figure 5. Levelized breakdown of the different cost contributor in a reference LWR. Estimated total LCOE is $87/MWh. Data taken from (LucidCatalyst for ETI 2018).
Project development
1%
Direct costs22%
Indirect services25%
Operating staff recruitment, training
etc.7%
Capitalized supplementary costs
1%
Capitalized financial costs12%
Annualized O&M costs24%
Annualized fuel costs8%
Reference LWR

10
Strategies to reduce nuclear plant costs include:
Completion of designs and plans prior to beginning construction
Standardization of designs and reuse in multi-unit construction programs, which allow construction teams to gain experience over time, increase productivity, and learn from missteps
Schedule compression, which limits the accumulation of compound interest
Systematic mitigation of construction project risks
Avoidance of complex onsite construction requiring extensive preparation and supervision.
The profiles of cost drivers for microreactors would differ from those of large nuclear plants, due tothe differences in design and deployment discussed above, particularly diseconomies of scale, large initial fuel load, and high uranium enrichment for certain designs. Other microreactor characteristics could, however, offset the preceding effects by lowering their cost per kWe relative to that of large nuclear plants. These advantageous characteristics include simplification, standardization, factory manufacturing (with higher productivity and lower incidence of errors or rework compared to complex onsite construction), simple and fast installation, and perhaps fewer onsite staff per kWe than at large plants (potentially thanks to remote monitoring centers that can cover many microreactors simultaneously). The different deployment rate for successive units is also important. Large nuclear plants tend to be built infrequently and to have long schedules for planning and construction, which also varies on a regional basis. For this reason, it is difficult to achieve supply chain scale-up and learning effects for large nuclear plants in the absence of a steady long-term multi-unit program. Microreactors, however, could be produced in factories at a faster rate, thus facilitating supply chain scale-up and learning effects in order to achieve cost reductions as successive unit deployments accumulate.
Table 3 summarizes microreactor cost drivers relative to those of large nuclear plants (SMRs wereremoved for ease of comparison). Differences leading to a higher cost per kWe for microreactors are shaded red, those leading to a lower cost are shaded green, and those with indeterminate impacts are shaded yellow.
Table 3. Dynamics of cost drivers for microreactors vs. larger reactors based on their characteristics.
Large CommercialReactors Microreactors
Microreactor Cost Drivers per kWe Relative to Large Reactors
Capacity >300 MWe <20 MWe ↑ (diseconomies of scale)235U enrichment ~5 wt% <19.75 wt%
↑ (higher fuel capital costs)Fuel burnup 60 GWd/MTU <2 GWd/MTURefueling 18–24 months 3–30 yearsSpectrum Thermal Thermal/fastCoolant Water Liquid metal, gas, salt ↑ (higher material costs, potentially
offset by higher thermal efficiency)Standardization Minimal High ↓ (avoids design customization)Modularity Low/medium High ↓ (avoids onsite parts assembly)Plant delivery Onsite, multi-year,
constructionOnsite installation of plant, minimal construction
↓ (avoids inefficient multi-year onsite stick-built construction and reduces financing costs)
Operating staff >500/unit 0–10/unit ↔ (depends on staff per kWe)Plant lifetime >60 years 5–30 years ↑ (more capital expenditures
[CAPEX] recovery per year)Sequential unit cost reductions
Slow Fast ↓ (faster learning across units)

11
3.3 Identifying Target Markets
The second step in the EBD methodology involves a careful assessment of the demand side. Nuclear plant designs—microreactor concepts in particular—must reflect the markets they are intended to serve. Microreactors are well suited to serve a wide range of market needs (Nuvia 2016). Being small, simplified, standardized “products” rather than large, complex, customized “projects,” microreactors can achieve widespread deployment for remote communities, data centers, microgrids, district heating, marine shipping, trucking electric charging stations, oil and gas extraction, mines, and small industrial sites. The small size and modularity of microreactors enables the combining of multiple units to meet energy demands that exceed an individual unit’s capacity.
The traditional market for nuclear plants is electricity—specifically, for grid connection in order to supply consistent baseload power to meet regional electricity demands. In this context, market requirements include adequate production capacity, reliability, voltage and frequency control, and low energy production cost in order to operate with an hourly revenue that ultimately exceeds theaccompanying costs. For nuclear plants, high utilization is important for minimizing fixed costs per hour. Flexible power generation for load following can also provide advantages during periods of low electricity prices, enabling nuclear plants to avoid operating at a financial loss (i.e., when operating costs exceed revenue, based on market prices). However, if reactors ramp down for load following, capital costs must be spread over fewer production hours (i.e., a higher capital cost component per MWh). Hybrid reactor systems can provide cogeneration and supply more power at higher prices during peak periods.
Off-grid electricity applications such as for remote communities, mines, and post-disaster sites also hold promise for microreactors and other types of nuclear plants. Figure 6, reproduced from (Natural Resources Canada 2021), shows remote communities in Canada that rely on either diesel (orange) or heavy oil (purple). Most of these remote communities have electricity demand of 5 MWe or less (Natural Resources Canada 2018, p. 101). The Government of Canada has worked with nuclear developers and other stakeholders to prepare an SMR Roadmap (Natural Resources Canada 2018), and several funding awards have been granted for SMR projects (Government of Canada 2020).
Figure 6. Remote communities in Canada relying on diesel (orange) or heavy oil (purple). Taken from (Natural Resources Canada 2021).

12
For off-grid applications, nuclear plants must be sized to the specific intended customer, and additional energy sources may be necessary for backup, as in N+1 or N+2 systems (with one or two backup units in addition to the N units needed for operation). Thermal efficiency is important for both the grid and off-grid electricity markets, but not essential. For off-grid applications, the microreactor LCOE should be compared with full ratepayer prices as opposed to the generation prices from various power sources, since the transmission and distribution components of full ratepayer prices would not be incurred by customers for collocated off-grid microreactors.
Steam, or thermal energy in another form, offers additional market opportunities for nuclear plants.Example use cases are hydrogen, synthetic hydrocarbon fuels (combining the hydrogen with biogenic carbon), and desalination. Nuclear plants can also create process steam for industrial facilities/refineries(e.g., chemical, paper production, and metal processing). For steam applications, the crucial design requirements are steam outlet temperature and quality.
Nuclear developers tailor their designs and deployment strategies to the needs and characteristics of each of these markets. Such an assessment involves consideration of the overall market size (“total addressable market”), locations and accessibility, and the cost of current competitors. In press materials, GE Hitachi claimed to follow a “design-to-cost” approach for one of its nuclear plant concepts, with the developers specifying the maximum allowable cost for market viability, then iterating on the plant design to achieve the target cost level while still meeting functional requirements (World Nuclear News 2019). However, publicly available information on the design-to-cost approach is scant. The following section fills the gap in industry knowledge and practice by describing “economics-by-design” as a holistic, systematic, iterative process for ensuring the cost competitiveness of microreactors and other nuclearconcepts.
3.4 Economic Optimization of Reactor Design
The main step of the EBD methodology is to distill the findings into the design of a reactor concept. The economic framework identifies the relevant dimensions of drivers and relationships in order to analyze issues within their full context. The framework accounts for the dependence of microreactor costs on energy markets and supply chain infrastructure, including fuel fabrication, manufacturing facilities, and decommissioning processes.
The EBD approach draws on several parts of the economic framework by starting with a consideration of the demand, competitive landscape, and market prices. The methodology also incorporates relationships and parameters from other elements of the framework in order to calculate the equipment, fuel, and decommissioning costs of microreactors. The framework combines microreactorcontextual factors with the design and deployment attributes of specific concepts in order to assess plant costs, revenues, financial viability, and market integration using the economics-by-design approach.
EBD is an inherently iterative process (as most design processes tend to be) with an emphasis on early consideration of cost drivers. As highlighted in Figure 7, the main three engineering considerations for a nuclear reactor revolve around neutronics, thermal hydraulics, and material science. Designers often iterate between these three aspects to identify a concept that meets the safety basis for both normal and off-normal operation. While economic considerations are factored into the analysis, designers often avoid altering fundamental design choices (e.g., coolant type, neutron spectrum, fuel type) based on these aspects. This is especially the case for large nuclear plants with firmly established reactor designs, fuel cycles, and other major systems based on previous generations, leaving little flexibility for significant changes.

13
Figure 7. Comparison of reactor design approaches: traditional vs. economics-by-design.
As shown in Figure 8, in the traditional approach economic considerations typically only impact design refinement considerations after the primary design choices have been selected (e.g., manufacturing and transportation options). Fundamental reactor features that are critical to the safety basis (referred to here as ‘upstream choices’) are seldom revisited for economics considerations, especially not after the safety basis for a concept has been established. The EBD method recommends that economics beconsidered early in the design process in order to reach a more optimal configuration for addressing market needs. By carefully capturing market requirements and iterating through technology choices, design aspects that significantly affect competitiveness (e.g., minimizing fuel consumption) can be identified much earlier in the design process. Following this initial high-level exercise, a more detailed engineering analysis of the neutronic, thermal hydraulic, and material aspects of a concept can be undertaken. An additional round of iteration can then ensure that design options that meet the necessary safety requirements can be reached, while also adhering to the initial technology choices in order to ensure the concept’s market competitiveness. It should be noted that some technology choices may have to be revisited based on feedback from the engineering design stage.

14
Figure 8. Different points in the process at which design decisions can impact the overall economics of a nuclear reactor concept. Note that some downstream choices can also impact upstream effects.
Design choices can impact the economic viability of a concept in various ways. In this report, design choices are grouped into three bins to facilitate discussion points. In reality, there is a spectrum of points at which specific choices can impact options downstream. “Upstream” choices are fundamental design aspects that affect numerous subsequent options. For example, the type of fuel chosen will influence the core specifications, refueling interval, and transportation limitations. Similarly, the reactor’s neutron spectrum will impact its initial fuel load, core lifetime, core specifications, and, consequently, its manufacturing process. On the other hand, midstream choices are considered less fundamental, and mainly concern design refinement or specifications. For instance, the control system specifications do not necessarily impact choices upstream (e.g., fuel type), but sensors and controllers will impact the manufacturing and transportation process further downstream. Downstream choices are especially important for the market viability of microreactor concepts. This bin includes decisions on the manufacturing approach, overall plant layout, construction requirements, etc. These do not directly impact design choices such as coolant type or instrumentation specifications but are likely to significantly impact the final economic viability of a proposed concept in order to avoid the large costs for indirect project activities and other construction-related components, as discussed in Section 3.2.
Design choices need not occur sequentially in a design. For instance, security considerations can be fixed early in the design process. Rather, the groupings here are intended to highlight the interdependencies between choices (for instance increases in security staff are unlikely to affect fuel considerations, but the inverse is not necessarily true). The purpose is to highlight how the economics-by-design approach opens up the possibility of prioritizing competitiveness at all levels of the design process.
As highlighted in Section 2.3, devising cost estimates for a reactor concept in a vacuum is challenging. An initial “base” reactor design is therefore recommended as a starting point for the iteration process. An example use case involving Idaho National Laboratory’s Design A concept (Sterbentz et al. 2018) will be discussed in greater detail in Section 4. At this stage, it is important to emphasize the value of leveraging a base design when beginning the analysis. An economic bottom-up estimate of this initial concept will enable the designer to quantify and identify the key cost drivers both upstream and downstream of the design process. This in turn enables the designer to iterate on technology/design choices in order to meet the targeted market requirements.
I. Upstream Choices
FundamentalDesign Aspects,
e.g. Fuel, Moderator,Coolant, NeutronSpectrum, End-Product, MarketNeeds, OperatingRequirements.
II. Midstream Choices
Design RefinementAspects,
e.g. Dimensions,Specifications, SafetyLimits, I&C, RefuelingIntervals, StaffingNeeds.
III. Downstream Choices
Design Specifics,
e.g. ManufacturingProcess,Transportation, PlantLayout, Construction,Equipment, Security,Safeguards
Focus of TraditionalEconomic Considerations
Scope of Economics-by-Design Considerations

15
4. A Bottom-Up Estimate for Microreactor Design A
4.1 Background on Design A
Design A was selected for the initial trial application of the Microreactor Cost Modeling Tool. It is based on the 5 MWth Special Purpose Reactor concept developed by Los Alamos National Laboratory (McClure et al. 2015), as illustrated in Figure 9. Both concepts rely on heat pipes to conduct heat from the core to a heat exchanger. The core is surrounded by a radial reflector that contains rotatable control drums for controlling the core reactivity. The dynamics of cost drivers are likely different with gas-cooled microreactor variants. These concepts opt for TRISO-based fuels (increase in fabrication costs), operate at a higher pressure and temperature (higher vessel costs), but do away with heat pipes altogether (some savings in that area). Evaluating alternative microreactor concepts is considered outside the scope of the current work,
Figure 9. Illustration of Los Alamos National Laboratory’s Special Purpose Reactor concept, on which Design A is based (McClure et al. 2015).
Design A is made up of individual “units” containing both a fuel element and heat pipe, rather than a core monolith into which fuel elements and heat pipes are inserted. This design decision was made to avoid manufacturing issues. Further, the power conversion in Design A is a gas Brayton cycle, as illustrated in Figure 10.
Figure 10. Envisaged BOP for Design A, using a Brayton cycle with recuperator.
Air in
Air out
Recuperator
CompressorTurbine
Generator
Heat Exchanger
Reflector &shield
Reactor core
Heat pipes
Integrated module

16
Design specifications of the concept from (Sterbentz 2018) are summarized in Table 4. Economics was not a driving criterion in the original design; instead, Technology Readiness Level played a more important role. Design A was not intended for widespread deployment, but to showcase a feasible microreactor demonstration concept from a deployment standpoint.
Table 4. Design A specifications.
Parameter ValueThermal capacity 5.0 MWth
Conversion efficiency 36.20%Electrical capacity 1.8 MWe
UO2 mass 5.2 MT235U enrichment 19.7 w%Neutron spectrum FastReactor lifetime 5 yearsOutlet temperature 700°C
No. of heat pipes 1,134Heat pipe specs 400 cm heigh, 0.9 cm outer radiusControl system 12 drums, 6 banks, 2 emergency rodsReflector mass 2.0 MT SS-316, 7.9 MT Al2O3, 1.7 MT BeOShield dimension 15 cm thickness, 200 cm height
Multiple aspects of Design A were not entirely finalized. Additional design assumptions were made in this work, using expert judgment for the following reactor design aspects:
Exclusion zone area: 32,000 m2 as a representative value for microreactors (from [McDowell and Goodwin 2021])
Containment size: Standard ISO containment outer dimensions surrounded 1.65-m-thick concrete (Stauff et al. 2019)
Reactor building: overall surface area of 1,000 m2 (including multiple stories)
Distance to utilities: 1,000 m
Battery emergency capacity: 135 kWth
Vessels: both SS316
o Inner: 5 cm thickness, 155 cm OD, 425 cm height
o Outer: 1 cm thickness, 226 cm OD, 450 cm height
Heat exchanger: 150 cm height for primary, and 75 cm for emergency
Instrumentation and control (I&C): 1,000 input/output (IO) sensors
Indirect support during construction: 6 staff per reactor
Construction time: 6,000 person-hours
Commissioning duration: 30 days
Commissioning staff: 26
Operating staff training duration: 1.5 years
Number of trainers: 4

17
Distance from hub: 1.5k miles
Construction duration: 2 years
Weighted average cost of capital: 10%
Operating staff: 4 onsite operating staff, 1 remote, 4 security
An average downtime of 18 days/year for maintenance was assumed, yielding a capacity factor of95%
It is important to note that it is currently unclear at this stage whether some of these assumptions will materialize in reality. The low number of operating staff (both for running the reactor and maintenance) in particular, remains a contentious topic in the microreactor community. It is unclear whether licensing bodies will allow for a drastically reduced number of staff, or whether it is feasible from a practical standpoint. Similarly, the quick turnaround in training, construction, and commissioning has never been demonstrated previously in the nuclear industry. Despite of the low level of confidence in some of these assumptions, the analysis is still expected to provide useful guidance on cost contributors and on targets that designers should aim towards.
4.2 Previous Codes of Accounts and Microreactor Adaptations
Codes of accounts (COAs) for nuclear plants enable comprehensive, standardized assessment and comparison of project costs. COAs start at the level of different classes or areas of cost, such as direct construction costs. These high-level cost areas have broad single-digit code designations. COAs then become more granular with two-digit codes, three-digit codes, and additional details with letters or decimal values in some cases to specify particular subsystems and components. The deeper levels of COAs quickly become technology specific, based on LWR technologies.
The fundamental differences between LWR technologies and microreactors, or other nuclear concepts with innovative designs and production methods, necessitated a more general COA than existing systems for illustrating the EBD methodology. To make a more general COA, a functional approach was taken instead of a technology-specific approach. This allows for different technologies to perform the function as needed and enables the same COA to be applied to reactor concepts from the kW-scale to the GW-scale, with different spectrums, coolants, fuels, etc.
The following subsections provide background on previous COAs and then describe development of a more general COA for EBD. The more general COA is used in the EBD example for the heat-pipe microreactor in this report, and it can also be used for other nuclear concepts, such as non-LWR designs,in future work.
Previous COAs
The U.S. Department of Energy (DOE) and national laboratories developed a COA and representative cost values for the Energy Economic Data Base (EEDB) program from the 1970s to the 1990s (for example, DOE 1987 and 1993). The EEDB only included estimates for capital costs. The Generational IV International Framework (GIF) later adapted the EEDB COAs to establish a global standard for nuclear cost analysis. The GIF codes expand beyond the EEDB codes by also including operating costs.
Table 5 shows the high-level single-digit cost areas in (GIF 2007). The GIF system begins with pre-construction activities in the 10s and ends with financing during operation in the 90s. The first sixgroupings (10s–60s) relate to capital costs, and the remaining three (70s–90s) relate to operating costs. The system uses two-digit costs within these nine groupings, with the Direct Construction Costs (20s) having additional detail in three-digit codes. Note that the GIF COA encompasses costs for individual plant projects, thus excluding broader costs related to initial reactor design, licensing, and demonstration, as well as supporting infrastructure investments such as a dedicated microreactor factory or fuel facilities.

18
The GIF COA encompasses plant decommissioning by including a set-aside fund in the Supplementary Costs category (50s), based on expected future needs and expected growth in the fund value as a result of long-term investments such as bonds and stocks.
Table 5. Generation IV International Forum code of accounts.
High-Level Groupings Cost Components
10s: Pre-construction Costs Land and land rights, site permits, plant licensing
20s: Direct Construction Costs Plant structures, equipment, materials, and labor
30s: Indirect Construction Costs Engineering services, project/construction management
40s: Owner’s Costs Temporary worker housing, recruitment/training for operating staff
50s: Supplementary Costs Shipping and transportation, initial fuel load, taxes and insurance, set-aside fund for future decommissioning
60s: Financing During Construction Compound interest accumulation, escalation (inflation), fees
70s: Operating and Maintenance Costs Onsite operators and managers, security, maintenance parts
80s: Fuel Costs During Operation Refueling operations, fuel purchases, onsite fuel handling and storage
90s: Financing During Operation Escalation (inflation), fees
Source: Adapted from (Generation IV International Forum 2007)
General COA
To illustrate the EBD methodology for the Design A heat-pipe microreactor, the GIF COA was generalized to shift from a technology-based system to a functional approach. Table 6 shows the resulting COA for Design A. Items in blue highlight new additions to the GIF COA, and those in green are function-based generalizations of items in the GIF COA. Irrelevant codes in the GIF COA (e.g., pressurizers and steam generators) are omitted, and the black font denotes codes that remain unchanged from the GIF COA.
All codes in the GIF COA that referred to construction have been generalized, because the Design A microreactor would be fabricated in a factory, transported to the plant site, and installed rather than constructed on site from numerous individual parts. Code 221.21, “Reactivity control system,” is a renamed generic item (in green) that could also relate to other microreactor concepts (previous “Control rod drives”). The aggregated and newly created codes (in blue) for Design A (e.g., “Community outreach & education,” “Reactor startup facility,” “Reflector,” “Shield,” and “Moderator”) are discussed in subsequent subsections.

19
Table 6. Microreactor code of accounts for Design A. Items in blue highlight new additions to the GIF framework, and those in green are function-based generalizations of the item.
10s Project development11 Land and land rights12 Site permits13 Plant licensing14, 15, 16 Plant permits & studies18 Community outreach & education
20s Direct costs21 Plant structures
211 Yardwork212 Reactor containment 213 Building and utilities
218T Reactor startup facility 22 Reactor system
221 Reactor components221.12 Outer vessel structure221.13 Inner vessel structure221.21 Reactivity control system221.22 Reflector221.23 Shield221.24 Moderator
222 Main heat transport222.12 Reactor coolant system 222.13 Heat exchangers
227 Instrumentation & control23, 24, 25 Turbine and electric systems
30s Indirect services31, 35, 36, 37, 38 Field & factory indirect support32 Factory & construction supervision33, 34 Commissioning, startup, and demo testing
40s Capitalized owner's costs41,42,43 Operating staff recruitment, training, etc.
50s Capitalized supplementary costs51 Shipping and transportation
511 Reactor module shipping & transportation512 Fuel shipping
53, 54 Taxes & insurance55 Initial fuel load58 Decommissioning costs
581 Reactor module decommissioning 582 Site decommissioning 583 Spent fuel decommissioning
60s Capitalized financial costs61 Escalation (price inflation)62 Fees63 Interest
70s Annualized O&M costs71 O&M staff
711 Onsite technicians and operators712 Remote monitoring technicians713 Security staff714 Maintenance
80s Annualized fuel costs81 Refueling operations84 Additional nuclear fuel

20
The technologies associated with particular sub-functions would be more case-by-case dependent and would vary based on the reactor scale (GW vs. MW) and based on the different technologies opted for (spectrum, type of coolant, etc.). At the lowest levels of the COA, the individual technology options would be included as options for particular cost analyses using the EBD methodology. Thus, other microreactor concepts or nuclear plant designs with fundamental differences from large LWRs would have their own technology-specific selections under the functional high-level categories.
Certain aspects of the new code of account are expected to be relatively unique to microreactors. Items such as ‘remote staff’ or ‘heat pipes’ are typically discussed in the context of microreactors. But other components that are common with a GW-scale reactor could be produced with innovative methods. Most of these components are expected to be factory-fabricated rather than constructed on site. As a result, items in the GIF COA relating to indirect costs in the 30s must be generalized for necessary overhead activities in factories, such as inspection.
4.3 Cost Equations
The various functional components for Design A were analyzed via a bottom-up estimate to provide a rough approximation of direct costs. Additional information can be found in Appendix A. In light of the relatively low maturity of the designs, the cost values provided in this section should be considered very preliminary and only useful for comparative analysis. They are mainly intended for identifying major cost drivers and proposing design modifications that can help improve the economic competitiveness of the design. It should be emphasized that Design A was not conceived to be economically competitive; the primary driving priorities relate to Technology Readiness Level and feasibility of demonstration.
The Algorithms for Capital Cost Estimation of Reactor Technologies (ACCERT) (Ganda et al. 2018, Ganda et al. 2019) served as the starting point for the cost estimate. These consist of a compilation of equations for deriving capital cost estimates for large-scale LWRs based on specified inputs (mass of steel in the pressure vessel, volume of concrete in the containment, etc.). A review of the algorithms to evaluate their suitability for microreactor cost analysis was conducted in (Kim et al. 2020), and the main findings are summarized below:
Since most existing algorithms are inadequate for estimating microreactor components in their current form due to the several orders of magnitude differences in size relative to existing reactors, substantial modifications are needed (e.g., Yardwork).
Many of the existing ACCERT component estimates are for technologies not used in Design A (e.g., Pressurizer) and can be ignored.
On the other hand, some microreactor components were based on technologies not encountered in past ACCERT analyses (e.g., heat pipes) and will require new equations.
Key aspects impacting the economic competitiveness of microreactors (initial fuel loading, operating staff, etc.) are unaccounted for in the current form of ACCERT, thus new cost equations are needed.
Table 7 provides a summary of the microreactor cost equations used for determining the direct costs of Design A. Most of the accounts needed modification, apart from the vessel-based estimates. Manyestimates were only lightly repurposed for this exercise (e.g., Reactivity Control System), while for others, fundamentally different bases of estimates were developed (e.g., Reactor coolant system). Cost equations for each code were formulated based on specific inputs (e.g., vessel costs are expressed as a function of steel mass). This allows for variability in the analysis based on design choices. Additional information on the equations used can be found in Appendix A.

21
Table 7. Basis of estimates for direct costs relative to ACCERT. Additional information can be obtained in Appendix A.
Code Account Design Input Comparison with ACCERT211 Yardwork Surface area
($/m2)ACCERT uses a constant cost factor across reactor types; a normalized value is used instead.
212 Reactor containment
Concrete & excavation volume ($/m3)
ACCERT uses cost factors subdivided among shell, dome, interior, non-concrete, and equipment. Simpler estimates for concrete pouring and excavation work based on INL experiencewere used instead.
213 Building & utilities
Surface area ($/m2) and distance ($/m)
ACCERT uses different cost factors for turbine, reactor, and auxiliary building. A simpler estimate is used here, based on INL experience.
218T Reactor startup Capacity ($/kWh)
ACCERT uses a cost factor for diesel generators; estimates forlithium batteries are used here instead.
221.12 Outer vessel Mass ($/MT) The same cost factor as in ACCERT was considered suitable here; it is expressed in terms of mass of material and its type.
221.13 Inner vessel Mass ($/MT) This is considered analogous to the vessel internals in ACCERT and is estimated as a function of mass of material.
221.21 Reactivity control
Drivers ($/unit) and poison ($/kg)
The same basis used in ACCERT is used here, control drum mechanisms are assumed to be similar to control rods, and neutron poison costs are expressed as a function of mass.
221.12 Reflector costs Mass ($/MT) Not contained in ACCERT, but an estimate based on the mass of material (similarly to other codes) is used.
221.13 Shield Mass ($/MT) Not contained in ACCERT, but an estimate based on the mass of material (similarly to reactivity control) is used.
222.12 Reactor coolant system
Heat pipe cost ($/unit)
ACCERT expresses this as a function of piping mass; here, a quote for individual heat pipes is used.
222.13 Heat exchanger Mass ($/MT) The same cost factor as in ACCERT was considered suitable here; it is expressed in terms of mass of material and its type.
227 Instrumentation & control
No. of sensors ($/IO) and hardware
ACCERT uses a constant cost across reactor types; here, an estimate broken down into input/outputs, infrastructure, control system, and management system is used.
23, 24, 25
Turbine system Capacity ($/kW) ACCERT provides separate cost parameters for turbine, switchyard, electrical equipment, etc. Here, a single estimate is provided based on DOE review of microturbine costs.
Indirect costs in ACCERT were based on high-level simplified multiplication factors expressed as afunction of overall capital costs. This was not deemed suitable for the purposes of accounts in the 10s, 20s, 40s, 50s, and 60s categories listed in Table 6. More detailed algorithms were developed for each account, and are individually summarized in Appendix A. One important cost driver was found to be #55 – Initial fuel load, derived based on the approach outlined in the Advanced Fuel Cycles Cost Basis Report(DOE 2017) (which divided up the estimate into mining, conversion, enrichment, and fabrication costs) and using data from current spot prices.
Since the ACCERT algorithm does not currently capture operation and maintenance (O&M) costs,estimates were generated using a combination of different sources (e.g., LucidCatalyst and the International Atomic Energy Agency [IAEA]). Operating costs are expressed as a function of staffing needs, commissioning costs as a function of staff and duration, training costs as a function of staff and length of teaching, shipping costs as a function of distance from the manufacturing hub, etc. Maintenance and decommissioning costs were both expressed as a function of the total capital costs. The interest accrued was estimated by compounding the loan costs over the construction period.
It is important to note that, since the complete BOP of Design A was not finalized, many design-based assumptions were needed to derive certain estimates. For example, Design A did not specify the containment requirements at this stage, so a below-grade concrete vault was assumed. The thickness of

22
the concrete was based on calculations performed by Argonne National Laboratory for another microreactor concept (Stauff et al. 2019). Similarly, it was left unspecified whether Design A will require a plant building. Some concepts (e.g., Oklo) anticipate a structure to house the reactor. However, other vendors (e.g., Westinghouse) do away with this completely and instead propose to simply bury the reactor in a concrete vault. The initial estimate for Design A assumes some building structure size—an assumption that is revisited in later sections of this report.
4.4 Preliminary Bottom-Up Estimate for Design A
Leveraging the equations from Appendix A, a preliminary bottom-up estimate was completed for Design A. Building on the cost estimate in (Kim et al. 2020), the analysis here updates and extends the work further. The values presented here are intended as rough estimates to test a methodology and should not be considered final estimates of the design. The main intent is to provide a basis of comparison for the economics-by-design approach, and to investigate design modifications using this starting point. The estimates are grouped in tables that correspond to the highest code of accounts level (e.g., 10s, 20s, and 30s). All values are normalized assuming a 1.8 MWe power output, a 95% capacity factor, and a 5-year plant lifetime.
A summary of the project development costs is provided in Table 8. While the overall costs are relatively lower than for code levels such as the 20s, these items still have an elevated normalized cost.This is mainly attributed to the fact that these cost items do not scale down significantly with smaller plant sizes. In other words, many of these cost items are expected to be much the same for a 5 MWth
microreactor as they are for a 10 MWth one.
Table 8. Overview of Design A project development costs. Underlined cost cells represent the sum of all corresponding sub-items.
ID Numbers Component description Estimated Cost Normalized Cost
10s Project Development $1.4M $0.8k /kWe
11 Land and land rights $0.10M $0.1k /kWe
12 Site permits $0.30M $0.2k /kWe
13 Plant licensing $0.71M $0.4k /kWe
14,15,16 Plant permits and studies $0.33M $0.2k /kWe
18 Community outreach and education $0.0M $0.0k /kWe
Direct costs are the primary drivers of nuclear power plant costs and are usually given the most attention by evaluators. Corresponding estimates for Design A are provided in Table 9. As shown in that table, the normalized cost of over $30,000/kWe is very high, pointing to a lack of economic considerations in designing this concept. The total is primarily driven by reactor system costs (most notably the reactor coolant system and reactivity control system), followed by the plant structures (mainly the building costs). Various cost reduction strategies for these components will be investigated in Section 4.
Table 9. Overview of Design A direct costs. Underlined cost cells represent the sum of all corresponding sub-items.
ID Number Component Description Estimated Cost Normalized Cost
20s Direct costs $62.8M $34.7k /kWe
21 Plant structures $20.4M $11.2k /kWe
211 Yardwork $2.6M $1.4k /kWe
212 Reactor containment $0.4M $0.2k /kWe
213 Building and utilities $16.3M $9.0k /kWe
218T Reactor startup facility $1.0M $0.6k /kWe

23
22 Reactor system $38.0M $21.0k /kWe
221 Reactor components $17.2M $9.5k /kWe
221.12 Outer vessel structure $0.1M $0.1k /kWe
221.13 Inner vessel structure $0.3M $0.2k /kWe
221.21 Reactivity control system $9.5M $5.3k /kWe
221.22 Reflector $3.3M $1.8k /kWe
221.23 Shield $3.9M $2.2k /kWe
221.24 Moderator $0.0M $0.0k /kWe
222 Main heat transport $12.3M $6.8k /kWe
222.12 Reactor coolant system (heat pipes) $11.3M $6.3k /kWe
222.13 Heat exchangers $0.9M $0.5k /kWe
227 Instrumentation & control $8.5M $4.7k /kWe
23, 24, 25 Turbine and electric systems $4.5M $2.5k /kWe
A combined summary of indirect, owner, supplementary, and financing costs is provided in Table 10. Here, at almost $20,000/kWe, the largest contributor is the supplementary costs, primarily driven by the initial fuel load. Other major contributors include the decommissioning costs and the interest accrued during fabrication and construction.
Table 10. Overview of Design A indirect services, owner costs, supplementary costs, and financial costs. Underlined cost cells represent the sum of all corresponding sub-items.
ID Number Component Description Estimated Cost Normalized Cost
30s Indirect services $3.5M $1.9k /kWe
31, 35, 36, 37, 38 Field & factory indirect support $1.5M $0.8k/kWe
32 Factory & construction supervision $1.8M $1.0k /kWe
33, 34 Commissioning, startup, and demo testing $0.2M $0.1k /kWe
40s Capitalized owner's costs
41,42,43 Operating staff recruitment, training, etc. $1.9M $1.0k /kWe
50s Capitalized supplementary costs $34.6M $19.1k /kWe
51 Shipping and transportation
511 Reactor module shipping & transportation $1.5M $0.8k /kWe
512 Fuel shipping $0.2M $0.1k /kWe
53, 54 Taxes & insurance $1.5M $20/kWe
55 Initial fuel load $23.3M $12.9k /kWe
58 Decommissioning costs $8.2M $4.5k /kWe
60s Capitalized financial costs $13.6M $7.5k /kWe
61 Escalation (price inflation) $0.0M $0.0k /kWe
62 Fees $0.0M $0.0k /kWe
63 Interest $13.6M $7.5k /kWe

24
Lastly, the annualized costs are summarized in Table 11. This includes both O&M and refueling costs. Because the concept is designed to rely on its initial fuel loading for the duration of its lifetime, the refueling costs are all set to zero. Operating costs are subdivided into onsite technicians/operations, remote support staff, and security staff. The biggest annualized cost contributors are the onsite staff and the maintenance costs (both over $600k/year). Normalized values in terms of $/MWh are provided here.
Table 11. Overview of Design A annualized costs (including O&M and refueling costs). Underlined cost cells represent the sum of all corresponding sub-items.
ID Number Component Description Estimated Cost Normalized Cost
70s Annualized O&M costs $1.7M /kWe $112/MWh
71 O&M staff
711 Onsite technicians and operators $0.6M /kWe $42/MWh
712 Remote monitoring technicians $0.1M /kWe $9/MWh
713 Security staff $0.3M /kWe $19/MWh
714 Maintenance $0.6M /kWe $42/MWh
80s Annualized fuel costs $0/yr $0/MWh
81 Refueling operations $0 /avg yr $0/MWh
84 Additional nuclear fuel $0 /avg yr $0/MWh
4.5 Identifying Cost Drivers
This subsection gives a more detailed overview of the main cost drivers for Design A. This could provide a starting point for the economics-by-design approach by directing focus, in terms of design modification, to those areas most likely to have a strong impact. From an innovation and R&D standpoint, it would also help future reactor developers and supporting government entities understand where the best value can be obtained.
A summary of the high-level cost types is provided in Table 12. The final estimated LCOE is prohibitively expensive for the anticipated markets. Again, it should be emphasized that the main intent of Design A was not to optimize the economics aspect. The results are therefore unsurprising. The intent was mainly to develop a demonstration concept, and with an estimated direct capital and supplemental cost just under $100M, this is an approachable R&D project from a financial perspective relative to traditional nuclear reactors. This is an attractive value proposition for a government-sponsored proof-of-concept demonstration project.
Table 12. Overall summary of the primary cost categories and estimated LCOE for Design A.
ID Cost Category Estimated cost Levelized Cost
10 Project development $1.4M $25/MWh
20 Direct costs $62.8M $1,100/MWh
30 Indirect services $3.5M $62/MWh
40 Operating staff recruitment, training, etc. $1.9M $33/MWh
50 Capitalized supplementary costs, incl. initial fuel $34.6M $606/MWh
60 Capitalized financial costs $13.6M $238/MWh
70 Annualized O&M costs $1.7M/yr $112/MWh
80 Annualized fuel costs $0/yr $0/MWh
LCOE: $2,174/MWh
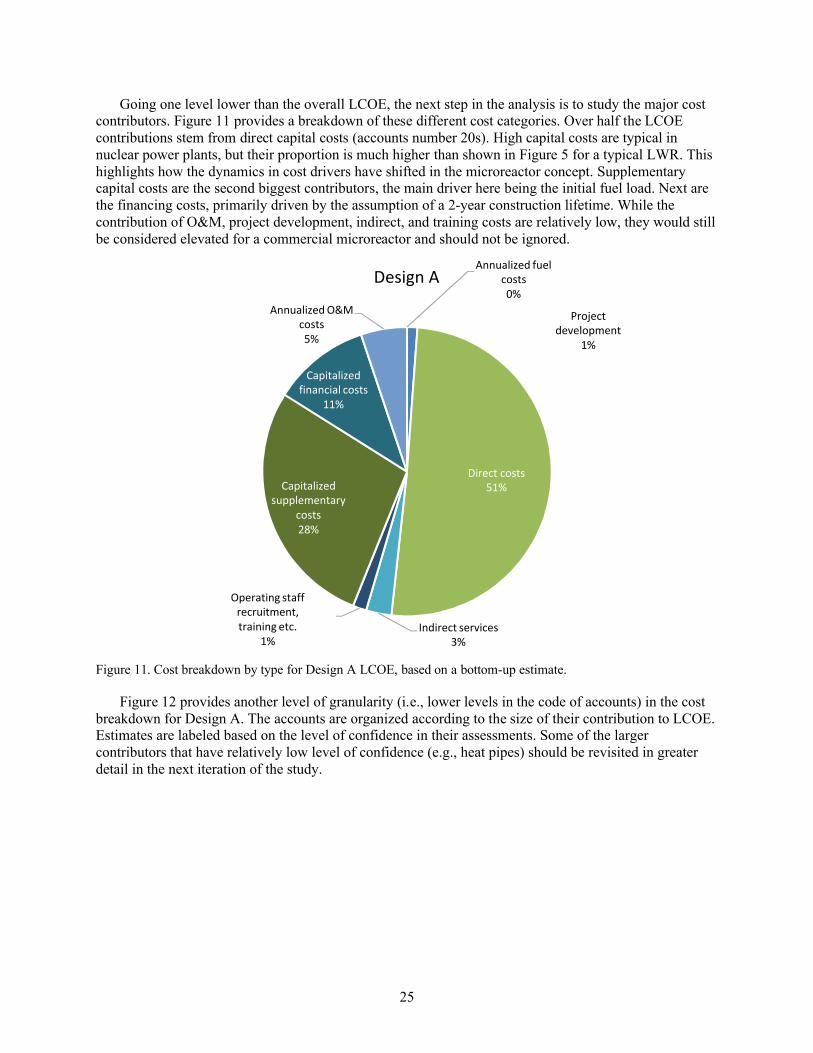
25
Going one level lower than the overall LCOE, the next step in the analysis is to study the major cost contributors. Figure 11 provides a breakdown of these different cost categories. Over half the LCOE contributions stem from direct capital costs (accounts number 20s). High capital costs are typical in nuclear power plants, but their proportion is much higher than shown in Figure 5 for a typical LWR. This highlights how the dynamics in cost drivers have shifted in the microreactor concept. Supplementary capital costs are the second biggest contributors, the main driver here being the initial fuel load. Next are the financing costs, primarily driven by the assumption of a 2-year construction lifetime. While the contribution of O&M, project development, indirect, and training costs are relatively low, they would still be considered elevated for a commercial microreactor and should not be ignored.
Figure 11. Cost breakdown by type for Design A LCOE, based on a bottom-up estimate.
Figure 12 provides another level of granularity (i.e., lower levels in the code of accounts) in the cost breakdown for Design A. The accounts are organized according to the size of their contribution to LCOE.Estimates are labeled based on the level of confidence in their assessments. Some of the larger contributors that have relatively low level of confidence (e.g., heat pipes) should be revisited in greater detail in the next iteration of the study.
Project development
1%
Direct costs51%
Indirect services3%
Operating staff recruitment, training etc.
1%
Capitalized supplementary
costs28%
Capitalized financial costs
11%
Annualized O&M costs5%
Annualized fuel costs0%
Design A

26
Figure 12. Design A LCOE contributions of the lower-level cost accounts. Each item is colored based on the level of confidence in the estimate: high (green), medium (yellow), or low (red).
The biggest cost contributors, in order, are the initial fuel load, the building, the interest accrued, the reactor coolant system, the reactor control system, I&C, and decommissioning. Together, these capture 74% of the total LCOE for the Design A concept. This cost pattern differs from the representative data for U.S. large nuclear plants in Table 2, especially because of the large initial fuel load cost for Design A (in contrast with the small contribution within supplemental costs for large nuclear plants, which incur most of their lifetime fuel costs through frequent refueling during operation). Costs for supervision and other indirect services are a smaller proportion of Design A’s costs than their proportion of a large nuclear plant’s costs based on Table 2. Interest is one of the largest cost components for both Design A and the representative large nuclear plant.
As a first step, modifications to Design A must propose solutions to its largest cost drivers. However, in light of the design’s exceedingly high overall LCOE, additional cost savings beyond the seven accounts identified above will likely be necessary.
$0 /MWh
$50 /MWh
$100 /MWh
$150 /MWh
$200 /MWh
$250 /MWh
$300 /MWh
$350 /MWh
$400 /MWh
$450 /MWh
Init
ial f
ue
l lo
ad
Bu
ildin
g an
d u
tilit
ies
Inte
rest
Rea
cto
r co
ola
nt
syst
em (
he
at p
ipes
)
Rea
ctiv
ity
con
tro
l sys
tem
Inst
rum
enta
tio
n &
co
ntr
ol
Dec
om
mis
sio
nin
g co
sts
Turb
ine
an
d e
lect
ric
syst
ems
Shie
ld
Ref
lect
or
Yard
wo
rk
On
-sit
e t
ech
nic
ian
s an
d o
per
ato
rs
Mai
nte
nan
ce
Op
erat
ing
staf
f re
cru
itm
en
t, t
rain
ing
etc
.
Fact
ory
& c
on
stru
ctio
n s
up
erv
isio
n
Fie
ld &
fac
tory
ind
ire
ct s
up
po
rt
Rea
cto
r m
od
ule
sh
ipp
ing
& t
ran
spo
rtat
ion
Secu
rity
sta
ff
Rea
cto
r st
artu
p f
acili
ty
He
at e
xch
ange
rs
Pla
nt
lice
nsi
ng
Rem
ote
mo
nit
ori
ng
tech
nic
ian
s
Rea
cto
r co
nta
inm
ent
Pla
nt
per
mit
s &
stu
die
s
Inn
er
vess
el s
tru
ctu
re
Site
pe
rmit
s
Fuel
sh
ipp
ing
Co
mm
issi
on
ing,
sta
rtu
p, a
nd
de
mo
tes
tin
g
Ou
ter
vess
el s
tru
ctu
re
Lan
d a
nd
lan
d r
igh
ts
Taxe
s &
insu
ran
ce
Co
mm
un
ity
ou
tre
ach
& e
du
cati
on
Mo
der
ato
r
Esca
lati
on
(p
rice
infl
atio
n)
Fees
Ref
uel
ing
op
erat
ion
s
Ad
dit
ion
al n
ucl
ear
fu
el

27
5. Application of Economics-by-Design to Design A
Design A was designed without reference to an intended market application. This section revisits the design, this time with a specific market application in mind. As prescribed by the economics-by-design approach, findings from this market assessment will inform design modifications and deployment strategies for Design A.
5.1 Assessing Market Needs
Recent studies have begun investigating the potential market opportunities for microreactors (Shropshire et al. 2021, Buongiorno et al. 2021, CED 2020). This subsection does not attempt to conduct a comprehensive market survey but rather to distill key needs from end-users into design attributes.
Value Drivers Categories
The decentralized (distributed) generation market is broad, so this assessment will focus primarily on applications limited to the U.S. and Canada. The main value drivers for microreactors—regardless of power generation technology—in these markets can be summarized as:
Reliability – uninterrupted access to electricity (especially important in extreme climates)
Serviceability – local, rapid repairs/maintenance
Minimal operator training – avoiding reliance on highly skilled operators/staff
Construction/installation time – shorter timelines drive cost and risk reductions
Noise level – proximity to end users engenders noise requirements
Minimal environmental impact – limited damage to nature (including pollution) during
construction and operation
Transportable – by truck, sea, or air (when road infrastructure is minimal)
Safety and security – protecting assets within the site perimeter
Fuel transportation frequency – minimize periodic shipments (e.g., fuel) due to transportation
limitations imposed by extreme weather conditions
Weather resistant – resiliency against challenging climate conditions throughout the year
Affordability – competitive cost of electricity production.
Segmenting the market
The decentralized generation market can be divided into three main segments: (1) civilian users in remote communities, (2) civilian remote mining operations, and (3) remote operating military bases(ROBs). More information on the characteristics of the different markets and their applicability for microreactors can be found in (Shropshire et al. 2021) and (CED 2020). Each of the different customercategories place a slightly different premium on the various attributes, as summarized in Table 13. The rationale behind each attribute is discussed briefly in Appendix B.
Table 13. Attribute value analysis for the three market segments.
Attributes Remote Communities
Remote Mines
Defense: ROB
Reliability High High HighServiceability Medium High MediumMinimal Operator Training Needs High High MediumConstruction/Installation Time Low Medium HighNoise Level High Medium LowMinimize Environmental Impact High Low Low

28
Transportability Medium Medium HighSafety & Security High High LowFuel Transportation Frequency High High HighWeather Resistant High High HighAffordability Medium High Low
The purpose of the assessment is to highlight important microreactor design attributes beyond cost considerations. Notably, the evaluation indicates that reliability, minimal operator training needs, noise level, environmental impact, safety and security, and fuel transportability in harsh weather are all veryimportant microreactor design attributes. Full implementation of the EBD approach would require a detailed evaluation of how design aspects can satisfy these characteristics. This is beyond the scope of the current report; an initial design iteration towards meeting these end goals is provided in Section 5.3.
An initial qualitative assessment would indicate that microreactors should theoretically be able to meet those design attributes that cater to each of these specific markets. However, it is important to note that each market will have particular aversion levels to introducing new technologies, especially when thenew technology is nuclear in nature. Similarly, deploying microreactors for mission-critical defense applications will also likely require additional scrutiny, which may be challenging for a product with limited historical operational data. Remote mines are also likely to be sensitive to adopting new, unproven technologies. As a result, remote communities may be ideal “first movers” in light of the value proposition that microreactors may offer through multiple attributes. Therefore, the present study will primarily focus on the needs of this specific market segment.
Assessing Segment Compatibility
The primary—and perhaps only—existing viable energy generation solution for remote communities is diesel generators. Other technologies such as solar photovoltaics and wind are also being considered as low-carbon alternatives. However, these are less likely to displace diesel gensets in terms of achieving the same reliability. Regarding some of the aforementioned desired attributes, Table 14 shows the inherent competitiveness of a nuclear microreactor such as Design A compared to other energy-producing technologies placed in remote communities. A more detailed justification behind the rankings is provided in Appendix B. Note that the intent of this qualitative assessment is to highlight some of the inherent characteristics that come with nuclear energy. While microreactor designs can improve on many of these metrics, nuclear-based technology starts at a disadvantage on multiple fronts.
Table 14. Comparative analysis of microreactor attributes against current and future competitors.
Attributes Attribute Importance
Microreactor vs. Diesel
Microreactor vs. Renewables
Reliability High Tied AdvantageServiceability Medium Disadvantage DisadvantageMinimal Operator Training Needs High Disadvantage DisadvantageConstruction/Installation Time Low Disadvantage DisadvantageNoise Level High Advantage DisadvantageMinimize Environmental Impact High Advantage TiedTransportability Medium Tied TiedSafety & Security High Disadvantage DisadvantageFuel Transportation Frequency High Advantage TiedWeather Resistant High Advantage AdvantageAffordability Medium Disadvantage Advantage

29
Comparative analysis indicates that, on many fronts, microreactors face inherent disadvantages compared to competing sources of electricity. The key inherent advantages of microreactors over diesel generators are minimal environmental impact (carbon emissions) and reduced transportation frequency. The primary inherent advantage over sources of renewable power generation is more reliable power production (in terms of low insolation in remote northern communities, and high risk of wind-turbine icing) using technology less sensitive to extreme weather.
As a result, the key objective for a microreactor design would be to minimize those areas in which microreactors are at an inherent disadvantage:
Serviceability: Nuclear reactors are complex machines that typically require highly specified skillsets and components for maintenance. To address this, microreactor concepts will likely require drastically simplified designs that minimize the probability of component failure. Such designs would also need to allow for maintenance to be performed locally whenever components do fail.
Operator Training: Microreactors are inherently technologically more complex than dieselgenerators or renewables, thus requiring higher levels of operator training. One way to alleviate this is by designing a reactor system that greatly reduces required operator functions. This can be achieved through the innovation of autonomous control technologies, as well as remote operations from a hub.
Construction & Installation: Nuclear power plants are often plagued by construction and installation issues. By virtue of their size, microreactors may represent a paradigm shift in this regard by enabling such activities to be transferred (wherever possible) from the site to the factory, thus minimizing construction and installation needs.
Transportability: In light of the limited accessibility of some of the remote communities considered, ease of transportation will be crucial for microreactors. Most designs are envisaged to be shipped in modules within standard ISO containers. The designs must therefore adhere to dimension and weight restrictions dictated by the transportation modes available to these markets.
Safety & Security: Nuclear reactors are potentially attractive targets for nefarious actors. Designs should ensure both the inherent safety of this technology and as well as a minimal environmental impact, even in beyond design-basis events. Dedicated security forces should be present at the site, otherwise some form of arrangement (e.g., co-location with existing protected facilities) with local protection will be required.
Affordability: As was discussed, new nuclear concepts often struggle to compete with alternative energy sources in regard to costs. It is therefore crucial to identify cost drivers for microreactors early on, then develop innovative solutions to ensure that a competitive electricity price can be reached.
Another area requiring attention is that of educating the end users and other key decision-makers in the remote community about this new technology. This is a particularly sensitive topic for a nuclear-based technology. Microreactors are also likely to start at a disadvantage here (but their perceptions might be improving with increased aversion to fossil-based energy production). Community education and outreach will likely play an important role in ensuring successful deployment of microreactor concepts.
The various key microreactor requirements for remote-community deployment are distilled into design-based requirements in Table 15. As noted, they include important considerations beyond the cost of a concept. To ensure successful deployment, these requirements should be incorporated early in the design of new concepts.

30
Table 15. Desired attributes and requirement implications for microreactors.
Desired Attributes Requirement Implications
Reliability Microreactors should have high operational reliability and minimize the time between planned maintenance.
Serviceability Microreactors should minimize the likelihood of component failure and ensure that all repairs can be conducted locally.
Minimal Operator Training Needs
Microreactors should be designed with a high degree of operational simplicity to impose minimal training on how to operate them.
Noise Level Microreactor systems and components should have a collective noise level ofless than 65 decibels (may differ based on customer type) for collocated end users
Minimize Environmental Impact
Microreactors should be designed to minimize the activation of non-reactor components, and should prevent release of radioactive constituents into the environment, as per nuclear regulatory requirements
Transportable Microreactor modules should fit within a 2.4 x 2.9 x 12.2 m shipping container (largest size) and weigh less than 25 MT.
Safety & Security Microreactors should be designed to have the highest nuclear safety pedigree (i.e., no consequence to staff, the public, or the environment), even in the most severe postulated unprotected accident scenario; the microreactor site shouldhave adequate security to protect it from theft, vandalism, and cyber intrusion; and microreactors may utilize a combination of autonomous security systems coupled with rapid response arrangements with local authorities.
Fuel Transportation Frequency
Microreactors inherently do not require continuous fueling, unlike diesel gensets.
Weather Resistant Microreactors should be weather tolerant to continue reliable operation in -40–40°C.
Affordability Microreactor LCOE should be below $400/MWh (NEI 2019)
End User Knowledge on Technology
Microreactor vendors should educate all relevant stakeholders, including end users, on the safety, operability, risks, and impacts of their technology
5.2 Sensitivity Assessment
With the market needs identified, the next step in the economics-by-design approach is to assess the sensitivity of different cost drivers to their design inputs. This would allow designers to quantify the effectiveness of “levers” at their disposal for reducing costs and reaching market objectives. A few example cost accounts are examined in this subsection. Primary emphasis is given to items that directly or indirectly impact the main cost drivers identified in Figure 12.
Initial Fuel Loading
The primary cost driver in Design A is the initial fuel load, itself primarily driven by total mass and enrichment. Sensitivity analyses were conducted on both these parameters. The resulting contribution to the overall LCOE of Design A (holding the microreactor’s output capacity constant for illustrative purposes) is plotted in Figure 13. A 50% reduction in fuel mass could decrease the LCOE by around $170/MWh. Similarly, reducing the average enrichment from 19.75 wt% down to commercial-grade 5wt%, would result in savings of up to $190/MWh. The required tradeoffs for reaching such reductionswill be investigated later in this subsection. For example, maintaining a critical mass with a lower mass of fuel may require a higher fuel enrichment overall. Fuel fabrication costs, while a relatively small driver given the oxide-based fuel of Design A, could become significant if novel fuels like TRISO are used.

31
Figure 13. Contribution of total uranium mass and enrichment on the overall LCOE of Design A. All other variables are held constant in this graph.
Reactor Building
The second largest cost driver in Design A was the building and utilities-connection cost. This account is expressed as a function of the surface area of the building and the distance to the utilities. Figure 14 plots the variation of the LCOE contribution as a function of both these variables. The analysis highlights the benefit of reducing/avoiding these costs if at all possible. This is expected to be all the more important when considering construction in permafrost regions etc. As a result, some designers have argued for the use of ISO containers as the entire structure housing the reactor. If deemed acceptable from a regulatory standpoint, this may be an attractive alternative option for avoiding building construction.
Figure 14. Contribution of the reactor building surface area and the underground distance to utilities on the overall LCOE of Design A. All other variables are held constant in this graph.
Heat Pipes
Another large cost driver in Design A was the reactor coolant system (i.e., heat pipes), most likely due to the estimation assumptions rather than the design input. The assumed unit price of $10,000/pipe, while realistic for a handful of isolated orders, is likely an overestimate for the large bulk orders needed for a microreactor. Similarly, Design A assumes a maximum heat pipe capacity of 4 kW/pipe, driving up
0
50
100
150
200
250
300
350
400
0 1 2 3 4 5
LCO
E C
on
trib
uti
on
($/M
Wh
)
U mass (MT)
0
50
100
150
200
250
300
350
400
0% 5% 10% 15% 20%
LCO
E C
on
trib
uti
on
($/M
Wh
)
235U enrichment
0
100
200
300
400
500
600
0 1000 2000 3000 4000
LCO
E C
on
trib
uti
on
($/M
Wh
)
Building Surface Area (m2)
0
100
200
300
400
500
600
0 1000 2000 3000 4000
LCO
E C
on
trib
uti
on
($/M
Wh
)
Distance to Utilities (m)

32
the number of overall heat pipes needed (over 1,000 in the concept). Advancements in heat pipe technology that maximize the heat removal capacity will likely prove instrumental in enhancing the competitiveness of these concepts. Figure 15 provides an overview of the impact of these parameters on the LCOE of Design A. As illustrated, a design with 500 heat pipes at a unit price of $5,000/pipe would result in a $100/MWh drop in LCOE relative to a concept with 1,000 heat pipes at $10,000/pipe (Design A assumptions).
Figure 15. Contribution of the number of heat pipes and their unit price on the overall LCOE of Design A. All other variables are held constant in this graph.
Unit prices for heat pipes will likely strongly depend on the associated manufacturing learning rates(LRs). Figure 16 provides an overview of how different prices can be attained as a function of the first-of-a-kind (FOAK) cost and the learning rate (LR) exponent. For example, the previously mentioned price of $5,000/pipe could be reached after ~500 units with a FOAK cost of $10,000/pipe, an LR of 5%, or after 70 units with an LR of 10%. The manufacturer will be presented with different opportunities to either reduce FOAK prices, improve learning efficiencies per units, or increase the heat pipe capacity in order toreduce the total number of heat pipes needed per reactor. This could include design standardization, robust supply chains, advanced (additive) manufacturing, novel materials etc. (EPRI 2018). It should be noted that the latter objective could slightly conflict with the benefits of an increased LR. A more comprehensive analysis of LRs is conducted in Section 5.4. Ultimately, the manufacturing approach and unit costs will be strongly dependent on the projected number of units. A higher number of projected units could translate to additional infrastructure investment, resulting in more efficient processes and lower costs. This could in term enable entry to additional markets, which would enable additional manufacturing efficiencies.
0
100
200
300
400
500
600
700
0 500 1000 1500 2000 2500
LCO
E C
on
trib
uti
on
($
/MW
h)
Number of Heat Pipes
$2,500/unit
$5,000/unit
$10,000/unit
$20,000/unit

33
Figure 16. Heat pipe unit costs as a function of first-of-a-kind cost and learning rates.
Instrumentation & Control (I&C)
The reactor I&C is another strong contributor to the CAPEX of Design A. It is currently expressed as a function of IO costs and any additional installed infrastructure. Figure 17 shows the impact of the number of IO sensors and their unit cost on the overall LCOE, while Figure 18 shows the contribution from the infrastructure cost. The sensors are usually bought off-the-shelf and are not expected to significantly benefit from LRs. Therefore, the primary objective should be to minimize their numbers via techniques such as sensor virtualization. On the other hand, infrastructure installment costs are likely to be cheaper as more microreactors are deployed. For example, assuming an LR of 15% could potentially cut these costs in half once around 30 units are deployed.
Figure 17. Contribution of the number of IO sensors and their unit price on the overall LCOE of Design A. All other variables are held constant in this graph.
0
2,000
4,000
6,000
8,000
10,000
12,000
0 200 400 600 800 1000 1200 1400
Un
it p
rice
($/
HP
)
Number of Heat Pipes
FOAK=$10,000, LR=5% FOAK=$10,000, LR=10%
FOAK=$10,000, LR=15% FOAK=$5,000, LR=5%
FOAK=$5,000, LR=10% FOAK=$5,000, LR=15%
0
20
40
60
80
100
120
140
0 500 1000 1500 2000 2500 3000
LCO
E C
on
trib
uti
on
($/M
Wh
)
No. of IO
$1,000/IO
$2,000/IO
$3,000/IO

34
Figure 18. Contribution of the I&C infrastructure on the overall LOCE of Design A as a function of the learning rate from each installation. All other variables are held constant in this graph.
The I&C costs are also expected to be strongly linked to staffing needs. While reducing staffing needs may be beneficial from an operating cost standpoint, it will likely lead to an increase in I&C capital investments. This would be driven by the added complexity to achieve a wider array of operations, cybersecurity requirements, robustness of components etc.
Neutron Reflector
The neutron reflector can help reduce leakage in compact microreactor cores, thus alleviating fissile inventory requirements from a criticality standpoint. Therefore, it might not always be beneficial to minimize the reliance on reflector material. Nevertheless, as seen in Figure 19, the cost of certain types of moderating material can be prohibitively expensive. While Be-based moderators are very effective neutron reflectors (especially due to their [n,2n] reaction), the fact that they are hazardous and difficult to machine drives up their manufacturing costs. It may be advisable to, when possible, opt for an alternative material such as Al2O3 or MgO.
Figure 19. Contribution of reflector material and size to the overall LOCE of Design A. All other variables are held constant in this graph.
0
10
20
30
40
50
60
70
80
90
100
0 20 40 60 80 100 120 140
LCO
E C
on
trib
uti
on
($/M
Wh
)
No. Microreactors Installed
I&C Infrastructure LR=10%
LR=15%
LR=30%
0
20
40
60
80
100
120
140
0 1 2 3 4 5 6 7 8 9 10
LCO
E C
on
trib
uti
on
($/M
Wh
)
Reflector Mass (MT)
BeO
SS316
Al2O3

35
Interest
Many of the primary cost drivers are unrelated to direct capital expenses. Interest rates accrued during construction are one such account. These are mainly driven by the weighted average cost of capital (WACC) and the construction duration, as shown in Figure 20. Schedule overruns have historically plagued the nuclear industry, but by shifting most of the developmental costs to the factory and away from the site, microreactors may afford slightly better control over the overall construction timeline. However, it is likely that some level of overrun will be expected for the first units fabricated. Thus, entities with low WACC rates will likely be the first movers in purchasing microreactors, as they will be less sensitive to timeline extensions. For example, an entity with a 7% WACC will see a 70% cost increase if the construction time doubles, while one with a 15% WACC will see an 84% increase in interest costs.
Figure 20. Contribution of reflector material and size to the overall LOCE of Design A. All other variables are held constant in this graph.
5.3 Modifying Design A to Fit the Market
Though the initial cost estimate for Design A exceeds the market prices in remote northern communities, as well as the cost targets in (NEI 2019), the initial cost estimate for Design A is lower than the value given in (Froese et al. 2020). It should again be noted that Design A was not optimized for cost reduction, but for concept feasibility and ease of manufacture. As a result, its normalized price per unit of energy is not representative of commercial microreactor concepts.
While it may be ideal from an economics standpoint to minimize the contributions of all design inputs, some tradeoffs between values must still be accounted for. As the next step in the economics-by-design approach, these design tradeoffs are evaluated (see Table 16). The recommendations will help guide the novel concept, Design A’, toward increased competitiveness. It should be emphasized that the main objective here is to explore the ‘design envelope’ as an initial illustration; detailed engineering analysis is still needed to confirm the tradeoff and feasibility of different configurations.
0
100
200
300
400
500
600
700
0 1 2 3 4 5 6
LCO
E C
on
trib
uti
on
($/M
Wh
)
Fabrication & Construction Period (Year)
15% WACC
10% WACC
7% WACC

36
Table 16. Sample microreactor design modification tradeoffs and considerations.
Design Parameter Modification Benefit Tradeoff Recommendation
Reactor size Maximizing power outputs improves economies of scale (lower price $/kWe).
Many remote communities have very low energy needs. Increasing size will drive other costs (e.g., shielding, fuel).
Slightly increase size which aligns with other microreactor concepts in the literature.
Neutron spectrum Shifting to a thermal spectrum will reduce fissile inventory needs
May decreases fuel burnup and increase refueling frequency
Thermal design with reduced fuel mass
Fissile inventory Minimizing will lead to cost savings
Decreasing fuel enrichment will likely lead to a higher mass requirement and core size
Reduce fuel mass in the design while keeping enrichment at 19.75 wt%
Plant lifetime Lower levelized costs Long lifetimes may drive capital expenses, especially due to material fatigue (e.g., more robust components, thicker shielding)
Opt for the standard lifecycle found in similar industrial equipment
Refueling interval Shorter refueling intervals reduces theup-front fissile inventory
More frequent refueling will increase costs, complicate operations in remote communities, increase security needs, and reduce fuel burnup/utilization
Refuel more than once throughout lifetime, but less frequently than for LWRs
Reflector Reducing mass and opting for non-Be material will reduce costs
Decreasing reflector mass and opting for less effective material may lead to a higher fissile inventory
Opt for “next best”reflector material such as MgO and Al2O3
Reactor building Using standard containers will reduce costs
More difficult to license, less system redundancy
House reactor in below-grade container
I&C Reducing hardware decreases cost
May complicate the licensing process and require more staff
Reduce only to lower bound of estimates
Operations staffing Fewer staff reduces annualized costs
Reducing staffing may lead to higher I&C and security costs. May also pose more risks during operations.
Follow norm/limits for operating similarly sizedgenerators
Leveraging these considerations, a range of proposed design modifications can lead to a more competitive version of Design A, referred to as Design A’. The cost reductions mainly relied on expert judgments and are only provided as an assessment of achievable targets. The primary purpose is to assess possible configurations within the design envelope that can meet identified market needs. At this stage, it is unclear if some of these targets will be achievable from a technological or regulatory standpoint.(Shropshire et al. 2021) and (Christensen et al. 2021) have recently begun assessing some of the licensing considerations but certain bounding considerations (e.g., allowable minimum number of staff) remain uncertain at this stage. Future efforts should consider detailed technical analysis of the proposed modifications to review their viability. Collaboration with an industry developer would be ideal (or with other DOE programs).
An overview of the different modifications, along with a short justification for each, is provided in Table 17. Indications are provided based on the design specification type (upstream vs. midstream vs. downstream) as explained in Section 3.4. The justification leverages the discussion in Table 16. It is important to note that the design choices made here only reflect one possible set of attributes that led to desirable market characteristics. Future work could conduct a more systematic screening of the design envelope to identify additional promising configurations. An integrated analysis software tool couldassist this process.

37
Table 17. Design modification and manufacturing/construction targets for the proposed Design A’.
Component Modification JustificationImpacted
codesNormalized cost ($/kWe)Original New
Power output Increased to 8 MWth Target larger remote communities (e.g., Iqaluit);assumes higher-capacity heat pipes
Upstream: all accounts
N/A N/A
Fuel/moderator Fuel mass reduced to 1.5 t with 1.4 t of moderator
Based on estimates for thermal spectrum reactor
Upstream: 55,84, & 512
$12,861*[fuel] / 0 [mod.]
$2,334* [fuel] / 152 [mod.]
Reactor building Replaced with below-grade container
Based on competing microreactor design
Downstream:213 $9,006 $7
I&C Lower number of IOsensors, and reduced hardware costs
Sensor virtualization and lower range of expert estimate
Midstream:227 $4,696 $1,912
Heat pipes Assumes $6,000/unit and 7 kW/pipe
Established supply chainwith innovations in heat removal efficiency
Upstream:222.12 $6,265 $2,387
Reflector Replace axial BeO with Al2O3
Assumes neutron losses compensated for by shift to thermal spectrum
Upstream:221.12 $1,823 $650
Reactivity control Av. ~$280k/drum Assumes gains from non-Be control drums
Upstream:221.21
$5,274 $1,385
Reactor lifetime Increased to 30 years, with refueling every 3
Based on industry-proposed microreactor designs
Upstream: all accounts N/A N/A
Construction time**
Decreased to 0.5 years
Based on installation of diesel generators in remote communities
Downstream: 63 & 31–38 $7,497* $754*
Downtime Decreased to 7days/year (97% capacity factor)
Reach high-reliability target, as per market needs
Downstream: all accounts N/A N/A
Facility area Decreased by 75% Assumes smaller emergency zone
Downstream: 11–16 & 211
$2,235 $1,065
Outreach Increased to $1,000/household
Market need to spend on education and outreach
Downstream: 18
$0 $842
Heat exchanger Increased volume by 50%
Proportional to power increase
Midstream:222.13
$520 $343
Commissioning Decrease time and staffing needs
Modular and optimized installation and testing
Downstream: 33–34
$124 $29
Training 1-year training and fewer staff
Designed to be operated by locals as per market needs
Downstream: 41–43
$1,031 $343
Decommissioning Decreased to 9% of CAPEX
Modular design, simple to decommission
Downstream: 58
$4,505 $1,045
Normalized cost ($/MWh)
Onsite staff Decreased to 2.5 FTE
Streamlined simplified operations
Downstream:711 & 41–43
$42 $12
Security Decreased to 2.5 FTE
Leverages rapid responsefrom local authorities
Downstream: 713
$19 $7
Refueling Increased to 3-year cycle, 15-day downtime, and 4 FTE
Thermal spectrum leads to steeper reactivity swing per cycle
Downstream: 81***
$0 $0.2
* Quoted cost corresponds to first account referenced.** In addition, any changes in manufacturing time would affect financing costs.*** Also indirectly impacts all accounts via capacity factor.

38
The results highlight how designers can prioritize different design objectives and R&D efforts to achieve more substantial cost reductions. For example, opting for simple containers/structures rather than large reactor buildings can drastically impact the overall costs, whereas reducing the facility area has a more modest impact. Three design characteristics contribute to comprehensive reductions: electric power output, capacity factor (driven by refueling and downtime), and plant lifetime. While increasing each contributes to a higher normalization denominator, the increased output and reliability likely comes at an added cost. This is one of many simplifications made to the analysis conducted here. The primary intent is to provide an indication of the main driver and what potential combination of targets affords the greatest benefit to designers. The methodology can be followed by microreactor developers in order to identify design combinations/strategies that can lead to the greatest reductions in their levelized costs.
Another drastic change proposed in Design A’ is to opt for a softer neutron spectrum. This greatly increases the 235U fission cross section and reduces leakage. As a result, a lower fuel inventory is needed to reach a viable critical configuration. The additional moderator cost is more than offset by the reduction in fuel cost. In addition, a deeper burn of the fuel will contribute to a reduction in the normalized fuel costs. As a result, Design A’ assumes a burnup of 6.3 GWd/MTU (versus 2.0 GWd/MTU in the original design). However, it should be emphasized that neutron transport simulations will be needed to identify realistic values for fuel, reflector, and lifecycle characteristics.
Overall, these various cost targets can translate into potential R&D priorities for public and privateentities. A few examples of economically beneficial technological advances that are relevant in the context of Design A are listed below:
High performance moderators: softening the spectrum can reduce the fuel inventory but may increase the core volume. Compact moderators that can withstand high temperature can greatly improve the economic viability of concepts.
Demonstration of functional containment: only crediting the reactor vessel(s) and concrete vault as barriers for radionuclide release can alleviate the costs of a reactor building.
High-capacity heat pipes: can enable increases in reactor output without negatively impacting the compactness of a concept. Both incremental improvements in current technologies or novel alternates can be beneficial here.
Reduced number of sensors and control: reducing the I&C infrastructure via new sensor developments or sensor virtualization, can help alleviate important cost drivers.
Low-cost neutron reflectors and shield material: while materials such as Be are ideal neutron reflectors, their high costs and toxicity can be limiting. Alternate material (including hybrid composites) could greatly benefit the economics of a concept.
Demonstration of rapid deployment and decommissioning: demonstrating the ability to quickly install and decommission a design will reduce financing costs
Simplified operations and control: reducing operating staff supervision and training requirements is attractive for different market attributes. R&D investments on simulators and human-machine interaction (HMI) will be crucial to achieving this goal.
There are many additional areas of R&D that can benefit the economics of microreactors beyond the ones listed here. Overall, the proposed design modifications of Table 17 contribute to significantreductions in the LCOE, as shown in Table 18. Already, a ~80% reduction has been recorded compared to Design A, even without accounting for LRs (the topic of the following section). This leads to an already competitive FOAK cost for a microreactor that can be viable in certain small niche markets, assuming the listed savings can be achieved.

39
Table 18. Overall summary of the primary cost categories and estimated LCOE for Design A’.
ID Cost Category Estimated cost Levelized Cost
10 Project development $3M $39/MWh20 Direct costs $34M $149/MWh30 Indirect services $2M $7/MWh40 Operating staff recruitment, training, etc. $1M $4/MWh50 Capitalized supplementary costs, incl. initial fuel $13M $55/MWh60 Capitalized financial costs $2M $24/MWh70 Annualized O&M costs $1M $39/MWh80 Annualized fuel costs $2M $83/MWh
LCOE: $363/MWh
As a result of the changes in Design A’, the relative contribution of different accounts shifts, as seen in Figure 21. While the direct costs are still the biggest contributors, their contribution dropped from 50 to 37%. In addition, with the reduced initial fuel inventory, supplementary costs essentially shifted to annualized costs, due to the more frequent refueling. This highlights how the dynamics have shifted in this modified design. The breakdown appears now closer to that of the reference LWR shown in Figure 5. A notable difference is the much smaller contribution of indirect costs to Design A’ primarily as a result of a larger proportion of factory-fabrication. Further design-based modifications will now need to investigate different areas for further cost reductions.
Figure 21. Changes in the cost breakdown structure for Design A’.
In examining the estimates of LCOE contributions ($/MWh) at a lower level in Figure 22, some of these dynamics become all the more apparent. At $83/MWh contribution, the additional fuel becomes the single largest contributor to the LCOE of Design A’ (versus the initial fuel in Design A at $407/MWh). The next biggest contributor is now the turbomachinery ($31/MWh for Design A’), followed by the heat pipes ($30/MWh), initial fuel load ($29/MWh), community outreach ($27/MWh), and the I&C ($24/MWh). All other accounts contribute less than 5%. While the normalized cost per account are lower
Project development
9%
Direct costs37%
Indirect services2%
Operating staff recruitment, training etc.1%
Capitalized supplementary
costs14%
Capitalized financial costs6%
Annualized O&M costs10%
Annualized fuel costs21%
Design A'

40
across the board in the Design A’, Figure 23 highlights how the cost drivers have shifted. The biggest cost drivers in Design A were the initial fuel load, the building, and the interest, now they are the additional fuel, the turbine system, and reactor coolant system in Design A’. Note that some previously significant costs (e.g., interest, building, decommissioning, and reactivity control) are now almost negligible. On the other hand, some accounts (e.g., turbine) primarily became larger contributors in Design A’ by virtue of all other cost drivers decreasing in importance. Community costs in particular were increased in Design A’ following the market assessments beyond costs. Moving forward, designers should focus on the characteristics of a microreactor concept similar to Design A’ when searching for additional areas to drive down costs. These high-cost components should be the primary focus of future R&D efforts, either in terms of improving the performance of certain technologies or developing lower-cost alternatives.
Figure 22. LCOE contributions of each account in Design A vs. Design A’.
Figure 23. Percentage breakdown of the cost drivers in Design A vs. Design A’.

41
Lastly, some thought should be given to the non-economic considerations highlighted in Section 5.1. Microreactor designers should strive to satisfy as many of these as possible. As previously highlighted, nuclear-based systems are at an inherent disadvantage to competing sources on multiple fronts, sominimizing these disadvantages will help ensure successful market adoption:
Serviceability: Design A’ would target fewer than 7 days per year in downtime. This would translate to highly reliable components and rapid turnaround in servicing equipment failures(i.e., easily replaceable components).
Operator Training: Design A’ would need to drastically simplify reactor operation to the point that only 2.5 FTE staff are needed throughout a given year. As a result, operator training is also expected to last for only 1 year.
Construction & Installation: Design A’ would need to be designed in a modular format that could be rapidly installed and deployed. The target construction time is less than 6 months.
Noise: The turbine in Design A’ should operate at a low decibel level to minimize noise pollution.
Transportability: The Design A’ modules would fit within standard ISO containers. Similarly, transportation casks for supplementary fuel must withstand road/marine/air conditions in remote communities.
Safety & Security: While permanent security staff are envisaged in Design A’, a rapid-response agreement will also be required with local authorities to protect the asset.
Minimal Environmental Impact: The modular installation of Design A’ will facilitate decommissioning of the concept. This will simplify the return to a “greenfield” site.
Fuel Transportation Frequency: the 3-year refueling interval for Design A’ is substantially lower than that for a diesel generator. Outages can be made to coincide with favorable weather/transportation conditions. Backup fuel stored onsite can reduce even further the frequency at which fuel must be transported to the site but may constitute a security risk and lead to higher operating costs.
Weather Resistant: Design A’ would be rated to operate under even the most limiting geographic conditions (e.g., the Arctic), ensuring that the concept can be deployable in nearly any environment.
End-User Knowledge: In Design A’, an increased budget is set aside for community outreach in order to decrease the risk of local resistance to the technology.
5.4 Leveraging Economies of Multiples
Mass production is another means by which concepts such as Design A’ can increase their competitiveness. Economies of multiple are reached when vendors are able to scale their production units to reap efficiencies from learning and streamlining. While most analyses include an integral learning rate for a given product, a more granular approach is proposed here. This ‘bottom-up’ evaluation of learning can assess how specific cost drivers may or may not change significantly across sequential units, including efficiencies in the supply chain, factory fabrication, on-site construction and operations.
In Table 19, the LRs for each cost item are ranked in terms of none/medium/high. Items such as the purchase of land permits have no appreciable learning associated with them. Capital-related expenses are assumed to benefit from “medium” learning. Following the recommendation in (NEI 2019), an LR of15% was assumed for these components, based on experiences with multi-unit nuclear power plant construction in Korea (EPRI 2009) and the U.S. Navy’s experience with nuclear submarines (Moody 2010). A more aggressive LR of 30% (high) was assumed for indirect cost drivers, because these

42
engineering and management activities are expected to be streamlined with repetition. These costs are primarily labor-driven and can be expected to be more easily streamlined/automated with repetition.
Table 19. Assumed learning rates for the different accounts of Design A’.
Code AccountLearning
Rate
10s Project development
11 Land and land rights None
12 Site permits None
13 Plant licensing None
14, 15, 16 Plant permits & studies Medium
18 Community outreach & education Medium
20s Direct costs
211 Yardwork Medium
212 Reactor containment Medium
213 Building and utilities Medium
218T Reactor startup facility Medium
221.12 Outer vessel structure Medium
221.13 Inner vessel structure Medium
221.21 Reactivity control system Medium
221.22 Reflector Medium
221.23 Shield Medium
221.24 Moderator Medium
222.12 Reactor coolant system (heat pipes) Medium
222.13 Heat exchangers Medium
23, 24, 25 Turbine and electric systems Medium
30s Indirect services
31, 35, 36, 37, 38 Field & factory indirect support High
32 Factory & construction supervision High
33, 34 Commissioning, startup, and demo testing High
40s Capitalized owner's costs
41,42,43 Operating staff recruitment, training, etc. High
50s Capitalized supplementary costs
511 Reactor module shipping & transportation Medium
512 Fuel shipping Medium
53, 54 Taxes & insurance None
55 Initial fuel load Medium
58 Decommissioning costs High
60s Capitalized financial costs
63 Interest Medium
70s Annualized O&M costs
711 Onsite technicians and operators None
712 Remote monitoring technicians High
713 Security staff None
714 Maintenance Medium
80s Annualized fuel costs
81 Refueling operations High
84 Additional nuclear fuel Medium
The LR equation shown below (Wright 1936, Mislick and Nussbaum 2015) was then used to compute the resulting price for a component once a given number N of units are deployed. The relation indicates that savings equating to the LR rate are reached for each doubling of the units produced. It should be

43
emphasized that these values are meant more as a theoretical exercise, and not necessarily as realistic values for industry concepts. For example, it is perhaps not valid that the LRs hold at 15% up to any number of units. Nevertheless, the estimates do show the economic potential for microreactors, as well asthe main areas to focus on in order to achieve the end goal.
NOAK = (FOAK) × (1 − LR)���� �
The resulting LR for Design A’ is plotted in Figure 24, along with the thresholds at which the LCOE is competitive across the range of observed values for a given market. It should be noted that evaluations from (Shropshire et al. 2021) indicate that low/high global estimates for microreactor demand by 2050could reach the range 20-120 GWe. This would constitute between 7,000 and 40,000 microreactors the size of Design A’; well beyond the range considered here. However, it is unlikely that the samemicroreactor concept with the same specification would capture this entire market. Different product lifecycles would be expected with new updated models brought forward as discussed in Section 5.6. The intent here is to showcase the initial deployment potential for the first generation of microreactor concepts.
Figure 24. Assumed learning rate for Design A’, showing the break-even point to be competitive across different markets.
As shown in Figure 24, the initial Design A’ microreactor will likely only be able to narrowly compete in the remote communities market. As more units are built and the price starts to drop, the concept becomes economically competitive in more markets. The defense market is likely another early area in which the microreactor is an attractive option. After 10 units, enough cost reductions are accrued to reach an LCOE below the range for this market. The concept clears the entire island and mining market threshold once around 60 units are built. While the reactor struggles to compete at the wholesale market (power generation level) for the Alaska Railbelt grid, it can be competitive across the retail rate once 80 or so units are built. This assumes that some customers (e.g., heavy industry) may be willing to house a local microreactor and avoid relying directly on the grid for electricity. Similarly for the U.S. grid, the concept is unlikely to ever compete with conventional generation at the wholesale rate, but some retail prices in the mainland U.S. are sufficiently elevated for Design A’ to become a viable grid alternative
$0 /MWh
$50 /MWh
$100 /MWh
$150 /MWh
$200 /MWh
$250 /MWh
$300 /MWh
$350 /MWh
$400 /MWh
0 20 40 60 80 100 120 140 160 180 200
LCO
E
Number of Units Deployed
U.S. grid generation
Remote communities
Remote defense
Island & Mining
U.S. grid electricity
Alaska railbelt generation
Alaska railbelt electricity

44
after as few as 25 units. The relative competitiveness at each learning level for the various markets is summarized in Table 20.
Table 20. Market price ranges in which Design A’ with learning rates can be competitive. Ranges are taken from (NEI 2019).
Learning after Units: 1 2 10 50 100 200Remote market [$300–$600]/ MWh
All range All range All range All range All range All range
Defense[$280–$320]/MWh
None Partial All range All range All range All range
Island and mining[$150–$350]/MWh
None Partial Partial All range All range All range
Alaska Railbelt electricity total [$140–$230]/MWh
None None Partial Partial All range All range
Alaska Railbelt generation[$60–$150]/MWh
None None None Partial Partial Partial
U.S. grid electricity total rate [$50–$170]/MWh
None None None Partial Partial Partial
U.S. grid generation[$30–$80]/MWh
None None None None None None
5.5 Microreactor Value Chain
Beyond the immediate microreactor deployment goals, developers should consider additional lifecycle strategies for successful development of a concept. These can be grouped into three main areas: (1) establishing a sustainable value chain, (2) defining the microreactor vendor’s role within that value chain, and (3) strategies for introducing FOAK technology to market.
It is crucial that a company create value not only for itself, but also for the essential partners needed to successfully deliver the value proposition to the market. It is therefore important to analyze the product lifecycle of a microreactor, starting from the design and development stage and extending to the final dismantling and the decommissioning of the site of operations. Dividing up the distinctive roles in the product lifecycle essentially leads to five key roles in the value chain, as shown in Figure 25.
Figure 25. Microreactor value chain constituents.
The designer is the first step of the product lifecycle, with the company and its investors having to utilize R&D funds to design, develop, and license a nuclear technology in hopes of a return on their investment. Smaller businesses or startup companies may want to collaborate with larger ones that possess manufacturing capabilities or establish a strategy to “sell” their technology for a return on their investment. For larger established design companies, microreactors may represent a new product line through which nuclear can enter new markets. Therefore, the value proposition hinges on a successful R&D mission to reach a finished product. Due to the high R&D costs of a new nuclear system and the

45
long road to any return on investment, government financial support is typically required at this stage. Hence, design companies both small and large seek out and compete for government fundingopportunities to complement their internal R&D or private investor funds. Two notable examples are the recent DOE Advanced Reactor Demonstration Program (ARDP)a and the Department of Defense (DOD)Pele Programb. Both initiatives aim to support microreactor developers with first of a kind demonstrations. Compared to larger systems, microreactors could represent an attractive opportunity for developers to recover their R&D investments, due to the shorter development period and reduced investment needed to deliver a product to market.
In this context, a manufacturer is referred to as the “integrator” of a microreactor, a role that encompasses building a complete product using a combination of in-house fabrication and assembly capabilities, while relying on key suppliers and vendors for supplying systems, structures, and components. Typically, larger companies have internal capabilities and infrastructure that may be underutilized. Microreactors would offer an opportunity for a sustainable revenue stream via the building of multiple units of the same machine. For companies seeking to establish a new capability for integration manufacturing of microreactors, the value proposition hinges on sales volume and profit per unit sold, which should account for factory investments in addition to direct input costs per unit. Like many manufacturing facilities, the manufacturer’s capability to reduce annual O&M costs would determinewhether subsequent entities enter the microreactor value chain. Alignment throughout the supply chain will prove crucial here. Microreactor designs often rely on unique technologies, notably nuclear fuel,high-performance heat pipes, nuclear-grade equipment etc. Government incentives to kickstart these supply chains will likely prove key. For instance, support has already been provided to restart TRISO-fuel fabrication facilities,c and fuel enrichment capabilityd, both of which will likely be crucial for microreactor deployment.
The utility/operator is a complex entity in the microreactor value chain, due to the role’s diverse nature based on geographic location, customer profile, etc. In many microreactor applications, the owner/operator could be a private utility company (e.g., local utilities for a remote community), a government entity (e.g., an ROB), or the end users themselves (e.g., a mine or other remote industrial process). For a private utility company, the business model can be similar to that of existing casesfeaturing assets such as diesel gensets: the company would finance the microreactor asset for the duration of its useful life, install and operate it to deliver heat and power to end users in exchange for payments per unit of power ($/kWh) in order to achieve the targeted return on investment. Many newcomer countries in the nuclear field are also experimenting with ‘Build Own Operate’ (BOO) models (IAEA 2017). Where the vendors secure the financing, builds the reactor, owns the electricity generated, and sells it to the ratepayer through a power purchase agreement (PPA). Some models even go further with vendors offering to handle disposition of spent fuel from the sit. As many microreactor vendors promote a ‘hub-and-spoke’ model, similar types of arrangements can be expected.
In the case of a government entity operating the microreactor, the cost of energy delivered must be lower than that for the incumbent energy generators, unless other incentives such as logistics ease, carbon emissions, reliability, etc., come into play. This could particularly be the case for the department of defense if microreactors are able to accomplish mission-critical objectives. The military will likely be willing to pay for a premium if microreactor technology offers flexibility not possible with other energy sources. On the other hand, an industrial operator will likely be greatly sensitive to the levelized cost of energy produced. Both the cost of energy and reliability will need to outperform other energy options in
a https://www.energy.gov/ne/advanced-reactor-demonstration-programb https://www.defense.gov/Newsroom/Releases/Release/Article/2545869/strategic-capabilities-office-selects-two-mobile-microreactor-concepts-to-proce/c https://www.energy.gov/ne/downloads/x-energy-tier-i-awardeed https://www.centrusenergy.com/news/centrus-finalizes-three-year-contract-to-demonstrate-haleu-production/

46
order for private entities to rely on microreactors as the means of conducting their primary business functions.
End users of power and heat can be categorized as being either passive or active. Passive users are mainly concerned with the cost and availability of energy. Most end users in large-scale grids do not need to play a proactive role in selecting their sources of energy; thus, the decision of electricity generator type hinges largely on the power supplier (i.e., a utility). For microreactors, active users are expected to be prevalent, with end-users—being closer to the point of generation—playing a vital role in selecting the generation asset. Microreactor end users would care about cost and availability, but also factors such as noise level, environmental impacts, safety, and security. Hence, microreactor developers will need to find creative ways to enhance their value proposition beyond simply offering a lower-cost alternative. This is both a challenge and an opportunity. It is challenging to ensure that the product design has features thatsatisfy end-user requirements, and to ensure alignment of those features throughout the operating life of the asset. It is also an opportunity, since the customer may be willing to pay a premium for other indirect incentives (e.g., providing district heat from the microreactor to operate a greenhouse for an arctic-basedcommunity, enabling them to grow food locally rather than relying on costly imports).
Regardless of the final disposition strategy (long-term storage vs. recycling, which depends onnational policy), it is imperative to have a viable plan for dismantling, decontaminating, and decommissioning microreactors while generating the least possible environmental impact. The small size and transportability of microreactors reduce the scale of onsite deactivation and decommissioning (D&D)activities, making it possible to remove the asset without taking it out of the packaging employed while inits operational state—packaging that can also act as the transportable canister and dry storage container. Avoiding repackaging of the nuclear and activated materials is a significant advantage over current LWRfuel handling and storage methods. However, the business case, source of funds, and role of the D&D entities must be clearly defined before the microreactor can be provided to the end user. The cost and contracting of the D&D effort could be handled in a fashion similar to that of current LWRs, for whichthe D&D cost is built into the LCOE.
A summary of the microreactor value chain is shown in Figure 26, in comparison with a typical value-chain analyses of a grid-connected market. The values in this figure are based on approximations that, in reality, are likely to vary. The price point will depend on the negotiations between each interacting entity. In essence, the value captured by the higher price of vendor-supplied systems, structures, and components is value lost by the microreactor manufacturer. The figure does offer insight into how the various entities can collaborate to share value among themselves and to settle on a global value proposition for microreactors. If any necessary entity in the chain cannot capture positive value, the entire value chain becomes unsustainable.
Figure 26. Overview of the microreactor value chain.

47
Currently, the only existing entities in the entire microreactor value chain are the “developers,” who will need to develop a strategy and determine which section of the value chain they want to capture. As was discussed, some developers may want to transition into product integrators and manufacture the vast majority of components in-house, while others may intend to leverage external manufacturing companies to produce products of their design. Going further, some developer companies may want to extend their scope and become vertically integrated. These companies would then not only own the design and manufacturers of the machine, but also the energy they produce, which they themselves would supply to the end customer. This would enable the firm to capture the vast majority of the value of all the entities of the product lifecycle. Though challenging to form and manage, this strategy may offer more control overthe overall microreactor value chain and provide opportunities for synergies and learning (if the same company would both build and operate their entire fleet of microreactors). However, this type of vertical integration is uncommon in similar complex systems such as automobiles and aircrafts. In those cases, the integrator relies heavily on multiple external vendors and suppliers rather than pursuing vertical integration. To deliver the product to the end users, these integrator companies share, among its collaborators and market channels, the risks as well as the value in focused expertise across their industry.
Historically, during the initial years of developing a new energy technology, government support and incentives were heavily relied upon to bring that technology to market. New technologies are initially costly, and manufacturers and suppliers are often at the beginning of their learning curve. Once they learn how to reduce costs, they become less dependent on federal support. This was the case for other technologies such as solar, wind, batteries, and fuel cells. As a new technology, microreactors may also have to initially rely on government incentives. First movers could then build from these incentives and begin learning how to reduce their costs as they transition to mass production. On the other hand, some small segments of the markets may be more willing to pay a premium early in the product cycle if they are particularly sensitive to the value proposition of microreactors. These are generally referred to as “early adopters” and will be discussed in the following section.
5.6 Microreactor Market Adoption Lifecycle
Like most new technologies, microreactors are likely to follow the market adoption lifecycle, which divides potential customers into five categories: innovators, early adopters, early majority, late majority,and laggards (Rogers 2003). The area under the curve in Figure 27 is a qualitative indicator of the relative size of the market. Initially, products compete for functionality, then evolve into reliability, price, and,lastly, convenience. Typically, as product markets move from left to right, the willingness to pay by these customer segments decreases, and the need for reliability increases while tolerance for imperfections decreases. Microreactors will likely follow a similar trend (EPRI 2018). This is crucial to understand,since it has direct implications on the product features and establishes a roadmap for product evolution.
Figure 27. Potential microreactor adoption cycle.

48
The first generation of microreactors is unlikely to have the lowest cost of electricity or the highest reliability. The resulting product may not represent a clear advantage over incumbent technologies. For market entry, the product would rely on a handful of customer segments (or “innovators”) comprised of technology enthusiasts who believe in the technology’s potential. This segment would be willing to pay a premium over the various alternatives in order to become pioneers in this new field. In the context of microreactors, this will likely take the form of private-public demonstrations heavily supported by the likes of DOE and DOD. The initial use case will likely be limited to governmental facilities. This group’s primary objective would be to demonstrate the functionality of the technology.
Early adopters rely on the proven functionality of the technology and are willing to pay a smallerpremium to adopt the technology for commercial purposes. This market segment would seek to leverage federal incentives and will expect a finished product with reliable operation. These users would havesome tolerance for downtime and would usually plan for backup gensets. ROBs or university campusesmay be viable candidates for this market segment, as well as emergency management or forward operating bases. Microreactor companies would primarily compete in this segment on the basis of cost and reliability but are still expected to rely on some level of public support.
Between the early adopters and early majority market segment are multiple barriers, both on the demand and the supply side. The value proposition must have clear advantages over incumbent technologies. Suppliers must also reduce costs and improve reliability to enable boarder market adoption. Most startups stumble across this barrier, deemed the “valley of death.” Once this barrier is overcome, mass market adoption is expected. Microreactor companies would compete in this segment for lower prices, not only with other energy generators but also other microreactor offerings. These types of customers are expected to primarily consist of remote microgrids where there is a clear benefit for the technological offering of microreactors over competing sources.
The more pragmatic market segment (late majority) would only adopt microreactors as the lowestcost option or if they provide a significantly strong value proposition compared to incumbent technologies. Both price and convenience are key competition metrics. These end users are expected to be semi-remote communities, island communities, and mining operations. While still remote, they face less hurdles than the early majority to gain access to power. Such customers are unlikely to adopt microreactors on a large scale until the technology has been well established and proven.
To successfully penetrate this market and beyond (laggards), microreactors are likely to evolve into a new phase, referred to at Idaho National Laboratory as “fission batteries.”e These systems would toutsuperior economics, near-autonomous operation, heavy standardization, and plug-and-play installation.This new generation of microreactor could then potentially reach markets such as the “grid-edge”. This is defined as points in close proximity to the grid, but not being fully linked to it. The next generation of microreactors can also be expected to cater industrial users interested in heat applications, or, potentially,hybrid renewable plants that require some carbon-free baseload generation to ensure reliability.
e https://nuc1.inl.gov/SitePages/Fission%20Battery%20Initiative.aspx

49
6. Conclusion
The successful deployment of advanced nuclear power plants in the U.S. primarily hinges on economics considerations. This report promotes an economics-by-design (EBD) approach that emphasizes market needs—not only costs but also particular performance attributes—early on in the design stage. The approach assesses the cost drivers of a system and modifies design characteristics to effectively meet the full set of product objectives. The approach is flexible and can be applied to any reactor type but is especially valuable to consider in the context of microreactors.
Microreactors are the subject of increasing interest in the nuclear community. Their size, simplicity, and transportability represent a new paradigm for the nuclear industry. With this comes substantially different economic dynamics and cost drivers. This report leverages the EBD approach to assess the competitiveness of this class of reactors. Starting with a bottom-up estimate of a use case from openliterature, the primary cost drivers were identified. For a heat-pipe-based concept, this was primarily the initial fuel load, reactor building, interest accrued during construction, coolant system, reactivity control, I&C, and decommissioning. In focusing on these cost contributors, theoretical modifications were proposed in order to increase the design’s market competitiveness. With assumed LRs, the new concept could be competitive in remote markets after just a few orders. Its market attractiveness further increases once approximately 50 units are deployed, enabling it to move along the adoption cycle to capture additional markets. Reducing costs further to compete at the grid-level would likely require a new lifecycle evolution in the technology.
It remains unclear at this stage if these assumptions and cost targets will necessarily materialize.Regulatory hurdles could impose restrictions not considered here that challenge the economical case formicroreactors. On the other hand, new reactor materials or manufacturing capabilities not previously used in the nuclear field (e.g., additive manufacturing, powder metallurgy, electron beam welding, diode laser cladding) could open new opportunities for cost reductions. Indeed, vendors are expected to find numerous different combinations of design and technology choices to reach market entry points. An important outcome of this report is to highlight potential pathways for microreactors to effectively compete in remote markets and help relevant stakeholders frame design and research priorities that are informed by economic considerations.
Future improvements to the analysis presented can be envisaged in a range of areas. Reducing estimate uncertainties will greatly increase confidence in the conclusions of the economic optimization. This is important for both the identified high cost drivers, as well as the low ones with significant uncertainty, to ensure they are indeed minimal. Equipment cost uncertainties can be reduced through R&D maturation of related technologies while other uncertainties may require additional systems analyses. Next steps could also involve automating the process with software that includes the costing equations and correlations linking variables together (e.g., impact of reactor power on shielding requirement, refueling, etc.). This would enable the systematic screening of different design inputs to identify optimal combinations. The EBD analysis could also be more deeply interfaced with market evaluation studies to link factory throughput considerations with speculated market sizes. The assessmentcan also be tied to ongoing efforts in the field of Integrated Energy Systems (IES) to assess market fit beyond simple LCOE estimates. Thermal storage and heat co-generation (e.g., for hydrogen production, chemical processing) will affect the competitiveness of nuclear reactors in terms of both plant costs and market revenues. Lastly, the EBD approach can be extended beyond microreactors and applied to the wide variety of advanced, non-LWR concepts that are being considered for near-term deployment.

50
References
Jorgensen, B., 2005. “Designing to Cost: One Approach to Design/Construction Integration”, Architectural Management: Designing Value, pp. 311-319, ISBN 89-78-77190-0.
Buongiorno, J., 2021. An Economic Evaluation of Micro-Reactors for the State of Washington. MIT Center for Advanced Nuclear Energy Systems. MIT-ANP-TR-190. January.
Center for Economic Development (CED), 2020. “Microreactors in Alaska: Use Case Analysis”, University of Alaska, https://static1.squarespace.com/static/59f6b60bcf81e02892fd0261/t/60189ac2d4aab87fb9b3211a/1612225233302/Use+Case+Analysis_Complete.pdf
Christensen, J., Moe, W., Poore, W., Belles, R., 2021. “Regulatory Research Planning for Microreactor Development”, INL/EXT-21-61847, Idaho National Laboratory. https://inldigitallibrary.inl.gov/sites/sti/sti/Sort_33144.pdf
Electric Power Research Institute (EPRI), 2009. “The Role of Nuclear Power.” Presentation by Chris Larsen. June 23. http://www.usaee.org/usaee2009/submissions/presentations/Larsen.pdf
EPRI, 2018. Energy Technologies Brief: Full-Power Microreactor Demonstration Expands Horizons for Nuclear Energy. https://www.epri.com/research/products/000000003002014871.
Froese, S., N.C. Kunz, M.V. Ramana, 2020. “Too small to be viable? The potential market for small modular reactors in mining and remote communities in Canada,” Energy Policy, vol. 144:111587. https://doi.org/10.1016/j.enpol.2020.111587.
Ganda, F., G. Maronati, T.K. Kim, T.A. Taiwo, R. Wigeland, 2017. “Report on Cost Estimation Algorithm for Advanced Nuclear Reactor Concepts,” NTRD-FCO-2017-000469, September 30.
Ganda, F., T.K. Kim, T.A. Taiwo, 2018. “Report on the Update of Fuel Cycle Cost Algorithms,” NTRD-FCO-2018-000439, Argonne National Laboratory, June 30. https://www.osti.gov/servlets/purl/1464633.
Ganda, F., E. Hoffman, T.A. Taiwo, T.K. Kim, J. Hansen, 2019. “Report on the ACCERT Cost Algorithms Tool,” ANL/NSE-19/10, June 28, 2019.
Generation IV International Forum. 2007. Cost Estimating Guidelines for Generation IV Nuclear Energy Systems. Rev. 4.2. https://www.osti.gov/servlets/purl/1525999.
Government of Canada, 2020. “Government of Canada invests in innovative small modular reactor technology.” October 15. https://www.canada.ca/en/innovation-science-economic-development/news/2020/10/government-of-canada-invests-in-innovative-small-modular-reactor-technology.html.
HolosGen 2021. “From turbo-jet engines to Holos generators”, accessed 02/09/2021, http://www.holosgen.com/technology/
IAEA 2017. “Financing Nuclear Power in Evolving Electricity Markets”. Department of Nuclear Energy, April. https://www.iaea.org/sites/default/files/18/07/financing-np-0418.pdf
Kim, T. K., et al. 2020. “Trial Application of TSRA and ACCERT Capabilities to Microreactor Designs”,ANL/NSE-20/20. July 31, 2020.

51
Lovering, J.R., A. Yip, T. Nordhaus, 2016. “Historical Construction Costs of Global Nuclear Power Reactors.” Energy Policy, vol. 91: pp. 371-382. https://doi.org/10.1016/j.enpol.2016.01.011.
LucidCatalyst, 2018. The ETI Nuclear Cost Drivers Project. Report for the UK Energy Technologies Institute. April. https://www.lucidcatalyst.com/eti-nuclear-cost-drivers-full
McClure, P.R., D.I. Poston, V.R. Dasari, R.S. Reid, 2015. “Design Megawatt Power Level Heat Pipe Reactors” LA-UR-15-28840, Los Alamos National Laboratory, November.https://doi.org/10.2172/1226133.
McDowell, B.K. D. Goodman, 2021. Advanced Nuclear Reactor Plant Parameter Envelope and Guidance. NRIC-21-ENG-0001; PNNL-30992. February 18. https://nric.inl.gov/wp-content/uploads/2021/02/NRIC-PPE-Guidance-Feb-2021-Final.pdf.
Mislick, G. and Nussbaum, D., 2015. Cost Estimation: Methods and Tools. New York: Wiley.
MIT, 2018. The Future of Nuclear Energy in a Carbon-Constrained World, MIT Future of Series, (2018).
Moody, J., 2010. “Affordable Small Modular Reactors – Effective Integration of Modular Design, Manufacturing and Construction Techniques,” presentation to Platt’s Small Modular Reactor Conference, June 28.
Natural Resources Canada, 2018. “SMR Roadmap.” https://smrroadmap.ca/.
Natural Resources Canada, 2021. “The Atlas of Canada - Remote Communities Energy Database.” https://atlas.gc.ca/rced-bdece/en/index.html, accessed June 11, 2021.
Nuclear Energy Institute (NEI), 2019. “Cost Competitiveness of Micro-Reactors for Remote Markets,”April. https://www.nei.org/resources/reports-briefs/cost-competitiveness-micro-reactors-remote-markets.
Nuvia, 2016. Market and Technical Assessment of Micro Nuclear Reactors. Report for the UK Department for Energy and Climate Change. March 31.
OECD, 2020. “Unlocking Reductions in the Construction Costs of Nuclear: A Practical Guide for Stakeholders”, Nuclear Technology Development and Economics, NEA No. 7530. https://www.oecd-nea.org/upload/docs/application/pdf/2020-07/7530-reducing-cost-nuclear-construction.pdf
Rao et al. 2016. “Special Purpose Reactors for Powering DOD Operations,” LA-UR-13-25412, Los Alamos National Laboratory. https://permalink.lanl.gov/object/tr?what=info:lanl-repo/lareport/LA-UR-13-25412.
Ramanujam, M. and G. Tacke, 2016. Monetizing Innovation: How Smart Companies Design the Product Around the Price. New York: Wiley.
Rogers, E., 2003. Diffusion of Innovations, 5th ed., New York: Simon and Schuster (originally published 1962).
Shropshire, D., Black, G., and Araujo, K, 2021. “Global Market Analysis of Microreactors”, INL/EXT-21-63214, Idaho National Laboratory.
Stauff, N., et al. 2019. “Neutronic Design and Analysis of the Holos-Quad Concept”, ANL/NSE-19/8, Argonne National Laboratory. https://doi.org/10.2172/1524786.
Sterbentz, J. et al. 2018. “Preliminary Assessment of Two Alternative Core Design Concepts for the Special Purpose Reactor.” INL/EXT-17-43212. Revision 1. May.https://www.osti.gov/servlets/purl/1413987.

52
Ulrich, K., Eppinger, S., and Yang, M.C, 2019. Product Design and Development, 7th ed., New York: McGraw-Hill.
U.S. Department of Energy (DOE). 1987. Phase 9 update report for the Energy Economic Data Base Program. July. https://www.osti.gov/biblio/7227212-phase-update-report-energy-economic-data-base-program-eedb-ix
U.S. Department of Energy (DOE). 1993. Cost estimate guidelines for advanced nuclear power technologies. May. https://www.osti.gov/biblio/10176857-cost-estimate-guidelines-advanced-nuclear-power-technologies.
World Nuclear News. 2019. “GEH signs agreement for small modular reactor in Poland.” 22 October. https://www.world-nuclear-news.org/Articles/GEH-signs-agreement-for-small-modular-reactor-in-P
Wright, P., 1936. “Factors Affecting the Costs of Airplanes,” J. of the Aeronautical Sciences, vol. 3. http://www.uvm.edu/pdodds/research/papers/others/1936/wright1936a.pdf.

53
Appendix AMicroreactor Cost Estimation

54
Appendix AMicroreactor Cost Estimation
This appendix describes the parameters underlying the cost estimations for the Design A and DesignA’ microreactor plants. The algorithms are based on prior related analyses (Kim et al. 2020, Hoffman et al. 2020), including updates and expansions made for this report. Note that all estimates are for 2017 USD values.
10s: Project Development
Cost estimates in this category are based on the available public information for large nuclear plants cited in (LucidCatalyst for ARPA-E 2018), and were scaled down using the land surface area for large nuclear plants (as a cost per m2) for calculating the Design A microreactor costs. The following subsections explain the calculations for each subcategory within the project development costs. Note that ACCERT does not include parameters related to project development costs in the 10s code of account.
11: Land
Land costs are based on the expected area needed for the Design A microreactor plant and the expected cost per unit of area. The cost per unit of area would depend significantly on the local availability and market conditions for land. For a microreactor deployment in sparsely populated areas of northern Canada or Alaska, land costs could be very low. For this analysis, however, a representative land cost for large nuclear plants was applied to Design A. (LucidCatalyst for ARPA-E 2018) indicates that land costs $8.5 million for a representative 1000 MWe nuclear plant occupying 670 acres (or approximately 2.7 million m2). This leads to the following formula for calculating the land cost:
Land = (Surface Area) × $3/m�
12: Site Permits
(LucidCatalyst for ARPA-E 2018) indicates a representative cost of $8.5M for site permits, based on the initial project development conducted by Ameren in Missouri in 2010. With the same plant area as specified above (670 acres [or 2.7 million m2]), this leads to the following formula for calculating site permit costs.
Site Permits = (Surface Area) × $9/m�
13: Plant Licensing
(LucidCatalyst for ARPA-E 2018) indicates a representative cost of $99M for a Combined Operating License for the potential Stewart plant site in Georgia, which was in the early stages of consideration back in 2016. This cost and surface area for the site led to the following formula for plant licensing costs:
Plant Licensing = (Surface Area) × $22/m�
14, 15, 16: Plant Permits and Studies
(LucidCatalyst for ARPA-E 2018) indicates a representative cost of $2.65M for Nuclear Regulatory Commission (NRC) fees covering plant permits for large nuclear plants, based on 100,000 person-hours of necessary NRC labor and a stated NRC rate of $265/hour. (LucidCatalyst for ARPA-E 2018) alsoindicates $20M for additional preparation of plant permits and studies, leading to the following formulafor plant permit and studies costs.
Plant Permits and Studies = (Surface Area) × $10/m�
18: Community Outreach

55
This activity is assumed to not occur for Design A, since the reactor design team may, in the early stages of concept development, avoid incorporating the need for community outreach in their planning and cost analysis. The cost analysis for Design A’, however, incorporates these costs, as discussed in the body of the report.
20s: Direct Costs
211: Yardwork
Yardwork is expected to include site clearing, grading, softscaping, hardscaping, etc. The original ACCERT algorithm assumed a fixed yardwork cost across all commercial power plant types (Ganda 2018). This assumption may be valid for different types of larger reactors (e.g., water-cooled vs. sodium-cooled) but is unrealistic for microreactors concepts in the MW range. It is therefore recommended to normalize the nominal yardwork value in units of surface area. An estimate of yardwork for a nuclear-related construction project was obtained from Idaho National Laboratory (INL) cost estimators (via personal communication). A reference value of $330,000/acre was recommended, translating to $82/m2.
Yardwork = (Surface Area) × $82/m�
212: Containment
The containment structure for a commercial pressurized-water reactor is a large, complex structure. The corresponding algorithms in ACCERT distinguish between the substructure, shell, dome, interior, and non-concrete costs of the components. This is not directly applicable to a microreactor for which a concrete “box” would envelop a standard ISO container. Rather than scaling the normalized volume values in ACCERT, they were revisited based on INL cost estimator experience (via personal communication). The estimator judgment mainly relied on the experience with INL Naval Reactors Facility. The cost is broken down into the excavation (expressed as a function of the hole volume [$916/m3]) and the concrete structure (expressed in volumes of concrete [$130/m3]).
Containment = (Sub. Vol. ) × $130.8/m� + (Cont. Vol. ) × $916.8/m�
213: Building
A typical commercial reactor consists of multiple building structures (turbine building, auxiliary building, etc.). Some microreactor concepts (e.g., Oklo) envisage a single building to house the reactor, power conversion, operating room, and security facility. Others (e.g., eVinci and HolosGen) intend to solely rely on the ISO containers in which the reactor modules are transported to house all required facilities. To estimate the potential cost of a building structure, a basis was again derived from INL cost estimator experience (via personal communication). The estimate is expressed as a function of the total surface area of the structure (including multiple floors) and the distance from utilities (including sewer, power, potable water, firewater, and communication lines). A normalized unit of $6,458/m2 for the building and $9,843/m for the utilities weas recommended based on estimates for a maintenance-type building (via personal communication). An alternate cost considered for Design A’ only accounted for the cost of ISO containers, estimated at $10,000/unit.
Building = (Surface Area) × $6,458/m� + (distance) × $9,843/m + (no. ISO container) × $10,000
218T: Backup and Startup Power
Large commercial reactors usually rely on large diesel generators for emergency and startup power. Since microreactors are primarily attempting to supplant those types of generators in remote markets, lithium batteries were deemed better suited for this function. Learning rates for batteries, expressed as a

56
function of $/capacity (in kWh), were obtained from (Tesla, Inc 2021). The correlation derived from Figure 28 relied on cost data, including module cost and installation costs.
Figure 28. Battery discounting rates: evolution of unit costs as a function of the number of units purchased.
�tartup = $638.88/kWh × (capacity)��.���
221.12 and 221.13: Vessel & Internals
Microreactors are assumed to feature both an internal and outer reactor vessel for redundancy. In the current ACCERT algorithm, this is equivalent to the reactor vessel and the internals. Cost estimates for both are expressed as a function of commodity volume and mass. The equipment cost (including material fabrication) is taken as $310,000/MT, while the installation cost is taken as $14,080/MT. The estimateswere verified against ASPEN/HYSYS models of a pressurized horizontal drum of the same material. A nuclear “multiplication factor” was added to all labor costs to account for the Nuclear Quality Assurance 1 (NQA-1) requirements for manufacturing [Kim 2020]. The end results were shown to agree reasonably well with the ACCERT estimates. As a result, the following ACCERT-based equation is used for the vessel estimates:
�essel����� = ($310,000/ton + $14,080/ton) × (mass)
221.21: Reactivity Control System
The ACCERT estimates for control rods are expressed as a function of the number of drives and the mass of the material (both neutron poison and structural). Microreactors typically rely on a combination of control drums and rods. The cost equations are assumed to directly translate from a control rod to a control drum. No estimate for B4C-based costs is provided in ACCERT, so silver-based estimates are used as an approximation instead. The resulting estimate was compared against INL quotes obtained for ATR drums (Kim 2020), and were found to agree reasonably well when accounting for the fact that ATR drums use beryllium as their structural material (as opposed to Al2O3 in Design A).
Control = ($550/kg + $400/kg) × (poison mass) + $610,000 × (No. of drives)
221.22: Reflector
A wide range of reflector materials can be considered for microreactors. In addition, both axial and radial reflectors may form part of the design. ACCERT does not have a basis for calculating reflector costs, but the mass-based approach used for calculating other components is assumed to be valid. Proxiesfor different material are summarized in Table 21.
y = 638.88x-0.117
R² = 0.9669
$480
$500
$520
$540
$560
$580
$600
$620
$640
0 2 4 6 8 10 12
Un
it c
ost
[$
/kW
h]
Number of batteries
Battery volume discounting

57
Reflector = $310,000/ton × ( mass�����) + $1,000,000/ton × (mass���) + $120,000/ton× (mass�����)
Table 21. Costs assumed for reflector and shield.
Material Unit Cost Justification
SS316 $310,000/MT ACCERT estimate
BeO $1,000,000/MT Internal INL Be quotes
Al2O3 $120,000/MT ACCERT estimate for C-steels
221.23: Shield
While ACCERT does not contain algorithms for a reflector shield, the cost driver is assumed to besimilar that of the neutron poison in the reactivity control system. Hence the price is expressed as a function of mass of material, with silver used as a proxy material for B4C.
Shield = ($550/kg + $400/kg) × (mass)
221.24: Moderator
ACCERT does not account for a reactor’s moderator costs (it is the same as the coolant in an LWR). The option of including a moderator was considered in the analysis and is therefore accounted for here. While the moderator is likely to be a hydride (e.g., ZrH or YH), cost estimates for these types of material were not readily available. Instead, the mass-weighted cost of SS-316 was used as a surrogate to estimate the cost of the moderating material.
Moderator = $310,000/ton × (mass)
222.12: Core Cooling (Heat Pipes)
Reactor coolant piping in ACCERT is estimated based on the mass of steel. This was not deemed to be directly translatable for heat pipes. Instead, INL quotes obtained for the MAGNET testbed were used as a starting point for the unit cost of an individual heat pipe (via personal communication). A percentage cost reduction variable is inserted to account for potential cost savings from a mass production standpoint. Note, however, that the quoted price does not account for mass orders, nor does it include the costs of nuclear-grade NQA-1 certification or the requiring of higher-performance heat pipes (the quote was for a 2kW/pipe capacity vs. ~4kW/pipe for Design A).
Heat Pipes = $10,000 × (1 − cost reduct. ) × (No. of heat pipes)
222.13: Heat Exchanger
ACCERT estimates prices for steam generators (which serve the same function as heat exchangers) as a function of their mass and installation costs. The equipment cost is expressed as a function of the mass of material (based on the material type), while the installation cost is taken to be per unit. The number of units could refer to multiple primary heat exchangers (HX) as well as secondary/emergency ones. The estimates were compared to an algorithm in the literature (Seider 1998) and found to agree within the same order of magnitude.
�� = [$120,000/ton × (mass) + $580,000] × (No. of units)
227: Instrumentation & Control
ACCERT assumes that instrumentation and control (I&C) costs do not substantially vary from one large reactor to the next; therefore, it recommends using a constant rate value across all reactor types.

58
Such an estimate is unlikely to be representative of microreactors. As a result, expert judgment was relied upon to obtain a basis for the I&C costs. The estimate was broken down based on the number of input/output (IO) sensors, hardware infrastructure, control system, electronic power control (EPC) costs. Ranges for each are provided in Table 22. The upper range of these values (to account for NQA-1 rigor,etc.) was used as a first estimate equation:
�&C = $2,000 × (No. of IO) + $500,000 + $3,000,000 + $3,000,000
Table 22. I&C subcomponent costs based on INL expert judgment.
I&C Subcomponent Cost RangeCost per IO [$500–2,000]/instrumentInfrastructure $500,000Control system [$2,000,000–3,000,000]Electronic Power Control [$1,000,000–3,000,000]
23, 24, 25: Turbine
ACCERT breaks down the cost of the turbine generator into numerous components, including the turbine itself, the heat rejection system, the switchyard, the electrical wiring, and relevant station service equipment. A microturbine unit for a microreactor is expected to be an integrated module that includes all these items. ACCERT expresses the cost of the turbine generator as a function of the thermal power of a system. The range of extrapolation does not consider the <10 MW scale of microreactors, and only accounts for Rankine cycles. Therefore, an alternate estimate was used, based on DOE-compiled vendor quotes for integrating Brayton-cycle microturbines in the kW-to-MW range (DOE 2016). A normalized cost of $2,500/kWe was used for the purposes of this analysis.
Turbine = $2,500/kW� × (Capacity)
31, 35, 36, 37, 38: Factory & Field Indirect Support
The indirect support costs in this analysis reflect the estimated number of professionals serving in management, supervision, inspection, and other such roles at the microreactor factory and deployment site. The annual costs for each position, which include an annual salary as well as benefits, payroll taxes, and other adders, derive from representative values in LucidCatalyst’s nuclear cost analysis for ARPA-E,cited above. The costs for each position range from less than $100,000 for lower roles to approximately $200,000 for the principal manager, as shown in Table 23. The annual cost per position is multiplied by the expected headcount for each position and by the expected fabrication and installation period for the microreactor.
Table 23. Factory & field indirect support.
Position Annual Cost per HeadPrincipal manager $216,000Assistant manager $151,000Environmental control $95,000Quality assurance $110,000Engineering $88,000

59
32: Factory & Construction Supervision
This code of account depends on the estimated cost per hour for supervision and the total estimated hours necessary. Based on the professional judgment of construction management services, an approximate representative cost of $300 per hour is used for this cost.
Supervision = $300/hour × (Necessary supervision hours)
33, 34: Commissioning, Startup, and Demonstration Testing
These codes of account depend on the costs per professional (as shown in Table 23), the headcount per position, and the estimated length of time for commissioning, startup, and demonstration testing.
55, 84: Fuel Loading
Estimates for the Advanced Fuel Cycle Cost Basis Report (DOE 2017) were used to calculate the cost of fuel for microreactors. The estimates are expressed as a function of mining, conversion, enrichment, and fabrication costs. Mining and conversion are expressed in terms of mass of natural uranium (NatU), enrichment as a function of separative work units (SWUs), and fabrication in terms of the mass of the final uranium compound. The cost basis report gives mean historical values higher than the current spot prices in the market (see Table 24). For a more current estimate, the spot prices were instead used in this analysis.
Fuel = ($29.01/kg + $22.50/kg) × (mass��� �) + $47.00 × SWU + $870.00/kg× (mass����)
Table 24. Comparison of fuel fabrication costs.
Fuel Cycle Step Cost Basis Report Spot Pricesa
Mining, kg-Nat. U $139.00 $29.01
Conversion, kg-Nat. U $13.00 $22.50
Enrichment, SWU $125.00 $47.00
Fabrication, kg-UO2 $870.00 $870.00a Obtained from uxc.com/p/tools/fuelcalculator.aspx accessed 07/2020
63: Interest
Interest expenditures reflect the return on capital to lenders and equity investors. This code of account depends on the overnight capital cost, weighted average cost of capitalf, and length of time between capital outlays and repayment (including both “return of capital” and “return on capital”). This analysis uses a representative weighted average cost of capital of 10%. If the fabrication and installation period is 2 years and the overnight capital costs are assumed to be spent evenly over this period, interest expenditures represent a 16% adder on overnight capital costs.
70s: Operations & Maintenance
This code of account reflects the annual cost per operating staff member, including salary as well as various adders (described above for factory and field indirect), as shown in Table 25. These annual costs per head are multiplied by the headcount. Annual maintenance parts are assumed to cost 1% of the overnight capital cost—a preliminary approximation that could be refined in future work to assess the specific periodic maintenance needs of microreactor concepts.
f Weighted average cost of capital is defined as the equity percentage of total capital times the required equity return, plus the
debt percentage of total capital times the interest rate (i.e., return on debt for lenders) times the tax deduction factor based on corporate income tax rate: WACC = (E% x rE) + (D% x rD) x (1 – tC).

60
Table 25. Factory & field indirect support.
Position Annual Cost per HeadPlant manager $216,000Quality assurance $110,000Shift operators $93,000Remote operators $140,000Security $70,000
Appendix References
Hoffman, E., Abou-Jaoude, A., and Foss, A. 2020. “Improvements of ACCERT Algorithm – FY22”, ANL/NSE-20/28. August 31, 2020.
Kim, T. K., et al. 2020. “Trial Application of TSRA and ACCERT Capabilities to Microreactor Designs”, ANL/NSE-20/20. July 31, 2020.
LucidCatalyst for ARPA-E. 2018. Nuclear cost spreadsheet model. https://arpa-e-foa.energy.gov/FileContent.aspx?FileID=7a8f9bd7-4ccc-4a54-bef4-e7f702c18906
Seider, W.D. Seader, J.D. Lewin,D.R. Product and Process Design Principles. John Wiley and Sons, Inc. 1998
Tesla. 2021. Powerwall. Retrieved from https://www.tesla.com/powerwall.
U.S. Department of Energy (DOE). 2016. “Combined Heat and Power Technology Fact Sheet Series.” https://www.energy.gov/sites/prod/files/2016/09/f33/CHP-Steam%20Turbine.pdf
U.S. Department of Energy (DOE). 2017. “Advanced Fuel Cycle Cost Basis—2017 Edition,” NTRD-FCO-2017-000265, INL/EXT-17-43826, Fuel Cycle Options Campaign, U.S. Department of Energy.

61
Appendix BMicroreactor Design Attributes

62
Appendix BMicroreactor Design Attributes
Attribute Value in Each Market Segment
A more detailed justification of the attribute rankings shown in Table 13 is provided here. The qualitative assessment is intended to provide initial guidelines on anticipated priorities in the considered markets. Readers are referred to (Shropshire et al. 2021) and (CED 2020) for a more thorough review of potential customer needs. For simplicity, the analysis was subdivided between three markets: (1) remote communities (including island, arctic, and grid-edge communities), (2) remote mining operations, and (3) defense applications (including emergency response).
Reliability – this is expected to be of high importance to all three of the potential market segments. Unexpected interruption of services can be critical to a community living in severe weather conditions, to the primary business of a mining company, as well as to a military base. Microreactors will need to demonstrate a high degree of reliability in order to effectively compete in these types of markets.
Serviceability – the ability to service a microreactor was deemed of medium importance to remote communities and defense applications. In both instances, it is expected that the local workforce/personnel would be trained and able to maintain the reactor. The issue is more challenging in remote mining operations that may operate further from a population point and may find it more challenging to readily supply maintenance parts.
Minimal operator training – remote communities and mines will have limited capacity to train personnel to operate a microreactor. As such it is critical for these communities that the concepts are designed to operate as simply as possible. This is a lower priority for defense applicationswhere dedicated staff are commonly trained to operate complex machinery.
Construction/installation time – while advantageous for a microreactor to be deployed quickly in a remote community, it is not deemed to be a necessity. Most communities likely already have an operating power source and can plan well in advance to account for the lead time of deployment of a microreactor. Remote mining operations, however, will likely expect a quick turnaround on the entire project and will need their source of energy delivered on a short timeline. Lastly, quick installation times are likely to be a priority for defense applications to achieve strategic objectives and enable agile responses to threats.
Noise level – a desirable attribute for any market in theory, reduction of noise is expected to be a priority for remote communities due to the proximity to population centers. The requirement is less severe for mining operation and even less so for military installations, where only official personnel would be affected by the noise levels and mitigation steps can be more easily taken to alleviate them.
Minimal environmental impact – remote communities are likely to be most sensitive to any environmental impact caused by the construction and operation of a microreactor. Defense and mining applications are likely to be less sensitive to these considerations, but would still value the zero-carbon emissions from microreactors.
Transportable – this will be crucial for defense applications with priorities rapidly evolving and limited access points to areas of need. It is ranked of medium importance to the other two markets as infrastructure is expected to be minimal and ease of transportation will likely be key.
Safety and security – military bases will already have armed personnel present and are therefore expected to place relatively low priority on this attribute. Remote communities and mines on the

63
other hand will need to have a dedicated security plan established while operating a nuclear reactor and are therefore to strongly consider this attribute.
Fuel transportation frequency – in all three market cases, access to the site will likely be challenging. Therefore, minimizing the frequency of refueling intervals is expected to be critical.
Weather resistant – in light of the operating conditions in all three market cases, resistance to extreme weather conditions will be an important attribute for microreactors.
Affordability – military entities are likely to be able to pay a premium on the price of a microreactor if it achieves specific mission needs. Remote communities on the other hand, tend to be heavily subsidized by government entities but will still place some importance on the cost of the design. Mining operations being operated for profit are expected to place a high importance on the affordability of the concept overall.
Inherent Attribute Competitiveness
More detail on the comparative analysis between microreactors and competing sources of energy presented in Table 14, is provided here. Two competing sources of energy are considered: (1) diesel generators, and (2) variable renewable sources (wind and solar photovoltaic). The qualitative assessment is intended to focus on inherent features rather than characteristics that microreactors may or may not reach. As such, the assessment primarily focuses on the fundamental strengths/weaknesses of nuclear energy as a whole. The purpose is to guide microreactor designers on areas where their concepts have inherent weaknesses and should be addressed in a commercial product.
Reliability – as turbomachinery-based systems, both microreactors and diesel generators are expected to have similar levels of inherent reliability in general (provided the nuclear reactor operates reliably as designed). Renewables on the other hand are at a disadvantage due to the variable nature of their energy generation. This is especially expected to be limiting in some remote conditions and high latitudes with little sunlight during the winter.
Serviceability – nuclear based technologies is expected to be inherently more complex and difficult to maintain compared to the other two competing sources. For instance, Nuclear Quality Assurance (NQA) standard requirements are expected to add notable complications in remote locations.
Minimal operator training – here as well, a nuclear-based technology is likely to start at an inherent disadvantage. Training to operate a microreactor is expected to be more rigorous than for other energy sources to adhere to regulations. This may be alleviated by relying more on remote operations but is still expected to be a challenge.
Construction/installation time – nuclear plant projects typically have long lead times for construction and installation, especially for large and complex plants. Commissioning itself is significantly more involved than in other sources of power. Microreactors may be able to greatly shorten installation time relative to large plants but are still expected to start at a disadvantage compared to other sources of power.
Noise level – reciprocating engines operate at higher decibel levels than turbines, hence microreactors are expected to operate at an advantage over diesel generators in this space. Wind turbine rotors produce noise when rotating, but solar photovoltaics produce no noise. Thus, renewable sources, when considered collectively, are assigned an advantage over microreactors and diesel generators on this basis.
Minimal environmental impact – microreactors will produce less pollution (notably CO2) than diesel generators. They might require a slightly larger footprint, but this is expected to be more than compensated by the reduced emissions. Renewables also emit no emissions but are expected to require an even larger surface area per unit of power than microreactors. On the other hand, the waste stream generated from this source is less contentious than from a nuclear source. As a result, the inherent environmental impact of both sources is deemed to be tied.

64
Transportable – all three sources face challenges that can be overcome when it comes to transportability. By virtue of their definition, microreactors are expected to be transportable, but this remains to be demonstrated, however.
Safety and security – microreactors are at an inherent disadvantage with this attribute by virtue of their fuel: both from a proliferation standpoint and from a radiological one. Both considerations will lead to additional safety and security requirements for this type of technology.
Fuel transportation frequency – microreactors can be designed to operate with prolonged refueling intervals, placing them at an advantage against diesel generators. Renewables are at an inherent advantage since they do not require refueling whatsoever (albeit at a cost to reliability).
Weather resistant – all nuclear technologies must be designed to withstand severe accident scenarios including weather-induced ones. This evidently could lead to cost increases and over-design of microreactor concepts but gives them an inherent advantage over other technologies that are typically deployed in less constrained environments.
Affordability – diesel generators are the de-facto most affordable source of energy for remote community seeing as they are the primary option selected thus far. With the cost reductions through design modifications and cumulative unit deployments discussed in this report, microreactors could have economic advantages over renewable sources when applications require reliable or dispatchable energy.