An Economic Valuation of a Geothermal Production Tax … · An Economic Valuation of a Geothermal...
24
An Economic Valuation of a Geothermal Production Tax Credit April 2002 • NREL/TP-620-31969 Brandon Owens National Renewable Energy Laboratory 1617 Cole Boulevard Golden, Colorado 80401-3393 NREL is a U.S. Department of Energy Laboratory Operated by Midwest Research Institute • Battelle • Bechtel Contract No. DE-AC36-99-GO10337
Transcript of An Economic Valuation of a Geothermal Production Tax … · An Economic Valuation of a Geothermal...
An Economic Valuationof a Geothermal ProductionTax Credit
April 2002 • NREL/TP-620-31969
Brandon Owens
National Renewable Energy Laboratory1617 Cole BoulevardGolden, Colorado 80401-3393NREL is a U.S. Department of Energy LaboratoryOperated by Midwest Research Institute •••• Battelle •••• Bechtel
Contract No. DE-AC36-99-GO10337

National Renewable Energy Laboratory1617 Cole BoulevardGolden, Colorado 80401-3393NREL is a U.S. Department of Energy LaboratoryOperated by Midwest Research Institute •••• Battelle •••• Bechtel
Contract No. DE-AC36-99-GO10337
April 2002 • NREL/TP-620-31969
An Economic Valuationof a Geothermal ProductionTax Credit
Brandon OwensPrepared under Task No. GT11.1108

NOTICE
This report was prepared as an account of work sponsored by an agency of the United Statesgovernment. Neither the United States government nor any agency thereof, nor any of their employees,makes any warranty, express or implied, or assumes any legal liability or responsibility for the accuracy,completeness, or usefulness of any information, apparatus, product, or process disclosed, or representsthat its use would not infringe privately owned rights. Reference herein to any specific commercialproduct, process, or service by trade name, trademark, manufacturer, or otherwise does not necessarilyconstitute or imply its endorsement, recommendation, or favoring by the United States government or anyagency thereof. The views and opinions of authors expressed herein do not necessarily state or reflectthose of the United States government or any agency thereof.
Available electronically at http://www.osti.gov/bridge
Available for a processing fee to U.S. Department of Energyand its contractors, in paper, from:
U.S. Department of EnergyOffice of Scientific and Technical InformationP.O. Box 62Oak Ridge, TN 37831-0062phone: 865.576.8401fax: 865.576.5728email: [email protected]
Available for sale to the public, in paper, from:U.S. Department of CommerceNational Technical Information Service5285 Port Royal RoadSpringfield, VA 22161phone: 800.553.6847fax: 703.605.6900email: [email protected] ordering: http://www.ntis.gov/ordering.htm
Printed on paper containing at least 50% wastepaper, including 20% postconsumer waste

i
Table of Contents
Executive Summary........................................................................................................... iii
1.0 Introduction..............................................................................................................1
2.0 Economic Valuation.................................................................................................2
2.1 Levelized Cost of Electricity........................................................................2
2.2 Financial Arrangements ...............................................................................2
2.3 Technology Characteristics..........................................................................4
2.4 Tax Policy Cases..........................................................................................4
3.0 Results
3.1 Project Finance.............................................................................................5
3.1.1 Binary Cycle ....................................................................................5
3.1.2 Flashed-Steam..................................................................................7
3.2 Corporate Finance........................................................................................8
3.2.1 Binary Cycle ....................................................................................8
3.2.2 Flashed-Steam..................................................................................9
4.0 Cost to the U.S. Treasury.......................................................................................10
Appendix A: Legislative Background ...............................................................................11
Appendix B: PTC ÷ (1-τ) Mathematical Derivation..........................................................13
Appendix C: Derivation of τ ..............................................................................................14
Appendix D: Maximum Annualized PTC Value...............................................................15
References..........................................................................................................................16

ii
Acknowledgments
This report was funded by the Assistant Secretary for Energy Efficiency and Renewable Energy, Office ofPower Technologies of the U.S. Department of Energy. The support of Dan Entingh, Dominic Falcone,Kathy George, Walter Short, and Peter Goldman is kindly acknowledged and very much appreciated. Anyomissions or inaccuracies are the sole responsibility of the author.

iii
Executive Summary
The United States (U.S.) geothermal industry has a 45-year history. Early developments were centered on ageothermal resource in northern California known as The Geysers. Today, most of the geothermal powercurrently produced in the U.S. is generated in California and Nevada. The majority of geothermal capacitycame on line during the 1980s when stable market conditions created by the Public Utility RegulatoryPolicies Act (PURPA) in 1978 and tax incentives worked together to create a wave of geothermaldevelopment that lasted until the early 1990s. However, by the mid-1990s, the market for new geothermalpower plants began to disappear because the high power prices paid under many PURPA contractsswitched to a lower price based on an avoided cost calculation that reflected the low fossil fuel-prices of theearly 1990s. State-level policies in California and Nevada also played a role in the reduction in demand forgeothermal power. In particular, as part of an ongoing restructuring effort, utilities in California andNevada began selling off electric generation capacity and did not have interest in bringing new capacityonline.1
Today, market and non-market forces appear to be aligning once again to create an environment in whichgeothermal energy has the potential to play an important role in meeting the nation's energy needs.Electricity supply shortages in California have greatly increased demand for reliable power sources such asgeothermal energy; record levels of natural gas demand, coupled with infrastructure constraints, haveresulted in volatile natural gas prices; and new concerns over environmental quality have led some states toenact renewable portfolio standards as part of their restructuring efforts. In this context, in 2001, multiplebills were introduced in the U.S. Congress that were intended to encourage geothermal energydevelopment.
One potentially attractive incentive for the geothermal industry is the Production Tax Credit (PTC). Thecurrent PTC, which was enacted as part of the Energy Policy Act of 1992 (EPAct) (P.L. 102-486), providesan inflation-adjusted 1.5 cent per kilowatt-hour (kWh) federal tax credit for electricity produced from windand closed-loop biomass resources. Proposed expansions would make the credit available to geothermaland solar energy projects. This report focuses on the project-level financial impacts of the proposed PTCexpansion to geothermal power plants.
The key findings of this report are:
• For the two financing cases examined in this report, the PTC has the potential to be an effectiveincentive for helping geothermal power projects to become more economically competitive withfossil fuel plants.
• In the Project Finance case, where 10-year non-recourse debt is used, for binary cycle projects, a 10-year1.8 cent/kWh inflation-adjusted PTC has the potential to reduce the real levelized cost-of-electricity(LCOE) by 25% from 5.7 to 4.3 cents/kWh.2 For flashed-steam projects, a PTC has the potential toreduce the real LCOE by 30% from 4.6 to 3.2 cents/kWh.
• In the Corporate Finance case, where 10-year corporate debt is used, for binary cycle projects, a 10-year1.8 cent/kWh inflation-adjusted PTC has the potential to reduce the real LCOE by 44% from 5.0 to 2.8cents/kWh. For flashed-steam projects, a PTC has the potential to reduce the real LCOE by 44% from4.1 to 2.3 cents/kWh.
• Tax appetite limitations and the Alternative Minimum Tax (AMT) can reduce the overalleffectiveness of tax incentives such as the PTC, independent of the type of debt used in projectfinancing. The effectiveness of the credit will be improved if the PTC legislation contains specificprovisions that enable developers to configure around tax appetite limitations, and if the AMTlevel is reduced for geothermal developers who receive the credit.
1 See Appendix A for legislative background on the geothermal industry.2 All values expressed in 2001 U.S. dollars unless otherwise noted.

iv
• Debt-service coverage requirements can limit the impact of tax credits when non-recourse debtfunds are involved in project financing. Increasing the level of equity in a project is the mostcommon solution. However, this approach has the drawback of further constraining the equity-strapped geothermal industry. If the PTC were transferable to lending institutions, or if it wereapplicable as prepayment on any loans, then debt-service requirements would not limit theeffectiveness of the credit. If these provisions were included in any new PTC legislation, then theability of the credit to make geothermal projects more economically competitive would beincreased.
• A number of factors determine the magnitude of the real levelized cost-of-electricity (LCOE)reduction due to the PTC. First, since the PTC is available for only 10 years, the face value of thecredit must be annualized over the life of the project's power purchase agreement (PPA). Second,because the PTC is a tax credit, the annualized value must be multiplied by 1 ÷ (1-τ), where τ isthe developer's marginal income tax rate. Finally, project-specific financial constraints must beconsidered explicitly, because these factors can limit the ability of the PTC to reduce theelectricity price.

1
1.0 Introduction
The Energy Policy Act of 1992 (EPAct) (P.L. 102-486) created a 10-year, inflation-adjusted 1.5 cent perkilowatt-hour (kWh) production tax credit (PTC) for electricity produced from wind and closed-loopbiomass resources. The Section 45 PTC provides project owners with a credit against taxes for the first 10years of plant operation. In late 1999, after a brief lapse, the PTC was retroactively extended throughDecember 2001. In 2001, several bills were introduced in the U.S. Senate and House of Representativeswhich, if passed into law, would set the value of the credit to 1.8 cents/kWh and expand it to include solar,incremental hydropower, and geothermal electric sources. By providing targeted tax incentives, the U.S.government hopes to increase the supply of energy from socially beneficial energy resources.
The purpose of this report is to examine the project-level financial impacts of the proposed 10-year 1.8cent/kWh PTC on geothermal power plants. Within this report, the PTC is compared to the existing Section48 10% Investment Tax Credit (ITC). The numerical results presented in this report were developed usingGeothermal Cost-of-Eelectricity (GEOCOE), a cost of electricity model developed by the NationalRenewable Energy Laboratory (NREL). GEOCOE simulates a detailed 30-year nominal dollar cash flowfor geothermal power projects including project earnings, cash flows, and debt payment to calculate aproject's 15-year levelized cost-of-electricity (LCOE), 15-year after-tax nominal Internal Rate of Return(IRR), and annual Debt-Service-Coverage-Ratios (DSCR).
2
2.0 Economic Valuation
2.1 Levelized Cost of Electricity
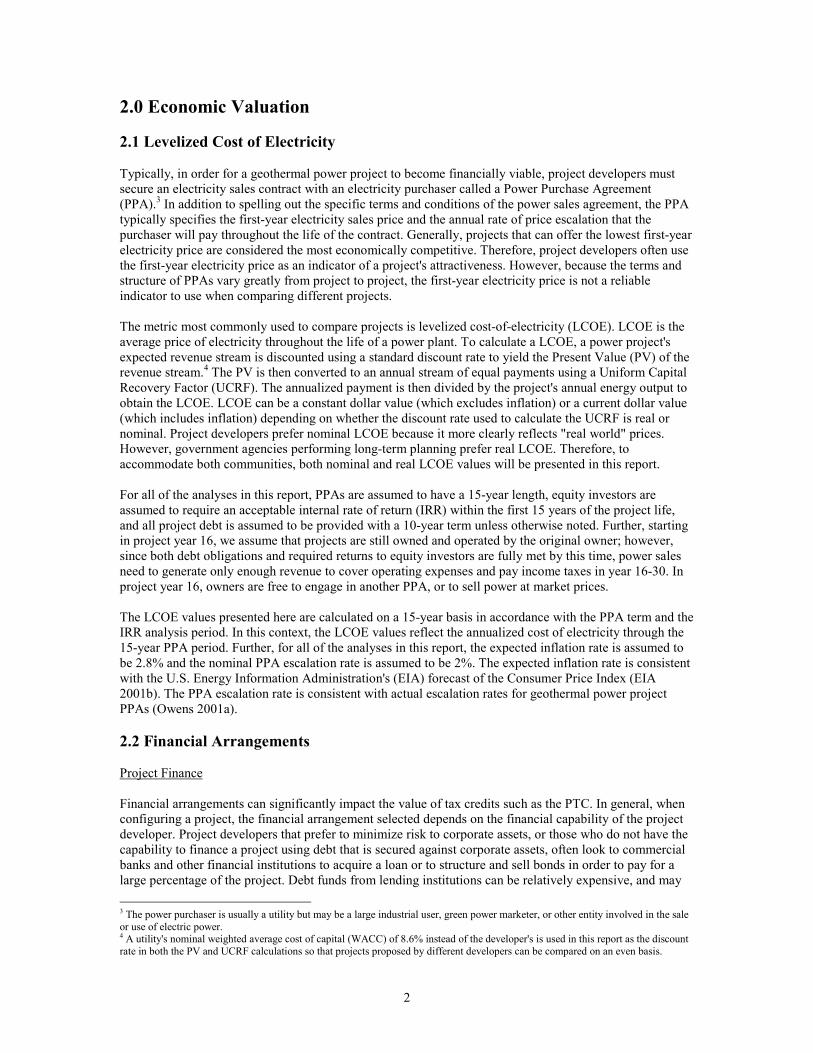
Typically, in order for a geothermal power project to become financially viable, project developers mustsecure an electricity sales contract with an electricity purchaser called a Power Purchase Agreement(PPA).3 In addition to spelling out the specific terms and conditions of the power sales agreement, the PPAtypically specifies the first-year electricity sales price and the annual rate of price escalation that thepurchaser will pay throughout the life of the contract. Generally, projects that can offer the lowest first-yearelectricity price are considered the most economically competitive. Therefore, project developers often usethe first-year electricity price as an indicator of a project's attractiveness. However, because the terms andstructure of PPAs vary greatly from project to project, the first-year electricity price is not a reliableindicator to use when comparing different projects.
The metric most commonly used to compare projects is levelized cost-of-electricity (LCOE). LCOE is theaverage price of electricity throughout the life of a power plant. To calculate a LCOE, a power project'sexpected revenue stream is discounted using a standard discount rate to yield the Present Value (PV) of therevenue stream.4 The PV is then converted to an annual stream of equal payments using a Uniform CapitalRecovery Factor (UCRF). The annualized payment is then divided by the project's annual energy output toobtain the LCOE. LCOE can be a constant dollar value (which excludes inflation) or a current dollar value(which includes inflation) depending on whether the discount rate used to calculate the UCRF is real ornominal. Project developers prefer nominal LCOE because it more clearly reflects "real world" prices.However, government agencies performing long-term planning prefer real LCOE. Therefore, toaccommodate both communities, both nominal and real LCOE values will be presented in this report.
For all of the analyses in this report, PPAs are assumed to have a 15-year length, equity investors areassumed to require an acceptable internal rate of return (IRR) within the first 15 years of the project life,and all project debt is assumed to be provided with a 10-year term unless otherwise noted. Further, startingin project year 16, we assume that projects are still owned and operated by the original owner; however,since both debt obligations and required returns to equity investors are fully met by this time, power salesneed to generate only enough revenue to cover operating expenses and pay income taxes in year 16-30. Inproject year 16, owners are free to engage in another PPA, or to sell power at market prices.
The LCOE values presented here are calculated on a 15-year basis in accordance with the PPA term and theIRR analysis period. In this context, the LCOE values reflect the annualized cost of electricity through the15-year PPA period. Further, for all of the analyses in this report, the expected inflation rate is assumed tobe 2.8% and the nominal PPA escalation rate is assumed to be 2%. The expected inflation rate is consistentwith the U.S. Energy Information Administration's (EIA) forecast of the Consumer Price Index (EIA2001b). The PPA escalation rate is consistent with actual escalation rates for geothermal power projectPPAs (Owens 2001a).
2.2 Financial Arrangements
Project Finance
Financial arrangements can significantly impact the value of tax credits such as the PTC. In general, whenconfiguring a project, the financial arrangement selected depends on the financial capability of the projectdeveloper. Project developers that prefer to minimize risk to corporate assets, or those who do not have thecapability to finance a project using debt that is secured against corporate assets, often look to commercialbanks and other financial institutions to acquire a loan or to structure and sell bonds in order to pay for alarge percentage of the project. Debt funds from lending institutions can be relatively expensive, and may 3 The power purchaser is usually a utility but may be a large industrial user, green power marketer, or other entity involved in the saleor use of electric power.4 A utility's nominal weighted average cost of capital (WACC) of 8.6% instead of the developer's is used in this report as the discountrate in both the PV and UCRF calculations so that projects proposed by different developers can be compared on an even basis.
3
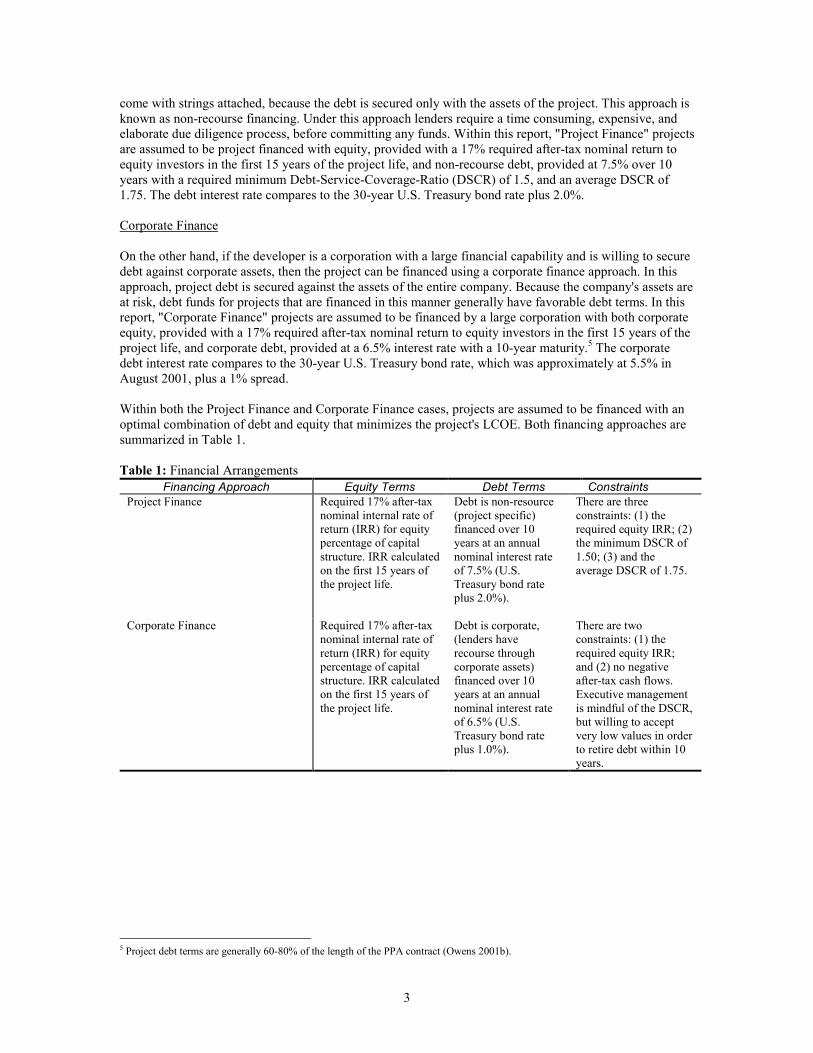
come with strings attached, because the debt is secured only with the assets of the project. This approach isknown as non-recourse financing. Under this approach lenders require a time consuming, expensive, andelaborate due diligence process, before committing any funds. Within this report, "Project Finance" projectsare assumed to be project financed with equity, provided with a 17% required after-tax nominal return toequity investors in the first 15 years of the project life, and non-recourse debt, provided at 7.5% over 10years with a required minimum Debt-Service-Coverage-Ratio (DSCR) of 1.5, and an average DSCR of1.75. The debt interest rate compares to the 30-year U.S. Treasury bond rate plus 2.0%.
Corporate Finance
On the other hand, if the developer is a corporation with a large financial capability and is willing to securedebt against corporate assets, then the project can be financed using a corporate finance approach. In thisapproach, project debt is secured against the assets of the entire company. Because the company's assets areat risk, debt funds for projects that are financed in this manner generally have favorable debt terms. In thisreport, "Corporate Finance" projects are assumed to be financed by a large corporation with both corporateequity, provided with a 17% required after-tax nominal return to equity investors in the first 15 years of theproject life, and corporate debt, provided at a 6.5% interest rate with a 10-year maturity.5 The corporatedebt interest rate compares to the 30-year U.S. Treasury bond rate, which was approximately at 5.5% inAugust 2001, plus a 1% spread.
Within both the Project Finance and Corporate Finance cases, projects are assumed to be financed with anoptimal combination of debt and equity that minimizes the project's LCOE. Both financing approaches aresummarized in Table 1.
Table 1: Financial ArrangementsFinancing Approach Equity Terms Debt Terms Constraints
Project Finance Required 17% after-taxnominal internal rate ofreturn (IRR) for equitypercentage of capitalstructure. IRR calculatedon the first 15 years ofthe project life.
Debt is non-resource(project specific)financed over 10years at an annualnominal interest rateof 7.5% (U.S.Treasury bond rateplus 2.0%).
There are threeconstraints: (1) therequired equity IRR; (2)the minimum DSCR of1.50; (3) and theaverage DSCR of 1.75.
Corporate Finance Required 17% after-taxnominal internal rate ofreturn (IRR) for equitypercentage of capitalstructure. IRR calculatedon the first 15 years ofthe project life.
Debt is corporate,(lenders haverecourse throughcorporate assets)financed over 10years at an annualnominal interest rateof 6.5% (U.S.Treasury bond rateplus 1.0%).
There are twoconstraints: (1) therequired equity IRR;and (2) no negativeafter-tax cash flows.Executive managementis mindful of the DSCR,but willing to acceptvery low values in orderto retire debt within 10years.
5 Project debt terms are generally 60-80% of the length of the PPA contract (Owens 2001b).

4
2.3 Technology Characteristics
Binary cycle and flashed-steam geothermal power plants will be examined in this report. The cost andperformance estimates used for these technologies were taken from the Electric Power Research Institute’s(EPRI) Renewable Energy Technology Characterizations (EPRI-DOE 1997), the jointly prepared book byEPRI and the U.S. Department of Energy (DOE). However, the average annual capacity factor and theannual O&M expense characteristics of these technologies were modified in response to more recent data(Owens 2001a). The technology characteristics used with GEOCOE are presented in Table 2.
Table 2: Geothermal Technology CharacteristicsTechnology Characteristics Binary Cycle Flashed-SteamPlant Size (MW) 50 50Total Capital Cost (1997 $/kW)Capital Cost Depreciable Percentage
$2,11282%
$1,44466%
Average Annual Capacity Factor 92% 92%Annual Power Production (kWh) 402,960,000 402.960.000Annual O&M Expense (2001 cents/kWh) 1.75 cent/kWh 2.00 cents/kWhRoyalty Fee (% of Revenue) 2.5% 3.5%Plant Life 30 30
2.4 Tax Policy Cases
In order to evaluate the financial impact of a geothermal PTC, and to compare the PTC to the existing 10%ITC, three tax policy cases will be examined for each technology. These are: the "Base Case" with neitherthe ITC nor the PTC, the "ITC Case" which represents the current situation with a 10% ITC, and the "PTCCase" in which a 10-year 1.8 cent/kWh PTC is enacted in lieu of the existing 10% ITC. The tax policycases examined in this report are presented in Table 3.
Table 3: Tax Policy CasesTax Policy Case ITC PTC Other Tax Benefits
Base Case No No Yes. Five-yearaccelerateddepreciation, 15%percentage depletionallowance, first yearexpense for intangibleexploration and wellcosts, and amortizabledebt and equity relatedfees.
ITC Case: Represents the currentpolicy environment.
10% of depreciablecapital costs includingconstruction loaninterest.
No Yes. Same as BaseCase.
PTC Case No 10-year 1.8 cent/kWhescalating withinflation.
Yes. Same as BaseCase.
5
3.0 Results
The results presented in this report are based on simplifications of real-world conditions. As such, all of thenumeric values shown here should be treated as indicators of overall trends, not as statement of fact. Theactual cost of electricity from geothermal power plants may be higher or lower depending on resourceconditions, transmission costs, and many other project-specific conditions.
In addition, it is important to note that the values presented in both the Corporate Finance and ProjectFinance cases assume that developers are able to absorb all of a project's tax benefits. However, in practice,many geothermal developers have limited tax appetites and are frequently subject to the AlternativeMinimum Tax (AMT) (Owens 2001a). Although tax appetite limitations were not explicitly modeled in thisanalysis, it is clear that effectiveness of the PTC can be improved if the PTC legislation enables developersto configure around tax appetite limitations, and if the AMT level is reduced for geothermal developerswho receive the credit. 6
3.1 Project Finance
3.1.1 Binary Cycle
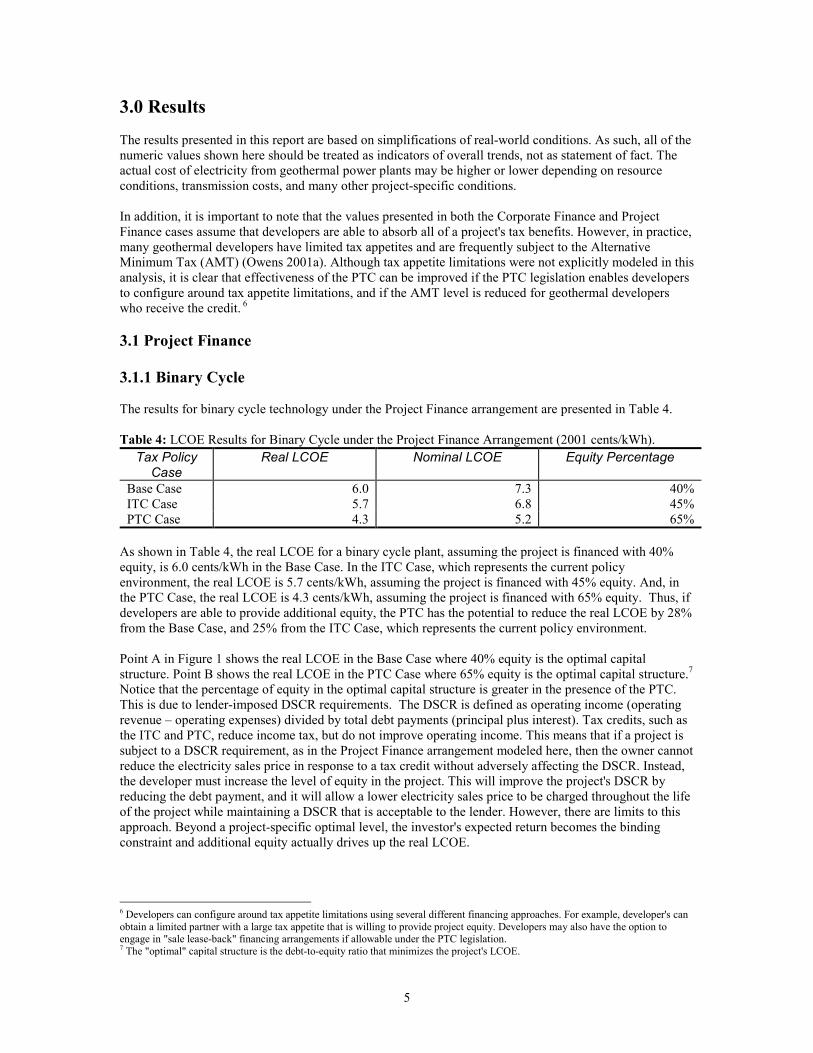
The results for binary cycle technology under the Project Finance arrangement are presented in Table 4.
Table 4: LCOE Results for Binary Cycle under the Project Finance Arrangement (2001 cents/kWh).Tax Policy
CaseReal LCOE Nominal LCOE Equity Percentage
Base Case 6.0 7.3 40%ITC Case 5.7 6.8 45%PTC Case 4.3 5.2 65%
As shown in Table 4, the real LCOE for a binary cycle plant, assuming the project is financed with 40%equity, is 6.0 cents/kWh in the Base Case. In the ITC Case, which represents the current policyenvironment, the real LCOE is 5.7 cents/kWh, assuming the project is financed with 45% equity. And, inthe PTC Case, the real LCOE is 4.3 cents/kWh, assuming the project is financed with 65% equity. Thus, ifdevelopers are able to provide additional equity, the PTC has the potential to reduce the real LCOE by 28%from the Base Case, and 25% from the ITC Case, which represents the current policy environment.
Point A in Figure 1 shows the real LCOE in the Base Case where 40% equity is the optimal capitalstructure. Point B shows the real LCOE in the PTC Case where 65% equity is the optimal capital structure.7Notice that the percentage of equity in the optimal capital structure is greater in the presence of the PTC.This is due to lender-imposed DSCR requirements. The DSCR is defined as operating income (operatingrevenue – operating expenses) divided by total debt payments (principal plus interest). Tax credits, such asthe ITC and PTC, reduce income tax, but do not improve operating income. This means that if a project issubject to a DSCR requirement, as in the Project Finance arrangement modeled here, then the owner cannotreduce the electricity sales price in response to a tax credit without adversely affecting the DSCR. Instead,the developer must increase the level of equity in the project. This will improve the project's DSCR byreducing the debt payment, and it will allow a lower electricity sales price to be charged throughout the lifeof the project while maintaining a DSCR that is acceptable to the lender. However, there are limits to thisapproach. Beyond a project-specific optimal level, the investor's expected return becomes the bindingconstraint and additional equity actually drives up the real LCOE.
6 Developers can configure around tax appetite limitations using several different financing approaches. For example, developer's canobtain a limited partner with a large tax appetite that is willing to provide project equity. Developers may also have the option toengage in "sale lease-back" financing arrangements if allowable under the PTC legislation.7 The "optimal" capital structure is the debt-to-equity ratio that minimizes the project's LCOE.

6
Increasing the share of equity in a project is an imperfect solution for developers because the industry ishighly equity constrained. Geothermal developers typically seek to minimize equity and are unlikely toengage in a financing arrangement that involves more than 50% equity under any circumstances (Owens2001a). A more realistic capital structure for small and medium sized-Independent Power Producersinvolves 20% equity and would yield a real LCOE of 7.4 cents/kWh (Point C in Figure 1). At 20% equity,because of the DSCR constraint, the net effect of the PTC is a substantial increase in the investor's IRRwith no corresponding decrease in the project's real LCOE. However, if the PTC were transferable tolending institutions, or if it were applicable as prepayment on any loans, then debt-service requirementswould not limit the effectiveness of the credit. If these provisions were included in any new PTClegislation, then the ability of the credit to make geothermal projects more economically competitive wouldbe increased.
Impact of Capital Structure on Geothermal Binary Cycle Power Costs under Project Finance with 10-Year Debt
0
1
2
3
4
5
6
7
8
9
0% 10% 20% 30% 40% 50% 60% 70% 80% 90% 100%
Capital Structure (% Equity)
Rea
l Lev
eliz
ed C
ost o
f Ele
ctric
ity (2
001
cent
s/kW
h) PTC Case
A
B
Base CaseC
DSCR constraintin all cases.
Figure 1: Impact of Capital Structure on Geothermal Binary Cycle Power Costs under Project Finance.

7
3.1.2 Flashed-Steam
The results for flashed-steam technology under the Project Finance arrangement are presented in Table 5.These results are consistent with those for binary cycle technology except that all of the LCOE values arelower because flashed-steam plants have lower equipment costs than binary cycle plants.
Table 5: LCOE Results for Binary Cycle under the Project Finance Arrangement (2001 cents/kWh).Tax Policy
CaseReal LCOE Nominal LCOE Equity Percentage
Base Case 4.8 5.7 42%ITC Case 4.6 5.5 45%PTC Case 3.2 3.9 87%
As shown in Table 5, the real LCOE for a flashed-steam plant, assuming the project is financed with 42%equity is 4.8 cents/kWh in the Base Case. In the ITC Case, which represents the current policyenvironment, the real LCOE is 4.6 cents/kWh, assuming the project is financed with 45% equity. And, inthe PTC Case, the real LCOE is 3.2 cents/kWh assuming the project is financed with 87% equity. Thus, ifdevelopers provide additional equity, the PTC has the potential to reduce the real LCOE by 33% from theBase Case, and 30% from the ITC Case, which represents the current policy environment.

8
3.2 Corporate Finance
3.2.1 Binary Cycle
The results for binary cycle technology under the Corporate Finance arrangement are presented in Table 6.
Table 6: LCOE Results for Binary Cycle under the Corporate Finance Arrangement (2001 cents/kWh).Tax Policy
CaseReal LCOE Nominal LCOE Equity Percentage
Base Case 5.3 6.4 33%ITC Case 5.0 6.1 39%PTC Case 2.8 3.3 27%
As shown in Table 6, the real LCOE for a binary cycle plant, assuming the project is financed with 33%equity, is 5.3 cents/kWh in the Base Case. In the ITC Case, which represents the current policyenvironment, the real LCOE is 5.0 cents/kWh, assuming the project is financed with 39% equity. And, inthe PTC Case, the real LCOE is 2.8 cents/kWh, assuming the project is financed with 27% equity.
Point A in Figure 2 shows the real LCOE in the Base Case where 33% equity is the optimal capitalstructure. Point B shows the LCOE in the PTC Case where 27% equity is the optimal capital structure.Notice that, unlike the Project Finance arrangement, the percentage of equity in the optimal capitalstructure decreases in the presence of the PTC. This is due to the presence of the "Phantom Income"constraint. This constraint is sometimes imposed by project developers to ensure that a project does notgenerate an after-tax loss during any year. Because the debt term in this analysis is assumed to be only 10years to reflect current market conditions (Owens 2001b), this constraint is binding in the Base Case forequity levels less than 33%.8
As indicated in Table 6, in the Corporate Finance case, the PTC has the potential to reduce the real LCOEby 2.5 cents/kWh or 47% from the Base Case. If we correct for differences in capital structure (remember,in all of the cases, the capital structure is optimized to reduce the real LCOE) by assuming 33% equity inthe PTC Case (Point C in Figure 2), then the difference in the real LCOE between the two cases decreasesto 2.3 cents/kWh. This is equivalent to the face value of the credit divided by (1-τ),9 where τ is thedeveloper's marginal income tax rate, annualized over the 15-year length of the PPA.10
It is also possible that project developers will decrease the debt-financing period in the presence of thePTC. For illustrative purposes, the thin dotted line in Figure 2 represents the real LCOE in the Base Casewith 30-year debt at a nominal interest rate of 6.5%.11 This arrangement more closely resembles thefinancing structure of an investor-owned (IOU) where debt can be spread out over the entire 30-yearfinancial life of the project. Notice that the difference between the PTC Case and the 30-year debt BaseCase is substantially lower than the difference between the PTC Case and the 10-year debt Base Case.
8 This constraint is binding in the Base Case starting in project year 7 after the capital costs have been fully depreciated.9 See Appendix B for a mathematical derivation of the PTC÷ (1-τ) rule.10 See Appendix D for an illustration of this 15-year annualization.11 For consistency, in the 30-year debt Base Case, the 15-year IRR and LCOE calculation methods have been converted to 30-yearcalculations.

9
3.2.2 Flashed-Steam
The results for flashed-steam technology under a Corporate Finance arrangement are presented in Table 7.These results are consistent with those for binary cycle technology except that all of the LCOE values arelower because flashed-steam plants have lower equipment costs than binary cycle plants. As shown inTable 1, the total capital cost of a flashed-steam project is assumed to be $1,444/kW (1997 $'s) compared toa cost of $2,112 (1997 $'s) for binary cycle technology. Flashed-steam projects do have higher O&M costs(2.00 cents/kWh versus 1.75 cents/kWh for binary cycle,) but the difference is not enough to overcome thereduced capital cost.
Table 7: LCOE Results for Binary Cycle under the Corporate Finance Arrangement (2001 cents/kWh).Tax Policy
CaseReal LCOE Nominal LCOE Equity Percentage
Base Case 4.3 5.1 34%ITC Case 4.1 5.0 39%PTC Case 2.3 2.7 30%
As shown in Table 7, the real LCOE for a flashed-steam plant, assuming the project is financed with 34%equity is 4.3 cents/kWh in the Base Case. In the ITC Case, which represents the current policyenvironment, the real LCOE is 4.1 cents/kWh, assuming the project is financed with 39% equity. And, inthe PTC Case, the real LCOE is 2.3 cents/kWh assuming the project is financed with 30% equity.
Figure 2: Impact of Capital Structure on Geothermal Binary Cycle Power Costs under Corporate Finance.
Impact of Capital Structure on Geothermal Binary Cycle Power Costs under Corporate Finance with 10-Year Debt
0
1
2
3
4
5
6
7
8
0% 25% 50% 75% 100%
Capital Structure (% Equity)
Rea
l Lev
eliz
ed C
ost o
f Ele
ctric
ity (2
001
cent
s/kW
h) PTC Case
Base Case(10-Year Debt)
A
B Phantom Income constraintin the Base Case.
Phantom Income constraintin the PTC Case.
Base Case(30-Year Debt)
C
10
4.0 Cost to the U.S. Treasury
An important question in the examination of the geothermal PTC is how much the incentive will cost theU.S. Treasury. The answer to this question depends on both the project-level costs and on the number ofprojects that are initiated as a result of the PTC. The project-level costs of the PTC have been evaluated inthis report; however, no quantitative attempt has been made to estimate the macroeconomic impact. Still,some observations can be made about the potential cost to the U.S. Treasury even in the absence of acomplete macroeconomic assessment.
From the perspective of the U.S. Treasury, it is likely that the net cost of the PTC would be insignificant orperhaps even negative, because, as Jenkins et al. (1998) have shown, the tax loads associated withconstructing and owning geothermal projects are often higher than the load for competing fossil fuel plantsunder current tax code. In fact, a recent analysis of geothermal federal royalties and income taxes foundthat federal taxation on geothermal power is about three to four times that of electricity produced from anew natural-gas combined-cycle power plant (Entingh 1998). These studies indicate that if new federalincentives are enacted which encourage the increased geothermal development as an important complementto traditional energy resources, and if the total government cost of the new incentives is less than thedifference between the tax loads of the geothermal and conventional generation technologies, then thegovernment will actually increase its revenue through the enactment of such policies. Although additionalresearch is needed, these initial analyses indicate that the Treasury exposure due to a geothermal PTC maybe very limited.
11
Appendix A: Legislative Background
Geothermal energy is a power source that produces electricity with minimal environmental impacts. Sincegeothermal power production entails no combustion, its atmospheric emissions are limited. Geothermalelectricity is also attractive because at some sites it is economically competitive, reliable, and commerciallyproven. For these reasons, U.S. federal and state governments have historically taken an interest inincreasing the supply of geothermal electricity. Federal government involvement began with the passage ofthe Geothermal Steam Act of 1970 (P.L. 91-581). This law was intended to make geothermal resourcesmore widely accessible by authorizing the U.S. Department of Interior to lease geothermal resources onfederal lands.12
After the 1973 Arab oil embargo and ensuing energy crisis, the U.S. government took an even strongerinterest in promoting the production of geothermal energy. Congress passed the Geothermal EnergyResearch, Development and Demonstration Act of 1974 (P.L. 93-410), which established a geothermalresearch and development (R&D) program and a loan guarantee program that ultimately issued five loanguarantees totaling $136 million (Williams 1982). The program sought to help make private capitalavailable to the geothermal industry. In the 1970s, the U.S. geothermal industry was unable to attractsufficient capital for project development because commercial bankers were unwilling to take risks on anindustry about which they knew little. By sharing some of the risk of early geothermal development, thegoal of the loan guarantee program was to provide a capital impetus to the industry.13
The Public Utility Regulatory Policies Act of 1978 (PURPA) (P.L. 95-617) set the stage for a geothermalpower project boom beginning in the early 1980s. Prior to PURPA, there was little incentive for electricutilities to purchase electricity generated by geothermal power plants. Under the provisions of PURPA,however, utilities were required to buy power from qualifying power plants at rates that were equivalent tothe cost that the utility would otherwise have to spend to generate or procure power. When PURPA waspassed, the so-called “avoided” cost of power – which is calculated by forecasting future energy prices –was high because oil prices were at historic highs and expected to continue to increase. As a result, utilitiesentered into long-term agreements to purchase electricity from geothermal power plants at (what laterturned out to be) above market rates. By creating a stable and secure market, PURPA insulated geothermaldevelopers from market risk and made geothermal projects attractive for both debt lenders and equityinvestors.
The Energy Tax Act of 1978 (ETA) (P.L. 95-618) made geothermal power projects even more attractive byallowing for depletion of geothermal deposits by instituting a percentage depletion allowance rate of 10percent for 1978 through 1979, and 15 percent thereafter (CCH 1997). ETA also created a 10% EnergyInvestment Tax Credit (ITC) for geothermal and other renewable energy technologies. The ITC wasincreased to 15% from 1980 through 1986. The ITC, in addition to an existing general 10% investment taxcredit, allowed some geothermal developers to receive income tax credits of up to 25% of the cost ofgeothermal technology through the mid-1980s.
The Economic Recovery Tax Act of 1981 (ERTA) (P.L. 97-340) improved the attractiveness of geothermalprojects even further by allowing for five-year accelerated depreciation of geothermal equipment. In 1986,the Tax Reform Act (P.L. 99-514) repealed the general 10% investment tax credit, but extended the 10%geothermal EITC through 1991. In 1992, the 10% ITC was permanently extended by EPAct.
12 Some believe that this act contained overly strict requirements for assessing the environmental impacts of proposed geothermalprojects. As a result, the majority of lease applicants never obtained leases (Gorschboth 1980). The Energy Security Act (H.R. 2436),which was introduced in the U.S. House of Representatives on July 10, 2001, is intended to provide relief from the requirements of theGeothermal Steam Act. The success of the PTC will depend in part on the passage of legislation such as H.R 2436 which facilitatesthe federal leasing process.13 Observers vary in their assessment of the act. Some believe that the program was unduly complex (Williams 1982). However, otherspoint to the federal loan guarantee used by ORMAT in 1980 to launch the first commercial-scale binary plant in the U.S. as proof ofthe Act's success. The Renewable Energy Loan Guarantee Act (H.R. 2774), which was introduced in the U.S. House ofRepresentatives on August 2, 2001, is intended to revive the loan guarantee program for geothermal and other renewable energyresources.

12
Starting in the early 1980s, the unique market conditions created by PURPA (1978), and the tax incentivesenacted under ETA (1978) and ERTA (1981), worked together to create a wave of geothermal developmentthat lasted for a decade. Capacity quadrupled between 1980 and 1994 (EIA 1995). Most of the capacity wasinstalled in the mid- to late 1980s; about half was installed as independent power projects under PURPAcontracts.
However, by 1992, the market for new geothermal projects began to decline when contracts executed underPURPA, which had a 10-year schedule of high prices, reverted to a lower price based on new avoided costcalculations. This left geothermal power plants to compete directly with natural gas-fired generationtechnologies that were able to produce electricity at 2-3 cents/kWh as a result of low natural gas prices andtechnological improvements. State policies in California and Nevada also played a role in the reduction inthe demand for geothermal power. In California, as a result of ongoing restructuring of the power industry,utilities began selling off their electric generation capacity and did not have interest in bringing newcapacity online. And in Nevada, the elimination of Integrated Resource Planning (IRP) reduced theincentive for utilities to diversify their generation portfolios with renewable energy resources. As a result ofthese conditions, U.S. geothermal generating capacity stagnated in the 1990s, edging up only slightly from2.72 GW in 1990 to 2.98 MW in 1999 (EIA 2001a).
In 2000 and 2001, market and non-market forces began to align once again to create an environment inwhich geothermal energy has the potential to play an important role in meeting the nation's energy needs.Electricity supply shortages in California, in part a result of the generation divestiture of the 1990s, havegreatly increased demand for reliable power sources such as geothermal energy. Record levels of naturalgas demand, coupled with infrastructure constraints, have produced record natural gas price volatility. Inaddition, new concerns over environmental quality and fuel diversification have prompted many developersand power purchasers to consider geothermal energy. Finally, as part of their ongoing restructuring efforts,several states have enacted or are considering legislation specifying renewable portfolio standards.
In 2001, several bills were introduced in the U.S. Congress that propose an expansion of the 10-year windand closed-loop biomass PTC, enacted under EPAct, to geothermal power projects. If passed into law,these bills would provide geothermal developers with an inflation-adjusted 1.8 cent/kWh credit againsttaxes for the first 10 years of project operation. The purpose of the geothermal PTC is to reduce the price ofelectricity from geothermal power plants in order to encourage increased demand for, and subsequentsupply of, geothermal electricity. Whether or not the PTC will be successful in achieving this objective willdepend greatly upon the project-level financial impacts of the PTC. These impacts are the focus of thisreport.

13
Appendix B: PTC ÷÷÷÷ (1-ττττ) Mathematical Derivation
The actual results presented in the main body of this report were developed using a detailed cost ofelectricity spreadsheet model. However, for illustrative purposes, in this Appendix we present amathematical derivation of the change in unit revenue (e.g. electricity price or real LCOE) induced by thePTC.14
In order to determine the change in unit revenue induced by the PTC, we must first define the followingterms:
τ = Marginal income tax rate (%), see Appendix CRt = Revenue (cents/kWh) in year t,ITt = Income tax (cents/kWh) in year t = Rtτ,PTC = Production Tax Credit (cents/kWh) available for the first 10 years of the project,FTt = Final tax bill (cents/kWh) in year t = ITt-PTCt, andATt = After-tax cash flow (cents/kWh) in year t = Rt-FTt.
Next, we find that ATt = Rt-FTt can be reduced to ATt=Rt (1-τ)+PTCt in the following manner,
Now, to determine the change in revenue induced by the PTCt holding ATt constant to ensure that investor’sreceive the same rate of return, we can define Rt
’ as the required revenue in the absence of the PTC, and wecan define Rt
’’ as the required revenue in the presence of the PTCt. If we assume that ATt is held constantwith or without the PTCt, we can determine the change in revenue using following equality,
Dividing by yields,
Or equivalently,
Thus, we find that the difference in revenue in year t (Rt’-Rt
’’) with and without the PTC, while holding ATtconstant, is equal to
It is important to note that this is the maximum PTC induced unit revenue change. This value may need tobe annualized over the term of the PPA depending upon project-specific conditions, and the value will befurther reduced in the presence of lender imposed debt-service constraints, and/or corporate imposedPhantom Income constraints.
14 For simplicity, we have omitted debt payments, operating expenses, and tax deductions from the mathematical equations presentedin this Appendix (i.e. revenue = taxable income). If these factors were included here, the complexity of the equations would besubstantially increased, but the final result would remain unchanged.
.)1( PTCRPTCRRPTCITRFTRAT ttttttttt +−=+−=+−=−= ττ
PTCRR tt +−=− )1()1( ''' ττ
)1('''
τ−+= PTCRR tt
.)1(
'''
τ−=− PTCRR tt
)1(1τ−
.)1( τ−
PTC
14
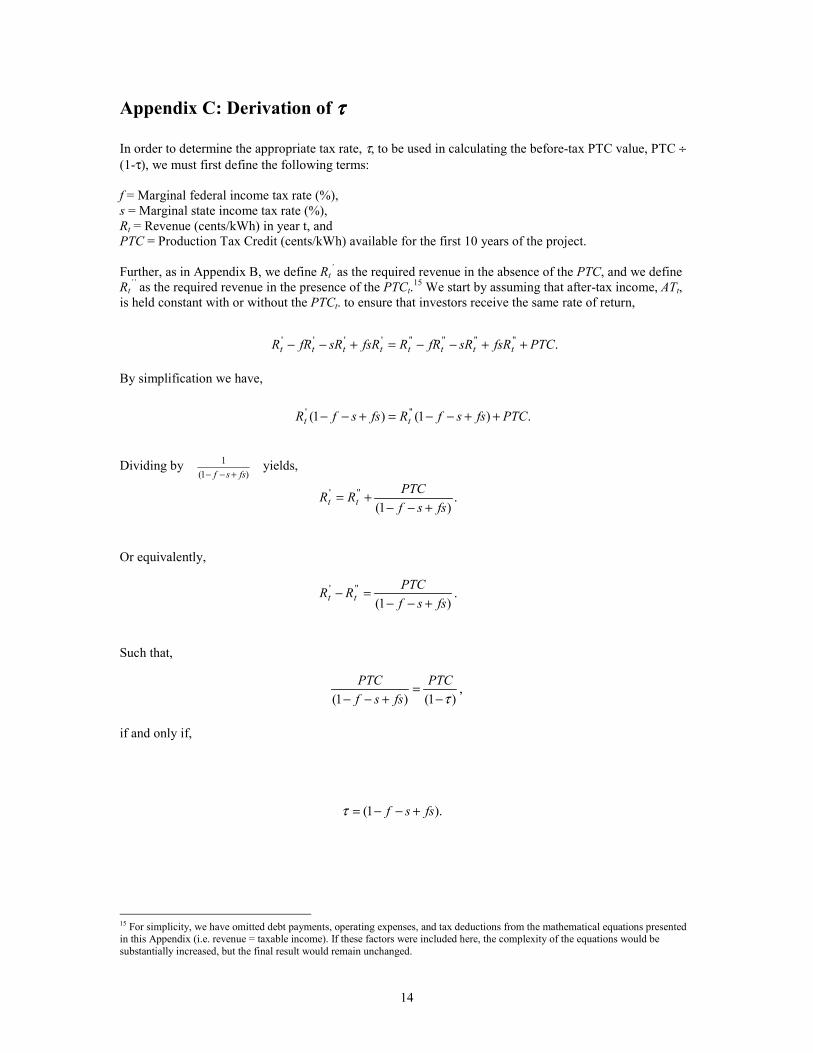
Appendix C: Derivation of ττττ
In order to determine the appropriate tax rate, τ, to be used in calculating the before-tax PTC value, PTC ÷(1-τ), we must first define the following terms:
f = Marginal federal income tax rate (%),s = Marginal state income tax rate (%),Rt = Revenue (cents/kWh) in year t, andPTC = Production Tax Credit (cents/kWh) available for the first 10 years of the project.
Further, as in Appendix B, we define Rt’ as the required revenue in the absence of the PTC, and we define
Rt’’ as the required revenue in the presence of the PTCt.15 We start by assuming that after-tax income, ATt,
is held constant with or without the PTCt. to ensure that investors receive the same rate of return,
By simplification we have,
Dividing by yields,
Or equivalently,
Such that,
if and only if,
15 For simplicity, we have omitted debt payments, operating expenses, and tax deductions from the mathematical equations presentedin this Appendix (i.e. revenue = taxable income). If these factors were included here, the complexity of the equations would besubstantially increased, but the final result would remain unchanged.
.)1()1( ''' PTCfssfRfssfR tt ++−−=+−−
.'''''''''''' PTCfsRsRfRRfsRsRfRR tttttttt ++−−=+−−
)1(1
fssf +−−
.)1(
'''
fssfPTCRR tt +−−
+=
.)1(
'''
fssfPTCRR tt +−−
=−
,)1()1( τ−
=+−−
PTCfssf
PTC
).1( fssf +−−=τ

15
Appendix D: Maximum Annualized PTC Value
When projects are engaged in PPAs that have a longer term than the 10-year period over which the PTC isavailable, then the PTC induced unit revenue reduction (e.g. the change in electricity price with and withoutthe PTC) is annualized over the length of the PPA. In these cases, the PTC induced unit revenue reductionwill be less than PTC ÷ (1-τ).
To determine the annualized revenue reduction value of the credit (ignoring financing limitations),16 wefirst compute the present value of the credit, PV(PTC). Since the credit is available for 10 years, we cancalculate the present value as,
Where,
τ = Marginal income tax rate (%),PTC = Production Tax Credit (cents/kWh) available for the first 10 years of a project’s life; anddr = the real discount rate used for LCOE calculations.
This can be simplified to,
If we let dr = 5.6%, if we let PTC = 1.8 cents/kWh, and if we assume that τ is 40% then,
We can annualize this value over the PPA term by multiplying the PV(PTC) times the Uniform CapitalRecovery Factor (UCRF) which is defined as,
Where N = the length of the PPA. If we assume that N=15, in accordance with the examples presented inthis report then,
We can now calculate the annualized present value of the credit, APV(PTC), as,
Thus, we can see that, under these assumptions, the annualized revenue reduction value of the PTC isapproximately 2.3 cents/kWh.
16 The actual results presented in the main body of this report were developed using a detailed cost of electricity spreadsheet model.However, for illustrative purposes, in this Appendix we present a mathematical derivation of the annualization of the PTC-inducedchange in unit revenue.
,)1(
1)1(
)(10
1� = +−=
i ird
xPTCPTCPVτ
.)1(
1)1(
)(10
1� = +−=
i ird
PTCPTCPVτ
.5.2249.70.3)056.01(
1)40.01(
8.1)(10
1≈≈
+−= � =
xPTCPVi i
( )( ) 11
1−+
+= Nr
Nrr
dddUCRF
( )( )
%.1.101056.01
056.01056.015
15
≈−+
+= rUCRF
.3.2)(101.05.22)(
)()(
≈==
PTCAPVxPTCAPV
xUCRFPTCPVPTCAPV

16
References
Electric Power Research Institute and U.S. Department of Energy (EPRI-DOE) (1997), Renewable EnergyTechnology Characterizations, EPRI-TR-109496, Pleasant Hill, CA.
Energy Information Administration (EIA) (2001a), Renewable Energy Annual 2000, DOE/EIA-0603(2000), U.S. Department of Energy, Washington, D.C.
Energy Information Administration (EIA) (2001b), Annual Energy Outlook 2001, DOE/EIA-0383(2000),U.S. Department of Energy, Washington, D.C.
Entingh, D.J. (1998), Review of Federal Geothermal Royalties and Taxes, unpublished study for theNational Renewable Energy Laboratory, and the Office of Geothermal Technologies, U.S. Department ofEnergy. Princeton Energy Resources International, Inc. (PERI), Rockville, Maryland, December 15, 1998.
Gorschboth, Frederick C. (1980), "Geothermal Energy in the United States: A Broken Promise, AnUncertain Future," Energy at Booz·Allen, Volume II, Number 1, Winter 1980.
Jenkins, Alec F., Richard A. Chapman, Hugh E. Reilly (1998), Tax Barriers to Four Renewable ElectricGeneration Technologies, available at http://www.energy.ca.gov/development/tax_neutrality_study.
Owens, Brandon (2001a), Interviews with geothermal industry representatives, conducted July 11-23,2001. National Renewable Energy Laboratory, Golden, CO. Copies of the anonymous transcripts can beobtained from the author on request.
Owens, Brandon (2001b), Follow-up interviews with geothermal industry representatives, conducted July11-23, 2001. National Renewable Energy Laboratory, Golden, CO. Copies of the anonymous transcriptscan be obtained from the author on request.
Williams, Bob (1982), "Action in geothermal energy picking up in the U.S.," Oil & Gas Journal, May 3,1982.

REPORT DOCUMENTATION PAGE Form ApprovedOMB NO. 0704-0188
Public reporting burden for this collection of information is estimated to average 1 hour per response, including the time for reviewing instructions, searching existing data sources,gathering and maintaining the data needed, and completing and reviewing the collection of information. Send comments regarding this burden estimate or any other aspect of thiscollection of information, including suggestions for reducing this burden, to Washington Headquarters Services, Directorate for Information Operations and Reports, 1215 JeffersonDavis Highway, Suite 1204, Arlington, VA 22202-4302, and to the Office of Management and Budget, Paperwork Reduction Project (0704-0188), Washington, DC 20503.
1. AGENCY USE ONLY (Leave blank) 2. REPORT DATEApril 2002
3. REPORT TYPE AND DATES COVEREDTechnical Report - Analysis
4. TITLE AND SUBTITLEAn Economic Valuation of a Geothermal Production Tax Credit
6. AUTHOR(S)Brandon N. Owens
5. FUNDING NUMBERS
TA: GT11-1108
7. PERFORMING ORGANIZATION NAME(S) AND ADDRESS(ES)National Renewable Energy Laboratory1617 Cole Blvd.
Golden, CO 80401-3393
8. PERFORMING ORGANIZATIONREPORT NUMBER
9. SPONSORING/MONITORING AGENCY NAME(S) AND ADDRESS(ES)National Renewable Energy Laboratory1617 Cole Blvd.Golden, CO 80401-3393
10. SPONSORING/MONITORINGAGENCY REPORT NUMBER
NREL/TP-620-31969
11. SUPPLEMENTARY NOTES
12a. DISTRIBUTION/AVAILABILITY STATEMENTNational Technical Information ServiceU.S. Department of Commerce5285 Port Royal RoadSpringfield, VA 22161
12b. DISTRIBUTION CODE
13. ABSTRACT (Maximum 200 words)The United States (U.S.) geothermal industry has a 45-year history. Early developments were centered on a geothermal resource innorthern California known as The Geysers. Today, most of the geothermal power currently produced in the U.S. is generated in Californiaand Nevada. The majority of geothermal capacity came on line during the 1980s when stable market conditions created by the PublicUtility Regulatory Policies Act (PURPA) in 1978 and tax incentives worked together to create a wave of geothermal development thatlasted until the early 1990s. However, by the mid-1990s, the market for new geothermal power plants began to disappear. Today, market and non-market forces appear to be aligning once again to create an environment in which geothermal energy has thepotential to play an important role in meeting the nation's energy needs. One potentially attractive incentive for the geothermal industry isthe Production Tax Credit (PTC). The current PTC, which was enacted as part of the Energy Policy Act of 1992 (EPAct) (P.L. 102-486),provides an inflation-adjusted 1.5 cent per kilowatt-hour (kWh) federal tax credit for electricity produced from wind and closed-loopbiomass resources. Proposed expansions would make the credit available to geothermal and solar energy projects. This report focuses onthe project-level financial impacts of the proposed PTC expansion to geothermal power plants.
15. NUMBER OF PAGES14. SUBJECT TERMSgeothermal; California; Nevada; Production Tax Credit; PTC; PURPA; The Geysers;
market; Energy Policy Act. 16. PRICE CODE
17. SECURITY CLASSIFICATIONOF REPORTUnclassified
18. SECURITY CLASSIFICATIONOF THIS PAGEUnclassified
19. SECURITY CLASSIFICATIONOF ABSTRACTUnclassified
20. LIMITATION OF ABSTRACT
UL
NSN 7540-01-280-5500 Standard Form 298 (Rev. 2-89)Prescribed by ANSI Std. Z39-18
298-102