Uniform Crime Report Law Enforcement Officers Killed and Assaulted
OFFICIAL
1
OFFICIALOFFICIAL
An Economic Assessment of Waste
Crime Enforcement in Scotland
A report submitted to the Scottish Environment Protection Agency as part of the Scotland’s
Environment Web LIFE+ project
November 2014.
Prepared by Katherine Simpson and Frans P. de Vries
Stirling Management School
Division of Economics
University of Stirling

OFFICIAL
2
OFFICIALOFFICIAL
OFFICIAL
3
OFFICIALOFFICIAL
Executive Summary Environmental crime is the breaking of environmental law by individuals or companies who carry out
activities which could have an impact on the environment. Environmental crimes include unlicensed
waste operations including transport, storage, treatment and disposal, illegal discharges to the water
environment, unauthorised abstractions and illegal emissions to air. In March 2014, Eunomia
estimated that waste crime costs the UK economy £567.9 million per year and tax evasion, through
the misclassification of waste is thought to cost the HMRC an estimated £157 million per annum. In
England and Wales, the Environment Agency spent £17 million tackling waste crime in 2012-2013.
With new enforcement powers provided by the Regulatory Reform (Scotland) Act, it is important to
understand whether these new powers will be cost-effective and what the likely benefits of increased
enforcement are. This report addresses both aspects.
Part 1 of the report provides an introduction to cost-effective and benefit-cost analysis and illustrates
how these tools could be applied to compare four enforcement actions for waste crime: inspections,
final warning letters, notices and referrals to the Procurator Fiscal. Recommendations include
additional reporting of the four enforcement actions and detail of the waste streams affected.
Part 2 of the report applies the benefit-cost analysis method to determine the costs and benefits of
waste crime enforcement for three separate Scottish case studies. Applying the Eunomia model
developed for waste crime in England and Wales, the return per pound spent on enforcement and
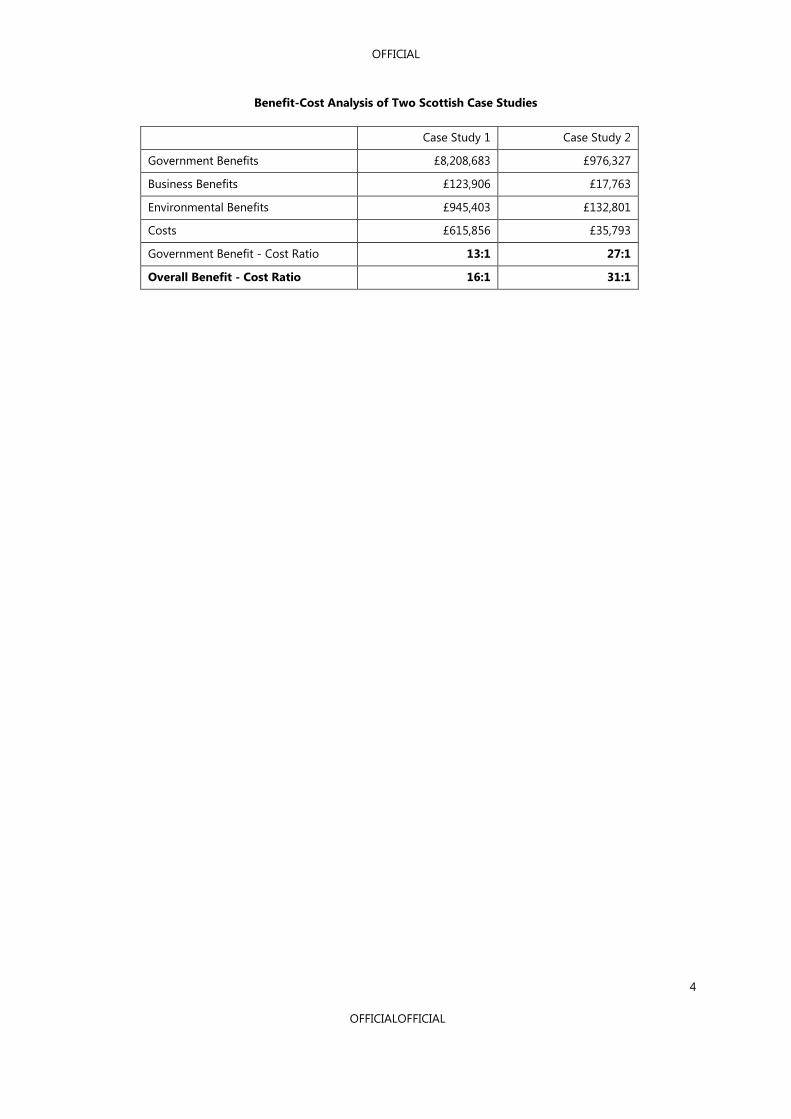
monitoring for three case studies was calculated. The benefit-cost ratios of 16:1 and 31:1 were
significantly higher than the Eunomia ratio of 4:1. These values in the current report offer a different
perspective to the Eunomia report, and identify the issues posed by the most serious sites. It is
recognised that one of the limitations when applying the Eunomia model to the Scottish case studies
is the fact that the waste has remained at the illegal waste site (IWS) has not yet been removed.
However, the benefit-cost ratio is still useful and provides an indication of the benefits that accrue
from closing the IWS and re-diverting all future waste into the legal waste stream. The fundamental
recommendation of this report is to develop a systematic data collection for waste crime enforcement
actions. This should include detailed recording of enforcement actions at a given site and significantly
more detail on the actual waste at sites and waste streams.
OFFICIAL
4
OFFICIALOFFICIAL
Benefit-Cost Analysis of Two Scottish Case Studies
Case Study 1 Case Study 2
Government Benefits £8,208,683 £976,327
Business Benefits £123,906 £17,763
Environmental Benefits £945,403 £132,801
Costs £615,856 £35,793
Government Benefit - Cost Ratio 13:1 27:1
Overall Benefit - Cost Ratio 16:1 31:1

OFFICIAL
5
OFFICIALOFFICIAL
Contents
Executive Summary ............................................................................................................................................................................................... 3
Contents .................................................................................................................................................................................................................... 5
Glossary ...................................................................................................................................................................................................................... 6
Introduction ............................................................................................................................................................................................................. 8
Waste Crime in Scotland ............................................................................................................................................................................... 9
Part 1: Measuring the Success of Waste Crime Interventions .......................................................................................................... 11
Introduction ...................................................................................................................................................................................................... 11
Measuring Programme Success: Cost Effective Analysis and Cost Benefit Analysis .......................................................... 13
Recommended Method ............................................................................................................................................................................... 14
Recommended Analysis ............................................................................................................................................................................... 18
Summary and Recommendations ........................................................................................................................................................... 20
Part 2: Costs and Benefits of Waste Crime Enforcement in Scotland – Case Study Application ....................................... 21
Introduction ...................................................................................................................................................................................................... 21
Eunomia Methodology and Relevant Extensions for the three Scottish Case Studies ..................................................... 23
Model Application and Results ................................................................................................................................................................. 27
Case Study 1 ................................................................................................................................................................................................. 27
Case Study 2 ................................................................................................................................................................................................. 29
Case Study 3 ................................................................................................................................................................................................. 31
Discussion .......................................................................................................................................................................................................... 38
Conclusion and Key Recommendations ............................................................................................................................................... 41

OFFICIAL
6
OFFICIALOFFICIAL
Glossary
Benefit-cost analysis: An economic method developed to identify and express in monetary terms all
the effects of a proposed policy or project. The analysis involves comparing the total expected cost
of each option against the total expected benefits. A benefit-cost ratio is calculated by dividing the
expected benefits by expected costs. The ratio can be used to compare different projects to offer an
insight into which offers the best rate of return. Whilst it is not intended to be the only basis for
decision making, benefit cost analysis can be a valuable aid to policymakers.
Compliance: An assessment by SEPA of licence conditions pertaining to licence holders to ensure that
the conditions of their licence are being met.
Cost-effective analysis: An economic method to compares the relative costs and outcomes of two or
more courses of action. Cost-effectiveness analysis is distinct from benefit-cost analysis as it does not
assign monetary values to the measure of effect.
Gate fee: This is the charge levied upon a given quantity of waste received at a waste processing
facility. In the case of a landfill it is generally levied to offset the cost of opening, maintaining and
eventually closing the site. It may also include any Landfill Tax which is applicable in the region. The
organisation WRAP provides information on Gate Fees in the UK.
Illegal waste site (IWS): An illegal waste site (IWS) is a site operating without the appropriate permit
for the activity being carried out where multiple loads of waste are deposited, treated, stored or
disposed of, and where the activity is, or appears to us to be, taking place in an organised manner.
Materials recovery facility (MRF): A Materials Recovery Facility (MRF) is where recyclable materials
that are collected from households are sorted into different types using a mixture of manual and
automated methods.

OFFICIAL
7
OFFICIALOFFICIAL
Net Present Value (NPV): Net present value (NPV) is a calculation used to estimate the value of a
project over the project lifetime. The formula for NPV requires knowing the likely amount of time (t,
usually in years) that cash will be invested in the project, the total length of time of the project (N, in
the same unit of time as (t), the interest rate (i). The HM Treasury Green Book recommends a discount
rate of 3.5% to be applied when calculating NPV.
Sensitivity analysis: This is used to determine how different values of an independent variable will
impact a particular dependent variable under a given set of assumptions. Independent variables may
include the discount rate, interest rate and project timescale.
Waste crime: An act or omission which directly or indirectly damages the environment (or has the
potential to damage the environment) and which constitutes a breach of criminal law.
Waste stream: The waste stream is the complete flow of waste from domestic or industrial areas
through to final disposal.
OFFICIAL
8
OFFICIALOFFICIAL
Introduction
Environmental crime is the breaking of environmental law by individuals or companies who carry out
activities which could have an impact on the environment. Environmental crimes include unlicensed
waste operations including transport, storage, treatment and disposal, illegal discharges to the water
environment, unauthorised abstractions and illegal emissions to air1. Illegal waste crime operations
include: illegal landfill sites; unlicensed skip hire operators; large scale and persistent dumping of
waste; unlawful collection, storage and breaking of scrap cars; unauthorised collection, storage and
export of waste electrical and electronic equipment. Waste sites are defined as illegal if they do not
have a permit or meet other legal requirements. Breaching these requirements can lead to pollution
and nuisance and companies can be fined for this; for example in 2012 one firm was fined £10,500 for
failing to stop offensive odours that were detected off-site2. Permits are issued by the national
regulator and charges cover the costs of issuing and regulating the permits.
In March 2014, Eunomia estimated that waste crime costs the UK economy £567.9 million per year3.
Operating an illegal waste site (IWS) has many financial benefits for the criminal including lack of
licensing costs, landfill specific costs, remediation costs and tax evasion. Tax evasion, through the
misclassification of waste, is thought to be a significant source of revenue loss for the HMRC, with an
estimated £157 million lost per annum in the UK4. Other losses to the HMRC include Corporation Tax
1 SEPA (2013) SEPA Enforcement Report 2012-2013. Online:
http://www.sepa.org.uk/about_us/publications/enforcement_reports.aspx. Accessed 12/20/2014. 2 SEPA (2013) SEPA Enforcement Report 2012-2013. Online:
http://www.sepa.org.uk/about_us/publications/enforcement_reports.aspx. Accessed 12/20/2014. 3 Eunomia (2014) Waste Crime, Tackling Britain’s Dirty Secret. Online:
http://www.esauk.org/esa_reports/ESAET_Waste_Crime_Tackling_Britains_Dirty_Secret_LIVE.pdf. Accessed
12/10/2014. 4 Eunomia (2014) Waste Crime, Tackling Britain’s Dirty Secret. Online:
http://www.esauk.org/esa_reports/ESAET_Waste_Crime_Tackling_Britains_Dirty_Secret_LIVE.pdf. Accessed
12/10/2014.
OFFICIAL
9
OFFICIALOFFICIAL
and employment related contributions. Waste crime can also create uncertainty for legal operators
due to reduced gate fees and, subsequently, loss of revenue and profit.
Waste Crime in Scotland
The Scottish Environment Protection Agency (SEPA) is the national regulator and responsible for
ensuring compliance with environmental legislation. For the 2013/2014 financial year, SEPA estimated
the financial benefit for waste crime criminals was £27 million5. Further to this, it is estimated that 20%
of serious organised crime groups are related to the waste sector, based on licensing data and SEPA
case reporting6. At the start of 2014 a new Waste Crime Team within SEPA was launched to lead
investigations directed at tackling the most serious offenders, working in partnership with law
enforcement agencies (e.g. Police Scotland) to identify and disrupt serious waste crime, including that
associated with organised crime, identified within the waste sector.
In England and Wales the Environment Agency spent £17 million tackling waste crime in 2012-2013
and it is important to understand whether this spending effort is effective at reducing waste crime. In
2014, Eunomia estimated that the 10 year benefit to cost ratio associated with tackling waste crime is
between 4:1 and 6:1 (using Environment Agency data).
5 SEPA (2014) Justice Committee -Environmental crime and serious organised crime. [Online] Accessed
15/12/2014.
http://www.scottish.parliament.uk/S4_JusticeCommittee/Inquiries/EC3_SEPA.pdf 6 SEPA (2014) Justice Committee - Environmental crime and serious organised crime. [Online] Accessed
15/12/2014.
http://www.scottish.parliament.uk/S4_JusticeCommittee/Inquiries/EC3_SEPA.pdf
OFFICIAL
10
OFFICIALOFFICIAL
Report Aims
With new enforcement powers provided by the Regulatory Reform (Scotland) Act 2014, it is important
to understand whether these new powers will be cost-effective and what the likely benefits are.
Part 1 of this report provides an introduction to cost-effective and benefit-cost analysis and
how these tools could be applied to compare four regulatory actions for waste crime: site
inspections, warning letters, notices and referrals to the Procurator Fiscal.
Part 2 of the report applies the benefit-costs analysis method to determine the costs and
benefits of waste crime enforcement for three separate case studies. To foster transparency in
and transferability of cost-effectiveness analyses in the future, this also includes
recommendations for improving data collection and reporting by SEPA.
OFFICIAL
11
OFFICIALOFFICIAL
Part 1: Measuring the Success of Waste Crime
Interventions
Introduction
The Scottish Environment Protection Agency (SEPA) is responsible for issuing licenses to waste
management sites. The majority of waste management sites are licensed under the 1994 Waste
Management Licensing Regulations. The objective of the waste management licensing system is to
ensure that waste management facilities do not cause pollution of the environment, cause harm to
human health or become seriously detrimental to the amenities of the locality7. From the regulator’s
perspective, tax does not currently feature in compliance assessment.
SEPA is an enabling organisation and will seek, according to its policy, to engage, encourage and
inform so as to encourage compliance. Where appropriate, however, enforcement will be elevated
through a number of stages. Where breaches of the law arise, SEPA will undertake enforcement
action in a proportionate manner. In pursuing compliance with environmental legislation, SEPA may
use a variety of tools including8:
Discussion: Advice may be given on compliance with environmental legislation at meetings
and in subsequent written correspondence.
Advisory/ warning letters: These letters are often issued to require action following a site visit
where environmental harm can be prevented.
7 SEPA. Waste Management Licence Application Forms [Online]
http://www.sepa.org.uk/waste/waste_regulation/application_forms/waste_management_licence.aspx . Accessed
21/10/2014.
8 SEPA. SEPA Policy Statement on Enforcement Polic Number 5 [Online]
http://www.sepa.org.uk/about_us/policies.aspx. Accessed 21/10/2014.
OFFICIAL
12
OFFICIALOFFICIAL
Final warning letters: These letters are used when there is an obvious breach of environmental
legislation or licence conditions which requires immediate action or where there are repetitive
breaches of environmental legislation or licence conditions.
Notices: A formal notice may be served by SEPA that requires compliance.
Referrals to the Procurator Fiscal: SEPA can recommend to a Procurator Fiscal that a case be
brought. Prosecution will be recommended only where it can be justified in order to punish
offenders, to avoid a recurrence and/or to encourage improved compliance with the law.
Table 1 provides an overview of regulatory actions for waste crime in Scotland between 2009 and
2013. The number of referrals to the Procurator Fiscal remained relatively stable over time, although
there was a small decrease in the number of convictions in 2012-2013. Total and average fines vary
from year to year. As noted in the SEPA 2012-2013 enforcement report, the figures tend to fluctuate
each year, which make it difficult to reach a conclusion on cause and effect9.
Table 1: Summary of regulatory actions for waste crime in Scotland 2009 – 201310
2009-2010 2010-2011 2011-2012 2012-2013
Referrals to the Procurator Fiscal 16 17 20 21
Notices 37 34 56 47
Warning Letters 58 68 74 42
Convictions 18 13 13 9
Total Fines £42,602 £109,930 £42,251 £220,402
Average Fine £2,506 £10,993 £3,841 £31,486
9 SEPA (2013) SEPA Enforcement Report 2012-2013. Online:
http://www.sepa.org.uk/about_us/publications/enforcement_reports.aspx. Accessed 12/20/2014.
10 Table compiled from SEPA enforcement reports readily available online. SEPA. SEPA Enforcement Reports.
[Online] http://www.sepa.org.uk/about_us/publications/enforcement_reports.aspx Accessed 21/10/2014.

OFFICIAL
13
OFFICIALOFFICIAL
It is crucial for SEPA to understand the cost-effectiveness associated with the four regulatory tools ―
inspections, final warning letters, notices and referrals to the Procurator Fiscal ― and to determine
whether they are having a higher dividend return compared to the costs invested in waste crime
monitoring and enforcement. The aim of Part 1 of this report is to recommend a data collection
strategy and method to assess the relative cost-effectiveness for a variety of regulatory actions
against waste crime in Scotland.
Measuring Programme Success: Cost - Effective Analysis and Benefit - Cost Analysis
Two of the most common approaches for programme evaluation are cost-effectiveness analysis and
benefit-cost analysis. Cost-effective analysis considers the different cost inputs to produce a specific
outcome or set of outcomes. The project which produces the preferred outcome at the lowest cost is
considered the most desirable from a cost-effective analysis perspective. For example, if the objective
is to determine the cost per pollution incident avoided (cost per outcome) the calculation would
require a quantification of the cost and volume of inputs required to result in the avoidance of the
pollution incident. Examples of inputs include site inspections and associated staff costs. For
comparisons between alternate waste crime interventions, the interventions must share a common
outcome and be measured on a common basis.
Benefit-cost analysis extends cost-effective analysis by attaching monetary values to the outcomes of
a programme. After the cost of inputs and benefits of the outcome have been quantified in monetary
terms, a comparison of alternate interventions can be made. The result is expressed in terms of a
benefit-cost ratio which is calculated by dividing the monetary value of outcomes by the monetary
value of the input costs.

OFFICIAL
14
OFFICIALOFFICIAL
Recommended Method
The focus of this methodology is to outline a robust data collection strategy for waste crime
interventions that allows a cost-effective analysis to be undertaken at a later date. Measurement
of programme success based on outcomes can be considered robust as long as these outcomes can
be quantified and compared to a baseline position. The establishment of a baseline position is one of
the most fundamental components of being able to measure the impact of an intervention as actions
move from the baseline (or current) position to the outcome. “Where financial impact is being used as
a measurement of success or cost effectiveness, data on costs needs to be collected in a systematic way
as to enable comparisons to be made at the evaluation stage”11
. The recommended data collection
process for future cost-effective analysis is detailed in Table 2.
First and foremost, a clear understanding of the regulatory process is required in order to determine
the input cost and direct outcomes for each regulatory action. Sites are first inspected by SEPA where
they will be deemed to be compliant or non-compliant within the relevant licensing conditions. Where
sites are compliant no further action is taken. If sites are deemed to be non-compliant sites will first
receive warning letters, followed by statutory notices and if they choose to remain non-compliant the
case can be referred to the Procurator Fiscal. Only at the point of conviction do non-compliant sites
face being fined. For letters and notices there is no fine if the site chooses to continue to be non-
compliant, but sites will face a cost of cleaning up their operations (environmental limit cases) or will
have to improve their reporting or plant infrastructure (management cases). It is worth noting that in
the case of severe crimes, a referral to the Procurator Fiscal will be the starting point for regulatory
11 DG Environment (2000) A Study on the Economic Valuation of Environmental Externalities from Landfill
Disposal and Incineration of Waste. [Online]
http://ec.europa.eu/environment/waste/studies/pdf/econ_eva_landfill_report.pdf

OFFICIAL
15
OFFICIALOFFICIAL
action. Additionally, from 2015, SEPA will have new powers under the Regulatory Reform Act to issue
monetary penalties rather than engage in the enforcement process outlined in this section.
OFFICIAL
16
OFFICIALOFFICIAL
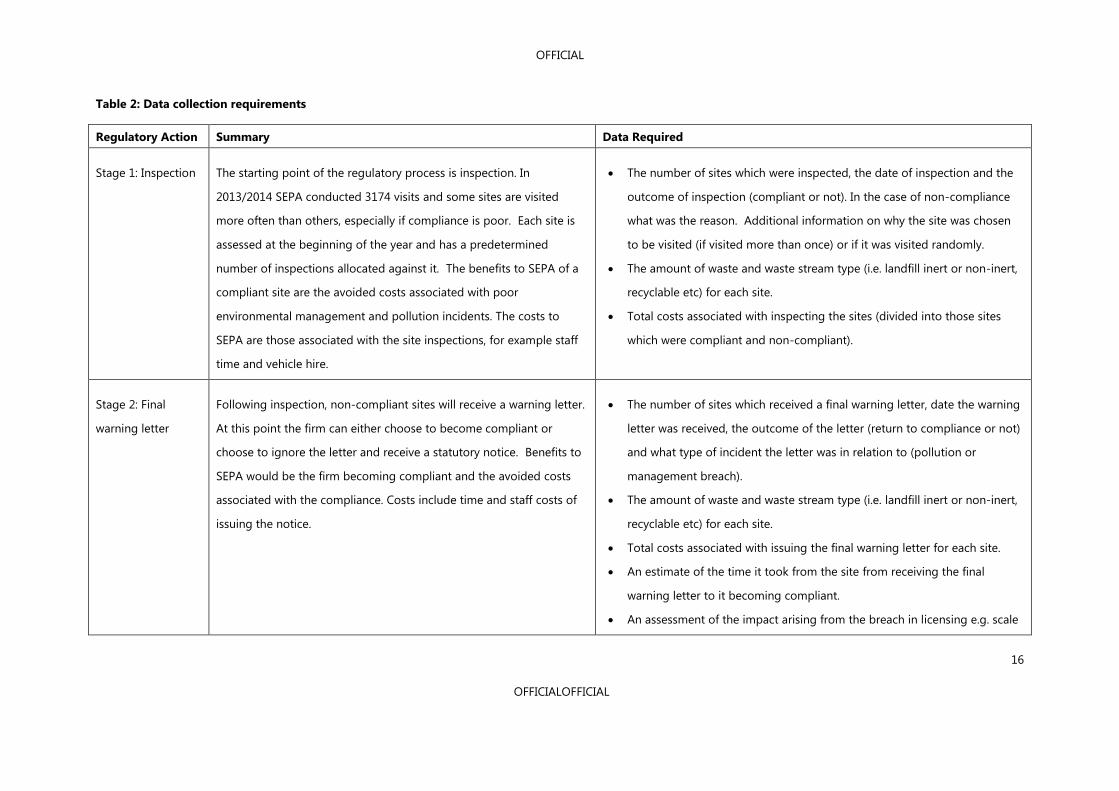
Table 2: Data collection requirements
Regulatory Action Summary Data Required
Stage 1: Inspection The starting point of the regulatory process is inspection. In
2013/2014 SEPA conducted 3174 visits and some sites are visited
more often than others, especially if compliance is poor. Each site is
assessed at the beginning of the year and has a predetermined
number of inspections allocated against it. The benefits to SEPA of a
compliant site are the avoided costs associated with poor
environmental management and pollution incidents. The costs to
SEPA are those associated with the site inspections, for example staff
time and vehicle hire.
The number of sites which were inspected, the date of inspection and the
outcome of inspection (compliant or not). In the case of non-compliance
what was the reason. Additional information on why the site was chosen
to be visited (if visited more than once) or if it was visited randomly.
The amount of waste and waste stream type (i.e. landfill inert or non-inert,
recyclable etc) for each site.
Total costs associated with inspecting the sites (divided into those sites
which were compliant and non-compliant).
Stage 2: Final
warning letter
Following inspection, non-compliant sites will receive a warning letter.
At this point the firm can either choose to become compliant or
choose to ignore the letter and receive a statutory notice. Benefits to
SEPA would be the firm becoming compliant and the avoided costs
associated with the compliance. Costs include time and staff costs of
issuing the notice.
The number of sites which received a final warning letter, date the warning
letter was received, the outcome of the letter (return to compliance or not)
and what type of incident the letter was in relation to (pollution or
management breach).
The amount of waste and waste stream type (i.e. landfill inert or non-inert,
recyclable etc) for each site.
Total costs associated with issuing the final warning letter for each site.
An estimate of the time it took from the site from receiving the final
warning letter to it becoming compliant.
An assessment of the impact arising from the breach in licensing e.g. scale

OFFICIAL
17
OFFICIALOFFICIAL
and type of pollution incident.
Stage 3: Statutory
notice
Those firms which ignore the final warning letter go on to receive a
statutory notice. Again a firm can choose whether to become
compliant or ignore the notice with a threat of being referred to the
Procurator Fiscal. Benefits to SEPA would be the firm becoming
compliant and the avoided costs associated with the compliance.
Costs include time and staff costs of issuing the notice.
The number of sites which received a statutory notice, date the notice was
issued to the site, outcome of the notice (return to compliance or not) and
what type of incident it the notice was in relation to.
The amount of waste at the site and waste stream type for each site.
Total costs associated with issuing statutory notices for each site
An estimate of the time it took from the site receiving the notice to
becoming compliant.
An assessment of the impact arising from the breach in licensing e.g. scale
and type of pollution incident.
Stage 4: Procurator
Fiscal
If a firm does not take appropriate action on the previous
communication and chooses to remain non-compliant SEPA can refer
the case to the Procurator Fiscal.
The number of cases brought to the Procurator Fiscal and the outcome of
the cases (conviction and level of fine)
Whether the site continued to operate (presumed legally) and if so data
would be required on the amount of waste processed at the site and the
waste stream.
Total costs associated with raising the case to the Procurator Fiscal.
An estimate of the time between the first inspection, the referral to the
Procurator Fiscal and the outcome of the case.
An assessment of the impact arising from the breach in licensing e.g. scale
and type of pollution incident.

OFFICIAL
18
OFFICIALOFFICIAL
Recommended Analysis
Cost Effective Calculations
To compare the relative effectiveness of each regulatory action (inspections, letters, statutory notices
and referral to the Procurator Fiscal) the most straightforward analysis would be to complete a cost-
effectiveness analysis. For ease, the unit outcome of the calculation would be based on the number of
sites which were compliant following each regulatory action:
Inspections: sites compliant at the inspection stage/cost to inspect.
Warning letters: sites compliant after receiving warning letter/total cost of issuing letters.
Statutory notices: sites compliant after receiving statutory notices/total cost of issuing notices.
Procurator Fiscal: sites compliant after the each report/cost of each report.
Analysis should take into account the time lag between undertaking the relevant regulatory action
and the site returning to compliance. The cost-effectiveness of each measure can then be compared. It
is recognised that the calculations are simplistic and does not take into account variations between
the waste management firms. An extension of this analysis is to include monetary values for benefits
and costs and allows us to undertake a full benefit-cost analysis.
OFFICIAL
19
OFFICIALOFFICIAL
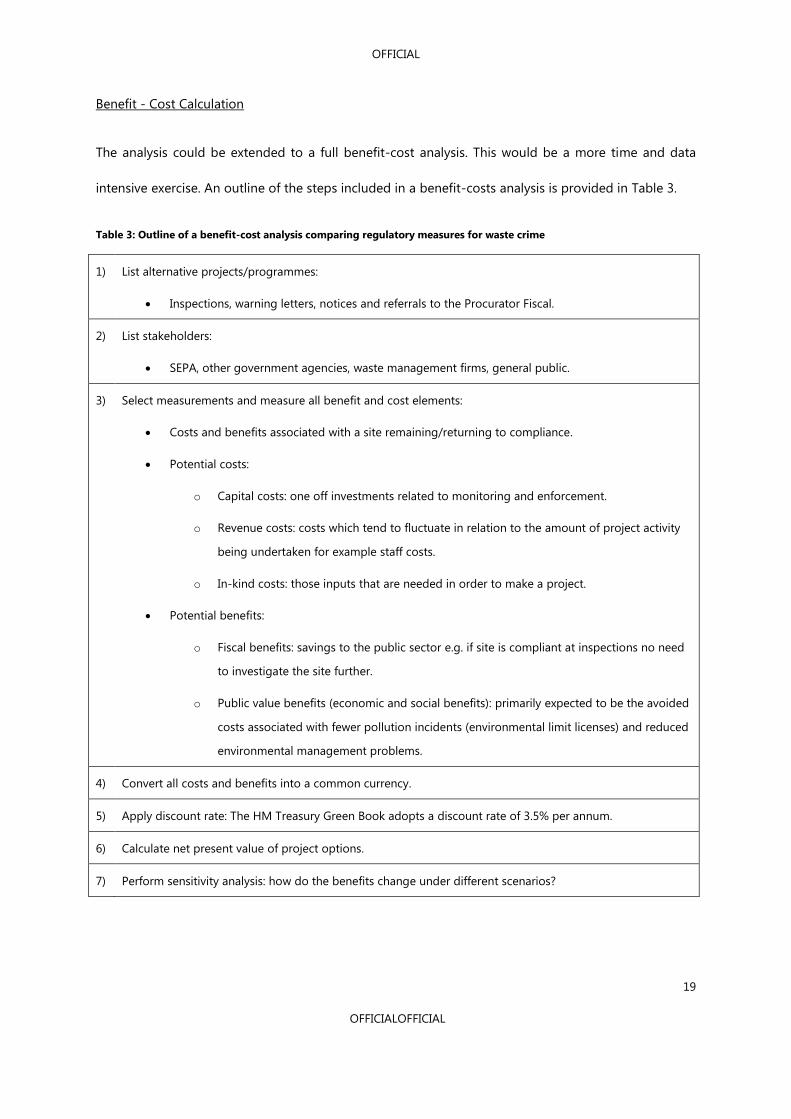
Benefit - Cost Calculation
The analysis could be extended to a full benefit-cost analysis. This would be a more time and data
intensive exercise. An outline of the steps included in a benefit-costs analysis is provided in Table 3.
Table 3: Outline of a benefit-cost analysis comparing regulatory measures for waste crime
1) List alternative projects/programmes:
Inspections, warning letters, notices and referrals to the Procurator Fiscal.
2) List stakeholders:
SEPA, other government agencies, waste management firms, general public.
3) Select measurements and measure all benefit and cost elements:
Costs and benefits associated with a site remaining/returning to compliance.
Potential costs:
o Capital costs: one off investments related to monitoring and enforcement.
o Revenue costs: costs which tend to fluctuate in relation to the amount of project activity
being undertaken for example staff costs.
o In-kind costs: those inputs that are needed in order to make a project.
Potential benefits:
o Fiscal benefits: savings to the public sector e.g. if site is compliant at inspections no need
to investigate the site further.
o Public value benefits (economic and social benefits): primarily expected to be the avoided
costs associated with fewer pollution incidents (environmental limit licenses) and reduced
environmental management problems.
4) Convert all costs and benefits into a common currency.
5) Apply discount rate: The HM Treasury Green Book adopts a discount rate of 3.5% per annum.
6) Calculate net present value of project options.
7) Perform sensitivity analysis: how do the benefits change under different scenarios?

OFFICIAL
20
OFFICIALOFFICIAL
Summary and Recommendations
Part 1 of the report has provided an introduction to conducting a cost-effective analysis and a benefit-
cost analysis. It outlined how these methods could generally be applied to analysing the effectiveness
of waste crime enforcement actions. A reliable assessment relies on a well established baseline and
detailed associated data set. It is recommended that SEPA aim to enhance the reporting of waste
crime monitoring and enforcement in order to produce a more detailed data set. In particular, it is
recommended to support the acquisition of the following data:
Detail on the number of sites inspected per annum, how often they were visited and why sites
were visited;
Linear information for each site; if a site was found to be non-compliant at inspection how
long did it to take become compliant and through what actions;
Detailed costs associated with enforcement actions at each stage;
Richer waste stream data from all sites which are inspected.

OFFICIAL
21
OFFICIALOFFICIAL
Part 2: Costs and Benefits of Waste Crime
Enforcement in Scotland – Case Study Application
Introduction
Part 1 outlined the use of cost-effective and benefit-cost analysis in determining the effectiveness of
various regulatory actions for waste crime. Part 2 aims to extend this by applying benefit-cost analysis
to determine the benefits and costs of closing three waste crime sites in Scotland.
In 2014, Eunomia developed a model to examine the marginal benefit of an additional £5 million
increase of expenditure on waste crime enforcement in England and Wales12
. The primary assumption
underlying the model was that closing an illegal waste site (IWS) would result in waste previously
disposed of at that site re-entering the legal waste stream, thus accruing additional benefits to
government, businesses and the environment. The principle costs in the model were those related to
waste crime enforcement and monitoring needed to close an IWS. These included staff costs, business
overheads, legal costs, vehicle hire, science costs, excavation, and engineering costs. Benefits were
calculated based on the assumption that waste from the IWS would need to be removed from the
premises in order to enter the legal waste stream. The legal waste site would receive additional gate
fees, which in turn increases the legal sites profits. The Government benefits through additional
Landfill Tax revenue as well as receiving Corporation Tax and employment related taxes from the legal
waste site. By transferring waste into the legal sector it is expected there would be environmental
benefits in the form of reduced air and water pollution as legal waste sites are more likely to remain
compliant. The reporting year for the Eunomia model (applying to England and Wales) was 2013 with
results discounted over a ten year time horizon. The modelling scenario is summarised in Figure 1.
12 Eunomia (2014) Waste Crime, Tackling Britain’s Dirty Secret. Online:
http://www.esauk.org/esa_reports/ESAET_Waste_Crime_Tackling_Britains_Dirty_Secret_LIVE.pdf Accessed
12/10/2014.
OFFICIAL
22
OFFICIALOFFICIAL
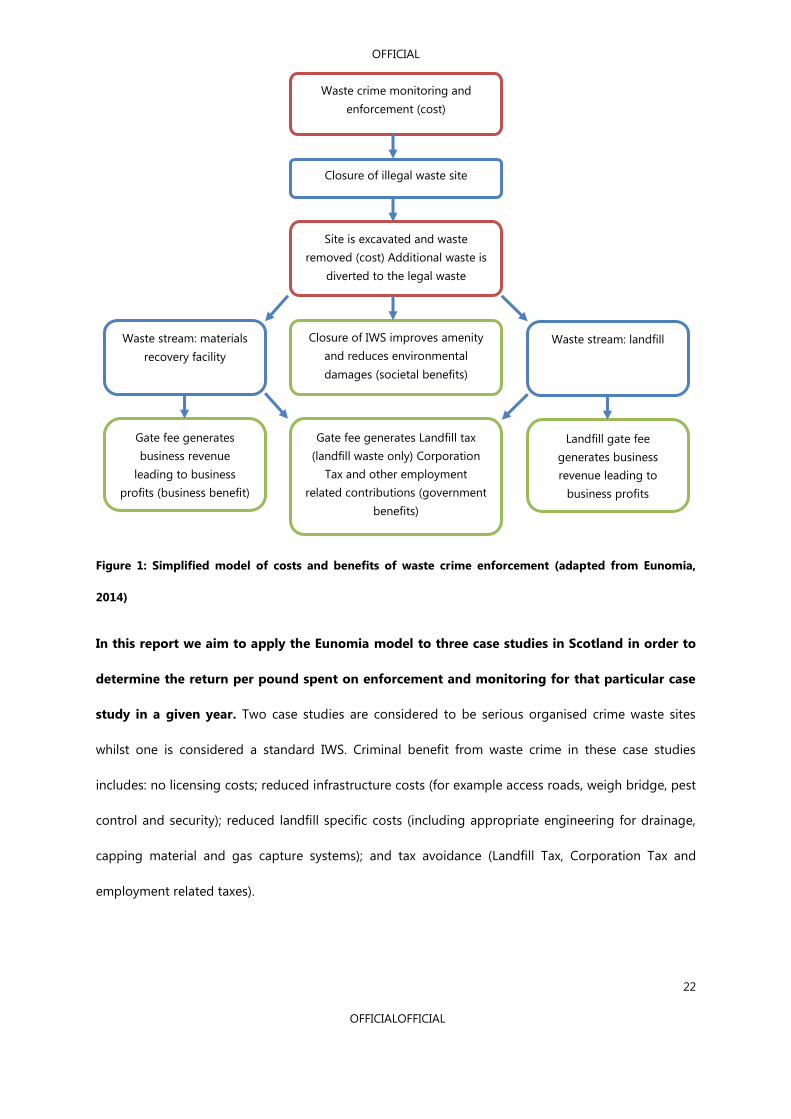
Figure 1: Simplified model of costs and benefits of waste crime enforcement (adapted from Eunomia,
2014)
In this report we aim to apply the Eunomia model to three case studies in Scotland in order to
determine the return per pound spent on enforcement and monitoring for that particular case
study in a given year. Two case studies are considered to be serious organised crime waste sites
whilst one is considered a standard IWS. Criminal benefit from waste crime in these case studies
includes: no licensing costs; reduced infrastructure costs (for example access roads, weigh bridge, pest
control and security); reduced landfill specific costs (including appropriate engineering for drainage,
capping material and gas capture systems); and tax avoidance (Landfill Tax, Corporation Tax and
employment related taxes).
Waste stream: materials
recovery facility
Waste crime monitoring and
enforcement (cost)
Closure of illegal waste site
Site is excavated and waste
removed (cost) Additional waste is
diverted to the legal waste
Closure of IWS improves amenity
and reduces environmental
damages (societal benefits)
Gate fee generates
business revenue
leading to business
profits (business benefit)
Gate fee generates Landfill tax
(landfill waste only) Corporation
Tax and other employment
related contributions (government
benefits)
Waste stream: landfill
Landfill gate fee
generates business
revenue leading to
business profits
(business benefit)

OFFICIAL
23
OFFICIALOFFICIAL
Eunomia Methodology and Relevant Extensions for the three Scottish Case Studies
A core aspect of the model is to determine the benefits based on the changes in the waste stream i.e.
identifying and removing waste from the IWS, transferring it to a legal waste site and determining the
waste type (Figure 2). The tonnage transferred between the sites forms the basis for the benefit
calculations. All monetary values detailed below are for 2013/14 and will need to be adjusted when
applied to different years.
Figure 2: Summary of waste stream data
Stage 1: Identification of Total Tonnage
The first stage of the model requires an estimate of the tonnage at the illegal waste site. The Eunomia
model, for England and Wales, applied a figure of 85.6% for the amount of waste which would need to
be excavated from the IWS and transported to a legal waste site, thus re-entering the waste stream.
This figure was based on Environment Agency data. For this report, where possible, the actual
tonnage at each waste site has been used.
Stage 2: Identification of the Waste Stream
The Eunomia report estimated that 73.1% of waste would be disposed of at a landfill site (64.3% lower
estimate, 85.4% upper estimate) based on AMEC Waste Crime reports13
. Legal landfill operators
charge a median gate fee of £21 per tonne. Waste entering landfill sites is either charged at £80 per
tonne (standard) or £2.50 per tonne for inert waste. Eunomia estimates that a minimum of 80% of the
13 AMEC Environment & Infrastructure UK Limited (2012) The Economic Impact of Illegal Waste, Report for
Environment Agency, December 2012
Total waste at the
IWS
Percentage of
waste the requires
removal
Percentage of
waste that is
subsequently sent
to landfill
Percentage of
waste charged at
the standard
Landfill Tax rate
OFFICIAL
24
OFFICIALOFFICIAL
waste is charged at the standard rate of £80 per tonne (90% median, 100% maximum). The report also
estimates that 35.7% (14.4% lower estimate, 35.5% upper estimate) of waste would be recycled at a
Materials Recovery Facility (MRF). The median MRF gate fee is £9 per tonne with no additional tax. For
this report, where possible, the actual tonnage of landfill waste versus recyclable has been estimated
for each of the Scottish case studies and used for the analysis.
Stage 3: Identification of Legal Site Operators Benefits
The legal operator’s revenue is based on the amount of waste entering the site and the relevant gate
fee (identified in Stage 2). The profit margin is estimated to be 5% of the total revenue based on
Apex’s (2013) Waste Market Insight report14
.
Stage 4: Identification of Government Benefits
Government benefits are received in the form of Landfill Tax, Corporation Tax and employment
benefits. The Landfill Tax is calculated based on the upper and lower bands that the waste stream falls
into (as detailed in Stage 2). The Corporation Tax is calculated as a proportion of revenue from the
legal waste supplier who now receives the gate fee. According to Environment Agency reports15
it will
take one year from an IWS closure to the government receiving benefits. As such, the tax rate should
be chosen based on the year after closure. For instance, if an IWS site would be closed in the
2013/2014 financial year, then the waste would not re-enter the legal waste stream until 2014/15
financial year, so a Corporation Tax rate of 21% would be used for the analysis16
. Additional taxes
arise in the form of employment taxes including employer and employee National Insurance
14 Apex Insight (2013) UK Waste Management – Market Insight Report, February 2013
15 Eunomia (2014) Waste Crime, Tackling Britain’s Dirty Secret. Online:
http://www.esauk.org/esa_reports/ESAET_Waste_Crime_Tackling_Britains_Dirty_Secret_LIVE.pdf. Accessed
12/10/2014.
16 HMRC (2014) Corporation Tax and Relief Rates. Online https://www.gov.uk/corporation-tax-rates. Accessed
12/10/2014.

OFFICIAL
25
OFFICIALOFFICIAL
contributions and Income Tax. According to the Eunomia report, 39.6% of the legal waste sites
revenue is spent on employment, with 28.4% of this figure going to the government in the form of
employment taxes.
Stage 5: Environmental Benefits
The environmental benefits estimated by Eunomia comprise of the reduced environmental damage
with the waste being removed from the IWS (£1.83 per tonne) and the reduction in disamenity (£6.02
per tonne). These figures are based on two reports submitted to Defra; one by Cambridge
Econometrics, Eftec and WRc regarding the Disamenity of Landfill in Great Britain and a second by
Enviros Consulting Ltd and EFTEC on the Costs and Benefits to Health of Waste Management
Options17,18
.
Stage 6: Estimation of Costs
Costs of monitoring, enforcement and closure of the IWS have been provided by SEPA for each of the
Scotland case studies. It is anticipated this will include costs related to staff time on the project,
overheads, vehicle hire, science costs, excavation, and engineering costs. The Eunomia figure of £7,591
marginal cost to close a waste site is not relevant for our case studies as SEPA have supplied the actual
costs associated with each waste site closure.
Stage 7: Benefit – Cost Calculation
According to Eunomia the benefits from closure of the IWS will take place one year after the site is
closed. Due to this the benefits are discounted by one year using the HM Treasury Green Book
17 Cambridge Econometrics, EFTEC, and WRc (2003) A Study to Estimate the Disamenity Costs of Landfill in Great
Britain, Report for DEFRA, February 2003.
18 Enviros Consulting Ltd, and EFTEC (2004) Valuation of the External Costs and Benefits to Health and
Environment of Waste Management Options, Report for the Department for Environment, Food and Rural Affairs,
December 2004.
OFFICIAL
26
OFFICIALOFFICIAL
recommended discount rate of 3.5% per annum19
. The preferred modelling scenario would take into
account changes in the waste stream over time and how much waste continues to be re-diverted into
the legal waste stream following the site closure allowing for analysis over a longer time horizon (the
Eunomia report uses 10 years). It is recognised that this is not possible for the Scottish case studies at
present as there is not sufficient data regarding changes in the waste stream over time.
19HM Treasury (2013) The Green Book: Appraisal and Valuation in Central Government. Online:
https://www.gov.uk/government/publications/the-green-book-appraisal-and-evaluation-in-central-governent.
Accessed 10/10/2014.
OFFICIAL
27
OFFICIALOFFICIAL
Model Application and Results
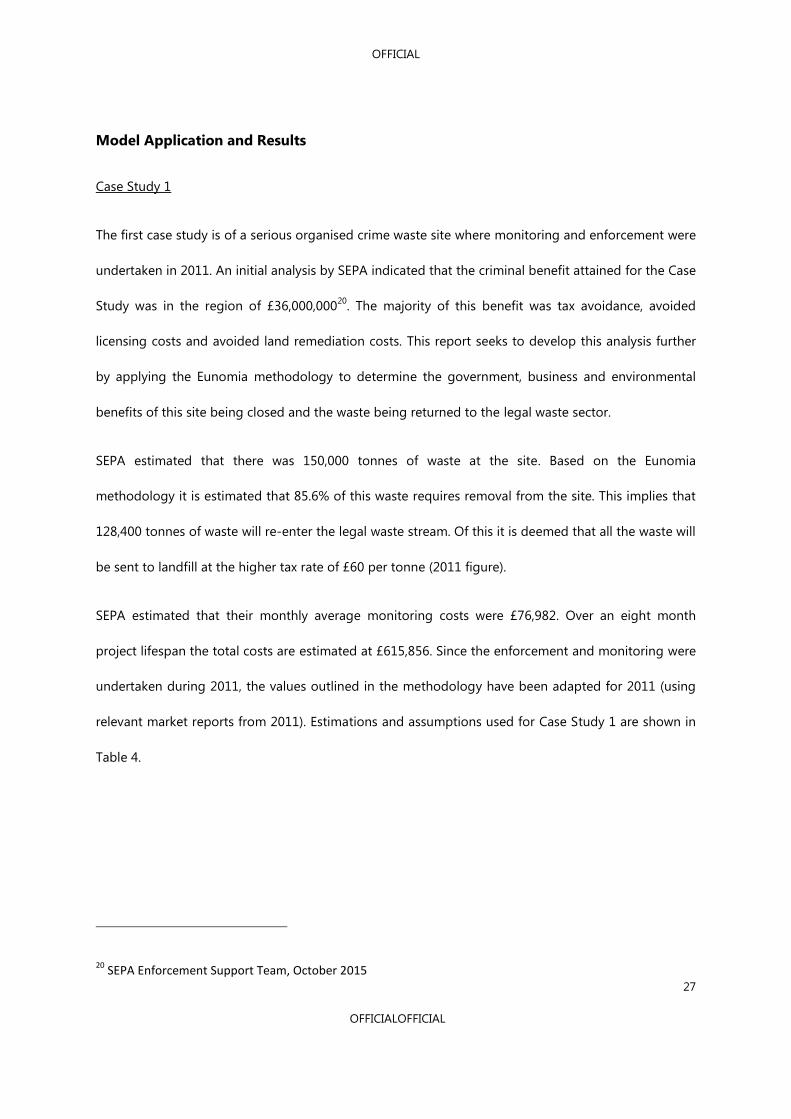
Case Study 1
The first case study is of a serious organised crime waste site where monitoring and enforcement were
undertaken in 2011. An initial analysis by SEPA indicated that the criminal benefit attained for the Case
Study was in the region of £36,000,00020
. The majority of this benefit was tax avoidance, avoided
licensing costs and avoided land remediation costs. This report seeks to develop this analysis further
by applying the Eunomia methodology to determine the government, business and environmental
benefits of this site being closed and the waste being returned to the legal waste sector.
SEPA estimated that there was 150,000 tonnes of waste at the site. Based on the Eunomia
methodology it is estimated that 85.6% of this waste requires removal from the site. This implies that
128,400 tonnes of waste will re-enter the legal waste stream. Of this it is deemed that all the waste will
be sent to landfill at the higher tax rate of £60 per tonne (2011 figure).
SEPA estimated that their monthly average monitoring costs were £76,982. Over an eight month
project lifespan the total costs are estimated at £615,856. Since the enforcement and monitoring were
undertaken during 2011, the values outlined in the methodology have been adapted for 2011 (using
relevant market reports from 2011). Estimations and assumptions used for Case Study 1 are shown in
Table 4.
20 SEPA Enforcement Support Team, October 2015

OFFICIAL
28
OFFICIALOFFICIAL
Table 4: Modelling estimations, Case Study 1
Waste Stream Data / Figures Value
1 Illegal waste site tonnage 150,000 150,000
2 Percentage of waste from IWS that requires removal 85.6% 128,400
3 Waste that is land filled 100% 128,400
5 Waste that is recycled 0.0% 0.00
Land filled Waste
6 Gate fees from landfill (per tonne) £20.00 £2,568,000
7 Corporation Tax 20% £513,600
8 Revenue spent on employment costs 39.6% £1,016,928
9 NIC and Income Tax 28.4% £288,808
10 Profits 5.0% £128,400
11 Landfill tax rate (per tonne) £60.00 £7,704,000
Environmental Benefit
12 Disamenity with illegal site (per tonne) £5.85 £751,140
13 Reduced environmental damage associated with waste being sent
to landfill rather than being in an illegal waste site (per tonne) £1.78 £228,552
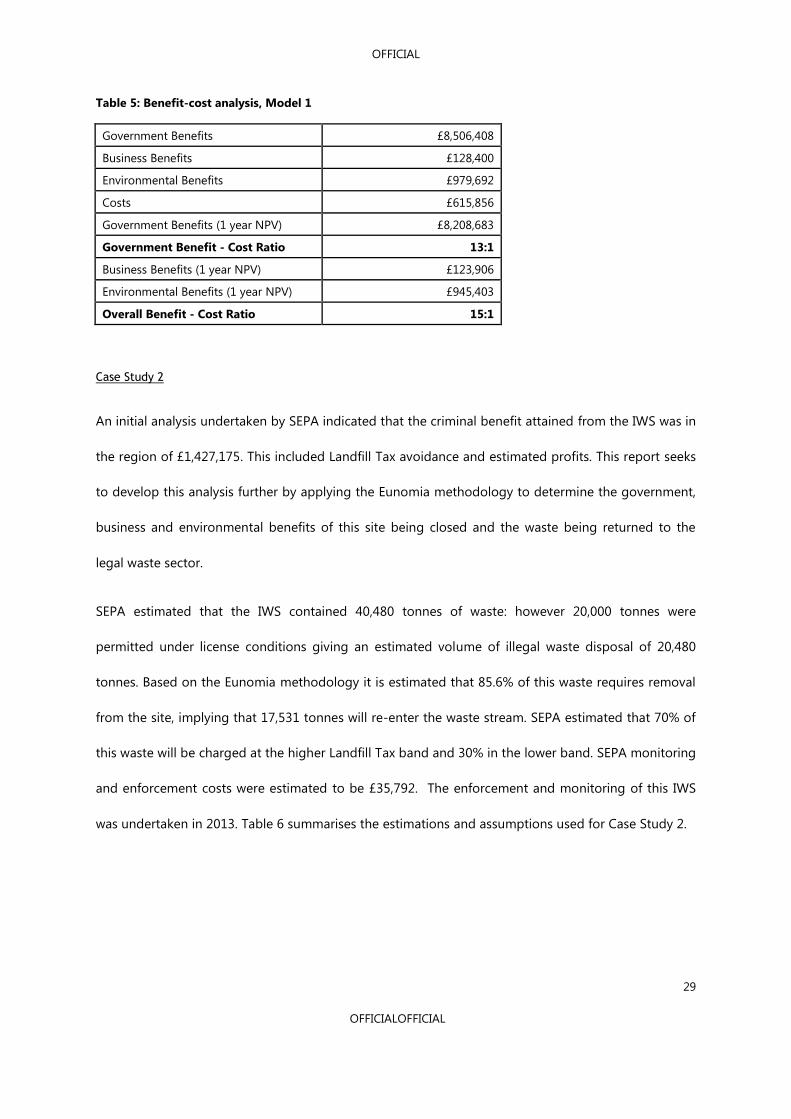
Table 5 summarises the modelling results, outlining the key impacts to the government, businesses
and wider society. The benefit to the government of the closed site is estimated at a £8,208,683 return
in the form of increased Landfill Tax and other taxation with a benefit-cost ratio of 13:1 (one pound
spent on enforcement has yielded a £13.33 return). Taking into account business and environmental
benefits, this increases to a marginal return of £15.26.
OFFICIAL
29
OFFICIALOFFICIAL
Table 5: Benefit-cost analysis, Model 1
Government Benefits £8,506,408
Business Benefits £128,400
Environmental Benefits £979,692
Costs £615,856
Government Benefits (1 year NPV) £8,208,683
Government Benefit - Cost Ratio 13:1
Business Benefits (1 year NPV) £123,906
Environmental Benefits (1 year NPV) £945,403
Overall Benefit - Cost Ratio 15:1
Case Study 2
An initial analysis undertaken by SEPA indicated that the criminal benefit attained from the IWS was in
the region of £1,427,175. This included Landfill Tax avoidance and estimated profits. This report seeks
to develop this analysis further by applying the Eunomia methodology to determine the government,
business and environmental benefits of this site being closed and the waste being returned to the
legal waste sector.
SEPA estimated that the IWS contained 40,480 tonnes of waste: however 20,000 tonnes were
permitted under license conditions giving an estimated volume of illegal waste disposal of 20,480
tonnes. Based on the Eunomia methodology it is estimated that 85.6% of this waste requires removal
from the site, implying that 17,531 tonnes will re-enter the waste stream. SEPA estimated that 70% of
this waste will be charged at the higher Landfill Tax band and 30% in the lower band. SEPA monitoring
and enforcement costs were estimated to be £35,792. The enforcement and monitoring of this IWS
was undertaken in 2013. Table 6 summarises the estimations and assumptions used for Case Study 2.
OFFICIAL
30
OFFICIALOFFICIAL
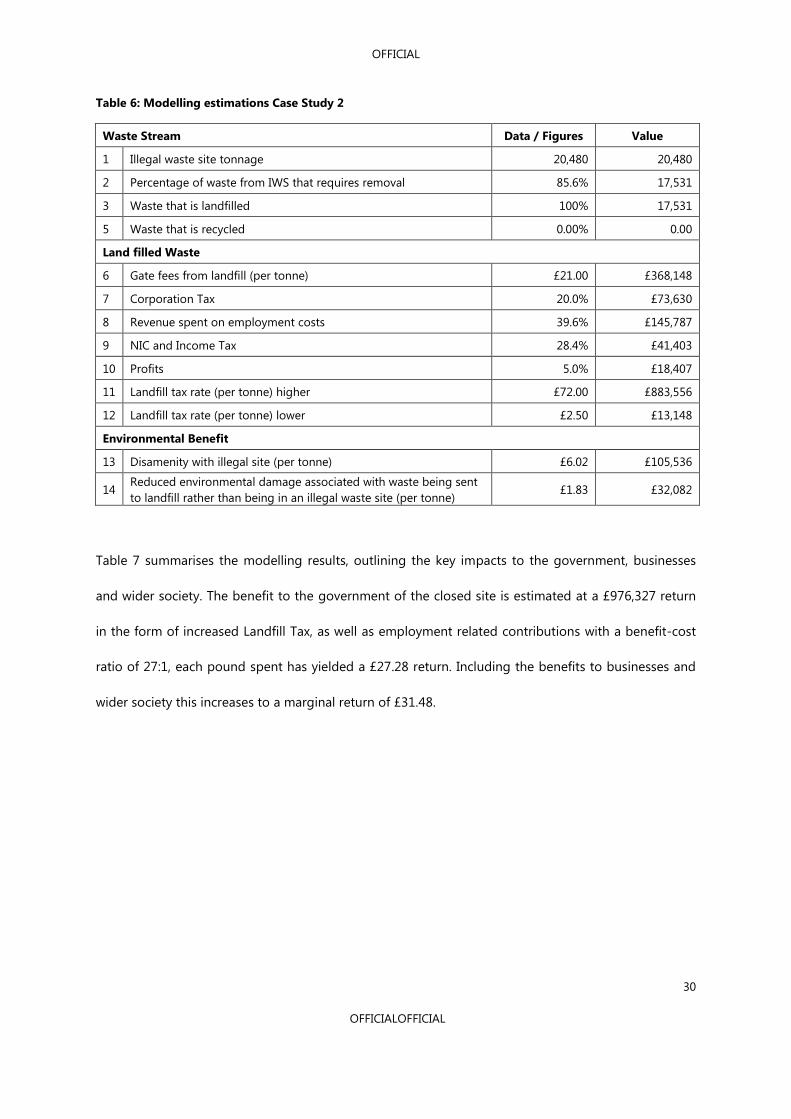
Table 6: Modelling estimations Case Study 2
Waste Stream Data / Figures Value
1 Illegal waste site tonnage 20,480 20,480
2 Percentage of waste from IWS that requires removal 85.6% 17,531
3 Waste that is landfilled 100% 17,531
5 Waste that is recycled 0.00% 0.00
Land filled Waste
6 Gate fees from landfill (per tonne) £21.00 £368,148
7 Corporation Tax 20.0% £73,630
8 Revenue spent on employment costs 39.6% £145,787
9 NIC and Income Tax 28.4% £41,403
10 Profits 5.0% £18,407
11 Landfill tax rate (per tonne) higher £72.00 £883,556
12 Landfill tax rate (per tonne) lower £2.50 £13,148
Environmental Benefit
13 Disamenity with illegal site (per tonne) £6.02 £105,536
14 Reduced environmental damage associated with waste being sent
to landfill rather than being in an illegal waste site (per tonne) £1.83 £32,082
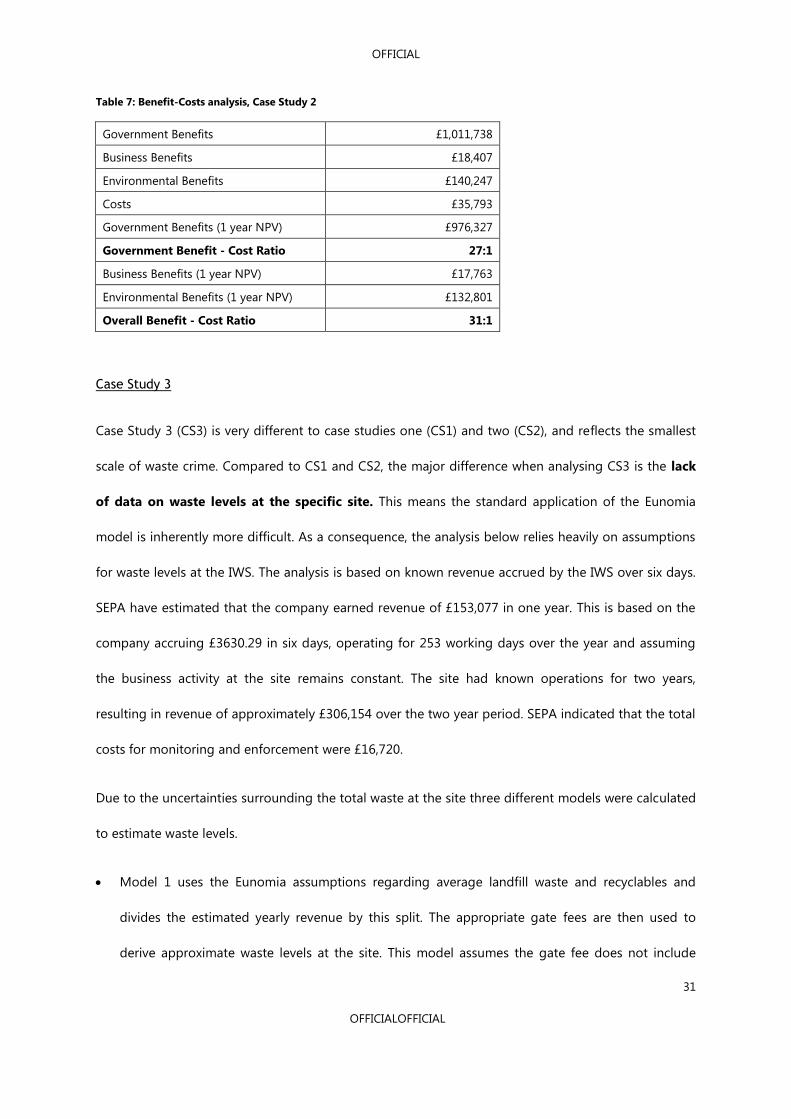
Table 7 summarises the modelling results, outlining the key impacts to the government, businesses
and wider society. The benefit to the government of the closed site is estimated at a £976,327 return
in the form of increased Landfill Tax, as well as employment related contributions with a benefit-cost
ratio of 27:1, each pound spent has yielded a £27.28 return. Including the benefits to businesses and
wider society this increases to a marginal return of £31.48.
OFFICIAL
31
OFFICIALOFFICIAL
Table 7: Benefit-Costs analysis, Case Study 2
Government Benefits £1,011,738
Business Benefits £18,407
Environmental Benefits £140,247
Costs £35,793
Government Benefits (1 year NPV) £976,327
Government Benefit - Cost Ratio 27:1
Business Benefits (1 year NPV) £17,763
Environmental Benefits (1 year NPV) £132,801
Overall Benefit - Cost Ratio 31:1
Case Study 3
Case Study 3 (CS3) is very different to case studies one (CS1) and two (CS2), and reflects the smallest
scale of waste crime. Compared to CS1 and CS2, the major difference when analysing CS3 is the lack
of data on waste levels at the specific site. This means the standard application of the Eunomia
model is inherently more difficult. As a consequence, the analysis below relies heavily on assumptions
for waste levels at the IWS. The analysis is based on known revenue accrued by the IWS over six days.
SEPA have estimated that the company earned revenue of £153,077 in one year. This is based on the
company accruing £3630.29 in six days, operating for 253 working days over the year and assuming
the business activity at the site remains constant. The site had known operations for two years,
resulting in revenue of approximately £306,154 over the two year period. SEPA indicated that the total
costs for monitoring and enforcement were £16,720.
Due to the uncertainties surrounding the total waste at the site three different models were calculated
to estimate waste levels.
Model 1 uses the Eunomia assumptions regarding average landfill waste and recyclables and
divides the estimated yearly revenue by this split. The appropriate gate fees are then used to
derive approximate waste levels at the site. This model assumes the gate fee does not include
OFFICIAL
32
OFFICIALOFFICIAL
Landfill Tax which is why a company may deposit waste with them as they are cheaper than legal
sites. This gives an estimate of total waste at the site between 17,417 and 21,518 tonnes.
Model 2 is a cruder estimation, presuming that all waste on the site would be landfill waste. It also
assumes that the company depositing at the site believes the site is legal and is charged Landfill
Tax, alongside the standard gate fee. This gives a lower estimate of waste at the site of 3,031
tonnes.
Model 3 is similar to Model 2 by presuming all waste at the site was destined for landfill. However
it assumes the company depositing waste is aware the site is illegal and does not pay Landfill Tax.
Therefore, approximate waste is calculated using revenue and gate fees alone. This gives an
estimate of waste at the site of 14,579 tonnes.
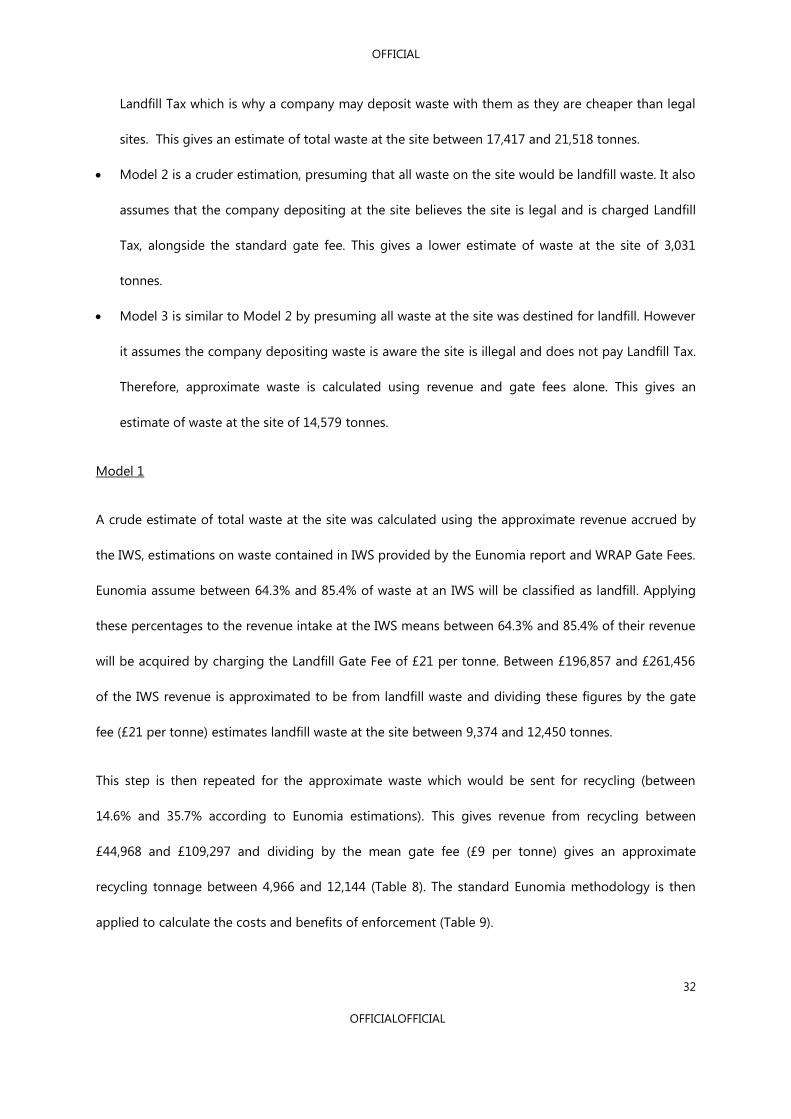
Model 1
A crude estimate of total waste at the site was calculated using the approximate revenue accrued by
the IWS, estimations on waste contained in IWS provided by the Eunomia report and WRAP Gate Fees.
Eunomia assume between 64.3% and 85.4% of waste at an IWS will be classified as landfill. Applying
these percentages to the revenue intake at the IWS means between 64.3% and 85.4% of their revenue
will be acquired by charging the Landfill Gate Fee of £21 per tonne. Between £196,857 and £261,456
of the IWS revenue is approximated to be from landfill waste and dividing these figures by the gate
fee (£21 per tonne) estimates landfill waste at the site between 9,374 and 12,450 tonnes.
This step is then repeated for the approximate waste which would be sent for recycling (between
14.6% and 35.7% according to Eunomia estimations). This gives revenue from recycling between
£44,968 and £109,297 and dividing by the mean gate fee (£9 per tonne) gives an approximate
recycling tonnage between 4,966 and 12,144 (Table 8). The standard Eunomia methodology is then
applied to calculate the costs and benefits of enforcement (Table 9).
OFFICIAL
33
OFFICIALOFFICIAL
There is one key concern associated with Model 1. Total revenue is made up of between 64% and 83%
from landfill waste based on the Eunomia method. Working these calculations through gives a much
greater tonnage of recycled waste compared to landfill, i.e., the central estimate is 10,000 tonnes of
landfill waste and 9000 tonnes of potentially recycled waste. Based on the Eunomia model, the central
estimate should be 70% landfill to 30% recycled.
Table 8: Waste Approximation, Model 1 Case Study 3
Approximate Known Revenue £306,154
Landfill Gate Fee (per tonne) £21
MRF Gate Fee (per tonne) £9
Min Central Max
Landfill Waste (LW) Revenue £196,857 £223,799 £261,456
Approximate Tonnage (LW Revenue/LW Gate Fee) 9,374 10,657 12,450
Recyclable Revenue £109,297 £82,355 £44,698
Approximate MRF Tonnage 12,144 9,151 4,966
Approximate Total Waste at Site (tonnes) 21,518 19,808 17,417

OFFICIAL
34
OFFICIALOFFICIAL
Table 9: Benefit-cost analysis results, Model 1 , Case Study 3
Waste Stream Data /
Figures Min Central Max
1 Illegal waste site tonnage 21,518 19,808 17,417
2 Waste that is land filled 9,374 10,657 12,450
3 Waste that is recycled 12,144 9,151 4,966
Land filled Waste
6 Gate fees from landfill (per tonne) £21.00 £196,857 £223,799 £261,456
7 Corporation Tax 20.0% £39,371 £44,760 £52,291
8 Revenue spent on employment costs 39.6% £77,955 £88,624 £103,536
9 NIC and Income Tax 28.4% £22,139 £25,169 £29,404
10 Profits 5.0% £9,843 £11,190 £13,073
11 Landfill tax rate (per tonne) higher £72.00 £674,938 £767,309 £896,419
Recycled Waste
12 Gate Fees from Recycled waste (per tonne) £9.00 £109,297 £82,355 £44,698
13 Corporation Tax 20.0% £2,429 £1,830 £993
14 Revenue spent on employment costs 39.6% £4,809 £3,624 £1,967
15 NIC and Income Tax 28.4% £1,366 £1,029 £559
16 Profits 5.0% £607 £458 £248
Environmental Benefit
12 Disamenity with illegal site (per tonne) £6.02 £129,538 £119,244 £104,850
13
Reduced environmental damage associated
with waste being sent to landfill rather than
being in an illegal waste site (per tonne)
£1.83 £17,154 £19,502 £22,784
Benefit Cost Calculations
Government Benefits £740,244 £840,098 £979,666
Business Benefits £10,450 £11,647 £13,321
Environmental Benefits £146,693 £138,746 £127,634
Costs £35,793 £35,793 £35,793
Government Benefits (1 year NPV) £714,335 £810,694 £945,378
Government Benefit – Cost Ratio 20:1 23:1 26:1
Business Benefits (1 year NPV) £10,084 £11,240 £12,855
Environmental Benefits (1 year NPV) £141,559 £133,890 £123,167
Overall Benefit – Cost Ratio 24:1 27:1 30:1
OFFICIAL
35
OFFICIALOFFICIAL
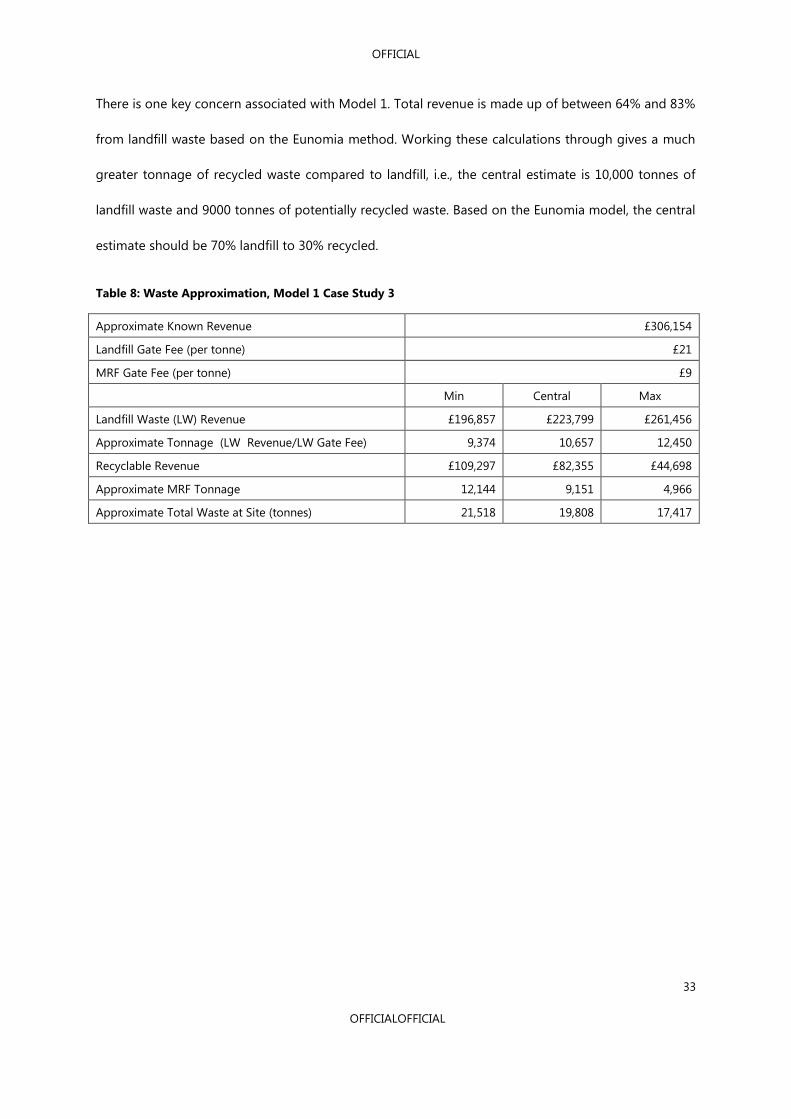
Model 2
Model 2 assumes that all the waste at the site is landfill and would be charged at the standard gate
fee of £21 per tonne. It also assumes that the waste carrier believes the site is legal and pays Landfill
Tax as part of the gate fee. The total waste at the site can therefore be calculated as:
The waste approximation for Model 2 is outlined in Table 10 and the benefit-costs calculations are
given in Table 11.
Table 10: Waste Approximation, Model 2, Case Study 3
Approximate known Revenue £306,154
Landfill Gate Fee (per tonne) £21.00
Landfill Tax Rate (per tonne) £80.00
Total charged to consumer £101.00
Approximate Tonnage (approximate known revenue /
total charged to consumer) 3031

OFFICIAL
36
OFFICIALOFFICIAL
Table 11: Benefit-cost analysis results, Model 2, Case Study 3
Waste Stream Data / Figures Min
1 Illegal waste site tonnage 3,031
2 Waste that is land filled 3,031
Land filled Waste
6 Gate fees from landfill (per tonne) £21.00 £63,656
7 Corporation Tax 20.0% £12,731
8 Revenue spent on employment costs 39.6% £25,208
9 NIC and Income Tax 28.4% £7,159
10 Profits 5.0% £3,183
11 Landfill tax rate (per tonne) higher £80.00 £218,248
Environmental Benefit
12 Disamenity with illegal site (per tonne) £6.02 £18,267
13
Reduced environmental damage associated with waste
being sent to landfill rather than being in an illegal
waste site (per tonne)
£1.83 £5,546
Benefit – Cost Ratio
Government Benefits £238,139
Business Benefits £3,183
Environmental Benefits £23,813
Costs £35,793
Government Benefits (1 year NPV) £229,804
Government Benefit - Cost Ratio 6:1
Business Benefits (1 year NPV) £3,071
Environmental Benefits (1 year NPV) £22,980
Overall Benefit - Cost Ratio 7:1
Model 3
Model 3 assumes that all the waste at the site is landfill and would be charged at standard gate fee of
£21 per tonne. It also assumes that the waste carrier knows the site is illegal and therefore does not
have to pay landfill tax. Therefore the waste at the site is calculated using the following equation:
OFFICIAL
37
OFFICIALOFFICIAL
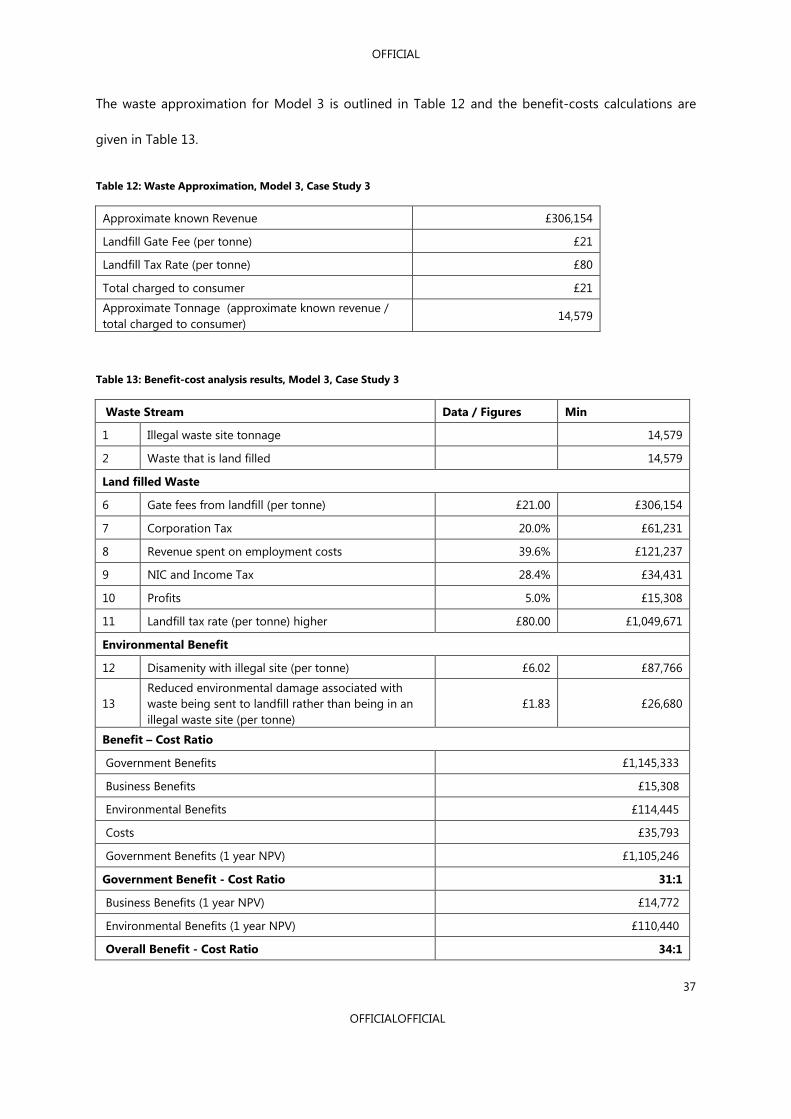
The waste approximation for Model 3 is outlined in Table 12 and the benefit-costs calculations are
given in Table 13.
Table 12: Waste Approximation, Model 3, Case Study 3
Approximate known Revenue £306,154
Landfill Gate Fee (per tonne) £21
Landfill Tax Rate (per tonne) £80
Total charged to consumer £21
Approximate Tonnage (approximate known revenue /
total charged to consumer) 14,579
Table 13: Benefit-cost analysis results, Model 3, Case Study 3
Waste Stream Data / Figures Min
1 Illegal waste site tonnage 14,579
2 Waste that is land filled 14,579
Land filled Waste
6 Gate fees from landfill (per tonne) £21.00 £306,154
7 Corporation Tax 20.0% £61,231
8 Revenue spent on employment costs 39.6% £121,237
9 NIC and Income Tax 28.4% £34,431
10 Profits 5.0% £15,308
11 Landfill tax rate (per tonne) higher £80.00 £1,049,671
Environmental Benefit
12 Disamenity with illegal site (per tonne) £6.02 £87,766
13
Reduced environmental damage associated with
waste being sent to landfill rather than being in an
illegal waste site (per tonne)
£1.83 £26,680
Benefit – Cost Ratio
Government Benefits £1,145,333
Business Benefits £15,308
Environmental Benefits £114,445
Costs £35,793
Government Benefits (1 year NPV) £1,105,246
Government Benefit - Cost Ratio 31:1
Business Benefits (1 year NPV) £14,772
Environmental Benefits (1 year NPV) £110,440
Overall Benefit - Cost Ratio 34:1
OFFICIAL
38
OFFICIALOFFICIAL
There is a high degree of uncertainty around the benefit-cost calculations for CS3. The lack of finite
waste figures meant several assumptions were used to derive estimates of waste at the site. These
generated a benefit-cost ratio of between 7:1 and 34:1, depending on the model applied. Estimates of
waste at the site varied between 9,000 and 14,000 tonnes and based on discussions with SEPA it is
unlikely that there is this amount of waste at the site currently. This implies that the waste has either
been treated or disposed of correctly, or illegally dumped elsewhere. Also, there is likely to be a mix of
material at the site; some landfill waste, some recycling and other valuable materials which would have
been extracted. Ultimately there is too much conjecture in this case study for the results to be treated
in a reliable and robust manner.
Discussion
The benefit-cost ratios of 15:1 and 31:1 for case studies one and two, respectively, are substantially
higher than the benefit-cost ratio of increased spending on waste crime enforcement in the Eunomia
report (4:1). However, the Eunomia report covers a wide variety of waste crime throughout England
and Wales and this generates an average value which takes into account all waste crimes from the
minor through to more serious cases. The case by case methodology used in this report offers a
different perspective to the Eunomia report and focuses on the most serious sites. The scale of the
results highlight the serious nature of the “invisible problem” that is waste crime.
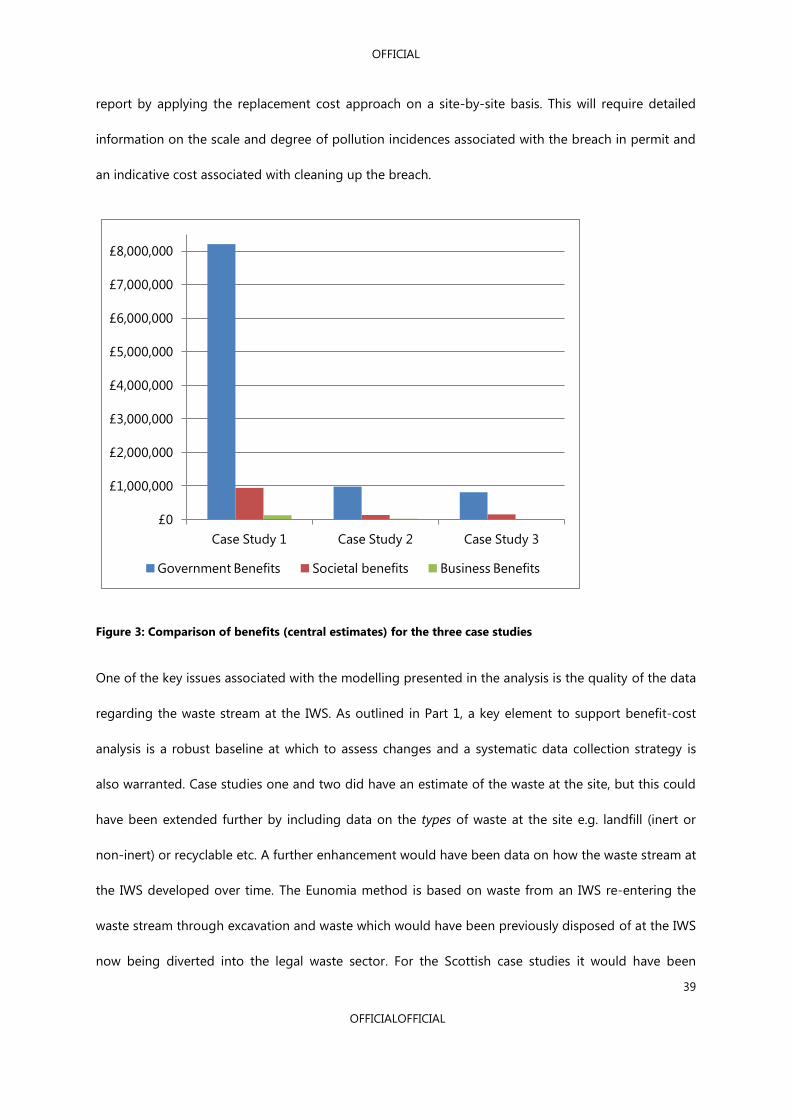
The greatest benefit that the government can derive from closing an illegal waste site (IWS) is in terms
of tax revenues from Landfill Tax, Corporation Tax and employment related taxes (Figure 4). Societal
and business benefits are significantly smaller than government benefits when using the Eunomia
modelling approach. Part 1 of this report recommends analysing the societal benefits in terms of the
“replacement cost approach”. This approach is based on the assumption that, if people incur costs to
replace damages caused for example by pollution, then a cleaner environment must be worth at least
what people paid to restore it. There is potential to expand the benefit-cost modelling in Part 2 of the
OFFICIAL
39
OFFICIALOFFICIAL
report by applying the replacement cost approach on a site-by-site basis. This will require detailed
information on the scale and degree of pollution incidences associated with the breach in permit and
an indicative cost associated with cleaning up the breach.
£0
£1,000,000
£2,000,000
£3,000,000
£4,000,000
£5,000,000
£6,000,000
£7,000,000
£8,000,000
Case Study 1 Case Study 2 Case Study 3
Government Benefits Societal benefits Business Benefits
Figure 3: Comparison of benefits (central estimates) for the three case studies
One of the key issues associated with the modelling presented in the analysis is the quality of the data
regarding the waste stream at the IWS. As outlined in Part 1, a key element to support benefit-cost
analysis is a robust baseline at which to assess changes and a systematic data collection strategy is
also warranted. Case studies one and two did have an estimate of the waste at the site, but this could
have been extended further by including data on the types of waste at the site e.g. landfill (inert or
non-inert) or recyclable etc. A further enhancement would have been data on how the waste stream at
the IWS developed over time. The Eunomia method is based on waste from an IWS re-entering the
waste stream through excavation and waste which would have been previously disposed of at the IWS
now being diverted into the legal waste sector. For the Scottish case studies it would have been
OFFICIAL
40
OFFICIALOFFICIAL
worthwhile knowing whether waste was re-diverted and if so how much and over what time scale. This
would have allowed sensitivity analysis to be undertaken over a longer time period. It is also
recognised that one of the limitations when applying the Eunomia model to the Scottish case studies
is the fact that the waste has remained at the IWS and has not yet been removed. However, the
benefit-cost ratio is still useful and provides an indication of the benefits that accrue from closing the
IWS and re-diverting all future waste into the legal waste stream.
A further refinement of the model would have been the inclusion of excavation and haulage costs
associated with the removal of waste from an IWS and transport to a legal waste site. It is recognised
that there would be costs associated with this for the regulator, but there would also be benefits for
the haulage company. These figures were not included in the analysis but were included in the model
outline (see Figure 1).
From case study three it is clear that monitoring is incomplete for a smaller IWS and sites which do
not require a permit. The data provided for the analysis was based heavily on estimations from one
revenue figure based on one week in two years. A lack of data makes it inherently difficult to compare
across case studies and enforcement approaches. Where possible, more detail would be required on
the waste at the site and the associated waste streams to allow reliable and robust comparisons to be
made.
An improvement in data collection and reporting would allow future cost-effective analysis and
benefit-cost analysis, such as those outlined in Part 1 of the report, to be conducted more efficiently
and robustly. If SEPA is aiming to compare future enforcement programmes, more systematic data
collection would be required on (i) number of inspections, (ii) the number of warning letters and
notices received by each waste site, as well as (iii) detail on the waste stream at sites. The ideal
scenario, from an economic modelling perspective is that all sites would be visited once per annum.
Theoretically, this increases the willingness of sites to comply with regulation as the risk of being

OFFICIAL
41
OFFICIALOFFICIAL
found to be breaking the law is higher. This follows the recommendations in the Eunomia report, “the
reduction of waste crime through greater deterrence must be at the heart of any set of
recommendations... the prospect of being investigated and ultimately prosecuted can heavily offset
the perceived profitability of an illegal waste activity”21
. If there were data available on the number of
inspections prior to the set annual inspections and associated compliance information, it would be
possible to determine the actual effect of annual inspection on compliance.
Conclusion and Key Recommendations
This report has aimed to 1) provide an introduction to cost-effective and benefit-cost analysis and
illustrate how these tools could be applied to compare four enforcement actions for waste crime:
inspections, final warning letters, notices and referrals to the Procurator Fiscal and 2) apply a benefit-
cost analysis to determine the costs and benefits of waste crime enforcement for three separate
Scottish Case studies.
Benefit-cost analysis for case studies one and two derived marginal returns of enforcement of £15.26
and £31.48 respectively. The greatest benefits of increased enforcement were to the government in
terms of increased Landfill Tax and other employment related taxes. Additional benefits accrued to
legal waste site operators in the form of increased profits and for wider society in terms of improved
environmental conditions.
In both Parts 1 and 2 of the report the key recommendation was that reliable assessment relies on a
well established baseline and a detailed associated data set. It is recommended that SEPA aims to
enhance its reporting of waste crime monitoring and enforcement to allow future cost-effective and
benefit-cost analyses to be conducted more efficiently and robustly.
21 Eunomia (2014) Waste Crime, Tackling Britain’s Dirty Secret. Online:
http://www.esauk.org/esa_reports/ESAET_Waste_Crime_Tackling_Britains_Dirty_Secret_LIVE.pdf. Accessed
12/10/2014.

OFFICIAL
42
OFFICIALOFFICIAL
Recommendations for future data collection include:
Waste stream data: for all waste sites (legal and illegal) a comprehensive estimate of tonnage
at the site and the types of waste at the site e.g. landfill (inert or non-inert) or recyclable etc. If
possible an annual assessment of the waste stream at each site and how these changes would
further enhance future analysis and allow more reliable and robust comparisons to be made
between sites.
If SEPA is aiming to compare future enforcement programmes, more systematic data
collection would be required on (i) number of inspections, (ii) the number of warning letters
and notices received by each waste site, as well as (iii) detail on the waste stream at sites. For
example:
o Additional detail regarding the number of sites inspected per annum, how often they
were visited and why sites were visited.
o Linear information for each non-compliant site; if a site was found to be non-
compliant at inspection how long did it to take become compliant and through what
actions.
o Detailed costs associated with enforcement actions at each stage of the regulatory
process.
o Richer waste stream data from all sites which are inspected.

![Hate Crime and Public Order (Scotland) Bill › - › media › files › ... · Hate Crime and Public Order (Scotland) Bill [AS INTRODUCED] An Act of the Scottish Parliament to make](https://static.fdocuments.us/doc/165x107/5f0419867e708231d40c5140/hate-crime-and-public-order-scotland-bill-a-a-media-a-files-a-.jpg)