An Economic Analysis on The Social Cost of.docx (updated 1)
22
Munich Personal RePEc Archive An Economic Analysis on The Social Cost of Illegal Immigration Van, Germinal and Orellana, Jose George Washington University, George Mason University 31 August 2021 Online at https://mpra.ub.uni-muenchen.de/109519/ MPRA Paper No. 109519, posted 02 Sep 2021 11:48 UTC
Transcript of An Economic Analysis on The Social Cost of.docx (updated 1)

Munich Personal RePEc Archive
An Economic Analysis on The Social
Cost of Illegal Immigration
Van, Germinal and Orellana, Jose
George Washington University, George Mason University
31 August 2021
Online at https://mpra.ub.uni-muenchen.de/109519/
MPRA Paper No. 109519, posted 02 Sep 2021 11:48 UTC

An Economic Analysis
on The Social Cost of Illegal Immigration
An Empirical Analysis
by
GERMINAL G. VAN
[email protected] The George Washington University
2121 I Street NW Washington, D.C. 20052
&
JOSE ORELLANA
[email protected] The George Mason University
Department of Economics Buchanan Hall, 1st Floor, MSN 3GA
Fairfax, Virginia 22030

Germinal G. Van & Jose Orellana
2
Abstract
The purpose of this paper is to analyze the economic cost of illegal immigration in the United States since the 1990s and its consequences on American society. Indeed, illegal immigration has been a major topic of discussion among the main social issues during election cycles in the United States. Those who lean more conservative have argued that illegal immigration is an externality that increases social costs. They argue that illegal immigrants increase the cost of healthcare, public education, and welfare programs such as Medicaid and food stamps. And the cost falls on the American taxpayer. Those who lean more liberal argue that the government should create social programs to assist illegal immigrants in helping them adjusting and conforming their immigration status to the laws and customs of the United States. This paper has two objectives: (1) to determine if illegal immigration imposes a higher social cost on the American taxpayer based on a multivariate regression analysis, (2) to propose recommendations to help the illegal immigrants becoming legal while minimizing the future social cost of illegal immigration on the American taxpayer. Our findings show that there is a correlational relationship between illegal immigration and the cost of social welfare, and this correlational relationship is of strong magnitude. Keywords: Econometrics, Economic Analysis, Applied Economics, Econometric Modelling,
Multivariate Regression Analysis, Statistical Modelling, Immigration Economics, Immigration
Policy, Policy Analysis
JEL: C01, C10, C31, J68

Germinal G. Van & Jose Orellana
3
1. INTRODUCTION
Since the presidency of George W. Bush, illegal immigration has been a “hot” topic to discuss among all the social issues in the political climate. The United States today contains 47 million immigrants.1 These 47 million include lawful and unlawful immigrants living on American soil. It is first and foremost important to remind the public that the United States is a country principally founded on immigration, by immigrants. It is a melting-pot, a heterogeneous society where immigrants from all over the world have settled and contributed to the economic, social, and political development of the United States. What makes the United States a “nation” is the U.S. Constitution, the laws and customs that every immigrant agrees to abide by when settling here. As
we could see in figure 1, the U.S. immigrant population has soared since the 1970s.
Figure 1. Source: Migration Policy Institute
The surge of immigration in the United States since the 1970s is a double-edged sword. On the one hand, immigration has allowed people to pursue an education in America and live the American Dream. On the other hand, the growing immigrant population has also encouraged illegal immigration to become part of the woes of the American social order. Indeed, since the 2000s, illegal immigration has substantially grown and became a major concern for many Americans. Democrats and Republicans have starkly different priorities when it comes to U.S. immigration policies.2 According to a Pew Research Center study published in 2019, two-thirds of Americans say that it is very or somewhat important to establish a way for most immigrants in
the country illegally to remain here legally.3
1 U.S. Department of Homeland Security (2020). 2 Daniller, Andrew. (2019). “Americans’ Immigration Policy Priorities: Division Between—and within—the two parties.” Pew Research Center. 3 Ibid. (2019).
0.00
5.00
10.00
15.00
20.00
25.00
30.00
35.00
40.00
45.00
50.00
1850
1860
1870
1880
1890
1900
1910
1920
1930
1940
1950
1960
1970
1980
1990
2000
2010
2020
Num
ber
of
Imm
igra
nts
(m
illi
ons
of
peo
ple
) U.S. Immigrant Population from 1850 to 2020
Number of Immigrants (millions of people)

Germinal G. Van & Jose Orellana
4
Figure 2. Source: Pew Research Center and Survey of U.S. Adults
Figure 3. Source: U.S. Department of Homeland Security
Republicans tend to be firm toward illegal immigration whereas Democrats generally more or less remain flexible. Those with conservative beliefs argue that illegal immigration is a real problem on the ground that illegal immigrants increase the social cost of the American taxpayer. To be
0
5
10
15
20
25
30
35
40
45
Increase securityalong U.S.-
Mexico border
Establish a wayfor immigrants
here to staylegally
Takes inrefugees
escaping fromwar and violence
Increasedeportations of
those in the U.S.illegally
Majorities in U.S. see increased border securities, path to legal status as important
immigration policy goals
Very Important somewhat important
not too important Not at all important
3
4
5
6
7
8
9
10
11
12
13
1990
1992
1994
1996
1998
2000
2002
2004
2006
2008
2010
2012
2014
2016
2018
2020
Estimated Unauthorized Immigrant Population from 1990 to 2020
Estimated Unauthorized Immigration Population (millionsof people)

Germinal G. Van & Jose Orellana
5
more precise, conservatives argue that illegal immigrants are free riders who take advantage of the U.S. social system to reap its benefits without contributing proportionally. Republicans and conservatives argue that illegal immigrants increase the cost of healthcare, public education, and welfare programs such as Medicaid and food stamps. Democrats and social liberals, on the other hand, argue that many of the illegal immigrants who live in the United States have can simply not be abruptly deported and separated from their families because, despite being illegal, they have been contributing to the economic growth of the country, and therefore deserve to stay. They argue that the government should create social programs to assist illegal immigrants in helping them adjusting and conforming their immigration status to the laws and customs of the United States. The growing issue of immigration has led Donald Trump to the White House in 2016, him who
promised to enforce a zero-tolerance policy on illegal immigration if elected.
Is there a correlational relationship between illegal immigration and the cost of social welfare in the American context? If yes, to what extent? If illegal immigration is not, however, correlated with the growing cost of social welfare in the United States, then what factor(s) trigger the cost of social welfare to augment? Our goal in this analysis is to determine, by using the multivariate regression analysis, if illegal immigration does impose a higher social cost on the American taxpayer and provide recommendations regarding how illegal immigration could be attenuated
whereby everyone could be better-off.
2. SPECIFICATION OF THE MODEL
In order to determine the correlational relationship between illegal immigration and the cost of social welfare, we decided to use the multivariate regression as the main model. This model will contain four dependent variables and one independent variable. All four dependent variables depend on the same independent variable. The independent variable in question is the illegal immigrant population. We are wondering how the illegal immigrant population is affecting (1) the total healthcare spending per capita, (2) the total Medicaid expenditures, (3) the cost of food stamps, and (4) total public education expenditure per pupil. However, to avoid any potential bias from the model, we added a couple of control variables. These control variables are the total U.S. immigrant population, the number of people covered by Medicaid, the number of people living below the poverty line, and unemployment rate. These control variables are added according to the circumstances of the individual equation at hand. Moreover, these control variables are held constant. Hence, our model could be written as the following system of four equations using the log-linear model of the multivariate regression: (1) ln 𝑌! = 𝛽"! + 𝛽!!𝑋! + 𝛽!#𝑋# + 𝜀! (2) ln 𝑌# = 𝛽"# + 𝛽#!𝑋! + 𝛽##𝑋# + 𝛽#$𝑋$ + 𝛽#%𝑋% + 𝜀# (3) ln 𝑌$ = 𝛽"$ + 𝛽$!𝑋! + 𝛽$#𝑋# + 𝛽$$𝑋$ + 𝜀$ (4) ln 𝑌% = 𝛽"% + 𝛽%!𝑋! + 𝛽%#𝑋# + 𝜀%
Where (X1) is the causal regression, represented by the illegal immigrant population, (X2) is the controlled variable, represented by the total U.S. immigrant population; (lnY1) is the first dependent variable, represented by the total healthcare spending per capita, (lnY2) is the second dependent variable, represented by the total Medicaid expenditures, and (lnY3) is the third dependent variable, represented by the cost of food stamps, and (lnY4) is the fourth dependent variable, represented by the total expenditures of public education per pupil.

Germinal G. Van & Jose Orellana
6
This model, however, could be written in a simpler and more compact form. First, we will have to convert the model into a matrix form in order to deduct its compact form. Thus, the model will
look like the following:
/ln 𝑌!ln 𝑌#ln 𝑌$ln 𝑌%0 + /𝛽"!𝛽"#𝛽"$𝛽"%0 + /
𝛽!! 𝛽!# 0 0𝛽#! 𝛽## 𝛽#$ 𝛽#%𝛽$! 𝛽$# 𝛽$$ 𝛽$%𝛽%! 𝛽%# 0 0 0 /𝑋!𝑋#𝑋$𝑋%0 + /
𝜀!𝜀#𝜀$𝜀%0 By applying basic matrix operations, we can finally write our log-linear model in its compact form
as: ln 𝑌& = 𝛽& + 𝛽𝑿𝟒 + 𝜀& For clarification purposes, X4 encapsulates the variable of interest (illegal immigrant population) as well as all the control variables included in each of the four equations. Moreover, X4 also
represents the regressor of each dependent variable (ln 𝑌!, ln 𝑌#, ln 𝑌$, ln 𝑌%) in the system of equations.
2.1. Unbiasedness of control variables
To determine the unbiasedness of the model, we ought to first capture the conditional mean independence. And to capture it, let us assume that the error term depends on X2, X3, X4, as follows: 𝜀& = 𝛾" + 𝛾#𝑋# + 𝛾$𝑋$ + 𝛾%𝑋% + 𝜐& Where 𝜐& has conditional mean = 0. We are assuming that 𝜀& and X2, X3, and X4 are correlated, therefore the estimate of 𝛽#, 𝛽$, and 𝛽% will be biased. However, in our case, the conditional mean
independence 𝜀& does not depend on X1i but only on X2i, X3i, X4i. Hence, we can rewrite the compact log-linear model by method of substitution: ln 𝑌& = 𝛽" + 𝛽!𝑋!& + 𝛽#𝑋#& + 𝛽$𝑋$& + 𝛽%𝑋%& + 𝜀& ln 𝑌& = 𝛽" + 𝛽%𝑋%& +𝛽#𝑋#& + 𝛽$𝑋$& + 𝛽%𝑋%& + 𝛾" + 𝛾#𝑋# + 𝛾$𝑋$ + 𝛾%𝑋% + 𝜐& ln 𝑌& =(𝛽" + 𝛾") + 𝛽!𝑋!& + (𝛽# + 𝛾#)𝑋#& + (𝛽$ + 𝛾$)𝑋$& + (𝛽% + 𝛾%)𝑋%& + 𝜐& Since 𝜐& has conditional mean = 0, the estimates of (𝛽" + 𝛾"), 𝛽!, (𝛽# + 𝛾#),(𝛽$ + 𝛾$), and (𝛽% + 𝛾%) are all unbiased. Therefore, we obtain an unbiased estimate of the causal coefficient of
interest, 𝛽!, but the coefficients on X2, X3, and X4 are only unbiased estimate of (𝛽# + 𝛾#), (𝛽$ + 𝛾$), (𝛽% + 𝛾%) not 𝛽#, 𝛽$, and 𝛽%. However, since X2i, X3i and X4i are only used as a control variable, our model is therefore unbiased.
2.2. Allocation of control variables
The control variables in our model will be used in different settings. That being said, some of the control variables may not be used in every equation of our model.
For equation (1) the control variable that will be used is the total U.S. immigrant population,
represented by X2.

Germinal G. Van & Jose Orellana
7
For equation (2) the control variables that will be used are the total U.S. immigrant population, represented by X2, the number of people covered by Medicaid, represented by X3; and the number
of people living below the poverty line, represented by X4.
For equation (3) the control variables that will be used are the total U.S. immigrant population, represented by X2; the number of people living below the poverty line, represented by X3; and
unemployment rate, represented by X4.
For equation (4) the control variable that will be used is the total U.S. immigrant population, represented by X2.
3. DATA
3.1. Data for the variable of interest and the control variables
a) Data for Variable of Interest
The dataset we built to test our hypothesis is a sample of 31 observations (n = 31) because the observations go from 1990 to 2020. Each data point represents a year within the timeframe. The data for our variable of interest were extracted from the U.S. Department of Homeland Security. These data analyzed the flux of illegal immigration since the early 1990s but gives a great emphasis on the 2000s. As we saw in figure 3, the illegal immigrant population substantially grew from 2000
to 2007 before it began to regularly fluctuate.
b) Data for Control Variables
As was aforementioned at the outset of our analysis, we are using a total of three control variables that are redistributed among the equations of our model. For the X2, which is the total U.S. immigrant population, we used the data from the Migration Policy Institute. This control variable is used in each of the four equations of our model.
For equation (2), X3, which is the number of people covered by Medicaid, the data was extracted from Kaiser Family Foundation. For X4, which is the number of people below the poverty line, the
data were extracted from the U.S. Census Bureau.
For equation (3), X3, which is the number of people below the poverty, is the same data we used for the second equation. For X4, which is the unemployment rate, the data were extracted from the
U.S. Bureau of Labor Statistics.
3.2. Data for the dependent variables
LnY1
The data for the healthcare expenditure per capita were extracted from the U.S. Department of Health and Human Services. In 2000, the American taxpayer paid about $6,800 on healthcare. In 2020, the average citizen pays about $11,730 in healthcare per year. The unit value is an estimated
dollar unit.
LnY2
The data for the total Medicaid Expenditures were also extracted from the U.S. Department of Health and Human Services. Total Medicaid expenditures in 2000 were about 206 billion. Today, in 2020, the cost of Medicaid has tripled.

Germinal G. Van & Jose Orellana
8
LnY3
Total Medicaid expenditures are about $639 billion. The unit value of the data is estimated in billions of dollars. The data for the cost of food stamps were extracted from the Supplemental Nutrition Assistance Program (SNAP), and the unit value is measured in billions of dollars. In 2000, the total cost of food stamps was $17 billion. Today, in 2020, the cost is $79 billion.
LnY4
Lastly, the data for the total public education expenditures per pupil were extracted from National Center for Education Statistics. The unit value was measured in dollar units. In 2000, public education expenditures per pupil were estimated at $12,201. In 2020, public education expenditures per pupil were estimated at $14,729. A growth of about $2500 overall was made
during those 2020 years.
4. DESCRIPTIVE STATISTICS
Table 1 shows the descriptive statistics of the dependent variables:
LN Healthcare Spending
per Capita
Ln Total Medicaid
Expenditures
Ln Total Cost of Food
Stamps
LN Public school
expenditure per pupil
Mean 8.71116838 Mean 5.63783231 Mean 10.4793546 Mean 9.45449943
Standard
Error 0.07569078
Standard
Error 0.11081968
Standard
Error 0.10528683
Standard
Error 0.02311141
Median 8.77256119 Median 5.75289005 Median 10.3440627 Median 9.50144159
Mode #N/A Mode #N/A Mode #N/A Mode 9.25646031
Standard
Deviation 0.42142844
Standard
Deviation 0.61701788
Standard
Deviation 0.58621225
Standard
Deviation 0.12867891
Sample
Variance 0.17760193
Sample
Variance 0.38071107
Sample
Variance 0.34364481
Sample
Variance 0.01655826
Kurtosis -1.279247 Kurtosis -0.4995451 Kurtosis -1.6629428 Kurtosis -1.3485283
Skewness -0.1636604 Skewness -0.5400071 Skewness 0.21617884 Skewness -0.5137423
Range 1.40588661 Range 2.18857001 Range 1.63750442 Range 0.35205198
Minimum 7.95261511 Minimum 4.27944005 Minimum 9.64712713 Minimum 9.25646031
Maximum 9.35850172 Maximum 6.46801005 Maximum 11.2846315 Maximum 9.60851228
Sum 270.04622 Sum 174.772802 Sum 324.859994 Sum 293.089482
Count 31 Count 31 Count 31 Count 31
Largest (1) 9.35850172 Largest (1) 6.46801005 Largest (1) 11.2846315 Largest (1) 9.60851228
Smallest
(1) 7.95261511
Smallest
(1) 4.27944005
Smallest
(1) 9.64712713
Smallest
(1) 9.25646031
Confidence
Level
(95.0%)
0.1545812 Confidence
Level
(95.0%)
0.22632399 Confidence
Level
(95.0%)
0.21502439 Confidence
Level
(95.0%)
0.0471998
Table 1

Germinal G. Van & Jose Orellana
9
Table 2 shows the descriptive statistics of the independent variable and the control variables.
Estimated Unauthorized
immigrant population
(millions of people)
Total Immigrant
Population
(millions of people)
Number of people covered
by Medicaid
(in thousands of people)
Number of people living
below the poverty line
(millions of people)
Unemployment rate (%)
Mean 8.96903226 Mean 35.8932258 Mean 41.5493667 Mean 38.5753941 Mean 5.90354839
Standard
Error 0.50124026
Standard
Error 1.48053241
Standard
Error 2.3165813
Standard
Error 0.80430507
Standard
Error 0.29108198
Median 10.35 Median 37.42 Median 38.19 Median 37.28 Median 5.6
Mode 10.5 Mode #N/A Mode #N/A Mode #N/A Mode 5.6
Standard
Deviation 2.79078765
Standard
Deviation 8.24325558
Standard
Deviation 12.8981788
Standard
Deviation 4.47818108
Standard
Deviation 1.62067588
Sample
Variance 7.7884957
Sample
Variance 67.9512626
Sample
Variance 166.363017
Sample
Variance 20.0541058
Sample
Variance 2.62659032
Kurtosis -0.6628428 Kurtosis -1.007797 Kurtosis -1.3779668 Kurtosis -0.7758254 Kurtosis -0.0775458
Skewness -0.838848 Skewness -0.4330443 Skewness 0.42591258 Skewness 0.54497607 Skewness 0.86576339
Range 8.6 Range 27.23 Range 38.12 Range 15.08 Range 5.9
Minimum 3.5 Minimum 19.77 Minimum 24.26 Minimum 31.58 Minimum 3.7
Maximum 12.1 Maximum 47 Maximum 62.38 Maximum 46.66 Maximum 9.6
Sum 278.04 Sum 1112.69 Sum 1288.03037 Sum 1195.83722 Sum 183.01
Count 31 Count 31 Count 31 Count 31 Count 31
Largest (1) 12.1 Largest (1) 47 Largest (1) 62.38 Largest (1) 46.66 Largest (1) 9.6
Smallest (1) 3.5 Smallest (1) 19.77 Smallest (1) 24.26 Smallest (1) 31.58 Smallest (1) 3.7
Confidence
Level
(95.0%)
1.02366917 Confidence
Level
(95.0%)
3.02365056 Confidence
Level
(95.0%)
4.73109019 Confidence
Level
(95.0%)
1.64261008 Confidence
Level
(95.0%)
0.59446871
Table 2.
5. EMPIRICAL EVIDENCE AND DISCUSSION
After testing the model, here are the results of our subsequent regressions:
Multivariate Regression Summary Output
Dependent
Variables R2 Adjusted R2 p-value F-statistics
LnY1 0.98789118 0.98702627 1.4569E-27 1142.18244
LnY2 0.98722144 0.98525551 3.3513E-24 502.164425
LnY3 0.96627751 0.96108944 9.8916E-19 186.249727
LnY4 0.92274476 0.91722653 2.6977E-16 167.217474
Table 3
The results of our regressions show that there is a strong correlational relationship between the variable of interest and the dependent variables. As we could see, each of the relationships between the variable of interests and the dependent variables is statistically significant with an R2 that is
each above 0.7 (R2 > 0.7). Consequently, we are going to analyze each correlational relationship individually.
However, it is noteworthy to remind everyone that correlation does not imply causation. There is surely a strong correlation between the dependent variables and the illegal immigration population, which is our variable of interest, but it does not mean that illegal immigration alone is necessarily the reason why the cost of social welfare has grown. The control variables we included in the model help us understand that other factors also affect the dependent variables than the mere variable of interest.

Germinal G. Van & Jose Orellana
10
5.1. Illegal immigration and healthcare expenditures per capita
There is a strong correlational relationship between the illegal immigration population and the cost of healthcare per American citizen. Healthcare spending per capita increases by $8,800 for the American taxpayer for every 1 million undocumented immigrants. One of the reasons why healthcare has become costly for the American taxpayer is because undocumented immigrants are uninsured and are therefore at a higher risk. According to a 2019 study from the Kaiser Family Foundation, the lack of medical insurance for undocumented immigrants is because they have a limited access to coverage options.4 Among the total nonelderly population, 45 percent of illegal immigrants were uninsured compared to about one in four (23 percent) lawfully present immigrants and less than one-in-ten citizens (8 percent) as of 2017 as we can see in figure 4.5
Figure 4. Source: Kaiser Family Foundation
In 2016, federal taxpayers provided $11.2 billion in subsidized care to unauthorized immigrants.6 In 2018, this amount increased to $18.5 billion.7 The purported intent of the federal policy is to prevent federal tax dollars from being used to fund healthcare for unauthorized immigrants except in extreme circumstances. 8 Notwithstanding express prohibitions contained in the statutes related to Medicaid and the Affordable Care Act, there also are companion federal programs that permit federal funding to be used for healthcare for unauthorized immigrants indirectly. According to a study published by the Center for Immigration Studies, undocumented immigrants access to
4 Artiga, Samantha; Diaz, Maria. (2019). “Health Coverage and Care of Undocumented Immigrants.” Kaiser Family
Foundation. Issue Brief. pp.1-6. 5 Ibid. p. 3 6 Conover, Chris. (2018). “How Americans Citizens Finance $18.5 billion for Unauthorized Immigrants.” Forbes. 7 Conover, (2018). 8 Conover, (2018)
0
5
10
15
20
25
30
35
40
45
50
Uninsured Rates
Uninsured Rates among the nonelderly population by immigrant status, 2017
Citizens Lawful Present Immigrants Illegal Immigrants

Germinal G. Van & Jose Orellana
11
federally funded healthcare could cost up to $23 billion per year.9 The study also found that if providing a subsidy to help undocumented immigrants buy private insurance on the Affordable Care Act, it could also cost about $4,600 to the American taxpayer. 5.2. Illegal immigration and total Medicaid expenditures.
The results of our regression also show that there is a positive correlational relationship between illegal immigration and Medicaid expenditures. Medicaid is a federal-funded healthcare program designed for low-income individuals and families. Under Medicaid and CHIP (Children’s Health Insurance Program), no federal funding may be used to cover unauthorized immigrants, except for payment for limited emergency services.10 Moreover, states can and do use state-only Medicaid programs to cover people.11 For example, California’s Health for All Kids Act provides unauthorized immigrant children with access to coverage through Medi-Cal, the state Medicaid program.12 Its passage in 2015 made California the largest state to use state-only funding to provide coverage to all children regardless of immigration status; in doing so, it joins New York, Illinois, Massachusetts, Washington, and the District of Columbia.13 A general challenge in analyzing Medicaid expenditures per capita is that medical expenditures are unevenly distributed: children have low average expenditures, while the aged and disabled have high expenditures.14 Back in the 1990s when illegal immigration began to surge in America, a study found that the accumulation of immigrants increase the cost of Medicaid because the welfare reform did not affect the eligibility of immigrants who were already present in the United States.15 As a matter of fact, undocumented immigrants who lose their Medicaid coverage were still eligible for emergency medical services.16 Table 4 presents the total Medicaid costs for undocumented immigrants by U.S. state.
Total Medicaid Costs for Undocumented Immigrants by U.S. State
U.S. States Total Costs
(millions of dollars)
Alabama 55.41
Alaska 6.68
Arizona 394.37
Arkansas 44.22
California 1122.80
Colorado 137.78
Connecticut 137.53
Delaware 34.13
9 Camarota, Steven; Zeigler, Karen; Richwine, Jason. (2019). “How Much Would It cost to Provide Health Insurance to Illegal Immigrants?” Center for Immigration Studies. 10 Conover, (2018) 11 Conover, (2018) 12 Conover, (2018) 13 Conover, (2018) 14 Ku, Leighton; Kessler, Bethany. (1997). “Number and Cost of Immigrants on Medicaid, The National Estimates.” The Urban Institute. 15 Ku; Kessler. (1994) 16 Ku; Kessler. (1994)

Germinal G. Van & Jose Orellana
12
D.C. 10.12
Florida 661.78
Georgia 489.68
Hawaii 7.99
Idaho 39.20
Illinois 289.54
Indiana 128.45
Iowa 17.32
Kansas 82.88
Kentucky 56.47
Louisiana 82.89
Maine 2.50
Maryland 190.01
Massachusetts 50.10
Michigan 41.13
Minnesota 84.18
Mississippi 66.01
Missouri 48.46
Montana 4.51
Nebraska 67.73
Nevada 112.53
New Hampshire 6.29
New Jersey 394.51
New Mexico 93.05
New York 609.28
North Carolina 455.40
North Dakota 5.00
Ohio 89.50
Oklahoma 107.13
Oregon 102.81
Pennsylvania 135.33
Rhode Island 33.60
South Carolina 105.88
South Dakota 10.21
Tennessee 199.43
Texas 2302.05
Utah 85.97
Vermont 0.52
Virginia 196.99
Washington 296.83
West Virginia 2.07
Wisconsin 27.17
Wyoming 7.49
Table 4. Source: Center for Immigration Studies. Note: Estimates are based on those reported by
the Kaiser Family Foundation for 2014 and adjusted to reflect higher 2019 costs and lower
healthcare consumption by immigrants when on the program. The state of Texas has the highest cost of Medicaid for undocumented immigrants with an amount of $2 billion while the state of Vermont spends less than a million dollars on Medicaid for

Germinal G. Van & Jose Orellana
13
undocumented immigrants. The cost of providing ACA subsidies for all undocumented immigrants with income above the Medicaid eligibility threshold would be an additional $9.9 billion.17 Adding this to the cost of providing Medicaid, which is $9.7 billion, creates a total cost of about $19.6 annually.18 It is nonetheless important to asseverate that the illegal immigrant population alone is not the causal factor for the increase of total Medicaid costs. As the data show in figure 5, immigrants (lawful and undocumented immigrants) in general have a higher use rate of Medicaid than native-born Americans. On the other hand, Native-born citizens spend a higher value of benefits per capita on welfare programs than immigrants. The average value of welfare benefits per immigrant was about $3,718 in 2016, about 39 percent less than the 6,081 average value of welfare benefits per native-born citizen.19 This is the case for recipients of Medicaid. Native-born citizens recipients of Medicaid benefits spend slightly more than immigrants as we can see in figure 6.20 And the reason why is that most of the Medicaid enrollees are primary native-born citizens.
Figure 5. Source: 2017 Annual Social and Economic Supplement to the Current Population
Survey and 2015 Medical Expenditures Panel Survey Data
17 Camatora, Zeigler, Richwine. (2019) 18 Camarota, Zeigler, Richwine. (2019) 19 Nowrasteh, Alex; Orr, Robert. (2018) “Immigration and the Welfare State.” Research and Policy Brief:
Immigration. Number 6. Cato Institute. pp. 1-8. 20 In figure 6, the term “nonimmigrants” was used. According to the Department of Homeland Security, the term “nonimmigrant” refers to foreign nationals who are admitted to the United States temporarily for a specific purpose. By contrast, the term “immigrant” refers to foreign nationals who wish to come the United States permanently.
0
2
4
6
8
10
12
14
16
18
20
Rate of Use of Medicaid (%)
Medicaid use rates by nativity and immigration status for adults age 19 and older at all poverty
level in 2016.
Native-born Immigrants
Naturalized citizens Noncitizens

Germinal G. Van & Jose Orellana
14
Figure 6. Source: 2017 Annual Social and Economic Supplement to the Current Population
Survey and 2015 Medical Expenditures Panel Survey Data
5.3. Illegal Immigration and Cost of Food Stamps
There is a clear correlational relationship between illegal immigration and the cost of food stamps. However, it is interesting to note that unauthorized immigrants are ineligible for most means-tested programs. But immigrants, in general, do have access to welfare programs, especially, if they are within a specific income threshold. In 2018, the Cato Institute published a study regarding the impact of immigration on social welfare programs. The study found that although immigrants are less likely to consume most welfare benefits than native-born Americans due to many restrictions upon their eligibility, immigrants have a higher use of food stamps than native-born citizens. However, immigrant children are less likely to use all means-tested welfare programs than native-born children as we could see in figure 8.21
21 Nowrasteh; Orr. (2018)
$1,000.00
$1,050.00
$1,100.00
$1,150.00
$1,200.00
$1,250.00
$1,300.00
$1,350.00
Value of Medicaid Benefits (U.S. dollars)
Average per capita Medicaid cost by nativity for age and income-eligible recipients, 2016
Native-born citizen Immigrants

Germinal G. Van & Jose Orellana
15
Figure 7. Source: 2017 Annual Social and Economic Supplement to the Current Population
Survey and 2015 Medical Expenditures Panel Survey Data
Figure 8. Source: 2017 Annual Social and Economic Supplement to the Current Population
Survey and 2015 Medical Expenditures Panel Survey Data In 2002, many states have implemented the Farm Bill Restorations, which restored eligibility to legal disabled immigrants, immigrants that have been in the United States for at least five years,
0
2
4
6
8
10
12
14
16
Use rate of SNAP (%)
SNAP use rates by nativity and immigration status for adults age 19 nad older at all
poverty levels, 2016
Native-born citizens Immigrants
Naturalized citizens Nonimmigrants
0
10
20
30
40
50
60
70
80
SNAP (%) SSI (%) Medicaid (%) Cash assistance(%)
Welfare use rates by nativitiy and immigration status for children age 18 and younger, poverty adjusted, 2016
Native-born citizens Immigrants
Citizen children of citizen parents Citizen children of noncitizen parents
Noncitizen children
Germinal G. Van & Jose Orellana
16
and children of immigrants.22 State food stamp agencies have joined with school districts, health departments, and other immigrant-serving agencies to conduct outreach for the Food Stamp and Child Nutrition programs.23 During the 1990s, the foreign-born population increased by 57 percent to 31 million foreign-born residents.24 As the U.S. immigrant population was increasingly settling in non-traditional immigrant-receiving states such as North Carolina, Georgia, Nevada, or Arkansas, the challenge of providing food and other social services to the immigrant population was evidenced in data showing that immigrants report higher rates of food insecurity and hunger than native-born citizens.25 The data showed that 37 percent of children in immigrant households lived with food affordability, compared with 27 percent of children in native-born citizen households.26 Hence, to reduce this food insecurity, food stamp agencies expanded the eligibility option to immigrants, which substantially increased the cost of maintaining the program. For example, in North Carolina, the immigrant population increased by 274 percent in the decade between 1990 and 2000.27 Which such an increase, it was clear that once the Farm Bill Restoration was implemented, the cost of food stamps would inevitably skyrocket. 5.4. Illegal Immigration and Public Education Expenditures per Pupil
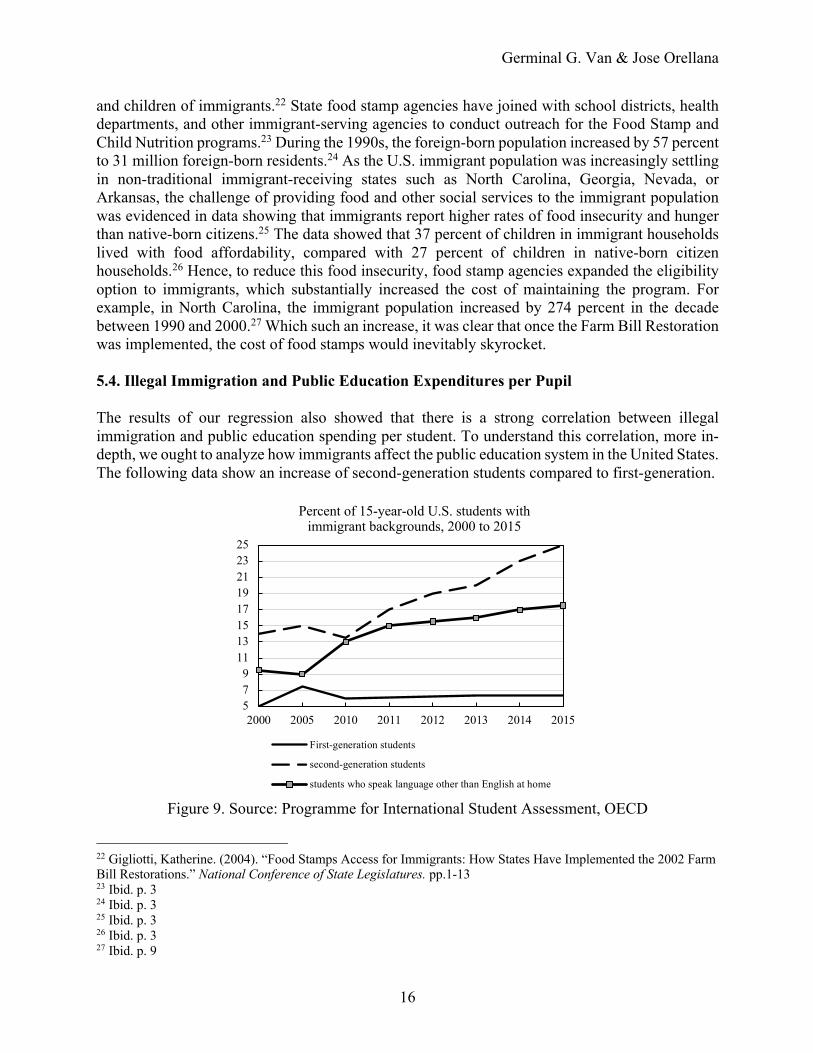
The results of our regression also showed that there is a strong correlation between illegal immigration and public education spending per student. To understand this correlation, more in-depth, we ought to analyze how immigrants affect the public education system in the United States. The following data show an increase of second-generation students compared to first-generation.
Figure 9. Source: Programme for International Student Assessment, OECD
22 Gigliotti, Katherine. (2004). “Food Stamps Access for Immigrants: How States Have Implemented the 2002 Farm Bill Restorations.” National Conference of State Legislatures. pp.1-13 23 Ibid. p. 3 24 Ibid. p. 3 25 Ibid. p. 3 26 Ibid. p. 3 27 Ibid. p. 9
5
7
9
11
13
15
17
19
21
23
25
2000 2005 2010 2011 2012 2013 2014 2015
Percent of 15-year-old U.S. students with immigrant backgrounds, 2000 to 2015
First-generation students
second-generation students
students who speak language other than English at home

Germinal G. Van & Jose Orellana
17
Indeed, the data show that second-generation immigrants have integrated themselves into the educational system as their percentage significantly increased since the 2010s. If the percentage of immigrants in the educational system increased, it is then fair to say that the percentage of children of unauthorized immigrant parents also increased during that period because some programs such as DACA enable them to receive an education, which is even considered a path to achieve citizenship.
Figure 10. Pew Research Center
The rise in K-12 students with at least one parent who is an unauthorized immigrant contrasts with the total number of unauthorized immigrants, which has remained stable since 2009.28 Before 2009, the trends had been similar, with both groups in number from 1995 to 2007, then declining to a lower level in 2008.29 The number of students with at least one unauthorized immigrant parent ticked up in 2009.30 The vast majority of students with at least one unauthorized immigrant parent –3.2 million, or 5.9 percent of total enrollment in 2014—were U.S.-born children and thus U.S. citizens at birth.31 That being said, U.S.-born children made up 81 percent of all children of unauthorized immigrants enrolled in grades K-12 in 2014.32 As America’s elementary and high schools have been saddled with having to accommodate a rising number of immigrants children, including legal, illegal, and refugee newcomers, each school
28 Passel, Jeffrey; Cohn, D’Vera. (2019). “Children of unauthorized immigrants represent rising share of K-12 students.” Pew Research Center. 29 Passel; Cohn. (2019) 30 Passel; Cohn. (2019) 31 Passel; Cohn. (2019) 32 Passel; Cohn. (2019)
3
3.5
4
4.5
5
5.5
6
6.5
7
7.5
8
1995
1997
2000
2003
2005
2007
2008
2009
2010
2011
2012
2013
2014
% of K-12 students with at least one parent who is an unauthorized immigrant
% of K-12 students with at least one parent who is anunauthorized immigrant

Germinal G. Van & Jose Orellana
18
district has had to deal with the problem in individual ways.33 Traditionally, a community can cope with a steady flow of new arrivals in their schools by studying the need for new elementary and high schools in the future, setting forth financial plans to build or expand present school facilities, and preparing budgets to hire new teachers, etc.34 But all these plans were undermined with the growth of immigration as it raised the cost of public education. In many areas, an extremely large number of students show up in a short period of time, which leads to an almost overnight crisis of school overcrowding, major teacher shortages, huge educational budget shortfalls, and a lack of school equipment and resources for all students.35 A recent study in Denmark addressed this issue in its own country and argued that one of the most direct consequences of having many immigrant children in the classroom is that the teacher’s attention and time are diverted from the native-born children.36 Since most immigrant children have a poorer command of the host country's language, the teacher may need to spend more class time providing individual assistance, and the teacher may also slow the pace of instruction to accommodate immigrant children with limited language proficiency or weak educational background.37 As a result, teachers may cover less of the curriculum than the class would otherwise have covered.38 Hence, in these specific circumstances, the cost of having immigrant children outweighs the benefits of assisting them.
6. CONCLUSION AND POLICY RECOMMENDATION
As we reach the conclusive part of our analysis, we saw that there is a correlational relationship between illegal immigration, which is our variable of interest, and the four dependent variables. Illegal immigration does indeed increase the cost of the American taxpayer when it comes to funding social welfare programs. On that note, we ought to admit that conservatives have a point.
Now the question remains “how to handle the issue?”
Those on the far right of the Republican Party have advocated for deportation and for a border wall on the southern border as the best solutions to minimize the burden of illegal immigration. Donald Trump, despite his zero-tolerance immigration policy while President, could not stop illegal immigration entirely. As we mentioned at the outset of our analysis, two-thirds of Americans would rather have a way where illegal immigrants could stay in the United States legally. This approach to curbing the burden of immigration seems less radical and beneficial for both, the native-born American citizen, and the illegal immigrant. It is fair to say that illegal immigrants contribute to the economy to some extent by performing jobs that no native-born American would normally perform. Moreover, even if they do not pay income tax, they do still pay sales tax, which is a form of contribution rendered to society at large. How could illegal immigrants be maintained in the United States legally?
Two recommendations are worth being suggested for answering this question. First, an assimilation program should be implemented by the U.S. Department of Homeland Security. This assimilation program would require undocumented immigrants to integrate into the American
33 Daly, Christopher J. (2017) “The Impact of Immigrant Children on America’s Public Schools.” Negative Population Growth. pp. 1-8 34 Ibid. p. 3 35 Ibid. p. 3 36 Ibid. p. 4 37 Ibid. p. 4 38 Ibid. p. 4

Germinal G. Van & Jose Orellana
19
culture by taking mandatory English courses as part of the requirement to apply for legal residency or naturalization and to learn the history of the United States. Moreover, an assimilation policy would be an incentive to reduce the spread of illegal immigration. Them, knowing that there is a program in place for their integration into American society, will encourage them to seek the legal approach to adjust their immigration status. This approach and process could potentially save millions of dollars in aggregate taxation, and resources will not be wasted on trying to contain a problem that cannot be eliminated. If undocumented immigrants are allowed to adjust their immigration status and obtain regular jobs, it will decrease the number of participants in welfare
programs as well as their number of recipients.
The second recommendation would be to maintain a program such as DACA as a path to integrate undocumented immigrants into the school system. DACA helps the children of undocumented immigrants to become eligible to work and to legally contribute to the economic development of the United States.
Economically, it will cost more to deploy resources just to evict or deport undocumented immigrants whereas illegal immigration cannot entirely be suppressed no matter how hard and how many times it is tried. It would be easier to accommodate those who are already here while strengthening new immigration policies that would be based on meritocracy to reduce the number of newcomers.
Hence, new hypothetical immigration policies could consist of focusing on facilitating access to immigrants who have a higher level of education because those with higher education tend to have a more law-abiding behavior compared to those with a limited educational background. Additional requirements should be integrated into this new hypothetical policy for those who have a limited educational background because they represent more of a liability rather than an asset for the U.S. economy.

Germinal G. Van & Jose Orellana
20
REFERENCES
U.S. Department of Homeland Security (2020). Daniller, Andrew. (2019). “Americans’ Immigration Policy Priorities: Division Between—and within—the two parties.” Pew Research Center. Ibid. (2019). Artiga, Samantha; Diaz, Maria. (2019). “Health Coverage and Care of Undocumented Immigrants.” Kaiser Family Foundation. Issue Brief. pp.1-6. Ibid. p. 3 Conover, Chris. (2018). “How Americans Citizens Finance $18.5 billion for Unauthorized Immigrants.” Forbes. Conover, (2018). Conover, (2018) Camarota, Steven; Zeigler, Karen; Richwine, Jason. (2019). “How Much Would It Cost to Provide Health Insurance to Illegal Immigrants?” Center for Immigration Studies. Conover, (2018) Conover, (2018)
Conover, (2018)
Conover, (2018) Ku, Leighton; Kessler, Bethany. (1997). “Number and Cost of Immigrants on Medicaid, The National Estimates.” The Urban Institute. Ku; Kessler. (1994) Ku; Kessler. (1994) Camatora, Zeigler, Richwine. (2019)
Camarota, Zeigler, Richwine. (2019) Nowrasteh, Alex; Orr, Robert. (2018) “Immigration and the Welfare State.” Research and Policy
Brief: Immigration. Number 6. Cato Institute. pp. 1-8.

Germinal G. Van & Jose Orellana
21
In figure 6, the term “nonimmigrants” was used. According to the Department of Homeland Security, the term “nonimmigrant” refers to foreign nationals who are admitted to the United States temporarily for a specific purpose. By contrast, the term “immigrant” refers to foreign nationals who wish to come to the United States permanently. Nowrasteh; Orr. (2018) Gigliotti, Katherine. (2004). “Food Stamps Access for Immigrants: How States Have Implemented the 2002 Farm Bill Restorations.” National Conference of State Legislatures. pp.1-13 Ibid. p. 3 Ibid. p. 3 Ibid. p. 3 Ibid. p. 3 Ibid. p. 9 Passel, Jeffrey; Cohn, D’Vera. (2019). “Children of unauthorized immigrants represent a rising share of K-12 students.” Pew Research Center.
Passel; Cohn. (2019) Passel; Cohn. (2019)
Passel; Cohn. (2019) Passel; Cohn. (2019) Daly, Christopher J. (2017) “The Impact of Immigrant Children on America’s Public Schools.”
Negative Population Growth. pp. 1-8 Ibid. p. 3 Ibid. p. 3 Ibid. p. 4 Ibid. p. 4
Ibid. p. 4


![Cost Segregation PP - COBE - Updated 2015 [Compatibility Mode]](https://static.fdocuments.us/doc/165x107/55d350c0bb61ebba3d8b45a1/cost-segregation-pp-cobe-updated-2015-compatibility-mode.jpg)