What are Fossil Fuels?. Review: What are Renewable and Non-Renewable Resources?

AUS Consultants 1 November 2001
An Economic Analysis of Legislation for
a Renewable Fuels Requirement for Highway Motor Fuels
John M. Urbanchuk Executive Vice President
AUS Consultants
November 2001
EXECUTIVE SUMMARY Congress is considering legislation that would require motor vehicle fuel sold in the United
States to contain a minimum renewable content. This legislation would provide for the energy
security of the United States and promote environmental quality by enhancing the use of motor
vehicle fuels from renewable sources. Renewable fuels include biodiesel, ethanol or any other
liquid fuel produced from biomass or biogas. Precise estimates of the minimum quantity
guidelines are a current topic of discussion. This study assumes that the minimum percentage
by volume of renewable fuel content of motor vehicle fuel would increase from 1.2 percent in
2002 to four percent by 2016.
Using current long-term U.S. Department of Energy projections for highway energy use as a
baseline,1 renewable fuel use in the United States would increase from current levels of about
1.9 billion gallons to more than 8.8 billion gallons by 2016. As shown in Figure 1, the majority of
renewable fuel would be accounted for by ethanol produced from grain, however, biodiesel is
expected to account for about 15 percent of total renewable fuel use by 2016. There will likely
be additional gallons of ethanol produced from cellulose conversion as that technology is
commercialized. The expansion of renewable fuels in the American motor fuel supply will
provide significant benefits to energy security, the agricultural sector, and the overall American
economy:
• Increasing the use of renewable fuels to four percent by volume of motor vehicle
fuel would displace the annual equivalent of 302 million barrels of crude oil by
2016, or nearly 2.9 billion barrels of crude oil between 2002 and 2016. This
1 Annual Energy Outlook 2001 with Projections to 2020. Report DOE/EIA-03833. Energy Information Administration, U.S. Department of Energy, Table 33, December 22, 2000.
Economic Impact of Mandatory Renewable Fuel Content Legislation
AUS Consultants 2 November 2001
would reduce America’s dependence on imported oil to 65 percent by 2016
compared to the 70 percent projected by the Department of Energy.
• The displacement of imported crude oil by domestically produced renewable
fuels would improve the U.S. trade deficit by $63.4 billion (1996 dollars) over the
next 15 years.
• The renewable fuels industry will invest more than $10.5 billion (1996 dollars) on
structures, machinery and equipment, and supplies needed to build new ethanol and
biodiesel production plants and to expand existing facilities. Increased utilization of
agricultural commodities used to produce renewable fuels will increase the value of
agricultural final demand.
• The combination of increased agricultural demand and new capital spending
will add more than $300 billion (1996 dollars) to gross output in the American
economy between 2002 and 2016. This is equivalent to nearly $238 billion
(1996 dollars) of GDP over the next fifteen years.
• Increased production and use of renewable fuels will create as many as
300,000 new jobs in all sectors of the economy by 2016.
• Higher levels of gross output and job creation will generate an additional $71
billion (1996 dollars) of income for American consumers over the next 15
years.
• Increased use of renewable fuels will not result in a significant rise in consumer
food prices. The Consumer Price Index for Food is projected to increase at an
annual rate of 2.5 percent between 2002 and 2016, compared to an annual
increase of 2.4 percent under the baseline. This means that as a result of
increased demand for renewable fuels, food prices in 2016 as measured by the
Consumer Price Index will be only 1.4 percent higher than baseline levels.
• Corn and soybeans are expected to remain the primary feedstocks for ethanol
and biodiesel production respectively, over the next 15 years. However,
increased use of wheat, barley, and sorghum is expected to boost the non-corn
share of ethanol production from five percent to 12 percent by 2016 while an
Economic Impact of Mandatory Renewable Fuel Content Legislation
AUS Consultants 3 November 2001
increasing share of biodiesel production will come from other oils, including
recycled soybean oil.
• Corn demand for ethanol production is projected to increase from 652 million
bushels in 2002 to nearly 2.5 billion bushels by 2016. The soybean equivalent of
the oil required for biodiesel production is projected to increase from 51 million
bushels in 2002 to 318 million bushels by 2016. This higher level of demand can
be met with only modest increases in planted area over the fifteen-year period.
The total quantity of land planted to the eight major crops is projected to increase
by an average of 1.3 million acres above baseline levels.
• The combination of increased utilization of ethanol and biodiesel production will
result in higher crop prices. Farm-level corn prices are expected to increase 11.1
percent over the 2002 to 2016 period while soybean prices rise 11.8 percent.
Reflecting a substantial increase in demand for biodiesel production, soybean oil
prices will increase by an average 10 percent over baseline levels, however
soybean meal prices are expected to fall as supplies increase as more soybeans
are crushed.
• The impact of higher corn prices for livestock producers is expected to be largely
offset by a combination of additional supplies of co-products of the dry and wet
milling industries (e.g., distillers dried grains, corn gluten feed, and corn gluten
meal) and lower prices for soybean meal. Consequently, the livestock and
poultry sector will be only modestly affected by increased use of corn and
soybeans for ethanol and biodiesel production.
• Farm income and the economies of the rural communities that support
agriculture will receive a significant boost from increased renewable fuel demand.
Increased demand for renewable fuels will put an additional $6.6 billion of net
cash income in the pockets of American farmers annually over the next 15 years
for a cumulative total of $99 billion by 2016.
• Taxpayers also will benefit from a minimum content requirement for renewable
fuels as government outlays in the form of direct payments to farmers fall $7.8
billion between 2002 and 2016.
Economic Impact of Mandatory Renewable Fuel Content Legislation
AUS Consultants 4 November 2001
An Economic Analysis of Legislation for a Renewable Fuels Requirement for Highway Motor Fuels
John M. Urbanchuk
Executive Vice President AUS Consultants
November 2001
Congress is considering legislation that would require motor vehicle fuel sold in the United
States to contain a minimum renewable content. This legislation has its genesis in concerns for
energy security, environmental quality, and the health of the farm and rural economy. The
purpose of this study is to examine the broad implications of increased demand for renewable
fuels consistent with current legislative proposals and how they would provide for the energy
security of the United States and promote environmental quality by enhancing the use of motor
vehicle fuels from renewable sources.
Background Legislation under consideration would require motor vehicle fuel sold in the United States from
2002 onward to contain a minimum quantity of renewable fuel.2 Renewable fuels include
biodiesel, ethanol or any other liquid fuel produced from biomass or biogas. Precise estimates
of the minimum quantity guidelines are a current topic of discussion. This study assumes that
the minimum percentage by volume of renewable fuel content will increase from 1.2 percent in
2002 to four percent by 2016.
Using current long-term U.S. Department of Energy projections for highway energy use as a
baseline,3 renewable fuel use in the United States would increase from current levels of about
1.9 billion gallons to more than 8.8 billion gallons by 2016. As shown in Figure 1, the majority of
renewable fuel would be accounted for by ethanol produced from grain, however, biodiesel is
expected to account for about 15 percent of total renewable fuel use by 2016. There will likely
be additional gallons of ethanol produced from cellulose conversion as that technology is
commercialized.
2 S. 670; S.892; S.1006, HR 2423.

Economic Impact of Mandatory Renewable Fuel Content Legislation
AUS Consultants 5 November 2001
Figure 1Renewable Fuel Demand
0
2
4
6
8
10
2002 2004 2006 2008 2010 2012 2014 2016
Bil
Gal
Ethanol Biodiesel
Methodology
This analysis was based on the simulation of a large-scale multi-commodity model of the U.S.
agricultural sector. An initial projection through 2016 was prepared to serve as a baseline
against which the main provisions of legislation can be compared. The baseline projection was
aligned to the U.S. Department of Agriculture July 2001 World Agriculture Supply and Demand
Estimates. Assumptions for the United States and world macroeconomic environment were
taken from the July 2001 Long-Term Economic Outlook prepared by Macroeconomic Advisers,
LLC. These assumptions do not reflect the economic impacts and implications of the
September 11 terrorist attacks on the World Trade Center and Pentagon. The baseline
projection is predicated on current agricultural policy and makes no assumption regarding
changes to policy through the projection period.
Imposing renewable fuel content requirements as an exogenous shock to the baseline, and
solving the model for new equilibrium quantities and prices produced a scenario that
incorporates the impacts of increased demand for agricultural commodities needed to produce
ethanol and biodiesel. The detailed assumptions for corn and soybean demand for ethanol and
3 Annual Energy Outlook 2001 with Projections to 2020. Report DOE/EIA -03833. Energy Information Administration, U.S. Department of Energy. Table 33. December 22, 2000.

Economic Impact of Mandatory Renewable Fuel Content Legislation
AUS Consultants 6 November 2001
biodiesel production are presented in Appendix Tables 1 and 2, and are discussed below.
Summary tables that compare baseline values for supply, demand, and prices of major crops
and livestock commodities and farm income are attached as Appendix Tables 3 through 7.
Results
An increase in the demand for renewable fuels of the magnitude discussed above would have
significant positive implications for energy security, the agricultural sector, and the economy.
Energy Security
Blending renewable fuel with gasoline and diesel reduces the amount of conventional
petroleum-based motor vehicle fuel required to meet transportation needs. Since conventional
gasoline and diesel are refined from crude oil, increased use of renewable fuel also reduces the
amount of crude oil needed to supply refineries. According to the Energy Information
Administration, imports account for about 60 percent of America’s crude oil requirements. EIA
currently projects U.S. dependence on imported crude oil to reach nearly 70 percent by 2016.
Increasing the use of renewable fuels in motor vehicle fuel would displace the annual equivalent
of 302 million barrels of crude oil by 2016, or nearly 2.9 billion barrels of crude oil between 2002
and 2016. As shown in Figure 2, a renewable fuel requirement of four percent by volume of
highway motor fuel by 2016 would lower America’s dependence on imported oil, reducing the
share of imports from 70 percent to 65 percent by 2016. The implications for the U.S. trade
deficit of a reduction in oil imports of this magnitude are substantial. The displacement of 2.9
billion barrels of imported crude oil by domestically produced renewable fuels would reduce the
U.S. trade deficit by $63.4 billion (1996 dollars) over the next 15 years.

Economic Impact of Mandatory Renewable Fuel Content Legislation
AUS Consultants 7 November 2001
Figure 2Impact of Increased Renewable Fuel Use
on U.S. Crude Oil Import Dependency
55
60
65
70
75
2002 2004 2006 2008 2010 2012 2014 2016
Per
cent
Baseline Increased Renewable Fuel Demand
Agriculture Sector Implications
An increase in renewable fuel demand in the United States would have significant positive
impacts on commodity prices, farm income, and government spending for agricultural support
programs. Virtually all ethanol produced in the United States is made from grain, with corn the
leading feedstock, while biodiesel is made mostly from soybean oil which is produced by
crushing soybeans. The volume of renewable fuels required to meet the demand created by
legislation will increase the amount of corn and other grains used for ethanol production and
soybeans crushed for oil to produce biodiesel. This will provide a market-based incentive for
increased production, draw down stocks, boost farm-level prices, reduce government spending
on agriculture, and increase farm income.
A renewable fuel requirement of four percent by volume of motor vehicle fuel by 2016 is
expected to increase ethanol use from nearly two billion gallons in 2002 to 7.6 billion gallons by
2016. The quantity of corn and other grains required to produce the ethanol component of this
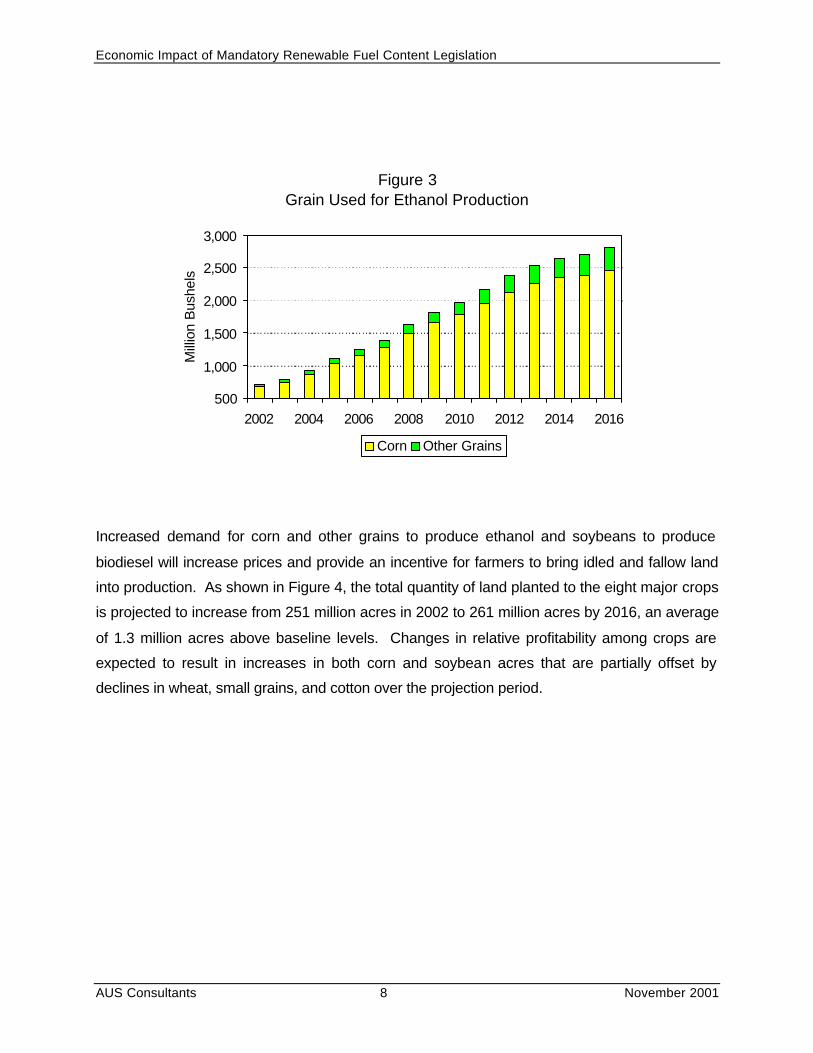
renewable fuel requirement is shown in Figure 3. Corn is expected to remain the primary
feedstock for ethanol production over the next 15 years, however, increased use of wheat,
barley, and sorghum is expected to boost the non-corn share of ethanol production from five
percent to 12 percent by 2016.
Economic Impact of Mandatory Renewable Fuel Content Legislation
AUS Consultants 8 November 2001
Figure 3Grain Used for Ethanol Production
500
1,000
1,500
2,000
2,500
3,000
2002 2004 2006 2008 2010 2012 2014 2016
Mill
ion
Bus
hels
Corn Other Grains
Increased demand for corn and other grains to produce ethanol and soybeans to produce
biodiesel will increase prices and provide an incentive for farmers to bring idled and fallow land
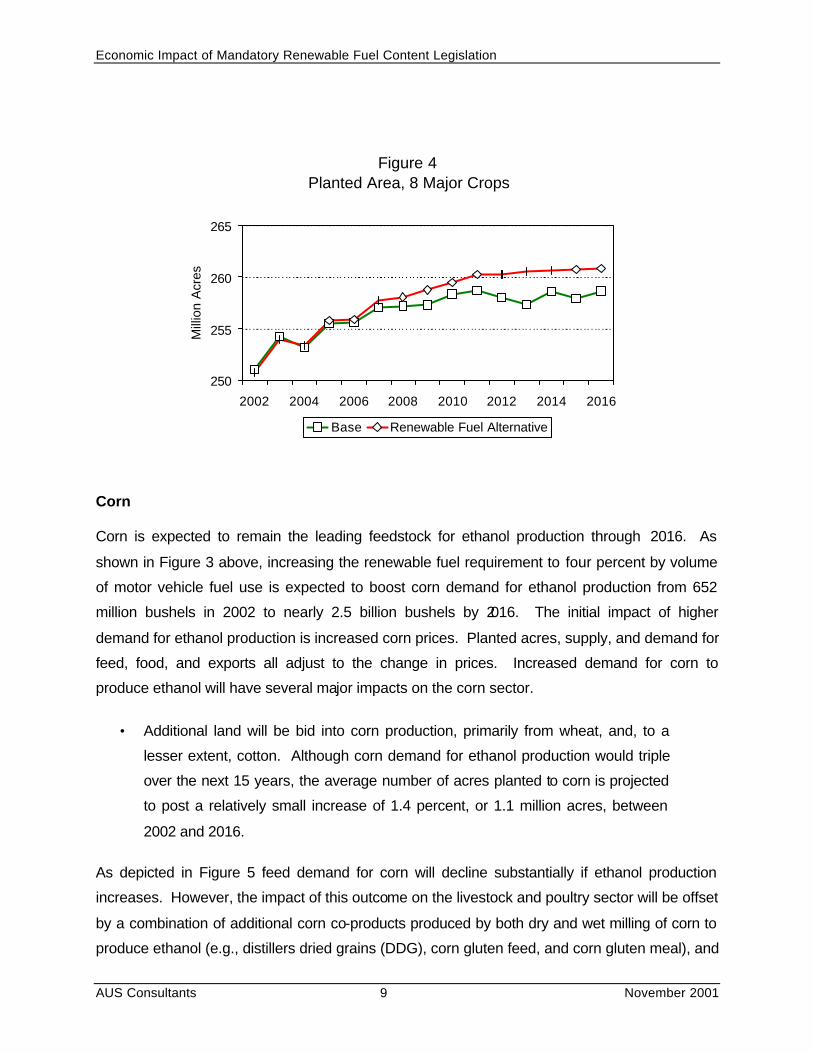
into production. As shown in Figure 4, the total quantity of land planted to the eight major crops
is projected to increase from 251 million acres in 2002 to 261 million acres by 2016, an average
of 1.3 million acres above baseline levels. Changes in relative profitability among crops are
expected to result in increases in both corn and soybean acres that are partially offset by
declines in wheat, small grains, and cotton over the projection period.
Economic Impact of Mandatory Renewable Fuel Content Legislation
AUS Consultants 9 November 2001
Figure 4Planted Area, 8 Major Crops
250
255
260
265
2002 2004 2006 2008 2010 2012 2014 2016
Mill
ion
Acr
es
Base Renewable Fuel Alternative
Corn Corn is expected to remain the leading feedstock for ethanol production through 2016. As
shown in Figure 3 above, increasing the renewable fuel requirement to four percent by volume
of motor vehicle fuel use is expected to boost corn demand for ethanol production from 652
million bushels in 2002 to nearly 2.5 billion bushels by 2016. The initial impact of higher
demand for ethanol production is increased corn prices. Planted acres, supply, and demand for
feed, food, and exports all adjust to the change in prices. Increased demand for corn to
produce ethanol will have several major impacts on the corn sector.
• Additional land will be bid into corn production, primarily from wheat, and, to a
lesser extent, cotton. Although corn demand for ethanol production would triple
over the next 15 years, the average number of acres planted to corn is projected
to post a relatively small increase of 1.4 percent, or 1.1 million acres, between
2002 and 2016.
As depicted in Figure 5 feed demand for corn will decline substantially if ethanol production
increases. However, the impact of this outcome on the livestock and poultry sector will be offset
by a combination of additional corn co-products produced by both dry and wet milling of corn to
produce ethanol (e.g., distillers dried grains (DDG), corn gluten feed, and corn gluten meal), and

Economic Impact of Mandatory Renewable Fuel Content Legislation
AUS Consultants 10 November 2001
lower prices for soybean meal caused by increased crushing of soybeans for biodiesel
production. Important to remember is that using corn and other grains to produce ethanol does
not eliminate the feed value of the grain. Ethanol production involves converting the starch
content of the grain to sugar and alcohol. This process leaves the nutritional content of the
grain -- including protein, vitamins, and fiber -- largely intact. Consequently, the co-products of
ethanol production can be used for livestock feeding and are used by animal feeders as a
protein supplement for dairy and beef cattle, swine, and sheep feed rations because they are an
economical source of protein. Several factors affect the decision to use feed co-products such
as DDG including the relative price of the feed component, palatability and efficiency gains, and
transportation costs from plant to feeding location. Since most livestock and poultry diets are
least-cost formulated, delivered price is a major consideration. Expansion of ethanol production
is expected to increase the supply of DDG significantly over the next 15 years and keep its price
favorable relative to grain and soybean meal. Reflecting this, increased renewable fuels
demand is expected to reduce the utilization of corn for feed by 5.5 percent, or an average of
338 million bushels a year between 2002 and 2016.
Figure 5Corn Demand for Feed
5,500
5,750
6,000
6,250
6,500
6,750
2002 2004 2006 2008 2010 2012 2014 2016
Mill
ion
Bus
hels
Base Renewable Fuel Alternative
• Increased demand for corn for ethanol production will reduce corn exports by an
annual average of 230 million bushels, or 9.6 percent, between 2002 and 2016.
Some of these exports of grain will be replaced by exports of DDG, corn gluten

Economic Impact of Mandatory Renewable Fuel Content Legislation
AUS Consultants 11 November 2001
feed, and corn gluten meal. The combination of increased utilization of corn for
ethanol production and changes to supply and other demand components will
result in lower average ending stocks and higher corn prices for American
farmers over the projection period. As shown in Figure 6, the farm-level price of
corn price is projected to average $2.86 per bushel over the fifteen-year 2002 to
2016 period, 11.1 percent above baseline levels.
Figure 6Corn Average Price Received by Farmers
$1.50$1.75$2.00$2.25$2.50$2.75$3.00$3.25$3.50
2002 2004 2006 2008 2010 2012 2014 2016
$/B
ushe
l
Base Renewable Fuel Alternative
Soybeans
Biodiesel will be a major component of a new renewable fuel requirement. Based on biodiesel
producer applications to the CCC Bioenergy program, 35 million gallons of biodiesel fuel were
produced in the United States in 2001, virtually all produced from soybean oil. Crushing
soybeans and other oilseeds produces oil that is used to make biodiesel fuel. Biodiesel use
would increase to 809 million gallons over the next 15 years. The soybean equivalent of the oil
required for biodiesel production is projected to increase from 51 million bushels in 2002 to 318
million bushels by 2016.
As shown in Figure 7, soybeans are expected to remain the predominant feedstock, although an
increasing share of biodiesel production will come from other oils, including recycled soybean
oil.

Economic Impact of Mandatory Renewable Fuel Content Legislation
AUS Consultants 12 November 2001
Figure 7Biodiesel Produced from Soybeans and Other Oils
0.00
0.10
0.20
0.30
0.40
0.50
0.60
2002 2004 2006 2008 2010 2012 2014 2016
Bil
Gal
0
50
100
150
200
250
300
350
Mil
Bu
Soybean Equivalent (Right) Soybeans (Left) Other Oils (Left)
Increased crush demand for soybeans to produce biodiesel will have several major impacts.
• Additional land will be bid into soybean production, primarily from wheat and
cotton. Increased renewable fuels demand is expected to increase the average
number of acres planted to soybeans by 1.5 million acres, or 1.6 percent,
between 2002 and 2016.
• The biodiesel use will require an additional 32 billion pounds of soybean oil over
the entire 15-year period ending in 2016. As shown in Figure 8, this will
necessitate a 7.1 percent average increase in soy crush demand over this
period. Soybean crush demand will be 252 million bushels higher than would be
the case with no renewable fuel requirement.

Economic Impact of Mandatory Renewable Fuel Content Legislation
AUS Consultants 13 November 2001
Figure 8Soybean Crush Demand
1,500
1,750
2,000
2,250
2001 2003 2005 2007 2009 2011 2013 2015
Mill
ion
Bus
hels
Base Renewable Fuel Alternative
• Soybean oil prices are projected to increase by an average of 10 percent over
baseline levels reflecting a substantial increase in demand for biodiesel. As a
consequence of higher demand for soybean oil to produce biodiesel the average
price of crude soybean oil between 2002 and 2016 is projected at 25.37 cents
per pound compared to 23.07 cents per pound without a renewable fuel
requirement.
• Increased crushing of soybeans to produce oil for biodiesel also will result in
more soybean meal. Soybean meal output is projected to increase by almost
three percent between 2002 and 2016. Soybean meal prices will be affected
both by higher meal production and increased supplies of medium protein corn
co-products such as DDG, which will increasingly compete with soy meal in
livestock and poultry feed rations. As a consequence of this, the price of 48
percent protein soybean meal is projected to average $187.57 per ton over the
15-year 2002-2016 period, 8.7 percent below baseline levels.
• The combination of increased crush demand for soybeans to produce oil for
biodiesel and changes to supply and other demand components will result in
lower average ending stocks and higher soybean prices over the projection
Economic Impact of Mandatory Renewable Fuel Content Legislation
AUS Consultants 14 November 2001
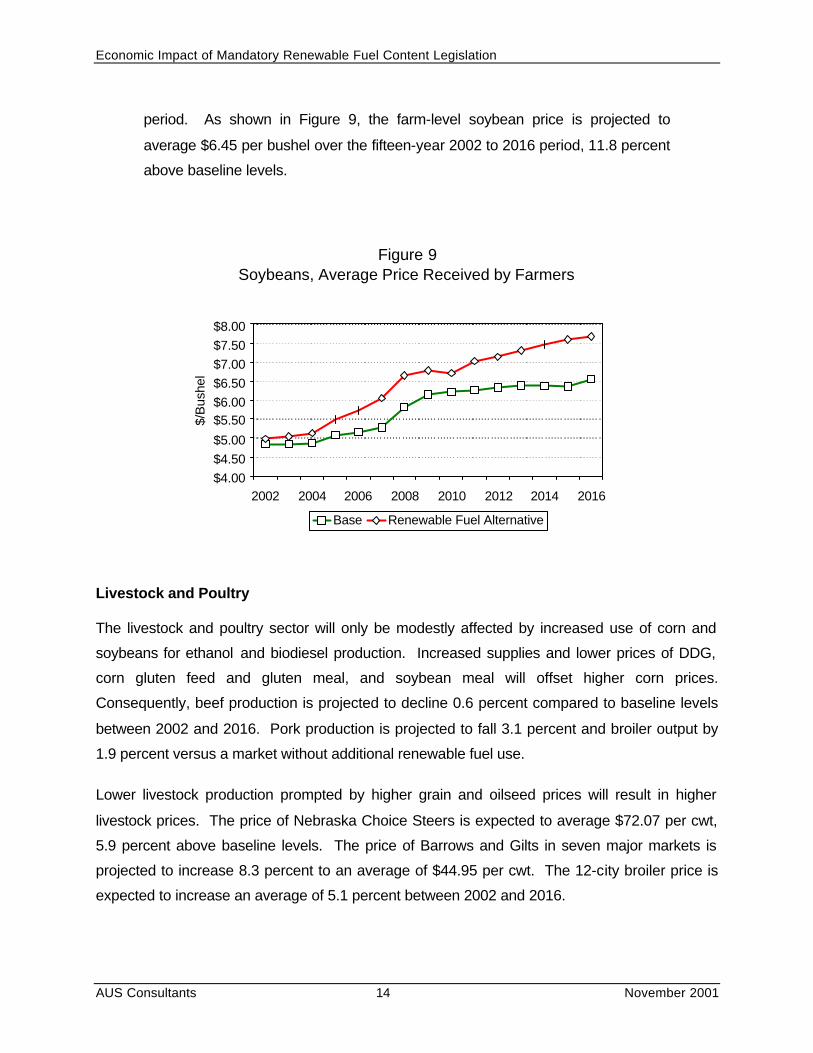
period. As shown in Figure 9, the farm-level soybean price is projected to
average $6.45 per bushel over the fifteen-year 2002 to 2016 period, 11.8 percent
above baseline levels.
Figure 9Soybeans, Average Price Received by Farmers
$4.00$4.50$5.00$5.50$6.00$6.50$7.00$7.50$8.00
2002 2004 2006 2008 2010 2012 2014 2016
$/B
ushe
l
Base Renewable Fuel Alternative
Livestock and Poultry
The livestock and poultry sector will only be modestly affected by increased use of corn and
soybeans for ethanol and biodiesel production. Increased supplies and lower prices of DDG,
corn gluten feed and gluten meal, and soybean meal will offset higher corn prices.
Consequently, beef production is projected to decline 0.6 percent compared to baseline levels
between 2002 and 2016. Pork production is projected to fall 3.1 percent and broiler output by
1.9 percent versus a market without additional renewable fuel use.
Lower livestock production prompted by higher grain and oilseed prices will result in higher
livestock prices. The price of Nebraska Choice Steers is expected to average $72.07 per cwt,
5.9 percent above baseline levels. The price of Barrows and Gilts in seven major markets is
projected to increase 8.3 percent to an average of $44.95 per cwt. The 12-city broiler price is
expected to increase an average of 5.1 percent between 2002 and 2016.

Economic Impact of Mandatory Renewable Fuel Content Legislation
AUS Consultants 15 November 2001
Farm Income
Legislation to increase the content of renewable fuel in the nation’s motor vehicle fuel supply will
provide a significant boost to farm income and the economies of the rural communities that
support agriculture in America. Increased demand for renewable fuels will put an additional
$6.6 billion of net cash income in the pockets of American farmers annually over the next 15
years. Looked at another way, increased demand for renewable fuels will increase net farm
cash income by nearly $100 billion by 2016.
Figure 10Net Farm Cash Income
Cumulative Impact of Minimum Content Requirement for Renewable Fuels
$0
$25
$50
$75
$100
2002 2004 2006 2008 2010 2012 2014 2016
Bill
ion
$
Taxpayers will benefit as well as farmers from a minimum content requirement for renewable
fuels. Grain, soybean, and cotton prices are projected to remain considerably above loan rate
levels as a result of increased ethanol and biodiesel use. Consequently, the need for loan
deficiency payments will be eliminated and requirements for other government cash payments
will be reduced. Increased demand for renewable fuels will result in total savings from lower
direct government payments to farmers of $7.8 billion between 2002 and 2016, with most of the
savings occurring in the first half of the period.
The impact of lower government payments and slightly higher cash expenses will be more than
offset by increased revenue from marketings. The combination of increased marketing of grains
and oilseeds resulting from demand for ethanol and biodiesel and higher crop prices is expected
Economic Impact of Mandatory Renewable Fuel Content Legislation
AUS Consultants 16 November 2001
to increase crop cash receipts by 7.4 percent over baseline levels between 2002 and 2016.
When an average 2.5 percent increase in livestock receipts is included, increased renewable
fuels use is projected to add $12.5 billion, or 4.8 percent, to average cash receipts over the next
15 years.
Consumer Food Prices
The farm value of agricultural commodities continues to decline as a share of consumer food
prices. Indeed, processing, marketing and transportation costs account for a larger share of the
consumer’s food dollar. Consequently, increased demand for renewable fuels will not result in a
significant rise in consumer food prices. Increased use of renewable fuels will boost demand for
grains and oilseeds used to make ethanol and biodiesel. As discussed earlier, increases in
demand will result in modestly higher prices for grains and oilseeds, and for livestock, poultry,
and dairy products. However, continued declines in the farm share of the value of the
consumer’s food market basket will mute the effects of the modest rise in commodity prices over
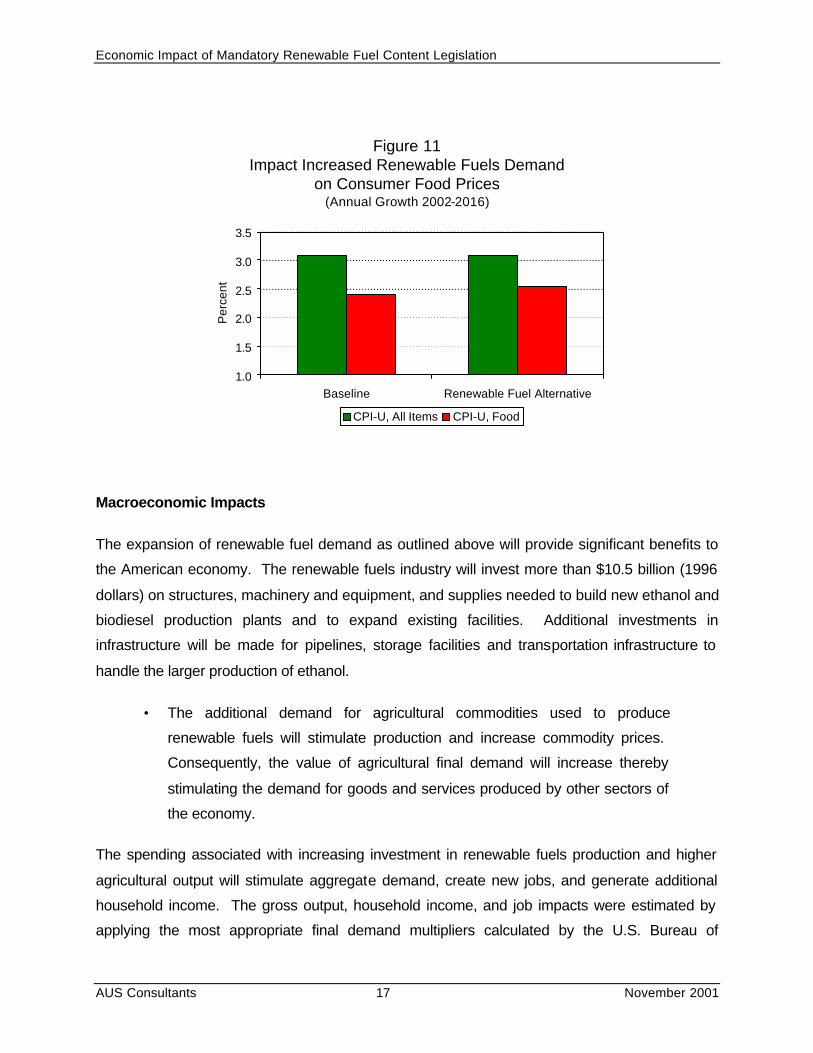
the next fifteen years. As shown in Figure 11, the Consumer Price Index for Food is projected
to increase at an annual rate of 2.5 percent between 2002 and 2016, compared to an annual
increase of 2.4 percent under the baseline. This means that as a result of increased demand
for renewable fuels, food prices in 2016 as measured by the Consumer Price Index, will be only
1.4 percent higher than baseline levels.
Economic Impact of Mandatory Renewable Fuel Content Legislation
AUS Consultants 17 November 2001
Figure 11Impact Increased Renewable Fuels Demand
on Consumer Food Prices(Annual Growth 2002-2016)
1.0
1.5
2.0
2.5
3.0
3.5
Baseline Renewable Fuel Alternative
Per
cent
CPI-U, All Items CPI-U, Food
Macroeconomic Impacts
The expansion of renewable fuel demand as outlined above will provide significant benefits to
the American economy. The renewable fuels industry will invest more than $10.5 billion (1996
dollars) on structures, machinery and equipment, and supplies needed to build new ethanol and
biodiesel production plants and to expand existing facilities. Additional investments in
infrastructure will be made for pipelines, storage facilities and transportation infrastructure to
handle the larger production of ethanol.
• The additional demand for agricultural commodities used to produce
renewable fuels will stimulate production and increase commodity prices.
Consequently, the value of agricultural final demand will increase thereby
stimulating the demand for goods and services produced by other sectors of
the economy.
The spending associated with increasing investment in renewable fuels production and higher
agricultural output will stimulate aggregate demand, create new jobs, and generate additional
household income. The gross output, household income, and job impacts were estimated by
applying the most appropriate final demand multipliers calculated by the U.S. Bureau of

Economic Impact of Mandatory Renewable Fuel Content Legislation
AUS Consultants 18 November 2001
Economic Analysis (BEA) for output, earnings, and employment to the estimates of new capital
spending and additional agricultural final demand.4 The multipliers for the agriculture sector
were used to estimate the impact from increased real agricultural final demand resulting from
renewable fuels production. Although the production of renewable fuels from agricultural
commodities represents output of the food processing (grain milling and soybean processing)
industry, the most appropriate multipliers for new plant construction are those for the
construction sector.
The estimates summarized below result from a static analysis of the impact of increasing
renewable fuels demand and production on the American economy. That is, they reflect the
combination of a series of snapshots of the economy rather than a dynamic flow analysis. The
major economic benefits of increased renewable fuels demand include the following:
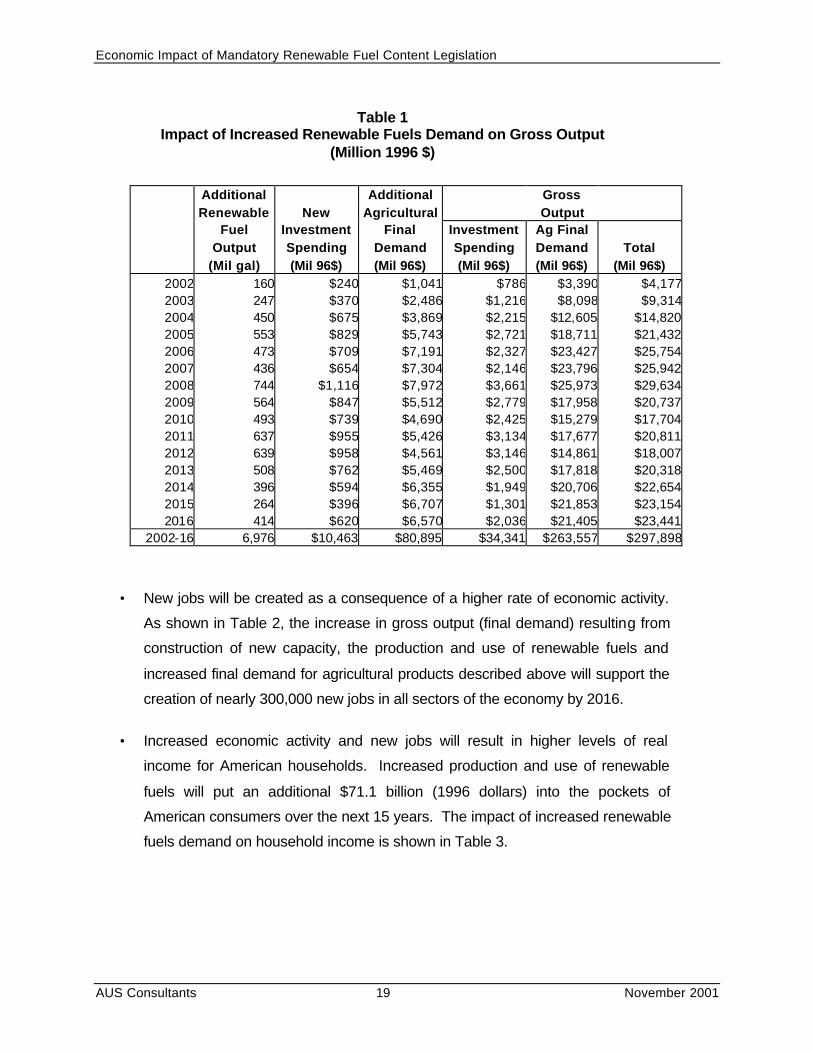
• The combination of increased agricultural demand and capital spending to
build production capacity for renewable fuels will add almost $300 billion
(1996 dollars) to gross output in the American economy between 2002 and
2016. Gross output represents the market value of an industry's production,
including commodity taxes, and it differs from GDP.5 Generally speaking,
Gross Output is larger than GDP since it includes the value of intermediate
goods and services, which are “netted out” of GDP.6 Reflecting this
difference, GDP is expected to grow by an additional $238 billion (1996
dollars) over the next fifteen years. The annual increases in gross output by
source are detailed in Table 1.
4 The multipliers used in this analysis are the current two-digit industry RIMS II multiplier estimated by the Bureau of Economic Analysis, U.S. Department of Commerce. The final demand multiplier for the agriculture and construction sectors are 3.259 and 3.282, respectively; the household income multipliers are 0.8469 and 1.0159; and the employment multipliers are 42.3 for agriculture and 35.0 for new construction.
5 BEA description of Gross Output taken from www.bea.doc.gov/bea/dn2/readgo.htm 6 A review of BEA published estimates of Gross Output and GDP by industry for 1999 indicates that Gross Output for all non-manufacturing industries totaled $9,261.6 billion (1996 dollars) in 1999 while real GDP for those same industries was estimated at $7,346 billion. Using this as a guide, the value of real GDP for the entire economy is approximately 80 percent of the value of total Gross Output.
Economic Impact of Mandatory Renewable Fuel Content Legislation
AUS Consultants 19 November 2001
Table 1 Impact of Increased Renewable Fuels Demand on Gross Output
(Million 1996 $)
Additional Additional Gross Renewable New Agricultural Output Fuel Investment Final Investment Ag Final Output Spending Demand Spending Demand Total (Mil gal) (Mil 96$) (Mil 96$) (Mil 96$) (Mil 96$) (Mil 96$) 2002 160 $240 $1,041 $786 $3,390 $4,1772003 247 $370 $2,486 $1,216 $8,098 $9,3142004 450 $675 $3,869 $2,215 $12,605 $14,8202005 553 $829 $5,743 $2,721 $18,711 $21,4322006 473 $709 $7,191 $2,327 $23,427 $25,7542007 436 $654 $7,304 $2,146 $23,796 $25,9422008 744 $1,116 $7,972 $3,661 $25,973 $29,6342009 564 $847 $5,512 $2,779 $17,958 $20,7372010 493 $739 $4,690 $2,425 $15,279 $17,7042011 637 $955 $5,426 $3,134 $17,677 $20,8112012 639 $958 $4,561 $3,146 $14,861 $18,0072013 508 $762 $5,469 $2,500 $17,818 $20,3182014 396 $594 $6,355 $1,949 $20,706 $22,6542015 264 $396 $6,707 $1,301 $21,853 $23,1542016 414 $620 $6,570 $2,036 $21,405 $23,441
2002-16 6,976 $10,463 $80,895 $34,341 $263,557 $297,898
• New jobs will be created as a consequence of a higher rate of economic activity.
As shown in Table 2, the increase in gross output (final demand) resulting from
construction of new capacity, the production and use of renewable fuels and
increased final demand for agricultural products described above will support the
creation of nearly 300,000 new jobs in all sectors of the economy by 2016.
• Increased economic activity and new jobs will result in higher levels of real
income for American households. Increased production and use of renewable
fuels will put an additional $71.1 billion (1996 dollars) into the pockets of
American consumers over the next 15 years. The impact of increased renewable
fuels demand on household income is shown in Table 3.

Economic Impact of Mandatory Renewable Fuel Content Legislation
AUS Consultants 20 November 2001
Table 2 Impact of Increased Renewable Fuels Demand on Total Employment
Investment Ag Final Spending Demand Total (Jobs) (Jobs) (Jobs)
2002 8,386 44,016 52,4022003 12,963 105,142 118,1052004 23,626 163,651 187,2772005 29,016 242,934 271,9502006 24,811 304,168 328,9792007 22,886 308,952 331,8372008 39,043 337,223 376,2652009 29,634 233,157 262,7912010 25,861 198,371 224,2332011 33,418 229,510 262,9282012 33,545 192,951 226,4962013 26,659 231,343 258,0022014 20,780 268,829 289,6092015 13,873 283,722 297,5952016 21,716 277,909 299,624
Table 3 Impact of Increased Demand for Renewable Fuels
on Real Household Income (Million 1996 $)
Investment Ag Final Spending Demand Total (Mil 96$) (Mil 96$) (Mil 96$)
2002 $243 $881 $1,1252003 $376 $2,105 $2,4812004 $686 $3,277 $3,9622005 $842 $4,864 $5,7062006 $720 $6,090 $6,8102007 $664 $6,186 $6,8502008 $1,133 $6,752 $7,8852009 $860 $4,668 $5,5282010 $751 $3,972 $4,7222011 $970 $4,595 $5,5652012 $974 $3,863 $4,8372013 $774 $4,632 $5,4062014 $603 $5,382 $5,9852015 $403 $5,680 $6,0832016 $630 $5,564 $6,194
2002-16 $10,630 $68,510 $79,140

Economic Impact of Mandatory Renewable Fuel Content Legislation
AUS Consultants 21 November 2001
Conclusion
Farmers, consumers, and taxpayers will directly benefit from legislation that would increase the
renewable content of motor vehicle fuel used in the United States.
• Farmers will benefit from the development and steady growth of a significant
base of domestic demand for grains, oilseeds, and other crops that would
result in higher prices and revenues from marketings. Legislation to increase
the content of renewable fuels in the nation’s motor fuel supply will put an
additional $6.6 billion of net cash income in the pockets of American farmers
annually over the next 15 years.
• Taxpayers will benefit because improved demand and prices for grains will
reduce the amount of taxpayer dollars needed for direct government
payments to farmers.
• Consumers will benefit as domestically produced renewable fuels displace
imported crude oil thereby reducing America’s dependence on imports from
an increasingly unstable region of the world. Producing and using renewable
fuels can displace expensive imported oil thereby reducing America's
dependency on imports from an increasingly unstable region of the world.
Relying on renewable fuels for an increasing share of our transportation fuel
requirements means that every acre of land that produces biomass used to
make a renewable fuel ethanol becomes an oil patch that never runs dry.
The direct economic consequence of this will include a reduction in the
nation’s trade deficit by $63.4 billion (1996 dollars) by 2016.
• Increased production and use of renewable fuels will create as many as
300,000 new jobs in all sectors of the economy by 2016.
• The combination of increased output and job creation will generate an
additional $71 billion (1996 dollars) of income for American consumers over
the next 15 years.


Economic Impact of Mandatory Renewable Fuel Content Legislation
AUS Consultants 23 November 7, 2001
Appendix Table 1 Ethanol Demand Assumptions
Highway Renewables Ethanol Ethanol Energy as % of Renewable Biodiesel Ethanol From From Use /1 Highway Use Use /3 Biodiesel Ethanol Use Corn Corn /4 (Bil Gal) (%) /2 (Bil Gal) (Bil Gal) Equiv (Bil Gal) (Pct) (Mil Bu)
2000 162.6 1.0% 1.690 0.034 0.052 1.637 95% 5762001 167.7 1.1% 1.867 0.035 0.054 1.813 95% 6382002 172.7 1.2% 2.026 0.073 0.112 1.914 95% 6702003 176.1 1.3% 2.273 0.113 0.173 2.100 94% 7312004 179.6 1.5% 2.723 0.155 0.238 2.486 94% 8612005 183.3 1.8% 3.276 0.200 0.306 2.970 93% 1,0232006 187.1 2.0% 3.749 0.247 0.378 3.370 93% 1,1552007 190.5 2.2% 4.185 0.296 0.453 3.731 92% 1,2712008 193.8 2.5% 4.928 0.347 0.531 4.398 92% 1,4902009 197.0 2.8% 5.493 0.398 0.609 4.884 91% 1,6462010 199.9 3.0% 5.985 0.452 0.691 5.295 91% 1,7752011 202.7 3.3% 6.622 0.506 0.774 5.848 90% 1,9492012 206.4 3.5% 7.261 0.561 0.858 6.403 90% 2,1222013 210.1 3.7% 7.769 0.619 0.948 6.821 89% 2,2482014 213.9 3.8% 8.164 0.681 1.041 7.123 89% 2,3352015 217.7 3.9% 8.429 0.744 1.139 7.290 88% 2,3762016 221.6 4.0% 8.842 0.809 1.238 7.605 88% 2,464
NOTES: 1. Annual Energy Outlook 2001 with Projections to 2020, Table 33. Transportation Sector Energy
Use by Mode and Type (tril btu). 2. Assumption. 3. Converted from btu at 83,961 btu per gallon (taken from Shapouri, H,. Duffield, J., Graboski, M.
"Estimating the Net Energy Balance of Corn Ethanol" USDA/ERS. AER 721, July 1995. 4. Ethanol yield: 2.7 gal/bu.

Economic Impact of Mandatory Renewable Fuel Content Legislation
AUS Consultants 24 November 7, 2001
Appendix Table 2 Biodiesel Demand Assumptions
BIODIESEL DEMAND
Hwy Diesel Hwy Diesel Hwy Diesel Hwy Diesel Hwy Diesel Hwy Diesel
Use /5 Use /5 Use /5 Use /5 Use /5 Use /5 Hwy Biodiesel Biodiesel Soybean
Lt Duty Freight Transit Inter-City School Total Diesel Biodiesel Biodiesel from from Oil Soybean Ethanol
Vehicles Trucks Busses Busses Busses Highway Use /6 Blend /7 Volume Soybeans Soybeans Equiv /8 Equiv Equiv /9
(Tril btu) (Tril btu) (Tril btu) (Tril btu) (Tril btu) (Tril btu) (Bil gal) (Pct) (Bil gal) (Pct) (Bil gal) (Bil lb) (Mil Bu) (Bil gal)
2000 217.7 4,179.9 83.2 23.6 68.4 4,572.8 34.125 0.1% 0.034 100.0% 0.034 0.256 24.4 0.052
2001 258.6 4,284.9 83.6 23.7 68.7 4,719.5 35.220 0.1% 0.035 100.0% 0.035 0.264 25.2 0.054
2002 299.3 4,431.5 84.0 23.9 69.1 4,907.7 36.625 0.2% 0.073 97.0% 0.071 0.533 50.8 0.112
2003 338.2 4,547.9 84.4 24.0 69.4 5,063.9 37.790 0.3% 0.113 94.0% 0.107 0.799 76.1 0.173
2004 379.0 4,643.2 84.8 24.1 69.8 5,200.9 38.813 0.4% 0.155 91.0% 0.141 1.060 100.9 0.238
2005 419.7 4,759.8 85.2 24.2 70.1 5,359.0 39.992 0.5% 0.200 88.0% 0.176 1.320 125.7 0.306
2006 462.5 4,881.4 85.5 24.3 70.3 5,523.9 41.223 0.6% 0.247 85.0% 0.210 1.577 150.2 0.378
2007 506.3 4,985.6 85.7 24.3 70.5 5,672.3 42.330 0.7% 0.296 82.0% 0.243 1.822 173.6 0.453
2008 547.3 5,079.7 85.9 24.4 70.6 5,808.0 43.343 0.8% 0.347 79.0% 0.274 2.054 195.7 0.531
2009 586.7 5,158.7 86.0 24.4 70.7 5,926.6 44.229 0.9% 0.398 76.0% 0.303 2.269 216.1 0.609
2010 624.4 5,244.7 86.0 24.4 70.7 6,050.2 45.151 1.0% 0.452 73.0% 0.330 2.472 235.4 0.691
2011 659.2 5,320.0 85.9 24.4 70.7 6,160.3 45.972 1.1% 0.506 70.0% 0.354 2.655 252.8 0.774
2012 691.6 5,391.3 85.8 24.4 70.6 6,263.7 46.744 1.2% 0.561 67.0% 0.376 2.819 268.4 0.858
2013 722.8 5,480.1 85.7 24.3 70.5 6,383.5 47.638 1.3% 0.619 64.0% 0.396 2.973 283.1 0.948
2014 754.3 5,579.5 85.6 24.3 70.4 6,514.2 48.613 1.4% 0.681 61.0% 0.415 3.114 296.5 1.041
2015 783.0 5,684.5 85.5 24.3 70.3 6,647.5 49.608 1.5% 0.744 58.0% 0.432 3.237 308.3 1.139
2016 809.2 5,785.6 85.3 24.2 70.2 6,774.6 50.556 1.6% 0.809 55.0% 0.445 3.337 317.8 1.238
NOTES:
5. Annual Energy Outlook 2001 with Projections to 2020, Table 34.
6. Converted from btu at 134,000 btu/gal
7. ASA assumption
8. Converted using 7.5 lb soybean oil = 1 gal biodiesel
9. Converted using ratio of DOE high energy values (128,340 diesel oil / 84,100 ethanol = 1.53)

Economic Impact of Mandatory Renewable Fuel Content Legislation
AUS Consultants 25 November 7, 2001
Appendix Table 3 Impact of a Minimum Renewable Fuels Content Requirement on Crop Supply
2002-16
2002 2003 2004 2005 2006 2007 2008 2009 2010 2011 2012 2013 2014 2015 2016 Avg
Planted Area, 8 Major Crops (Mil)
Baseline estimates 251.0 254.2 253.2 255.5 255.6 257.0 257.1 257.3 258.3 258.7 258.0 257.3 258.5 257.9 258.6 256.6
Renewable Alternative 250.7 253.9 253.4 255.8 255.9 257.7 258.0 258.7 259.4 260.2 260.3 260.5 260.6 260.7 260.8 257.8
Difference from baseline -0.1% -0.1% 0.1% 0.1% 0.1% 0.3% 0.3% 0.6% 0.4% 0.6% 0.9% 1.2% 0.8% 1.1% 0.8% 0.5%
Corn Planted Area (Mil ac)
Baseline estimates 76.1 78.3 79.2 80.2 80.1 80.7 80.6 80.4 80.4 80.9 80.5 80.4 81.7 81.4 80.9 80.1
Renewable Alternative 76.1 78.3 79.2 80.7 80.6 81.2 81.8 82.1 82.2 82.4 82.6 82.7 82.8 82.9 83.0 81.2
Difference from baseline 0.0% 0.0% 0.0% 0.6% 0.6% 0.6% 1.5% 2.1% 2.2% 1.9% 2.6% 2.9% 1.4% 1.8% 2.6% 1.4%
Soybean Planted Area (Mil ac)
Baseline estimates 75.7 75.5 74.0 74.7 74.9 75.2 75.3 75.5 75.8 76.0 76.2 75.3 75.2 74.9 75.3 75.3
Renewable Alternative 75.7 75.5 74.5 75.2 75.7 76.5 76.4 76.7 77.0 77.4 77.6 77.9 78.2 78.5 78.8 76.8
Difference from baseline 0.0% 0.0% 0.7% 0.7% 1.1% 1.7% 1.5% 1.6% 1.6% 1.8% 1.8% 3.5% 4.1% 4.8% 4.6% 2.0%
Corn Production (Mil bu)
Baseline estimates 9,480 9,871 10,112 10,368 10,482 10,689 10,805 10,906 11,034 11,231 11,428 11,544 11,855 11,949 12,006 10,917
Renewable Alternative 9,480 9,871 10,112 10,432 10,548 10,756 10,965 11,136 11,281 11,440 11,726 11,874 12,022 12,170 12,318 11,075
Difference from baseline 0.0% 0.0% 0.0% 0.6% 0.6% 0.6% 1.5% 2.1% 2.2% 1.9% 2.6% 2.9% 1.4% 1.8% 2.6% 1.4%
Soybean Production (Mil bu)
Baseline estimates 2,944 3,024 2,989 3,044 3,078 3,115 3,147 3,182 3,221 3,256 3,291 3,278 3,298 3,313 3,357 3,169
Renewable Alternative 2,944 3,024 3,010 3,064 3,111 3,168 3,193 3,232 3,272 3,316 3,351 3,392 3,432 3,473 3,513 3,233
Difference from baseline 0.0% 0.0% 0.7% 0.7% 1.1% 1.7% 1.5% 1.6% 1.6% 1.8% 1.8% 3.5% 4.1% 4.8% 4.6% 2.0%
Soy Meal Production (thou tons)
Baseline estimates 39,883 40,364 40,844 41,445 42,046 42,646 43,848 44,449 43,968 44,449 44,929 44,809 45,170 44,953 45,194 43,266
Renewable Alternative 40,488 41,254 40,888 41,983 43,167 43,864 44,165 44,226 44,256 45,496 46,190 47,200 47,853 47,911 48,626 44,504
Difference from baseline 1.5% 2.2% 0.1% 1.3% 2.7% 2.9% 0.7% -0.5% 0.7% 2.4% 2.8% 5.3% 5.9% 6.6% 7.6% 2.9%
Soy Oil Production (mil lbs)
Baseline estimates 18,783 19,016 19,249 19,540 19,831 20,122 20,704 20,995 20,762 20,995 21,227 21,169 21,344 21,239 21,355 20,422
Renewable Alternative 19,076 19,562 20,451 21,196 21,998 22,361 22,518 22,550 22,566 23,213 23,575 24,102 24,443 24,694 25,070 22,492
Difference from baseline 1.6% 2.9% 6.2% 8.5% 10.9% 11.1% 8.8% 7.4% 8.7% 10.6% 11.1% 13.9% 14.5% 16.3% 17.4% 10.1%
Economic Impact of Mandatory Renewable Fuel Content Legislation
AUS Consultants 26 November 7, 2001
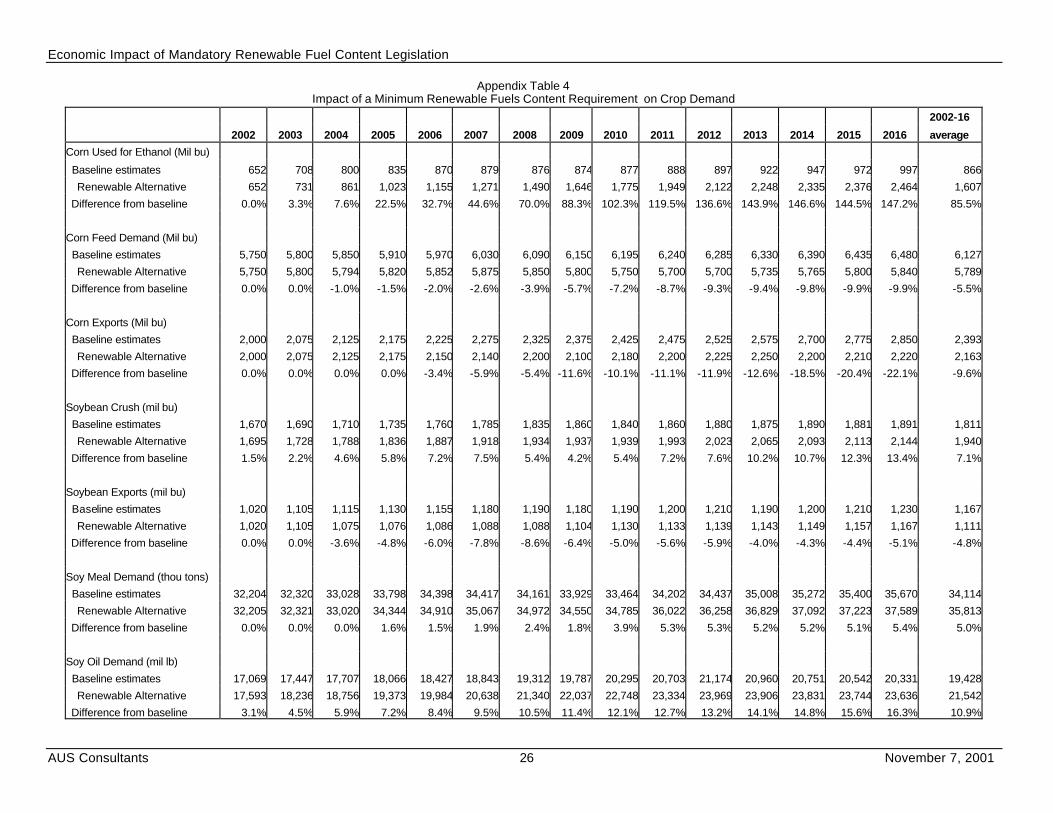
Appendix Table 4 Impact of a Minimum Renewable Fuels Content Requirement on Crop Demand
2002-16
2002 2003 2004 2005 2006 2007 2008 2009 2010 2011 2012 2013 2014 2015 2016 average
Corn Used for Ethanol (Mil bu)
Baseline estimates 652 708 800 835 870 879 876 874 877 888 897 922 947 972 997 866
Renewable Alternative 652 731 861 1,023 1,155 1,271 1,490 1,646 1,775 1,949 2,122 2,248 2,335 2,376 2,464 1,607
Difference from baseline 0.0% 3.3% 7.6% 22.5% 32.7% 44.6% 70.0% 88.3% 102.3% 119.5% 136.6% 143.9% 146.6% 144.5% 147.2% 85.5%
Corn Feed Demand (Mil bu)
Baseline estimates 5,750 5,800 5,850 5,910 5,970 6,030 6,090 6,150 6,195 6,240 6,285 6,330 6,390 6,435 6,480 6,127
Renewable Alternative 5,750 5,800 5,794 5,820 5,852 5,875 5,850 5,800 5,750 5,700 5,700 5,735 5,765 5,800 5,840 5,789
Difference from baseline 0.0% 0.0% -1.0% -1.5% -2.0% -2.6% -3.9% -5.7% -7.2% -8.7% -9.3% -9.4% -9.8% -9.9% -9.9% -5.5%
Corn Exports (Mil bu)
Baseline estimates 2,000 2,075 2,125 2,175 2,225 2,275 2,325 2,375 2,425 2,475 2,525 2,575 2,700 2,775 2,850 2,393
Renewable Alternative 2,000 2,075 2,125 2,175 2,150 2,140 2,200 2,100 2,180 2,200 2,225 2,250 2,200 2,210 2,220 2,163
Difference from baseline 0.0% 0.0% 0.0% 0.0% -3.4% -5.9% -5.4% -11.6% -10.1% -11.1% -11.9% -12.6% -18.5% -20.4% -22.1% -9.6%
Soybean Crush (mil bu)
Baseline estimates 1,670 1,690 1,710 1,735 1,760 1,785 1,835 1,860 1,840 1,860 1,880 1,875 1,890 1,881 1,891 1,811
Renewable Alternative 1,695 1,728 1,788 1,836 1,887 1,918 1,934 1,937 1,939 1,993 2,023 2,065 2,093 2,113 2,144 1,940
Difference from baseline 1.5% 2.2% 4.6% 5.8% 7.2% 7.5% 5.4% 4.2% 5.4% 7.2% 7.6% 10.2% 10.7% 12.3% 13.4% 7.1%
Soybean Exports (mil bu)
Baseline estimates 1,020 1,105 1,115 1,130 1,155 1,180 1,190 1,180 1,190 1,200 1,210 1,190 1,200 1,210 1,230 1,167
Renewable Alternative 1,020 1,105 1,075 1,076 1,086 1,088 1,088 1,104 1,130 1,133 1,139 1,143 1,149 1,157 1,167 1,111
Difference from baseline 0.0% 0.0% -3.6% -4.8% -6.0% -7.8% -8.6% -6.4% -5.0% -5.6% -5.9% -4.0% -4.3% -4.4% -5.1% -4.8%
Soy Meal Demand (thou tons)
Baseline estimates 32,204 32,320 33,028 33,798 34,398 34,417 34,161 33,929 33,464 34,202 34,437 35,008 35,272 35,400 35,670 34,114
Renewable Alternative 32,205 32,321 33,020 34,344 34,910 35,067 34,972 34,550 34,785 36,022 36,258 36,829 37,092 37,223 37,589 35,813
Difference from baseline 0.0% 0.0% 0.0% 1.6% 1.5% 1.9% 2.4% 1.8% 3.9% 5.3% 5.3% 5.2% 5.2% 5.1% 5.4% 5.0%
Soy Oil Demand (mil lb)
Baseline estimates 17,069 17,447 17,707 18,066 18,427 18,843 19,312 19,787 20,295 20,703 21,174 20,960 20,751 20,542 20,331 19,428
Renewable Alternative 17,593 18,236 18,756 19,373 19,984 20,638 21,340 22,037 22,748 23,334 23,969 23,906 23,831 23,744 23,636 21,542
Difference from baseline 3.1% 4.5% 5.9% 7.2% 8.4% 9.5% 10.5% 11.4% 12.1% 12.7% 13.2% 14.1% 14.8% 15.6% 16.3% 10.9%

Economic Impact of Mandatory Renewable Fuel Content Legislation
AUS Consultants 27 November 7, 2001
Appendix Table 5
Impact of a Minimum Renewable Fuels Content Requirement on Livestock
2002-16
2002 2003 2004 2005 2006 2007 2008 2009 2010 2011 2012 2013 2014 2015 2016 average
Production (Mil lbs)
Beef Production
Baseline 24,925 26,168 26,650 27,289 27,933 28,625 29,224 29,719 30,167 30,467 31,557 32,045 32,264 32,362 32,406 29,453
Renewable Alternative 24,925 26,168 26,650 27,289 27,933 28,625 29,224 29,719 30,167 30,467 31,309 31,423 31,642 31,740 31,783 29,271
Difference from baseline 0.0% 0.0% 0.0% 0.0% 0.0% 0.0% 0.0% 0.0% 0.0% 0.0% -0.8% -1.9% -1.9% -1.9% -1.9% -0.6%
Pork Production
Baseline 19,625 20,861 21,279 21,860 22,250 22,518 22,808 23,452 23,917 24,312 24,708 24,751 24,794 24,838 24,881 23,124
Renewable Alternative 19,625 20,861 21,279 21,417 21,473 21,881 22,332 22,790 23,255 23,150 23,546 23,589 23,632 23,675 23,718 22,415
Difference from baseline 0.0% 0.0% 0.0% -2.0% -3.5% -2.8% -2.1% -2.8% -2.8% -4.8% -4.7% -4.7% -4.7% -4.7% -4.7% -3.1%
Broiler Production
Baseline 31,500 32,000 34,000 33,750 34,525 35,340 36,250 37,100 38,000 38,500 39,078 39,664 40,259 40,862 41,475 36,820
Renewable Alternative 31,500 32,000 33,000 32,769 33,523 34,294 35,151 35,924 36,715 37,449 38,198 38,962 39,741 40,536 41,836 36,106
Difference from baseline 0.0% 0.0% -2.9% -2.9% -2.9% -3.0% -3.0% -3.2% -3.4% -2.7% -2.3% -1.8% -1.3% -0.8% 0.9% -1.9%
Prices ($/cwt)
Choice Steers, Neb Direct
Baseline $76.64 $74.16 $71.94 $69.78 $68.08 $67.20 $67.72 $68.76 $67.20 $66.63 $65.55 $65.08 $64.88 $63.77 $63.77 $68.08
Renewable Alternative $80.00 $76.64 $74.16 $72.87 $71.63 $71.23 $71.43 $72.03 $73.04 $71.38 $70.77 $69.63 $69.13 $68.91 $68.22 $72.07
Difference from baseline 4.4% 3.3% 3.1% 4.4% 5.2% 6.0% 5.5% 4.8% 8.7% 7.1% 8.0% 7.0% 6.6% 8.1% 7.0% 5.9%
Hogs, 7-Mkt Barrows&Gilts
Baseline $43.00 $41.46 $45.63 $42.95 $39.20 $42.46 $42.19 $41.59 $41.18 $40.84 $40.51 $40.47 $40.44 $40.40 $40.36 $41.51
Renewable Alternative $43.00 $41.46 $45.63 $42.95 $44.36 $46.01 $46.94 $46.47 $46.00 $45.62 $45.25 $45.21 $45.17 $45.13 $45.09 $44.95
Difference from baseline 0.0% 0.0% 0.0% 0.0% 13.2% 8.4% 11.3% 11.7% 11.7% 11.7% 11.7% 11.7% 11.7% 11.7% 11.7% 8.3%
Broilers, 12-City
Baseline $62.00 $57.35 $57.00 $57.17 $57.50 $57.60 $57.80 $57.90 $59.00 $59.89 $60.78 $61.70 $62.62 $63.56 $64.51 $59.76
Renewable Alternative $62.00 $59.35 $60.28 $60.07 $60.76 $61.46 $62.22 $62.91 $63.54 $63.86 $64.24 $64.69 $65.14 $65.60 $66.06 $62.81
Difference from baseline 0.0% 3.5% 5.7% 5.1% 5.7% 6.7% 7.7% 8.7% 7.7% 6.6% 5.7% 4.9% 4.0% 3.2% 2.4% 5.1%
Economic Impact of Mandatory Renewable Fuel Content Legislation
AUS Consultants 28 November 7, 2001
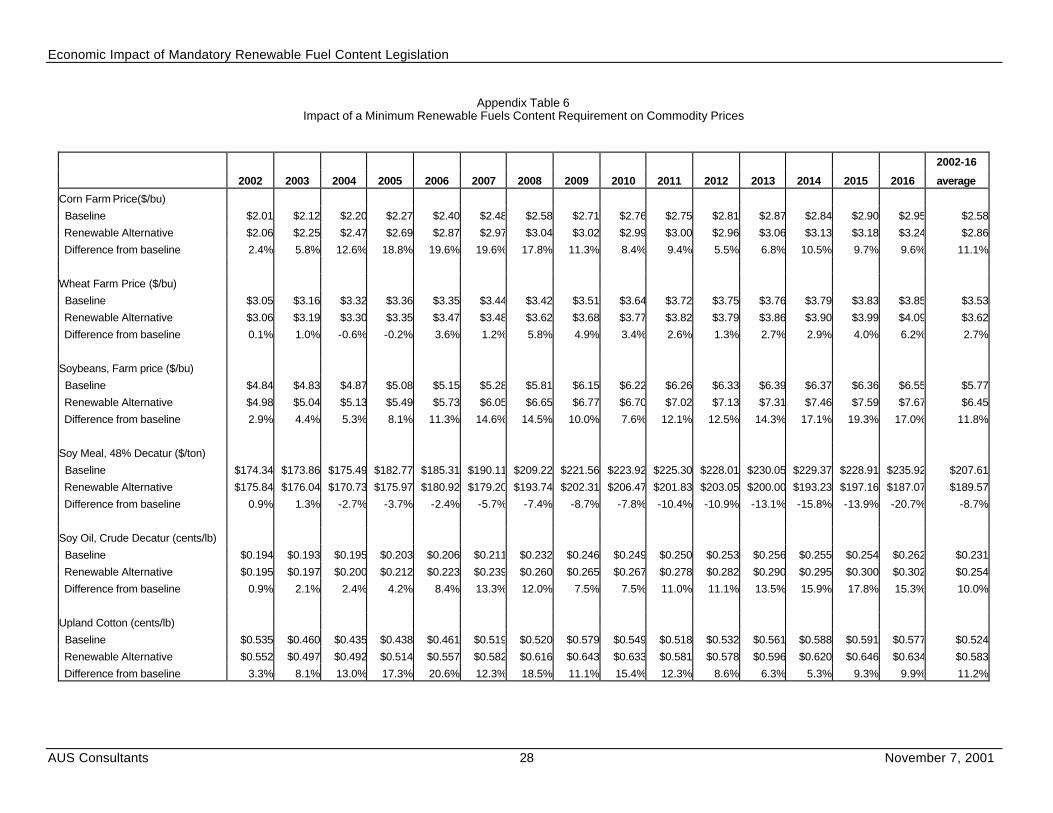
Appendix Table 6
Impact of a Minimum Renewable Fuels Content Requirement on Commodity Prices
2002-16
2002 2003 2004 2005 2006 2007 2008 2009 2010 2011 2012 2013 2014 2015 2016 average
Corn Farm Price($/bu)
Baseline $2.01 $2.12 $2.20 $2.27 $2.40 $2.48 $2.58 $2.71 $2.76 $2.75 $2.81 $2.87 $2.84 $2.90 $2.95 $2.58
Renewable Alternative $2.06 $2.25 $2.47 $2.69 $2.87 $2.97 $3.04 $3.02 $2.99 $3.00 $2.96 $3.06 $3.13 $3.18 $3.24 $2.86
Difference from baseline 2.4% 5.8% 12.6% 18.8% 19.6% 19.6% 17.8% 11.3% 8.4% 9.4% 5.5% 6.8% 10.5% 9.7% 9.6% 11.1%
Wheat Farm Price ($/bu)
Baseline $3.05 $3.16 $3.32 $3.36 $3.35 $3.44 $3.42 $3.51 $3.64 $3.72 $3.75 $3.76 $3.79 $3.83 $3.85 $3.53
Renewable Alternative $3.06 $3.19 $3.30 $3.35 $3.47 $3.48 $3.62 $3.68 $3.77 $3.82 $3.79 $3.86 $3.90 $3.99 $4.09 $3.62
Difference from baseline 0.1% 1.0% -0.6% -0.2% 3.6% 1.2% 5.8% 4.9% 3.4% 2.6% 1.3% 2.7% 2.9% 4.0% 6.2% 2.7%
Soybeans, Farm price ($/bu)
Baseline $4.84 $4.83 $4.87 $5.08 $5.15 $5.28 $5.81 $6.15 $6.22 $6.26 $6.33 $6.39 $6.37 $6.36 $6.55 $5.77
Renewable Alternative $4.98 $5.04 $5.13 $5.49 $5.73 $6.05 $6.65 $6.77 $6.70 $7.02 $7.13 $7.31 $7.46 $7.59 $7.67 $6.45
Difference from baseline 2.9% 4.4% 5.3% 8.1% 11.3% 14.6% 14.5% 10.0% 7.6% 12.1% 12.5% 14.3% 17.1% 19.3% 17.0% 11.8%
Soy Meal, 48% Decatur ($/ton)
Baseline $174.34 $173.86 $175.49 $182.77 $185.31 $190.11 $209.22 $221.56 $223.92 $225.30 $228.01 $230.05 $229.37 $228.91 $235.92 $207.61
Renewable Alternative $175.84 $176.04 $170.73 $175.97 $180.92 $179.20 $193.74 $202.31 $206.47 $201.83 $203.05 $200.00 $193.23 $197.16 $187.07 $189.57
Difference from baseline 0.9% 1.3% -2.7% -3.7% -2.4% -5.7% -7.4% -8.7% -7.8% -10.4% -10.9% -13.1% -15.8% -13.9% -20.7% -8.7%
Soy Oil, Crude Decatur (cents/lb)
Baseline $0.194 $0.193 $0.195 $0.203 $0.206 $0.211 $0.232 $0.246 $0.249 $0.250 $0.253 $0.256 $0.255 $0.254 $0.262 $0.231
Renewable Alternative $0.195 $0.197 $0.200 $0.212 $0.223 $0.239 $0.260 $0.265 $0.267 $0.278 $0.282 $0.290 $0.295 $0.300 $0.302 $0.254
Difference from baseline 0.9% 2.1% 2.4% 4.2% 8.4% 13.3% 12.0% 7.5% 7.5% 11.0% 11.1% 13.5% 15.9% 17.8% 15.3% 10.0%
Upland Cotton (cents/lb)
Baseline $0.535 $0.460 $0.435 $0.438 $0.461 $0.519 $0.520 $0.579 $0.549 $0.518 $0.532 $0.561 $0.588 $0.591 $0.577 $0.524
Renewable Alternative $0.552 $0.497 $0.492 $0.514 $0.557 $0.582 $0.616 $0.643 $0.633 $0.581 $0.578 $0.596 $0.620 $0.646 $0.634 $0.583
Difference from baseline 3.3% 8.1% 13.0% 17.3% 20.6% 12.3% 18.5% 11.1% 15.4% 12.3% 8.6% 6.3% 5.3% 9.3% 9.9% 11.2%

Economic Impact of Mandatory Renewable Fuel Content Legislation
AUS Consultants 29 November 7, 2001
Appendix Table 7
Impact of a Minimum Renewable Fuels Content Requirement on Farm Income
2001-16
2002 2003 2004 2005 2006 2007 2008 2009 2010 2011 2012 2013 2014 2015 2016 Avg
Cash Receipts:
Livestock & products (Bil $)
Baseline estimates $106.8 $101.9 $105.4 $105.2 $105.4 $108.3 $110.1 $112.5 $115.8 $116.7 $119.6 $121.5 $123.5 $125.5 $127.2 $113.7
Renewable Alternative $106.8 $102.8 $106.2 $105.9 $107.8 $111.1 $114.2 $117.0 $120.0 $120.8 $123.5 $125.1 $127.1 $129.3 $131.1 $116.6
Difference from baseline 0.0% 0.9% 0.7% 0.6% 2.3% 2.6% 3.7% 3.9% 3.6% 3.5% 3.3% 3.0% 3.0% 3.0% 3.1% 2.5%
Crops (Bil $)
Baseline estimates $100.6 $102.8 $104.8 $110.0 $115.7 $121.7 $129.5 $136.2 $139.0 $141.4 $144.9 $148.0 $150.4 $153.6 $156.5 $130.4
Renewable Alternative $103.1 $107.1 $111.1 $120.7 $128.3 $136.0 $142.6 $144.9 $146.5 $149.7 $152.5 $158.4 $163.6 $168.1 $172.3 $140.3
Difference from baseline 2.5% 4.2% 6.0% 9.7% 10.9% 11.7% 10.1% 6.4% 5.4% 5.9% 5.3% 7.0% 8.8% 9.4% 10.1% 7.6%
Government Payments (Bil $)
Baseline estimates $9.5 $9.0 $8.4 $7.8 $7.0 $6.4 $5.9 $5.7 $5.4 $5.2 $5.0 $4.9 $4.7 $4.6 $4.4 $6.2
Renewable Alternative $9.1 $8.4 $7.7 $7.1 $6.4 $5.8 $5.4 $5.1 $4.9 $4.7 $4.5 $4.4 $4.3 $4.1 $4.0 $5.7
Difference from baseline -4.3% -6.9% -8.3% -9.0% -9.0% -9.0% -9.0% -9.0% -9.0% -9.0% -9.0% -9.0% -9.0% -9.0% -9.0% -8.3%
Case Expenses (Bil $)
Baseline estimates $183.8 $188.8 $194.2 $199.7 $205.3 $211.0 $216.5 $221.9 $227.2 $232.7 $238.3 $244.0 $249.9 $255.9 $262.0 $222.1
Renewable Alternative $183.8 $189.4 $195.6 $201.7 $208.1 $214.6 $221.0 $227.3 $233.5 $239.9 $246.5 $253.3 $260.3 $267.4 $274.8 $227.8
Difference from baseline 0.0% 0.3% 0.7% 1.0% 1.4% 1.7% 2.1% 2.4% 2.8% 3.1% 3.5% 3.8% 4.2% 4.5% 4.9% 2.6%
Net Cash Income (Bil $)
Baseline estimates $49.3 $41.3 $41.0 $40.2 $39.8 $42.6 $46.4 $50.1 $50.8 $48.5 $49.3 $48.7 $47.3 $46.6 $45.1 $45.8
Renewable Alternative $51.4 $45.3 $46.0 $48.7 $51.3 $55.5 $58.6 $57.3 $55.7 $53.2 $52.3 $53.0 $53.3 $52.8 $51.6 $52.4
Difference from baseline 4.2% 9.6% 12.3% 21.3% 29.0% 30.2% 26.3% 14.5% 9.7% 9.7% 5.9% 8.7% 12.7% 13.2% 14.5% 14.4%
Net Cash Income (Bil 1996 $)
Baseline estimates $44.0 $35.9 $34.6 $33.0 $31.8 $33.1 $35.2 $37.0 $36.7 $34.2 $34.0 $32.8 $31.0 $29.9 $28.2 $34.1
Renewable Alternative $45.9 $39.4 $38.8 $40.0 $41.0 $43.1 $44.4 $42.3 $40.2 $37.5 $36.0 $35.6 $35.0 $33.8 $32.3 $39.0
Difference from baseline 4.2% 9.6% 12.3% 21.3% 29.0% 30.2% 26.3% 14.5% 9.7% 9.7% 5.9% 8.7% 12.7% 13.2% 14.5% 14.5%