MBA 750: BUSINESS ETHICS Nicos Rodosthenous PhD Lecture 5 14/7/20151Dr Nicos Rodosthenous.

An Economic Analysis of Conflicts

ThiS is a FM Blank Page
Nicos Christodoulakis
An Economic Analysisof Conflicts
With an Applicationto the Greek Civil War 1946-1949

Nicos ChristodoulakisDepartment of International & European Economics StudiesAthens University of Economics & Business (AUEB)Athens, Greece
ISBN 978-3-319-32260-5 ISBN 978-3-319-32261-2 (eBook)DOI 10.1007/978-3-319-32261-2
Library of Congress Control Number: 2016946028
© Springer International Publishing Switzerland 2016This work is subject to copyright. All rights are reserved by the Publisher, whether the whole or part ofthe material is concerned, specifically the rights of translation, reprinting, reuse of illustrations,recitation, broadcasting, reproduction on microfilms or in any other physical way, and transmissionor information storage and retrieval, electronic adaptation, computer software, or by similar ordissimilar methodology now known or hereafter developed.The use of general descriptive names, registered names, trademarks, service marks, etc. in thispublication does not imply, even in the absence of a specific statement, that such names are exemptfrom the relevant protective laws and regulations and therefore free for general use.The publisher, the authors and the editors are safe to assume that the advice and information in thisbook are believed to be true and accurate at the date of publication. Neither the publisher nor theauthors or the editors give a warranty, express or implied, with respect to the material containedherein or for any errors or omissions that may have been made.
Printed on acid-free paper
This Springer imprint is published by Springer NatureThe registered company is Springer International Publishing AG Switzerland
Preface
This book has been a product of serendipity. In 2013, I was doing research on the
economic and currency crisis that hit Greece in the interwar period and then started
to look at economic developments in the 1940s. The lack of statistical data covering
the period of Axis Occupation (1941–1945) and the subsequent Civil War (1946–
1949) led me to search for studies and reports prepared by the British and US
missions in Greece at that time.
Eventually, I visited the US National Archives in Washington DC and asked for
some declassified reports that were prepared in the late 1940s by JUSMAG, the
Joint US Military Advisory Group to Greece. The material consisted mostly of
trivial reports on the economic situation, except that some documents included a
systematic recording of all the battles that took place during the Civil War. There
were monthly data covering battle casualties and army formations of the guerrillas
and the Greek National Army, as well as their geographical dispersion for the
period stretching from January 1948 to December 1949.
I couldn’t believe my luck. As far as I know, this is one of the very few
systematic recordings of a civil war that is available to date, even if recent intrastate
conflicts worldwide are taken into account.
Upon returning to Greece, I set about to complete the data series backwards and
thus obtain a full record since the start of the Civil War in 1946. To that effect, all
available military archives of the Greek Army and a number of reports released by
the Communist Party of Greece were classified in a pattern similar to that of the US
series. In this way, a complete monthly battle database was obtained for
1946–1947. Additional data covering persecutions of political opponents and the
destruction of productive activities during the conflict were also compiled from
relevant sources.
Reading the prolific academic literature on civil wars, either contemporary or
past ones, I was impressed by the scarcity of quantitative and systematic evidence
available on the evolution of specific civil wars over time. The vast majority of
empirical work is based on cross-country data. Usually, these series cover total
battle casualties and aggregate socio-economic conditions and are subsequently
v

used in cross-estimates to test alternative hypotheses on intrastate conflicts. Apart
from implicitly making the assumption that countries respond to such conflicts in a
similar manner, cross-section analysis is not capable of capturing the dynamics of a
civil war. The particular patterns each conflict has followed, or the specific condi-
tions under which it broke out or was terminated, are not possible to analyse.
For that reason, I thought that it would perhaps be useful to concentrate on how a
civil war can be modelled in a single country. The task involved the derivation of
appropriate combat models or a substantial modification of existing ones, as well as
setting up a number of econometric procedures so as to properly estimate battle
interactions. Then the battle time series available on the Greek conflict were used to
test the properties of the dynamic process. Occasionally, some of the model pre-
dictions are compared by using the Correlates of Civil War (COCW) database.
I hope that the outcome will contribute both to theoretical aspects of modelling
conflict situations and to a detailed description and understanding of the dynamic
patterns observed in the Greek Civil War. Although motivated by the examination
of a civil war in a particular country, this book hopes to offer some analytical tools
that are useful in improving the analysis on—and the understanding of—many
others.
Athens, Greece Nicos Christodoulakis
April 2016
vi Preface
Acknowledgements
I am deeply obliged to Demetrios Varakis and Christos Triantopoulos for the
meticulous compilation of data from Greek military archives. This book would
not have been possible without the help, advice and comments received in several
seminars in which earlier parts of this research were presented. I thank the partic-
ipants in seminars held in the Bank of Greece, the London School of Economics, the
Athens University of Economics, the Yale University and the Independent Archives
of Social History in Athens (ASKI) for their useful remarks and constructive
criticism. I also wish to thank the Journal of Defence and Peace Economics for
publishing a substantial part of my research on the Greek Civil War, and especially
the Editor, Professor Christos Kollias, for his encouragement and suggestions
throughout the early research project.
Chapter 2, Sects. 3.7, 4.7, 6.2, 6.3, 7.6, 8.5, 8.7, 9.2, 10.1, 10.2, and Data
Appendix are derived, in part, from two articles published in the Journal of Defence
and Peace Economics on 28 Jan 2015 and 02 Mar 2015, respectively, available
online: http://dx.doi.org/10.1080/10242694.2014.1000010, http://dx.doi.org/
10.1080/10242694.2015.1016297
vii

ThiS is a FM Blank Page
Abbreviations
COCW Correlates of Civil War
DAG Democratic Army of Greece
GCW Greek Civil War
GDP Gross Domestic Product
GNA Greek National Army
HQ Headquarters
JUSMAG Joint US Military Advisory Group to Greece
KKE The Communist Party of Greece
SIPRI Stockholm International Peace Research Institute
UK United Kingdom
US United States of America
USSR The Soviet Union
WW1 First World War
WW2 Second World War
Mathematical
i.i.d. independent and identically distributed
LHS left-hand side
OLS ordinary least squares
RHS right-hand side
SUR seemingly unrelated regression
w.r.t. with respect to
ix

ThiS is a FM Blank Page

Contents
1 Introduction: Economic Analysis and Civil Wars . . . . . . . . . . . . . . 1
1.1 The Economic Effects of Conflict . . . . . . . . . . . . . . . . . . . . . . 1
1.2 The Conflict of Economics: Rival Explanations of Causes . . . . 3
1.3 Empirical Relevance . . . . . . . . . . . . . . . . . . . . . . . . . . . . . . . . 4
1.4 Conflict as an Institutional Failure . . . . . . . . . . . . . . . . . . . . . . 5
1.5 Conflict Modelling . . . . . . . . . . . . . . . . . . . . . . . . . . . . . . . . . 6
1.5.1 The Two-Numbers Problem . . . . . . . . . . . . . . . . . . . . 7
1.5.2 Enter Dynamics . . . . . . . . . . . . . . . . . . . . . . . . . . . . . 7
1.6 Conflict Definitions . . . . . . . . . . . . . . . . . . . . . . . . . . . . . . . . . 8
1.7 Book Structure . . . . . . . . . . . . . . . . . . . . . . . . . . . . . . . . . . . . 9
References . . . . . . . . . . . . . . . . . . . . . . . . . . . . . . . . . . . . . . . . . . . . 11
2 The Greek Civil War 1946–1949: Main Events and Data . . . . . . . . 13
2.1 The Greek Conflict . . . . . . . . . . . . . . . . . . . . . . . . . . . . . . . . . 13
2.1.1 Origins . . . . . . . . . . . . . . . . . . . . . . . . . . . . . . . . . . . 13
2.1.2 Occupation . . . . . . . . . . . . . . . . . . . . . . . . . . . . . . . . 14
2.1.3 The Onset of the Civil War . . . . . . . . . . . . . . . . . . . . 15
2.1.4 Prosperity and Democracy Curtailed . . . . . . . . . . . . . . 16
2.2 Data Analysis . . . . . . . . . . . . . . . . . . . . . . . . . . . . . . . . . . . . . 16
2.2.1 The Statistics of Conflict . . . . . . . . . . . . . . . . . . . . . . 17
2.2.2 Periodicity . . . . . . . . . . . . . . . . . . . . . . . . . . . . . . . . . 18
2.2.3 The Conflict Distribution . . . . . . . . . . . . . . . . . . . . . . 19
2.3 The Escalation of Conflict . . . . . . . . . . . . . . . . . . . . . . . . . . . . 20
2.3.1 The State Army (GNA) . . . . . . . . . . . . . . . . . . . . . . . 20
2.3.2 The Guerrilla Army (DAG) . . . . . . . . . . . . . . . . . . . . 21
2.3.3 Population Displacement . . . . . . . . . . . . . . . . . . . . . . 22
References . . . . . . . . . . . . . . . . . . . . . . . . . . . . . . . . . . . . . . . . . . . . 23
3 Static Models of Conflict . . . . . . . . . . . . . . . . . . . . . . . . . . . . . . . . . 25
3.1 Conflict Motivation . . . . . . . . . . . . . . . . . . . . . . . . . . . . . . . . . 25
3.2 The Static Tullock Model . . . . . . . . . . . . . . . . . . . . . . . . . . . . 26
xi

3.2.1 Payoffs and Win Probabilities . . . . . . . . . . . . . . . . . . . 26
3.2.2 Optimal Effort . . . . . . . . . . . . . . . . . . . . . . . . . . . . . . 28
3.3 The Collier-Hoeffler Framework . . . . . . . . . . . . . . . . . . . . . . . 28
3.3.1 Guerrillas . . . . . . . . . . . . . . . . . . . . . . . . . . . . . . . . . 29
3.3.2 Government . . . . . . . . . . . . . . . . . . . . . . . . . . . . . . . . 29
3.4 Optimal Armies . . . . . . . . . . . . . . . . . . . . . . . . . . . . . . . . . . . 30
3.5 Stylized Facts . . . . . . . . . . . . . . . . . . . . . . . . . . . . . . . . . . . . . 31
3.5.1 Inequality and Class Struggle . . . . . . . . . . . . . . . . . . . 31
3.6 Criticism to the Collier-Hoeffler Model . . . . . . . . . . . . . . . . . . 32
3.7 APPLICATION: Greek Grievances and Conflict . . . . . . . . . . . 33
3.7.1 Social Grievances . . . . . . . . . . . . . . . . . . . . . . . . . . . 33
3.7.2 Contemporaneous Deprivation . . . . . . . . . . . . . . . . . . 34
3.7.3 Discontent and Class Structure . . . . . . . . . . . . . . . . . . 35
3.7.4 Entrenched Grievances . . . . . . . . . . . . . . . . . . . . . . . . 37
References . . . . . . . . . . . . . . . . . . . . . . . . . . . . . . . . . . . . . . . . . . . . 38
4 Models of Repression and Inclusion . . . . . . . . . . . . . . . . . . . . . . . . 41
4.1 Introduction . . . . . . . . . . . . . . . . . . . . . . . . . . . . . . . . . . . . . . 41
4.2 Repression and Inclusion . . . . . . . . . . . . . . . . . . . . . . . . . . . . . 42
4.2.1 Repression . . . . . . . . . . . . . . . . . . . . . . . . . . . . . . . . . 42
4.2.2 Reprisals . . . . . . . . . . . . . . . . . . . . . . . . . . . . . . . . . . 42
4.2.3 Fighting Capabilities . . . . . . . . . . . . . . . . . . . . . . . . . 42
4.2.4 Inclusion Offers . . . . . . . . . . . . . . . . . . . . . . . . . . . . . 43
4.3 Avoiding the Conflict . . . . . . . . . . . . . . . . . . . . . . . . . . . . . . . 44
4.3.1 Peace Chances . . . . . . . . . . . . . . . . . . . . . . . . . . . . . . 44
4.3.2 Balance of Power . . . . . . . . . . . . . . . . . . . . . . . . . . . . 46
4.4 Break-Out of Civil War . . . . . . . . . . . . . . . . . . . . . . . . . . . . . . 47
4.4.1 The Guerrilla Army . . . . . . . . . . . . . . . . . . . . . . . . . . 47
4.4.2 The State Army . . . . . . . . . . . . . . . . . . . . . . . . . . . . . 49
4.4.3 Optimal Armies . . . . . . . . . . . . . . . . . . . . . . . . . . . . . 49
4.5 Stylized Facts of Conflict . . . . . . . . . . . . . . . . . . . . . . . . . . . . 50
4.5.1 Counter-Productive Deprivation . . . . . . . . . . . . . . . . . 50
4.5.2 Capabilities and Terrain . . . . . . . . . . . . . . . . . . . . . . . 51
4.5.3 Termination and Recurrence of Hostilities . . . . . . . . . . 51
4.5.4 Agendas and Propaganda Wars . . . . . . . . . . . . . . . . . . 51
4.6 APPLICATION: Repression and Inclusion in Interwar
Europe . . . . . . . . . . . . . . . . . . . . . . . . . . . . . . . . . . . . . . . . . . 52
4.6.1 Civil Wars in Europe . . . . . . . . . . . . . . . . . . . . . . . . . 52
4.6.2 Reconciliation and Reconstruction . . . . . . . . . . . . . . . 54
4.7 APPLICATION: Exclusion and Persecution in Greece . . . . . . . 54
4.7.1 Measuring Repression Politics . . . . . . . . . . . . . . . . . . 55
4.7.2 Regional Formations . . . . . . . . . . . . . . . . . . . . . . . . . 55
4.7.3 Raising the Payoffs . . . . . . . . . . . . . . . . . . . . . . . . . . 57
xii Contents

Appendix . . . . . . . . . . . . . . . . . . . . . . . . . . . . . . . . . . . . . . . . . . . . . 58
Proof of Proposition 1 . . . . . . . . . . . . . . . . . . . . . . . . . . . . . . . 58
Proof of Proposition 2 . . . . . . . . . . . . . . . . . . . . . . . . . . . . . . . 58
Proof of Proposition 3 . . . . . . . . . . . . . . . . . . . . . . . . . . . . . . . 58
References . . . . . . . . . . . . . . . . . . . . . . . . . . . . . . . . . . . . . . . . . . . . 59
5 Dynamic Models of Conflict . . . . . . . . . . . . . . . . . . . . . . . . . . . . . . 61
5.1 Modelling Conflict Interactions . . . . . . . . . . . . . . . . . . . . . . . . 61
5.2 The Lanchester Model . . . . . . . . . . . . . . . . . . . . . . . . . . . . . . 62
5.2.1 Congestion Effects . . . . . . . . . . . . . . . . . . . . . . . . . . . 63
5.2.2 Criticism . . . . . . . . . . . . . . . . . . . . . . . . . . . . . . . . . . 64
5.3 Lotka-Volterra Models . . . . . . . . . . . . . . . . . . . . . . . . . . . . . . 65
5.3.1 The Arms-Race Model . . . . . . . . . . . . . . . . . . . . . . . . 65
5.3.2 Non-linear Models . . . . . . . . . . . . . . . . . . . . . . . . . . . 66
5.3.3 Steady-States and Stability . . . . . . . . . . . . . . . . . . . . . 66
5.3.4 Lagged Discrete-Time Models . . . . . . . . . . . . . . . . . . 67
5.3.5 Fractional Models . . . . . . . . . . . . . . . . . . . . . . . . . . . 69
5.3.6 Criticism . . . . . . . . . . . . . . . . . . . . . . . . . . . . . . . . . . 70
5.4 The Lotka-Volterra Model as a Cournot Competition . . . . . . . . 71
5.4.1 Payoffs in a Lotka-Volterra Framework . . . . . . . . . . . . 71
5.4.2 Reaction Functions . . . . . . . . . . . . . . . . . . . . . . . . . . 73
5.5 The Conflict Trap . . . . . . . . . . . . . . . . . . . . . . . . . . . . . . . . . . 74
5.5.1 A Non-autonomous Model . . . . . . . . . . . . . . . . . . . . . 74
5.5.2 Conflict Equilibria . . . . . . . . . . . . . . . . . . . . . . . . . . . 75
5.5.3 Stable Equilibria . . . . . . . . . . . . . . . . . . . . . . . . . . . . 76
Appendix . . . . . . . . . . . . . . . . . . . . . . . . . . . . . . . . . . . . . . . . . . . . . 77
A. Proof of Propositions 1, 2, 3 . . . . . . . . . . . . . . . . . . . . . . . . 77
B. Wrong Lotka-Volterra Models . . . . . . . . . . . . . . . . . . . . . . 78
References . . . . . . . . . . . . . . . . . . . . . . . . . . . . . . . . . . . . . . . . . . . . 80
6 Estimation of Conflict Dynamics . . . . . . . . . . . . . . . . . . . . . . . . . . . 83
6.1 Estimation Issues . . . . . . . . . . . . . . . . . . . . . . . . . . . . . . . . . . 83
6.1.1 Model Specification . . . . . . . . . . . . . . . . . . . . . . . . . . 83
6.1.2 Simultaneous Equation Bias . . . . . . . . . . . . . . . . . . . . 84
6.1.3 Stationarity . . . . . . . . . . . . . . . . . . . . . . . . . . . . . . . . 84
6.1.4 Estimation in First-Differences . . . . . . . . . . . . . . . . . . 85
6.2 APPLICATION: Estimating Conflict Dynamics in the Greek
Civil War . . . . . . . . . . . . . . . . . . . . . . . . . . . . . . . . . . . . . . . . 86
6.2.1 Single OLS Estimation . . . . . . . . . . . . . . . . . . . . . . . . 87
6.3 Evaluating the Conflict Trap . . . . . . . . . . . . . . . . . . . . . . . . . . 89
Appendix . . . . . . . . . . . . . . . . . . . . . . . . . . . . . . . . . . . . . . . . . . . . . 90
Alternative Estimations . . . . . . . . . . . . . . . . . . . . . . . . . . . . . . 90
Endogeneity Tests . . . . . . . . . . . . . . . . . . . . . . . . . . . . . . . . . 92
References . . . . . . . . . . . . . . . . . . . . . . . . . . . . . . . . . . . . . . . . . . . . 93
Contents xiii

7 A Model of Intertemporal Conflict . . . . . . . . . . . . . . . . . . . . . . . . . 95
7.1 Introduction . . . . . . . . . . . . . . . . . . . . . . . . . . . . . . . . . . . . . . 95
7.2 An Intertemporal Conflict Model . . . . . . . . . . . . . . . . . . . . . . . 95
7.2.1 Army Building . . . . . . . . . . . . . . . . . . . . . . . . . . . . . . 96
7.2.2 Battle Planning . . . . . . . . . . . . . . . . . . . . . . . . . . . . . 97
7.2.3 The Information Set . . . . . . . . . . . . . . . . . . . . . . . . . . 98
7.2.4 Optimal Battle Plans . . . . . . . . . . . . . . . . . . . . . . . . . 100
7.2.5 Battle-Effort Functions . . . . . . . . . . . . . . . . . . . . . . . . 101
7.3 Equilibrium and Dynamics . . . . . . . . . . . . . . . . . . . . . . . . . . . 101
7.3.1 The Army Locus . . . . . . . . . . . . . . . . . . . . . . . . . . . . 101
7.3.2 The Battle Locus . . . . . . . . . . . . . . . . . . . . . . . . . . . . 102
7.3.3 Stability and Response to Shocks . . . . . . . . . . . . . . . . 103
7.3.4 The Dynamics of State Army . . . . . . . . . . . . . . . . . . . 104
7.4 The Battle Equation . . . . . . . . . . . . . . . . . . . . . . . . . . . . . . . . 104
7.4.1 The Steady State . . . . . . . . . . . . . . . . . . . . . . . . . . . . 105
7.4.2 A Log-Linear Relationship . . . . . . . . . . . . . . . . . . . . . 105
7.4.3 The Lanchester Analogy . . . . . . . . . . . . . . . . . . . . . . . 106
7.5 Stylized Facts . . . . . . . . . . . . . . . . . . . . . . . . . . . . . . . . . . . . . 106
7.5.1 Conflict Patterns . . . . . . . . . . . . . . . . . . . . . . . . . . . . 106
7.5.2 The Log-Linear Pattern . . . . . . . . . . . . . . . . . . . . . . . 107
7.6 APPLICATION: The Dynamics of the Greek Civil War . . . . . . 110
7.6.1 Building Up the Guerrilla Army . . . . . . . . . . . . . . . . . 111
7.6.2 Endurance and Defeat . . . . . . . . . . . . . . . . . . . . . . . . 111
References . . . . . . . . . . . . . . . . . . . . . . . . . . . . . . . . . . . . . . . . . . . . 113
8 The Economic Impact of Civil Wars: A Production Function
Approach . . . . . . . . . . . . . . . . . . . . . . . . . . . . . . . . . . . . . . . . . . . . 115
8.1 Economic Losses . . . . . . . . . . . . . . . . . . . . . . . . . . . . . . . . . . 115
8.2 Endogenous Growth in a Civil War . . . . . . . . . . . . . . . . . . . . . 116
8.2.1 Infrastructure and Protection . . . . . . . . . . . . . . . . . . . . 117
8.2.2 Growth-Enhancing Policies . . . . . . . . . . . . . . . . . . . . 118
8.2.3 The Effect of a Civil War . . . . . . . . . . . . . . . . . . . . . . 119
8.3 Empirical Evidence . . . . . . . . . . . . . . . . . . . . . . . . . . . . . . . . . 121
8.4 Measurable Direct Costs . . . . . . . . . . . . . . . . . . . . . . . . . . . . . 122
8.5 APPLICATION: Estimating the Direct Cost of the Greek
Civil War . . . . . . . . . . . . . . . . . . . . . . . . . . . . . . . . . . . . . . . . 123
8.5.1 Assumptions . . . . . . . . . . . . . . . . . . . . . . . . . . . . . . . 123
8.5.2 Growth Accounting . . . . . . . . . . . . . . . . . . . . . . . . . . 124
8.5.3 Loss Evaluation . . . . . . . . . . . . . . . . . . . . . . . . . . . . . 126
8.6 Bullets Versus Books . . . . . . . . . . . . . . . . . . . . . . . . . . . . . . . 127
8.7 Counterfactual Analysis . . . . . . . . . . . . . . . . . . . . . . . . . . . . . 128
8.7.1 The Cost of Conflict Escalation . . . . . . . . . . . . . . . . . 128
xiv Contents
Appendix . . . . . . . . . . . . . . . . . . . . . . . . . . . . . . . . . . . . . . . . . . . . . 130
The Endogenous Growth Rate in an Economy
with Civil War . . . . . . . . . . . . . . . . . . . . . . . . . . . . . . . . . . . . 130
Proof of Propositions 1, 2, 3 . . . . . . . . . . . . . . . . . . . . . . . . . . 132
References . . . . . . . . . . . . . . . . . . . . . . . . . . . . . . . . . . . . . . . . . . . . 132
9 The Comparative Economic Cost of Civil Wars . . . . . . . . . . . . . . . 135
9.1 The Comparative Approach . . . . . . . . . . . . . . . . . . . . . . . . . . . 135
9.2 A Two-Stage Approach . . . . . . . . . . . . . . . . . . . . . . . . . . . . . . 136
9.2.1 Estimation Stage I . . . . . . . . . . . . . . . . . . . . . . . . . . . 136
9.2.2 Estimation Stage II . . . . . . . . . . . . . . . . . . . . . . . . . . 139
9.2.3 Loss Evaluation . . . . . . . . . . . . . . . . . . . . . . . . . . . . . 141
References . . . . . . . . . . . . . . . . . . . . . . . . . . . . . . . . . . . . . . . . . . . . 142
10 A Critical Appraisal . . . . . . . . . . . . . . . . . . . . . . . . . . . . . . . . . . . . 143
10.1 The Role of Economic Analysis: A Postscript . . . . . . . . . . . . . 143
10.1.1 Dynamic Conflict Modelling . . . . . . . . . . . . . . . . . . . 144
10.1.2 The Correlates of War . . . . . . . . . . . . . . . . . . . . . . . . 144
10.1.3 Measuring the Cost of Conflict . . . . . . . . . . . . . . . . . . 145
10.2 Conflict as a Country Failure . . . . . . . . . . . . . . . . . . . . . . . . . . 146
10.3 Greek Failures . . . . . . . . . . . . . . . . . . . . . . . . . . . . . . . . . . . . 147
10.3.1 Uncontrollable Violence . . . . . . . . . . . . . . . . . . . . . . . 147
10.3.2 The Broken Trust . . . . . . . . . . . . . . . . . . . . . . . . . . . . 147
10.3.3 Signaling by Proxy . . . . . . . . . . . . . . . . . . . . . . . . . . . 148
10.4 Missing Strategies . . . . . . . . . . . . . . . . . . . . . . . . . . . . . . . . . 148
10.4.1 The Communist Party: A Cause Without a Strategy . . . 149
10.4.2 The Government: Power Without a Vision . . . . . . . . . 149
10.4.3 Lack of Leadership . . . . . . . . . . . . . . . . . . . . . . . . . . 150
References . . . . . . . . . . . . . . . . . . . . . . . . . . . . . . . . . . . . . . . . . . . . 150
11 Appendix: Data Sources and Definitions . . . . . . . . . . . . . . . . . . . . . 153
11.1 Nomenclature . . . . . . . . . . . . . . . . . . . . . . . . . . . . . . . . . . . . . 153
11.2 Data Sources . . . . . . . . . . . . . . . . . . . . . . . . . . . . . . . . . . . . . 153
11.3 Battle Data . . . . . . . . . . . . . . . . . . . . . . . . . . . . . . . . . . . . . . . 157
11.4 Discontent Data . . . . . . . . . . . . . . . . . . . . . . . . . . . . . . . . . . . 157
11.5 Variables . . . . . . . . . . . . . . . . . . . . . . . . . . . . . . . . . . . . . . . . 159
Contents xv

ThiS is a FM Blank Page
List of Figures
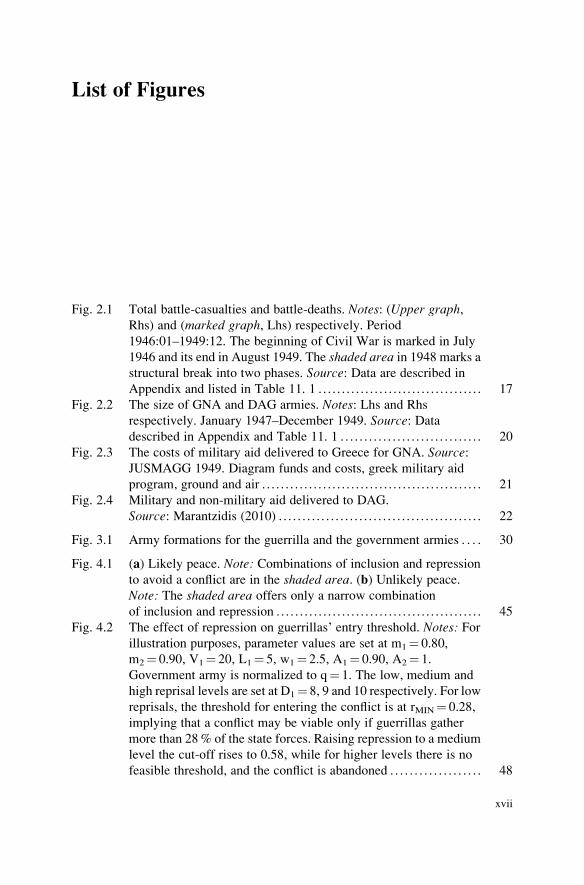
Fig. 2.1 Total battle-casualties and battle-deaths. Notes: (Upper graph,Rhs) and (marked graph, Lhs) respectively. Period1946:01–1949:12. The beginning of Civil War is marked in July
1946 and its end in August 1949. The shaded area in 1948 marks a
structural break into two phases. Source: Data are described in
Appendix and listed in Table 11. 1 . . . . . . . . . . . . . . . . . . . . . . . . . . . . . . . . . . . 17
Fig. 2.2 The size of GNA and DAG armies. Notes: Lhs and Rhs
respectively. January 1947–December 1949. Source: Datadescribed in Appendix and Table 11. 1 . . . . . . . . . . . . . . . . . . . . . . . . . . . . . . 20
Fig. 2.3 The costs of military aid delivered to Greece for GNA. Source:JUSMAGG 1949. Diagram funds and costs, greek military aid
program, ground and air . . . . . . . . . . . . . . . . . . . . . . . . . . . . . . . . . . . . . . . . . . . . . . . 21
Fig. 2.4 Military and non-military aid delivered to DAG.
Source: Marantzidis (2010) . . . . . . . . . . . . . . . . . . . . . . . . . . . . . . . . . . . . . . . . . . . 22
Fig. 3.1 Army formations for the guerrilla and the government armies . . . . 30
Fig. 4.1 (a) Likely peace. Note: Combinations of inclusion and repression
to avoid a conflict are in the shaded area. (b) Unlikely peace.
Note: The shaded area offers only a narrow combination
of inclusion and repression . . . . . . . . . . . . . . . . . . . . . . . . . . . . . . . . . . . . . . . . . . . . 45
Fig. 4.2 The effect of repression on guerrillas’ entry threshold. Notes: Forillustration purposes, parameter values are set at m1¼ 0.80,
m2¼ 0.90, V1¼ 20, L1¼ 5, w1¼ 2.5, A1¼ 0.90, A2¼ 1.
Government army is normalized to q¼ 1. The low, medium and
high reprisal levels are set at D1¼ 8, 9 and 10 respectively. For low
reprisals, the threshold for entering the conflict is at rMIN¼ 0.28,
implying that a conflict may be viable only if guerrillas gather
more than 28% of the state forces. Raising repression to a medium
level the cut-off rises to 0.58, while for higher levels there is no
feasible threshold, and the conflict is abandoned . . . . . . . . . . . . . . . . . . . 48
xvii
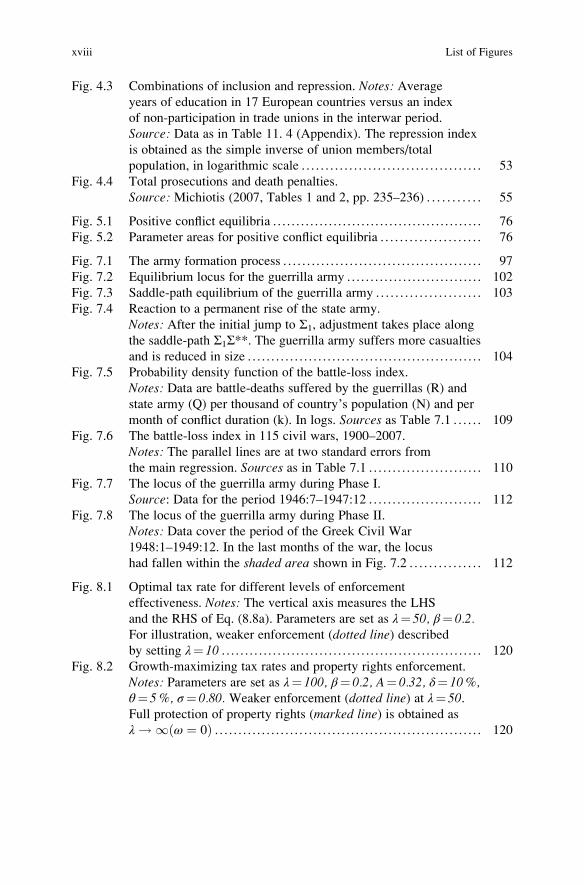
Fig. 4.3 Combinations of inclusion and repression. Notes: Averageyears of education in 17 European countries versus an index
of non-participation in trade unions in the interwar period.
Source: Data as in Table 11. 4 (Appendix). The repression index
is obtained as the simple inverse of union members/total
population, in logarithmic scale . . . . . . . . . . . . . . . . . . . . . . . . . . . . . . . . . . . . . . 53
Fig. 4.4 Total prosecutions and death penalties.
Source: Michiotis (2007, Tables 1 and 2, pp. 235–236) . . . . . . . . . . . 55
Fig. 5.1 Positive conflict equilibria . . . . . . . . . . . . . . . . . . . . . . . . . . . . . . . . . . . . . . . . . . . . . 76
Fig. 5.2 Parameter areas for positive conflict equilibria . . . . . . . . . . . . . . . . . . . . . 76
Fig. 7.1 The army formation process . . . . . . . . . . . . . . . . . . . . . . . . . . . . . . . . . . . . . . . . . . 97
Fig. 7.2 Equilibrium locus for the guerrilla army . . . . . . . . . . . . . . . . . . . . . . . . . . . . . 102
Fig. 7.3 Saddle-path equilibrium of the guerrilla army . . . . . . . . . . . . . . . . . . . . . . 103
Fig. 7.4 Reaction to a permanent rise of the state army.
Notes: After the initial jump to Σ1, adjustment takes place along
the saddle-path Σ1Σ**. The guerrilla army suffers more casualties
and is reduced in size . . . . . . . . . . . . . . . . . . . . . . . . . . . . . . . . . . . . . . . . . . . . . . . . . . 104
Fig. 7.5 Probability density function of the battle-loss index.
Notes: Data are battle-deaths suffered by the guerrillas (R) and
state army (Q) per thousand of country’s population (N) and per
month of conflict duration (k). In logs. Sources as Table 7.1 . . . . . . 109
Fig. 7.6 The battle-loss index in 115 civil wars, 1900–2007.
Notes: The parallel lines are at two standard errors from
the main regression. Sources as in Table 7.1 . . . . . . . . . . . . . . . . . . . . . . . . 110
Fig. 7.7 The locus of the guerrilla army during Phase I.
Source: Data for the period 1946:7–1947:12 . . . . . . . . . . . . . . . . . . . . . . . . 112
Fig. 7.8 The locus of the guerrilla army during Phase II.
Notes: Data cover the period of the Greek Civil War
1948:1–1949:12. In the last months of the war, the locus
had fallen within the shaded area shown in Fig. 7.2 . . . . . . . . . . . . . . . 112
Fig. 8.1 Optimal tax rate for different levels of enforcement
effectiveness. Notes: The vertical axis measures the LHS
and the RHS of Eq. (8.8a). Parameters are set as λ¼ 50, β¼ 0.2.For illustration, weaker enforcement (dotted line) describedby setting λ¼ 10 . . . . . . . . . . . . . . . . . . . . . . . . . . . . . . . . . . . . . . . . . . . . . . . . . . . . . . . . 120
Fig. 8.2 Growth-maximizing tax rates and property rights enforcement.
Notes: Parameters are set as λ¼ 100, β¼ 0.2, A¼ 0.32, δ¼ 10%,θ¼ 5%, σ¼ 0.80. Weaker enforcement (dotted line) at λ¼ 50.Full protection of property rights (marked line) is obtained as
λ ! 1 ω ¼ 0ð Þ . . . . . . . . . . . . . . . . . . . . . . . . . . . . . . . . . . . . . . . . . . . . . . . . . . . . . . . . . 120
xviii List of Figures

Fig. 8.3 Shares of public expenditure, Greece 1948–1970. Notes: A surge
in defense spending occurred again in 1967, when a military
dictatorship was imposed in Greece. Source: Kalafatisand Prontzas (2015). Table 85, p. 299 . . . . . . . . . . . . . . . . . . . . . . . . . . . . . . . 128
Fig. 8.4 A schematic representation of GDP recovery. (a) With Civil
War casualties and persecutions as actually happened.
(b) Counterfactual termination of hostilities in June 1949 . . . . . . . . . 129
Fig. 9.1 Actual and forecasted GDP for Nazi-occupied countries (a)
Belgium, (b) Netherlands, (c) Denmark, (d) Norway . . . . . . . . . . . . . . 140
Fig. 9.2 Actual and potential GDP for Greece 1946–1960. Actual GDP
is denoted by simple line; the hypothetical GDP estimated by using
four occupied countries (YHP_4) is denoted by asterisks; the one
estimated by using five occupied countries (YHP_5) by circles.
GDP is expressed in thousands of US Dollars at 1990 prices.
The shaded area is a measure of the failure of Greece to follow
other European states in postwar reconstruction . . . . . . . . . . . . . . . . . . . . 141
List of Figures xix

ThiS is a FM Blank Page

List of Tables
Table 2.1 Periodicity tests . . . . . . . . . . . . . . . . . . . . . . . . . . . . . . . . . . . . . . . . . . . . . . . . . . . . . 18
Table 2.2 Key statistics of battle deaths and casualties . . . . . . . . . . . . . . . . . . . . . 18
Table 3.1 Sociopolitical correlations . . . . . . . . . . . . . . . . . . . . . . . . . . . . . . . . . . . . . . . . . 35
Table 3.2 Class structure and political discontent (standard errors
in brackets) . . . . . . . . . . . . . . . . . . . . . . . . . . . . . . . . . . . . . . . . . . . . . . . . . . . . . . . . . . 36
Table 3.3 Old grievances and political discontent . . . . . . . . . . . . . . . . . . . . . . . . . . 38
Table 4.1 Guerrilla formations and persecutions . . . . . . . . . . . . . . . . . . . . . . . . . . . . 56
Table 6.1 Correlations: phase I . . . . . . . . . . . . . . . . . . . . . . . . . . . . . . . . . . . . . . . . . . . . . . . . 87
Table 6.2 Correlations: phase II . . . . . . . . . . . . . . . . . . . . . . . . . . . . . . . . . . . . . . . . . . . . . . . 87
Table 6.3 Separate OLS estimates . . . . . . . . . . . . . . . . . . . . . . . . . . . . . . . . . . . . . . . . . . . . 88
Table 6.4 Equilibria and stability . . . . . . . . . . . . . . . . . . . . . . . . . . . . . . . . . . . . . . . . . . . . . 89
Table 6.5 Seemingly unrelated regressions estimation . . . . . . . . . . . . . . . . . . . . . 91
Table 6.6 Two stage least squares estimation . . . . . . . . . . . . . . . . . . . . . . . . . . . . . . . 91
Table 6.7 Three stage least squares estimation . . . . . . . . . . . . . . . . . . . . . . . . . . . . . . 92
Table 7.1 Analysis of cross-section civil war data 1900–2007 . . . . . . . . . . . . 108
Table 7.2 Battle elasticity by continent . . . . . . . . . . . . . . . . . . . . . . . . . . . . . . . . . . . . . . 110
Table 8.1 Human toll and GDP losses due to the Civil War . . . . . . . . . . . . . . . 125
Table 9.1 War toll and the Marshall Plan . . . . . . . . . . . . . . . . . . . . . . . . . . . . . . . . . . . . 138
Table 9.2 Estimation and forecasting of ‘synthetic controls’ . . . . . . . . . . . . . . 139
Table 11.1 Conflict data 1946–1949, in persons . . . . . . . . . . . . . . . . . . . . . . . . . . . . . . 154
Table 11.2 DAG regional formations and allocation of persecutions . . . . . . . 156
Table 11.3 DAG regional formations and morphology . . . . . . . . . . . . . . . . . . . . . . 158
Table 11.4 Repression and inclusion in interwar Europe . . . . . . . . . . . . . . . . . . . . 159
Table 11.5 Chronology for the Greek Civil War . . . . . . . . . . . . . . . . . . . . . . . . . . . . . 160
xxi