An Ecological Design for the 21st Avenue West … Ecological Design for the 21st Avenue West...
70
An Ecological Design for the 21 st Avenue West Remediation-to-Restoration Project Prepared by: George Host, Paul Meysembourg, Carol Reschke, Valerie Brady, Gerald Niemi, Annie Bracey, and Lucinda Johnson Natural Resources Research Institute, University of Minnesota Duluth Matthew James and Jay Austin Large Lakes Observatory, University of Minnesota Duluth Elissa Buttermore U.S. Fish and Wildlife Service Contracted by United States Fish and Wildlife Service Cooperative Agreement F11AC00517 June 2013 NRRI/TR-2013/24
Transcript of An Ecological Design for the 21st Avenue West … Ecological Design for the 21st Avenue West...

An Ecological Design for the 21st Avenue West Remediation-to-Restoration Project
Prepared by:
George Host, Paul Meysembourg, Carol Reschke, Valerie Brady, Gerald Niemi, Annie Bracey, and Lucinda Johnson
Natural Resources Research Institute, University of Minnesota Duluth
Matthew James and Jay Austin Large Lakes Observatory, University of Minnesota Duluth
Elissa Buttermore U.S. Fish and Wildlife Service
Contracted by
United States Fish and Wildlife Service Cooperative Agreement F11AC00517
June 2013
NRRI/TR-2013/24

2
Full funding for this program is supported by a Cooperative Agreement from the U.S. Department of the Interior, Fish and Wildlife Service. Mention of trade names or commercial products does not constitute their endorsement by the U.S. Government.
The views and conclusions contained in this document are those of the authors and should not be interpreted as representing the opinions or policies of the U.S. Government. Mention of trade names or commercial products does not constitute their endorsement by the U.S. Government.

3
Contents
I. Background and Rationale ...................................................................................................... 2
II. Current Conditions at 21st Ave West ..................................................................................... 3
Bathymetry, Substrate and Stream Inputs ................................................................................... 3
Aquatic Vegetation ..................................................................................................................... 5
Wave Energy and Habitat Classes .............................................................................................. 6
Ecotoxicological Characterization .............................................................................................. 8
Invertebrate Community ........................................................................................................... 15
Avian Communities .................................................................................................................. 17
III. Modeling Approach ........................................................................................................... 18
Aquatic Vegetation Model ........................................................................................................ 18
Hydrodynamic Modeling .......................................................................................................... 20
IV. Ecological Design Scenarios.............................................................................................. 23
Scenario A ................................................................................................................................. 24
Habitat and biotic response ................................................................................................... 26
Physical Changes and Ecological Risk Considerations ........................................................ 28
Scenario B ................................................................................................................................. 30
Habitat and biotic response ................................................................................................... 31
Physical Changes and Ecological Risk Considerations ........................................................ 34
Scenario C ................................................................................................................................. 35
Habitat and biotic response ................................................................................................... 35
Physical Changes and Ecological Risk Considerations ........................................................ 38
Scenario D ................................................................................................................................. 39
Habitat and biotic response ................................................................................................... 40
Physical Changes and Ecological Risk Considerations ........................................................ 42
Scenario E ................................................................................................................................. 43
Habitat and Biotic Response ................................................................................................. 44
Physical Changes and Ecological Risk Considerations ........................................................ 47
V. Ecological Concept Plan ....................................................................................................... 48
AOC Coordinators Recommendations ..................................................................................... 48
Habitat and Biotic Response ................................................................................................. 50
4
Hydrodynamics ......................................................................................................................... 53
VI. Conclusions ........................................................................................................................ 55
Overview of the Project ............................................................................................................ 55
Biological Effects and Considerations ...................................................................................... 56
Aquatic Plant Community Considerations............................................................................ 56
Macroinvertebrate Community Considerations .................................................................... 57
Avian Community Considerations ........................................................................................ 58
Ecological Risk Management Considerations .......................................................................... 59
Additional Information Needs .................................................................................................. 60
Recommendations for Future Steps .......................................................................................... 61
Vegetation Studies ................................................................................................................ 61
VII. Literature Cited .................................................................................................................. 63
Appendices
Appendix 1: Introduction and Vegetation Sampling (G. Host, C. Reschke)
Appendix 2. Benthic Macroinvertebrate Surveys (V. Brady)
Appendix 3. Avian Community Surveys (G. Niemi, A. Bracey)
Appendix 4. Hydrodynamic Modeling of the Project Area (J. Austin, M. James)
Appendix 5. Ecotoxicological Characterization (E. Buttermore, Z. Jorgenson)
Appendix 6. Memo to AOC Coordinators
Appendix 7: 21st Avenue West R2R Ecological DesignReport on Public /Stakeholders Outreach
Efforts
2
I. Background and Rationale
The lower 21 miles of the St. Louis River, the largest U.S. tributary to Lake Superior, form the 4856 ha St. Louis River estuary. Despite the effects of more than 100 years of industrialized and urban development as a major Great Lakes port, the estuary remains the most significant source of biological productivity for western Lake Superior, and provides important wetland, sand beach, forested, and aquatic habitat types for a wide variety of fish and wildlife communities.
The lower St. Louis River and surrounding watershed were designated an 'Area of Concern' (AOC) under the Great Lakes Water Quality Agreement in 1989, listing nine beneficial use impairments (BUIs), such as loss of fish and wildlife habitat, degraded fish and wildlife populations, degradation of benthos, and fish deformities. To address these BUIs, the St. Louis River Alliance (SLRA) completed the Lower St. Louis River Habitat Plan, which identified ecosystems and sites with significant habitat limitations due to contaminated sediments and other unknown factors. The 21st Avenue West Habitat Complex is one of several priority sites for a 'Remediation-to-Restoration' (R-to-R) project. The intent of the R-to-R process is to implement remediation activities to address limiting factors such as sediment contamination while also implementing restoration projects that best complement the desired ecological vision.
This report documents the initial steps in the R-to-R process underway at 21st Avenue West, the development of an “Ecological Design” for the project area, and a preliminary evaluation of factors potentially limiting the realization of habitat and other land use goals. To establish the basis for this ecological design, researchers at the University of Minnesota Duluth’s Natural Resources Research Institute (NRRI), in cooperation with U. S. Fish and Wildlife Service, the U.S. Environmental Protection Agency, the U.S. Army Corps of Engineers, the Minnesota Pollution Control Agency, the Minnesota Department of Natural Resources and other partners, sampled the project area from late summer 2011 through fall 2012. The intent of field sampling was to establish baseline information on vegetation, benthos, birds, sediment contamination and types, and ecotoxicology. The subsequent ecological design effort will explore options to increase the overall footprint of quality aquatic vegetation beds and spawning habitat available, soften and extend shorelines, and remove or reduce the effect of industrially-influenced substrates. These options will be presented to adjacent landowners, as well as local and regional stakeholders, to contribute to the discussion on R-to-R options. The desired outcome of the project is to significantly increase the biological productivity of this complex of river flats and sheltered bays, in fulfillment of the SLRA Habitat Plan (SLRA 2002), while minimizing the risk of exposure of contaminants to fish and wildlife resources.
This project was funded under USFWS Cooperative Agreement Number F11AC00517, and is part of the USFWS Environmental Contaminants Program’s goal to address contaminant-related needs of the St. Louis River Area of Concern as part of the Great Lakes Restoration Initiative.

3
II. Current Conditions at 21st Ave West
Bathymetry, Substrate and Stream Inputs The 21st Ave West site is a complex of open water flats and shallow sheltered bay habitats that have been highly impaired by historical industrial activities (Figure 1). The project area covers approximately 526 acres and receives direct effluent from the Western Lake Superior Sanitary District (WLSSD) Treatment Plant. The site is heavily industrialized – it is bordered by the Canadian National Ore Docks and Rice’s Point, a built landscape that houses numerous industries, as well as a popular public access boat launch and recreation area.
Figure 1. 21st Avenue West remediation-to-restoration project area in the St. Louis River estuary, Duluth, Minnesota. Black to white shading shows current bathymetry.
The 21st Ave West site has three important water inputs. Miller and Coffee Creeks drain into the northernmost bay in the project area. Both creeks receive runoff from highly urbanized

4
watersheds, with the headwaters of Miller Creek draining Duluth’s largest commercial shopping area. The streams contribute large amounts of sediment to this small bay, and the City of Duluth dredges the sediment on a regular basis to protect culverts under the I-35 freeway. The other significant input to the site is the outfall from WLSSD, where an average of 43 million gallons per day of waste water enters the bay from the City of Duluth and the surrounding communities of Cloquet, Esko, Carlton, and the Sappi Paper Mill. Potential issues associated with the effluent from WLSSD include increased temperatures, which result in year-around open water near the plant, as well as potential loading of nutrients and chemicals of emerging concern, such as personal care products and pharmaceuticals.
Important bathymetric features of the project area include the North Channel, a deepwater channel that bisects the site, with a connected deep channel that extends into Miller and Coffee Creek Bay. There is also a deep rectangular depression to the southwest of Interstate Island. Interstate Island itself is a Wildlife Management Area created from dredge waste and maintained free of woody vegetation. The island contains nesting pairs of common tern, a species of special concern (Coffin and Pfannmuller 1988), albeit with significant competition from ring-billed gulls.
The dominant substrate of the project area is primarily silt, with sand-textured sediments along the shorelines and scattered small pockets of muck throughout the site. Compared to reference locations in the St. Louis River estuary, 21st Avenue has proportionately less organic sediments in its shallow waters (Figure 2).

5
Figure 2. Interpolated substrate map for 21st Avenue West project area.
Aquatic Vegetation The methods for aquatic vegetation surveys and plant community classification are described in Appendix 1. The aquatic vegetation present in the Project Area was very sparse and variable. In late summer of 2011 there were no aquatic plants visible at the water surface, but submerged aquatic plants were pulled up on the sampling rake. The total sample size was 64 points scattered through the Project Area; of those, 13 points were in water too deep (over 2 m) to be likely to support aquatic vegetation, and no plants were found at those points. Out of 51 points sampled in shallow water (under 2 m depth), 59% had some aquatic plants present, and 41% had no vegetation. The most abundant plants (those with the highest relative frequency) were water celery (Vallisneria americana), which was present at 29.4% of sample points, and algae (mostly filamentous) present at 15.7% of sample points. Each of the other aquatic plants present was found in fewer than 6% of the total sample points in shallow water. Three different portions of the bay had slightly different vegetation.
Near Interstate Island there were 24 shallow sample points and 13 points (54%) had Submerged Aquatic Vegetation (SAV) present. The only plants found near Interstate Island were scattered

6
sparse patches of wild celery (Vallisneria americana), and some sparse algae. At three sample points near Interstate Island wild celery was gathered from water depths of 2.0-2.1 m, which is slightly deeper than the 1.8 m contour line for delineating shallow versus deep water. Average water depth at vegetated sample points was 1.41 m, and average Secchi depth was 0.67 m. Sediments near Interstate Island were mostly sand and silt, with some clay.
In the central and western parts of the bay near WLSSD there were 16 shallow sample points, and only 2 points (12%) had SAV present; plants identified were Nuttall’s waterweed (Elodea nuttallii ) and a narrow-leaved Potamogeton sp. The narrow-leaved Potamogeton was not fruiting and so was unable to be identified to species. Average water depth at vegetated sample points was 1.1 m, and average Secchi depth was 0.59 m. Sediments near WLSSD were mostly silt and detritus with a little clay. The water in this area stays ice-free longer than adjacent areas of the harbor due to effluent water from WLSSD; therefore it often has a large population of waterfowl, especially Canada geese. The abundant detritus at this part of the bay may be due to waterfowl concentrations, or from runoff or effluent from WLSSD.
Near the eastern shore of the bay, along Garfield Street, there were 11 shallow sample points, and 6 points (55%) had SAV present, although one of those had only algae. The plants along Garfield Street included water celery, two species of waterweed (E. nuttallii and E. canadensis), a narrow-leaved Potamogeton sp. (not fruiting), and algae. Average water depth at vegetated sample points was 0.75 m, and average Secchi depth was 0.62 m. Sediments near the Garfield Street shore were mostly sand and silt, with some detritus and gravel (note: at one point the “gravel” included taconite pellets).
Overall aquatic plant diversity was very low in the Project Area, especially when compared to other sites recently sampled for remediation to restoration projects. Even with a much higher number of sample points in the shallow portions of the Project Area, the number of aquatic plant taxa present was in the very low end of the range for open water sample points.
Wave Energy and Habitat Classes Wind fetch, a surrogate for wave energy, is important for the establishment and maintenance of aquatic vegetation beds. A map of weighted wind fetch shows that the highest wind fetch values occur on the southern open water portion of the site. Rice’s Point and the built land on the northern border of the site provide protection to the Miller and Coffee Creek bay, a factor that increases the chances of establishing aquatic beds in this area (Figure 3).

7
Figure 3. Weighted wind fetch for 21st Ave West project area.
The combination of depth and potential wave energy can be used to define potential and mappable habitat classes (Figure 4). Based on previous work, four depth classes were considered: shallow (<0.65 m), intermediate (0.65-1.60 m), deep (1.6-2.5 m) and disphotic (> 2.5). These are divided into high and low energy, based on a fetch distance of 250 m, which corresponded to an inflection point in the aquatic vegetation model. Note that there is not a sharp transition between low and high energy; these should be thought of as low vs. intermediate/high energy classes. While these are all inherently continuous variables, placing depth and energy into classes allows for the creation of simpler and more interpretable maps that show the type and amount of habitat, both in the current condition and in the scenarios.

8
Figure 4. Distribution of habitat classes (depth x wave energy) under current conditions.
In general, the 21st Ave West site comprises primarily deep habitat, with 33% of the 526 ac in the disphotic (> 2.5 m) zone and 31% in the deep (1.6-2.5 m) category (Table 1). Only 62 ac or 12% of the area is classified as shallow, and most of this area is classified as intermediate/high energy. Low-energy habitats are relatively uncommon at the site in its current condition.
Ecotoxicological Characterization
MPCA Site Evaluations
The MPCA remediation staff evaluated recent and historical sediment chemistry data for the 21st Ave West Project Area by examining contaminant concentration data and comparing to
9
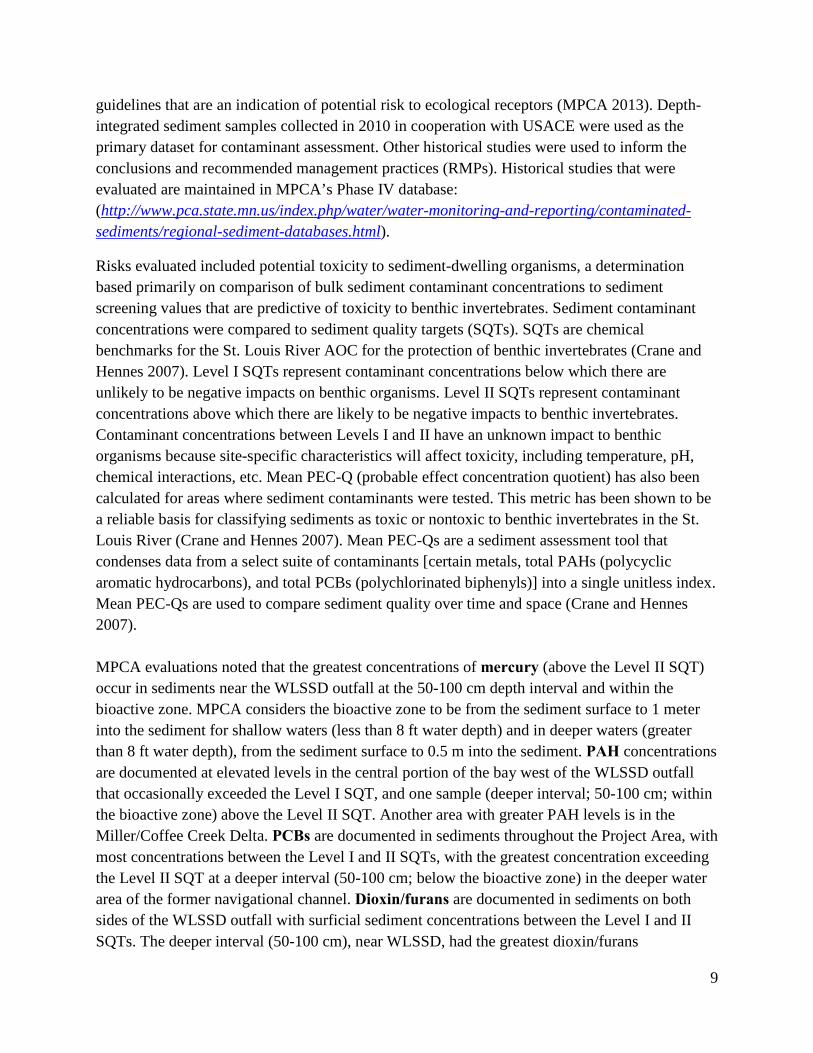
guidelines that are an indication of potential risk to ecological receptors (MPCA 2013). Depth-integrated sediment samples collected in 2010 in cooperation with USACE were used as the primary dataset for contaminant assessment. Other historical studies were used to inform the conclusions and recommended management practices (RMPs). Historical studies that were evaluated are maintained in MPCA’s Phase IV database: (http://www.pca.state.mn.us/index.php/water/water-monitoring-and-reporting/contaminated-sediments/regional-sediment-databases.html).
Risks evaluated included potential toxicity to sediment-dwelling organisms, a determination based primarily on comparison of bulk sediment contaminant concentrations to sediment screening values that are predictive of toxicity to benthic invertebrates. Sediment contaminant concentrations were compared to sediment quality targets (SQTs). SQTs are chemical benchmarks for the St. Louis River AOC for the protection of benthic invertebrates (Crane and Hennes 2007). Level I SQTs represent contaminant concentrations below which there are unlikely to be negative impacts on benthic organisms. Level II SQTs represent contaminant concentrations above which there are likely to be negative impacts to benthic invertebrates. Contaminant concentrations between Levels I and II have an unknown impact to benthic organisms because site-specific characteristics will affect toxicity, including temperature, pH, chemical interactions, etc. Mean PEC-Q (probable effect concentration quotient) has also been calculated for areas where sediment contaminants were tested. This metric has been shown to be a reliable basis for classifying sediments as toxic or nontoxic to benthic invertebrates in the St. Louis River (Crane and Hennes 2007). Mean PEC-Qs are a sediment assessment tool that condenses data from a select suite of contaminants [certain metals, total PAHs (polycyclic aromatic hydrocarbons), and total PCBs (polychlorinated biphenyls)] into a single unitless index. Mean PEC-Qs are used to compare sediment quality over time and space (Crane and Hennes 2007). MPCA evaluations noted that the greatest concentrations of mercury (above the Level II SQT) occur in sediments near the WLSSD outfall at the 50-100 cm depth interval and within the bioactive zone. MPCA considers the bioactive zone to be from the sediment surface to 1 meter into the sediment for shallow waters (less than 8 ft water depth) and in deeper waters (greater than 8 ft water depth), from the sediment surface to 0.5 m into the sediment. PAH concentrations are documented at elevated levels in the central portion of the bay west of the WLSSD outfall that occasionally exceeded the Level I SQT, and one sample (deeper interval; 50-100 cm; within the bioactive zone) above the Level II SQT. Another area with greater PAH levels is in the Miller/Coffee Creek Delta. PCBs are documented in sediments throughout the Project Area, with most concentrations between the Level I and II SQTs, with the greatest concentration exceeding the Level II SQT at a deeper interval (50-100 cm; below the bioactive zone) in the deeper water area of the former navigational channel. Dioxin/furans are documented in sediments on both sides of the WLSSD outfall with surficial sediment concentrations between the Level I and II SQTs. The deeper interval (50-100 cm), near WLSSD, had the greatest dioxin/furans
10
concentration (exceeding the Level II SQT). Metals (zinc, copper, lead, and nickel) are documented in sediments at concentrations often exceeding Level I SQTs, but not Level II SQTs, with concentrations that were generally greater in the surficial sediments. Areas with the greatest frequency of contamination were the western-side of the bay (west of WLSSD outfall), the Miller and Coffee Creek Delta area, and the former channel.
MPCA recommended remedial practices for the 21st Ave W Area (MPCA 2013) include the following:
• The default bioactive zone should be considered during remediation and restoration processes.
• Consult with an experienced risk manager when disturbing sediment. • If possible, avoid disturbing sediment during restoration. • More assessment and evaluation is recommended if disturbing sediment. • Additional data collection may be required in areas where historical and/or recent data
have indicated elevated contaminant concentrations.
USFWS Evaluations of Sediment Chemistry, Toxicity, and Bioaccumulation
The U.S. Fish and Wildlife Service initiated limited sampling and testing of sediments and fish in the 21st Ave West Complex in 2011-12 to complement the 2010 sediment sampling noted above. The primary objective of this investigation was to evaluate the toxicity and bioaccumulation of contaminants in surficial sediments obtained from the project area. Results of these sediment tests provide additional information to help evaluate trends in contaminant bioavailability at the 21st Ave West Complex Remediation-to-Restoration Project site and have helped to determine actions necessary to meet ecological goals while minimizing potential for contaminated sediments to limit the development of high quality aquatic habitat. USFWS 2012 Methods
Sample collection
Bulk sediment was collected from fifteen locations in the 21st Avenue West Complex on May 7 and 8, 2012 and transferred to U.S. Geological Survey, Columbia Environmental Research Center in Columbia, MO (USGS-CERC) for toxicity and bioaccumulation testing. White suckers (Catostomus commersonii; N = 15) were collected from the project area by seining in the spring of 2011 to provide an additional indication of contaminant exposure.
Toxicity and bioaccumulation tests
Relationships between sediment chemistry, toxicity and bioaccumulation were evaluated using the amphipod Hyalella azteca (28-day whole-sediment exposures measuring effects on survival, growth, and biomass) and the midge Chironomus dilutus (10-day whole sediment exposures
11
measuring effects on survival, growth, and biomass) and bioaccumulation of contaminants of concern by the oligochaete Lumbriculus variegatus (28-day whole-sediment exposures). Contaminants of potential concern in the sediments include both metals and organic contaminants (including PAHs, PCBs, and chlorinated pesticides).
Sediment, oligochaete, and fish chemistry
Physical (total organic carbon) and chemical characterization of the test sediment, oligochaetes (composited), and fish (whole-body) were performed by the Geochemical and Environmental Research Group in College Station, Texas (for organic contaminants: organochlorines, aliphatics, and aromatics) and Alpha Woods Hole Laboratory in Mansfield, Massachusettes (for metals). Because of limited sample mass, worm analyses were confined to inorganic contaminants. A rigorous QA/QC protocol was followed.
Results
Sediment chemistry and guideline exceedances
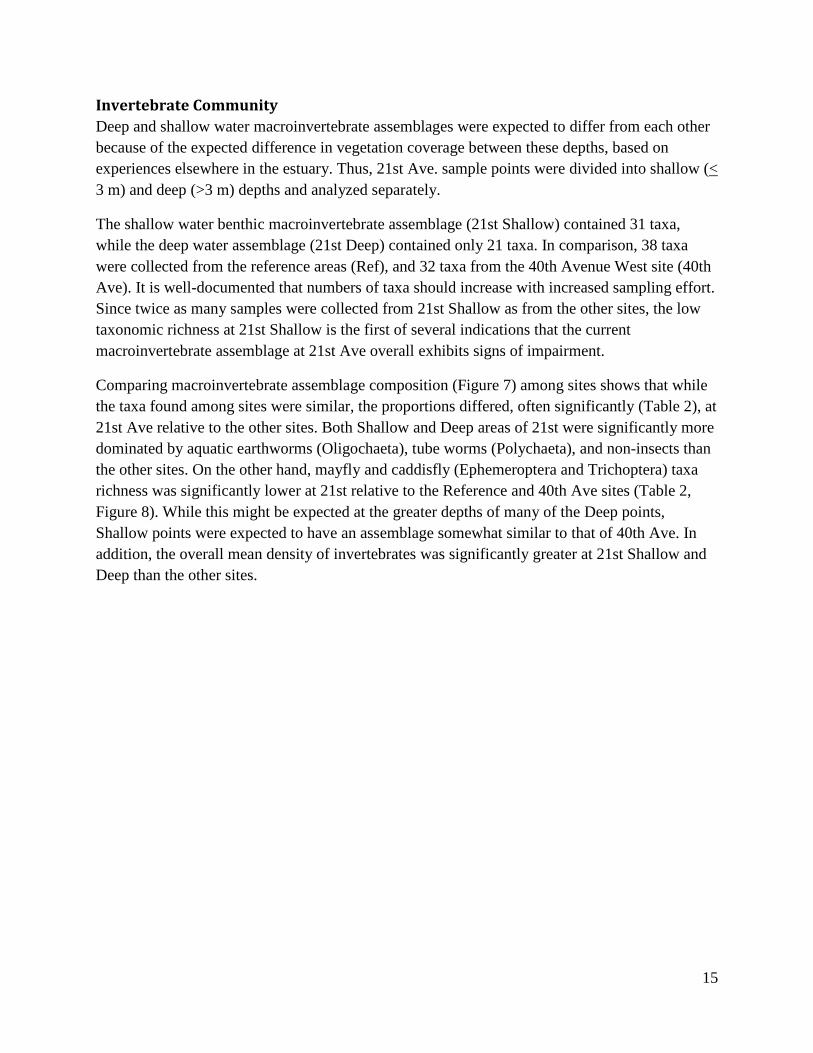
Contaminant concentrations were compared to sediment quality guidelines to assess risk to the aquatic community. Individual contaminant concentrations in sediment samples frequently exceeded the Level I SQT, and occasionally exceeded the Level II SQT. Sediment from 9 of the 15 locations included contaminant mixtures exceeding the Level 1 Mean PEC-Q. The site near WLSSD had the greatest sediment mean PEC-Q, and was between the Level I and Level II PEC-Qs. Contaminants of concern included: PAHs, PCBs, and mercury. PAHs were detected at high levels with 2-methylnaphthalene, and naphthalene exceeding Level II SQT near WLSSD and near the state-line across from Half Moon Bay. Mercury in sediment was also found at greatest concentrations near WLSSD (Figure 5). Total PCB concentrations were greatest in the area near WLSSD (Figure 5, subareas B and C). In general, chlorinated pesticide concentrations were low. Toxaphene was not detected in any sediment samples, although the detection limits were greater than the Level I SQT.
Sediment toxicity
One sediment sample (near the state-line and east of Interstate Island) demonstrated toxicity to both amphipod (lower survival) and midge (reduced growth) test organisms relative to the control sediment. Sediment from the site, near the state-line and south of Half Moon Bay, was toxic to the midge test organism (reduced growth) relative to the control sediment. Although sediment samples from the area near the state-line and east of Interstate Island were classified as the most toxic, this area had low contaminant concentrations, and similar water quality characteristics when compared to other sites, which suggests that perhaps some other contaminant that was not tested for is causing these adverse effects to these invertebrates.

12
Bioaccumulation Sufficient tissue mass for chemical analyses of oligochaetes was obtained from all of the 15 treatments at the end of the exposures except for the location near WLSSD, from which very few oligochaetes survived, suggesting anecdotal evidence of toxicity. The worms did not accumulate significant concentrations of inorganic contaminants; organics contaminants were not tested for due to low tissue mass. Other Bioindicators Contaminant concentrations in white suckers (whole-body) generally reflected those contaminants of concern found in sediment. 1987 guidelines were created for contaminants (mercury, total DDT, PCBs) in fish for the Great Lakes Water Quality Agreement (GLWQA). PAHs are rapidly metabolized in vertebrates, and therefore, if they are measured in fish tissue, it is indicative of recent exposure to elevated levels of PAHs. Several PAHs were detected in white sucker samples. PAHs that were found at the greatest concentrations in sediment were also detected at the greatest concentrations in fish. All fish samples exceeded a Canadian mercury guideline for the protection of wildlife consumers of aquatic biota (CCME 2001), but were all below the GLWQA guideline. PCBs were detected at average concentrations of 193.2 ppb-wet, and ranged from 57.9 to 323.3 ppb-wet and 93% of the fish samples exceeded the GLWQA for PCBs (100 ppb-wet). Total DDT concentrations in white suckers (mean = 13 ppb-wet; range = 4.3 to 23.1 ppb-wet) sometimes exceeded the guideline for the protection of wildlife consumers of aquatic biota of 14 ppb-wet (CCME 2001), but all samples were below the GLWQA (1000 ppb-wet). Most chlorinated pesticides were detected at low levels or not detected at all in fish samples in this study.
Summary of ecotoxicological analyses
Recent (FWS 2012) data are generally consistent with previous results (as presented in MPCA 2013). Most individual contaminant concentrations were below the Level II SQT for both data evaluations. However, nearly all sample locations (some locations included multiple depths) exceeded the Level I SQT, and a majority of the sample sites also exceeded the Level II SQT, for at least one contaminant. Datasets (Phase IV and 2012) indicate toxic effects to benthic invertebrates throughout the 21st Ave West Project Area. The area near the WLSSD outfall generally had the greatest contaminant concentrations (when considering all recent and historical data). For example, mercury and PCBs in sediment was found at greatest concentrations near WLSSD (Figure 5, B; Figure 6). Data also suggest that PAHs were elevated in this area (see Figure 5, A and B subareas). In general, chlorinated pesticide concentrations were low. Toxaphene was not detected in any recent (2008-2012) sediment samples, although the detection limits were greater than the Level I SQT. Historical data indicate that the area was

13
contaminated by toxaphene, thus, it may be important to consider this chemical during future sampling efforts. According to the recent sediment chemistry data (2010) described in the MPCA Remedial Review and Determination Memorandum, Remedial Assessment Area 57, dioxin/furans were also detected at elevated levels on both sides of the WLSSD outfall (Figure 5, B), with a majority of these concentrations in between the Level I and II SQTs, and with one sample from a deeper interval exceeding the Level II SQT. Dioxin/furans were not tested in the most recent (2012) study. Historical data indicate more contaminated sediment near the surface, but recent data (2008, 2010) suggest that greater contaminant levels are in the deeper sediments. These data may indicate that contaminated sediment has been buried over time. Disturbance of these contaminated sediments could increase bioavailability of contaminants, and thus increase the toxic effects to fish and wildlife.
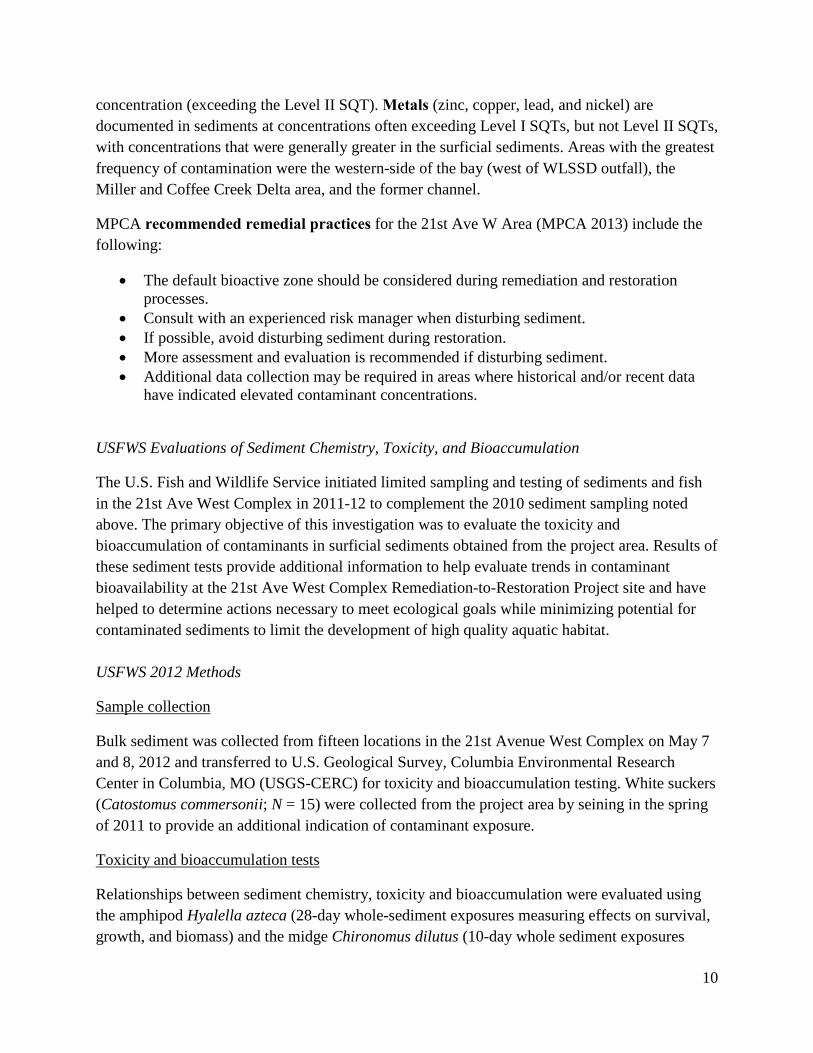
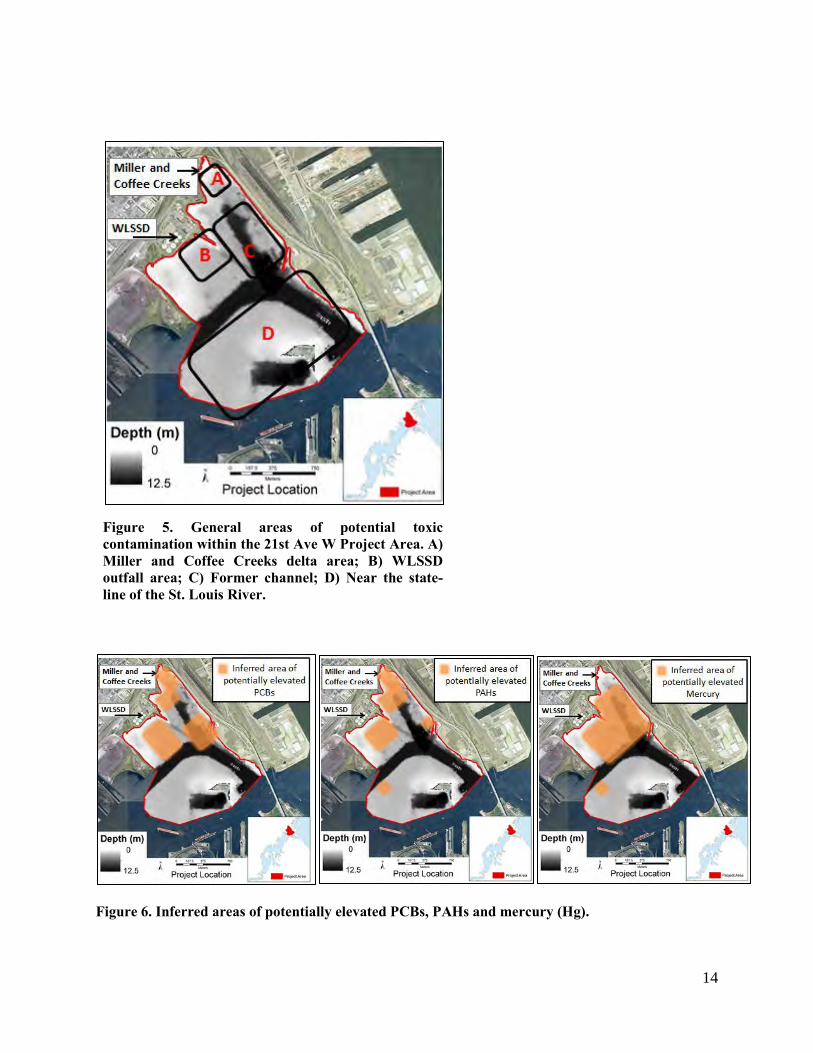
In summary, available data indicate that the most contaminated areas (mercury, PAHs, and PCBs) are near WLSSD (Figure 5 B and C), the delta area of Miller and Coffee creeks (Figure 5, A), and near the state line in the river (Figure 5, D). Data are also more limited towards the state line section of the project area (Figure 5, D), and toxicity data indicate adverse effects on invertebrates. Intensive sampling in these areas would better inform the necessary remedial evaluations. Additional monitoring post-restoration will also help inform remedial decisions and is recommended because restoration activities are likely to disturb sediment and have the potential to increase contaminant bioavailability (especially if restoration will alter the geochemical conditions of the area).
14
Figure 5. General areas of potential toxic contamination within the 21st Ave W Project Area. A) Miller and Coffee Creeks delta area; B) WLSSD outfall area; C) Former channel; D) Near the state-line of the St. Louis River.
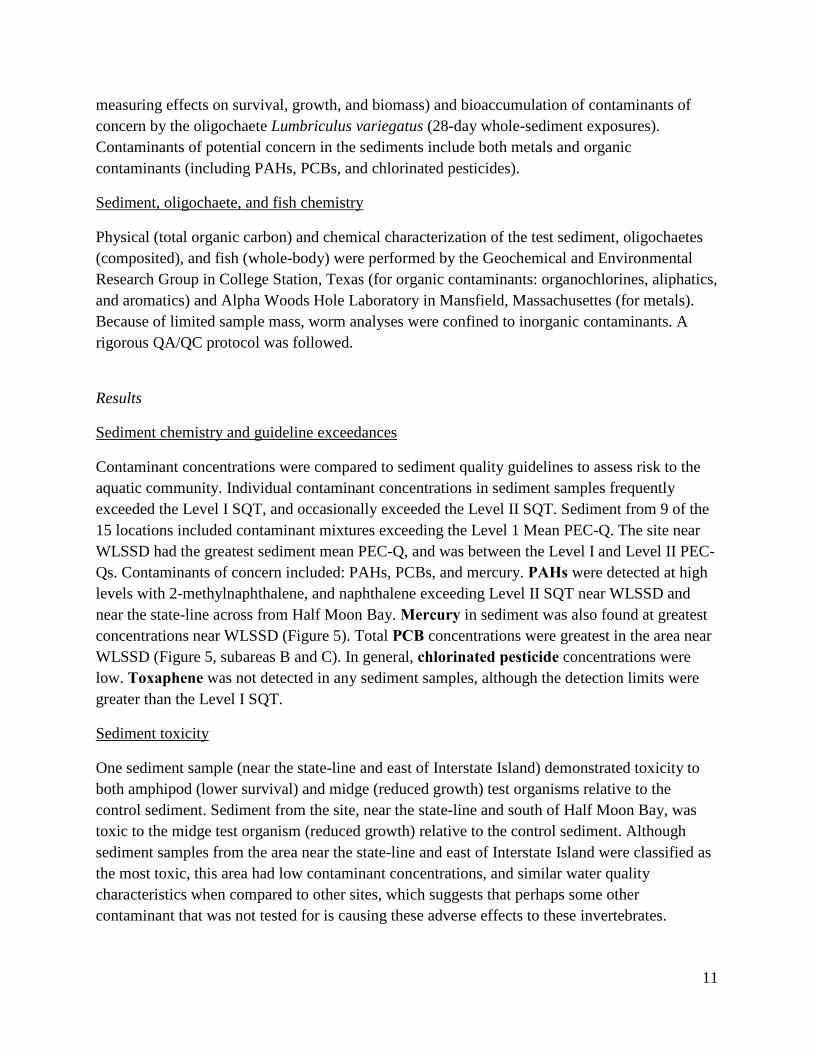
Figure 6. Inferred areas of potentially elevated PCBs, PAHs and mercury (Hg).
15
Invertebrate Community Deep and shallow water macroinvertebrate assemblages were expected to differ from each other because of the expected difference in vegetation coverage between these depths, based on experiences elsewhere in the estuary. Thus, 21st Ave. sample points were divided into shallow (< 3 m) and deep (>3 m) depths and analyzed separately.
The shallow water benthic macroinvertebrate assemblage (21st Shallow) contained 31 taxa, while the deep water assemblage (21st Deep) contained only 21 taxa. In comparison, 38 taxa were collected from the reference areas (Ref), and 32 taxa from the 40th Avenue West site (40th Ave). It is well-documented that numbers of taxa should increase with increased sampling effort. Since twice as many samples were collected from 21st Shallow as from the other sites, the low taxonomic richness at 21st Shallow is the first of several indications that the current macroinvertebrate assemblage at 21st Ave overall exhibits signs of impairment.
Comparing macroinvertebrate assemblage composition (Figure 7) among sites shows that while the taxa found among sites were similar, the proportions differed, often significantly (Table 2), at 21st Ave relative to the other sites. Both Shallow and Deep areas of 21st were significantly more dominated by aquatic earthworms (Oligochaeta), tube worms (Polychaeta), and non-insects than the other sites. On the other hand, mayfly and caddisfly (Ephemeroptera and Trichoptera) taxa richness was significantly lower at 21st relative to the Reference and 40th Ave sites (Table 2, Figure 8). While this might be expected at the greater depths of many of the Deep points, Shallow points were expected to have an assemblage somewhat similar to that of 40th Ave. In addition, the overall mean density of invertebrates was significantly greater at 21st Shallow and Deep than the other sites.

16
Figure 7. Benthic macroinvertebrate assemblages from four sites in the St. Louis River estuary. Common names of invertebrates are used for ease of interpretation.
Sites also had invertebrates unique to them and found at none of the other three sites (Host et al. 2012). For the 21st Deep site, this was a single taxon of leech. At 21st Shallow, 6 unique taxa were collected. This compares to 15 unique taxa for the Reference sites and 9 for 40th Ave W. Again, since sampling densities were higher for 21st than 40th, the lesser number of unique taxa is an indication of probable impairment.
In conclusion, the 21st Avenue West macroinvertebrate assemblage is highly dominated by aquatic earthworms (Oligochaeta) and contains fewer aquatic insects, both in abundance and as representative taxa, than the Reference Area. Lower taxa richness, despite greater sampling effort at 21st Shallow, also indicates an assemblage that is impaired compared to other areas in the estuary, particularly the Reference Area. While part of the cause of this impairment may be due to lack of aquatic vegetation, it is not clear that physical habitat characteristics are the sole cause. The high density and dominance of aquatic earthworms (Oligochaeta), suggests the possibility of a fertilization effect. Recent toxicity and contaminant work suggest that toxic
0%
10%
20%
30%
40%
50%
60%
70%
80%
90%
100%
21st-Deep 21st-Shallow 40th Ave West ReferenceArea
Tubeworm
Aq. earthworms
Round worms
Leeches
Other inverts
Other clams
Zebra mussels
Snails
Amph/Isopods
Other Insects
Other Diptera
Midges
Caddisflies
Mayflies

17
contaminants may be reducing or eliminating intolerant and sensitive taxa, while nutrient enrichment may be fostering greater numbers of tolerant organisms (e.g., Oligochaeta).
Figure 8. Percent abundance of Ephemeroptera and Trichoptera (no Plecoptera were found) per sample collected at four St. Louis River Estuary sampling locations. Values represent mean numbers + 1 standard error. p value if from the overall ANOVA. Columns with different letters are significantly different.
One favorable observation from this sampling is that the large burrowing mayfly Hexagenia was found within the 21st Shallow area (and also found at Reference and 40th Ave. West). (Note also that the family was found within 21st Deep, but could not be identified to genus). However, large shallow areas at the 21st site are void of Hexagenia even though habitat conditions (e.g., depositional mudflats) would appear to provide suitable habitat. One hypothesis would be that these areas receive too much wind and wave action for these burrowing mayflies. This mayfly is also particularly sensitive to dissolved oxygen, and its presence indicates that dissolved oxygen is not a limiting factor in areas where it occurs. Scientists and managers are interested in Hexagenia because it may serve as a bioaccumulation link in the estuary food web; it is large-bodied, long-lived, and resides with the sediment, and thus is in potentially close proximity to legacy toxins throughout most of its lifecycle.
Avian Communities Avian communities showed characteristic habitat associations, with shorebird observations most abundant in shallow, low energy environments. Waterbird and waterfowl were most abundant in shallow nearshore and intermediate/high energy environments. Songbirds were confined to shoreline edges with shrubs and trees, while shorebirds and waterbirds were also associated with isolated, shoreline habitats (Table 3). Deep and disphotic habitat (> 1.6 m) had relatively few bird observations. Note that any islands or sand or cobble shorelines created will provide loafing

18
areas or potential breeding sites for the large Ring-billed Gull population in the area. This species, as well as Herring Gulls, American Crows, and several exotic species such as European Starlings, House Sparrows, and Rock Pigeons are already creating management problems for WLSSD because of their foraging at the site. Any restoration scenarios should discourage additional attractions to the area for these species. Similar concerns are relevant to Canada Geese; however, they are not necessarily foraging at the WLSSD site, but are prominently using the area as a protected site for resting and nesting. The high population levels of gulls and Canada geese may also be restricting the revegetation process at the site. For detailed summaries of avian use, see Host et al 2012.
III. Modeling Approach
Aquatic Vegetation Model As a part of the ecological design for the 40th Avenue West R-to- R, NRRI developed a model to predict the probability of aquatic communities under particular combinations of depth, wave energy, and substrate (Host et al. 2012). The model was based on an assessment of vegetation, sediment types, benthic macroinvertebrates, and bird usage at the 21st and 40th Avenue West habitat complex areas, along with reference locations at other sites (Brady et al. 2010). These data were integrated with existing aquatic vegetation data, bathymetry, wind fetch, and other environmental variables. Classification and regression tree (CART) and logistic regression approaches were used to develop predictive models for dominant aquatic vegetation communities based on environmental factors. These relationships were then incorporated into a GIS modeling framework to map the predicted distribution of aquatic vegetation across these restoration sites. A full description of the technical details of the model can be found in Appendices A-C.
The primary outputs of the aquatic vegetation model are probability maps of the distribution of three aquatic plant communities: Emergent marsh (EM), Floating-leaf aquatic bed (FL), and Submerged aquatic bed (SAV). The probability maps were converted to aquatic plant community patches by identifying the p-values that best fit the sample data (Figure 9). Because there was no significant model for SAV, we subtracted the EM and FL communities from the vegetation presence model; the remaining grid cells were classified as SAV.

19
Figure 9. Model predictions of aquatic vegetation beds under current conditions.
At the 21st Avenue site there is a significant disparity between model predicted vegetation and field observations. The model predicts over half of the site supporting aquatic vegetation, with approximately 140 and 170 ac of floating leaf and submerged aquatic beds, respectively (Table 4). Emergent beds were predicted to comprise 22 ac or 3.5% of the project area. In the 2011 vegetation survey, the aquatic vegetation present in the project area was sparse and variable (Host et al 2012). In late summer, approximately 40% of sites in shallow water that seem favorable to aquatic plant growth had no vegetation present. The most abundant plant (based on highest relative frequency) was water celery (Vallisneria americana), which was present at 30% of the sample points. These beds were often quite sparse, however. Filamentous algae were present at 16% of sample points, but other aquatic plants present were found in fewer than 6% of
20
the shallow water sample points. There are no significant beds of emergent or floating leaf vegetation observed in 2011.
The aquatic vegetation model was based on 850+ data points collected across the entire estuary. There are numerous potential reasons for the disparity between the model predictions and lack of vegetation found in the summer 2011 field sampling. Among these are issues related to the sediment composition, either in terms of presence of contaminants that might limit vegetation growth, or simply the influx of large amounts of sediment from Miller and Coffee creeks during rain events. Another might be bird herbivory on aquatic plants – the outfall from WLSSD is warm and maintains open water over the winter, resulting in large and persistent bird populations remaining at the site over the winter and present when spring growth begins. An informal EPA exclosure study showed that some vegetation became established in bird exclosures set up in the Miller Creek Bay in summer 2012 (T. Hollenhorst, pers comm). Plans are underway for more directed experiments on the sediments and other factors that may limit the growth of aquatic vegetation at 21st Ave West.
Hydrodynamic Modeling To investigate the effect of bathymetry and coastline changes on flow within the project area and in particular the dispersal of effluent from WLSSD, a hydrodynamic model was developed. The model was based on the open source, finite-volume coastal ocean model (FVCOM), which was jointly developed by the University of Massachusetts-Dartmouth and Woods Hole Oceanographic Institution (Chen et al., 2007). The model solves the equations of momentum, heat transfer and continuity as they pertain to fluid flow on an unstructured grid.
Due to the large number of simulations required, computing resources available at the Minnesota Supercomputing Institute were used. Each simulation was carried out using up to 32 processors working in parallel.
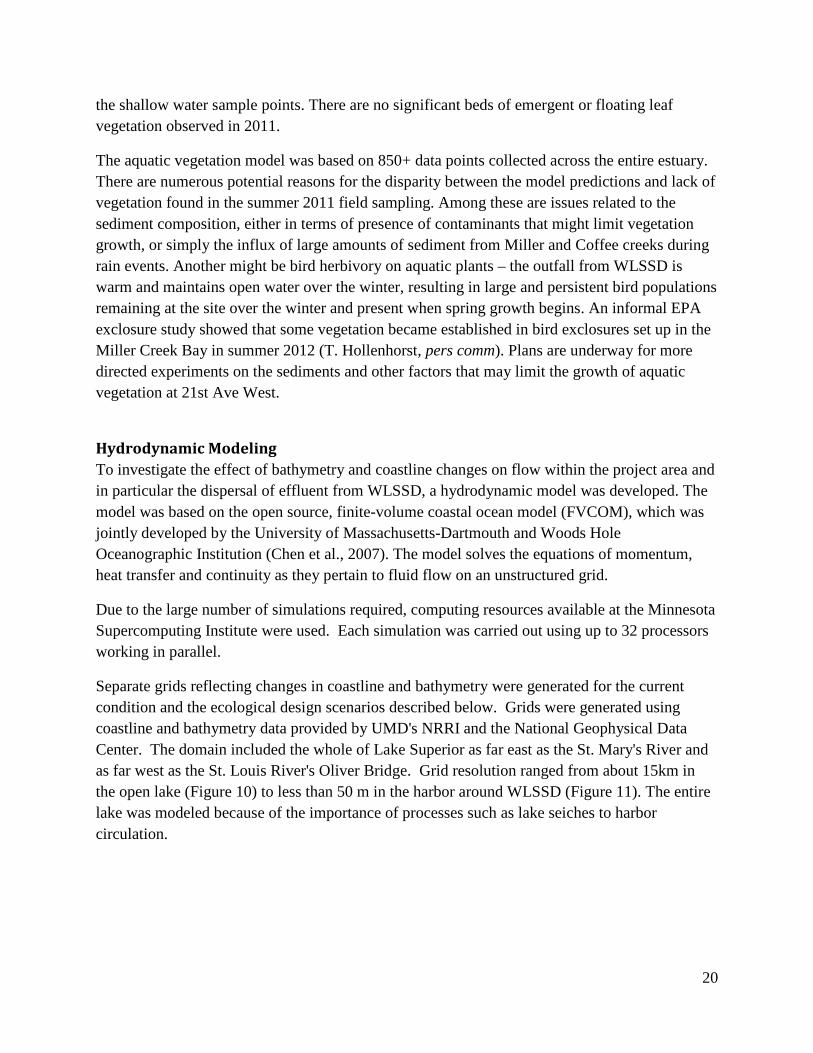
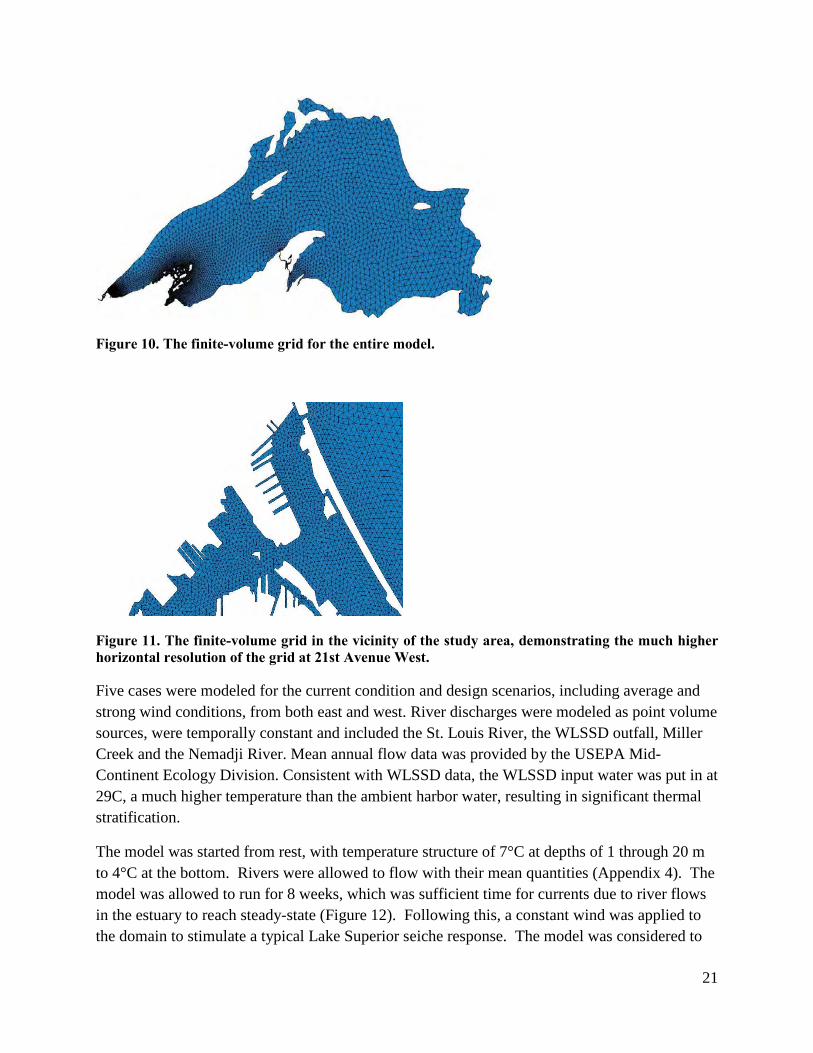
Separate grids reflecting changes in coastline and bathymetry were generated for the current condition and the ecological design scenarios described below. Grids were generated using coastline and bathymetry data provided by UMD's NRRI and the National Geophysical Data Center. The domain included the whole of Lake Superior as far east as the St. Mary's River and as far west as the St. Louis River's Oliver Bridge. Grid resolution ranged from about 15km in the open lake (Figure 10) to less than 50 m in the harbor around WLSSD (Figure 11). The entire lake was modeled because of the importance of processes such as lake seiches to harbor circulation.
21
Figure 10. The finite-volume grid for the entire model.
Figure 11. The finite-volume grid in the vicinity of the study area, demonstrating the much higher horizontal resolution of the grid at 21st Avenue West.
Five cases were modeled for the current condition and design scenarios, including average and strong wind conditions, from both east and west. River discharges were modeled as point volume sources, were temporally constant and included the St. Louis River, the WLSSD outfall, Miller Creek and the Nemadji River. Mean annual flow data was provided by the USEPA Mid-Continent Ecology Division. Consistent with WLSSD data, the WLSSD input water was put in at 29C, a much higher temperature than the ambient harbor water, resulting in significant thermal stratification.
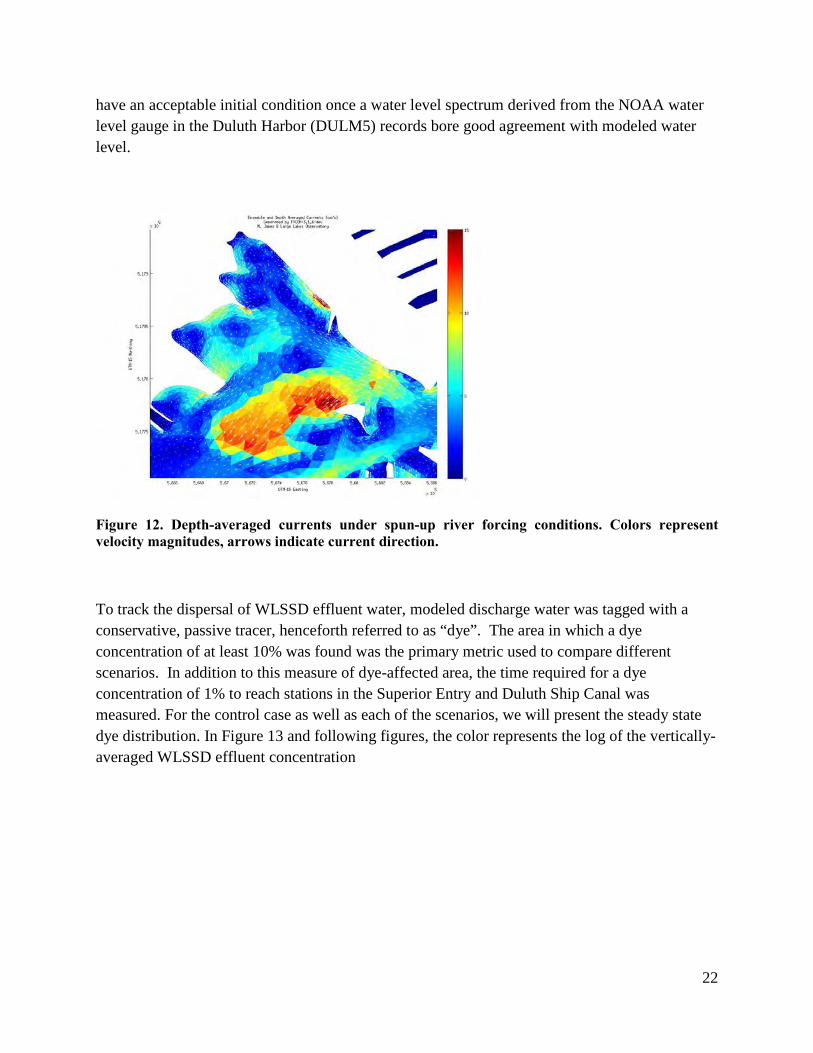
The model was started from rest, with temperature structure of 7°C at depths of 1 through 20 m to 4°C at the bottom. Rivers were allowed to flow with their mean quantities (Appendix 4). The model was allowed to run for 8 weeks, which was sufficient time for currents due to river flows in the estuary to reach steady-state (Figure 12). Following this, a constant wind was applied to the domain to stimulate a typical Lake Superior seiche response. The model was considered to
22
have an acceptable initial condition once a water level spectrum derived from the NOAA water level gauge in the Duluth Harbor (DULM5) records bore good agreement with modeled water level.
Figure 12. Depth-averaged currents under spun-up river forcing conditions. Colors represent velocity magnitudes, arrows indicate current direction.
To track the dispersal of WLSSD effluent water, modeled discharge water was tagged with a conservative, passive tracer, henceforth referred to as “dye”. The area in which a dye concentration of at least 10% was found was the primary metric used to compare different scenarios. In addition to this measure of dye-affected area, the time required for a dye concentration of 1% to reach stations in the Superior Entry and Duluth Ship Canal was measured. For the control case as well as each of the scenarios, we will present the steady state dye distribution. In Figure 13 and following figures, the color represents the log of the vertically-averaged WLSSD effluent concentration

23
Figure 13. Steady-state dye distribution in the harbor in the control case under three scenarios: (a) Steady river forcing, no wind; (b) steady river forcing, wind from the west; (c) steady river forcing, wind from the east.
Five cases were modeled for the current condition and design scenarios, including average and strong wind conditions, from both east and west directions. River discharges were modeled as a point volume source, were temporally constant and included the St. Louis River, the WLSSD outfall, Miller Creek and the Nemadji River. Mean annual flow data was provided by the USEPA Mid-Continent Ecology Division.
IV. Ecological Design Scenarios
We considered five ecological design scenarios, developed by the SLRA Habitat Committee in conjunction with the USACOE. These scenarios were designed to represent a range of potential restoration scenarios that follow remediation at the site. Scenarios include alterations to substrate or bathymetry to provide more suitable habitat for emergent, floating-leaf or submerged aquatic vegetation beds and fish and wildlife resources, creation of islands or breakwalls to disrupt wind fetch and dissipate wave energy, and expansion of existing shoreline to increase land-based habitat. The scenarios vary in intensity, extent, amounts of materials required, and, consequently time, energy and expense. The results presented here are intended to be a guide toward balancing the costs and benefits of restoration activities.
For each scenario (labeled A-E), new input maps of bathymetry, substrate, and weighted wind fetch (the product of 12 separate wind grids) were calculated. The models for the three aquatic plant communities were then applied to the new set of grids, resulting in new probability maps. As a final step, the three plant community maps were integrated into a final predictive map of discrete communities, and areas of each aquatic plant type were calculated and compared with current condition. Finally, for each scenario, inferences on the macroinvertebrate and avian responses to the restoration treatments were made based on the habitat class and vegetation maps, as well as Ecological Risk Management issues to be considered.

24
Scenario A Scenario A is a variation of a restoration activity proposed by the Army Corps of Engineers in 1999 and modified after discussions with the SLRA and other partners in September 2012. The restoration is focused primarily on the small bay formed by Miller and Coffee creeks, and treats 105 acres or 16% of the 636 acre site.
The intent of this design was to restore 75 acres of habitat by placing dredged materials that would encapsulate sediments at the site (Long 2012). There are two prominent features to the design. One is a 2400 ft underwater wave barrier that sweeps in an arc from the north across the bay to the peninsula that includes the WLSSD site (Figure 14). The barrier consists of riprap stone, with a 10’ buffer of fill materials covering the soft sediments adjacent to the barrier. The design also includes an island, four pools, an access channel, and additional fill to create 75 acres of wetland. Note that, while locally intensive, Scenario A only covers a small portion of the overall project area.

25
Figure 14. Bathymetric changes and island development for Scenario A.

26
Habitat and biotic response Since Scenario A modifies only a small portion of the overall project area, it does not result in significant changes in habitat areas. Shallow and intermediate high-energy areas were each increased by 4 acres, with similar reductions in low energy environments. (Figure 15; Table 5).
Figure 15. Habitat classes based on depth/energy environments for Scenario A.

27
Correspondingly, the response of vegetation, macroinvertebrates and birds is also relatively small with respect to the overall site. In terms of vegetation, the restoration increased the amount of submerged leaf aquatic bed by 29 ac, and reduced the acreages of floating leaf and emergent marsh by 24 and 14 acres, respectively (Table 6, Figure 16).
Figure 16. Predicted aquatic vegetation beds for Scenario A.
The invertebrate assemblage responses are predicted to be correspondingly small. Re-establishment of floating leaf vegetation in this small bay would increase aquatic invertebrate assemblage richness. However, if much of this bay receives high sediment loads from Miller and Coffee creeks, and has to be dredged routinely because of this, the vegetation and macroinvertebrates will be negatively affected and will not respond in the predicted manner. In
28
addition, if this scenario increases the retention time of WLSSD effluent within this small bay, this is likely to be detrimental to the macroinvertebrate assemblage.
The creation of additional aquatic beds would benefit many species of birds including waterbirds such as grebes, herons, bitterns, and potentially rails; waterfowl, especially puddle ducks, and would create a potential foraging areas for terns. The small island may also benefit shorebirds, waterbirds, and songbirds, depending on the size, vegetative structure, and competition for use by other birds already present (e.g. Ring-billed gull). The reduction of shallow-low energy environments in this scenario could discourage use by some shorebird and waterfowl species, particularly shorebirds that rely almost exclusively on the presence of these environments that offer open sandy or cobble shorelines.
Physical Changes and Ecological Risk Considerations Ecotoxicology
Scenario A would include burying an area that has potentially elevated PCBs and mercury. Available data does not indicate issues with increasing depth in the proposed areas.

29
Hydrodynamics In terms of hydrodynamics, Scenario A has relatively minor differences from the current condition, with somewhat greater circulation near the mouth of Miller Creek bay (Figure 17).
Figure 17. Modeled depth averaged currents for Scenario A. Color contours represent velocity magnitudes.

30
More of the WLSSD effluent appears to be retained in the bay under scenario A than in the control case (Figure 18).
Figure 18. Steady-state dye distribution in the harbor in scenario A under three scenarios: (a) Steady river forcing, no wind; (b) steady river forcing, wind from the west; (c) steady river forcing, wind from the east.
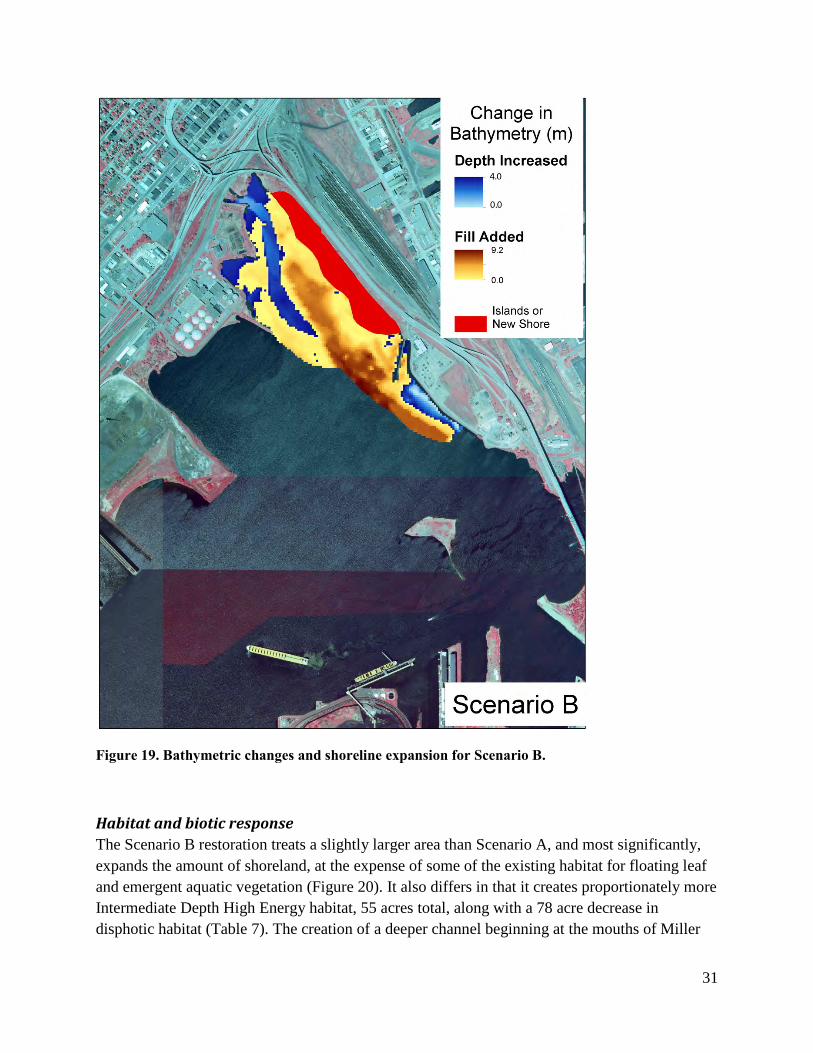
Scenario B Scenario B extends the restoration area to the southeast. The most prominent feature of Scenario B is the creation of new shoreland along a 0.6 mi stretch of land parallel to Hwy 53, from the mouth of Coffee Creek to the existing pier (Figure 19). The new land extends approximately 250 ft into the current bay. The design also adds additional deep channel habitat and two large areas of fill to promote aquatic vegetation. This restoration treats 131 ac or 25% of the 21st Ave project area.
31
Figure 19. Bathymetric changes and shoreline expansion for Scenario B.
Habitat and biotic response The Scenario B restoration treats a slightly larger area than Scenario A, and most significantly, expands the amount of shoreland, at the expense of some of the existing habitat for floating leaf and emergent aquatic vegetation (Figure 20). It also differs in that it creates proportionately more Intermediate Depth High Energy habitat, 55 acres total, along with a 78 acre decrease in disphotic habitat (Table 7). The creation of a deeper channel beginning at the mouths of Miller
32
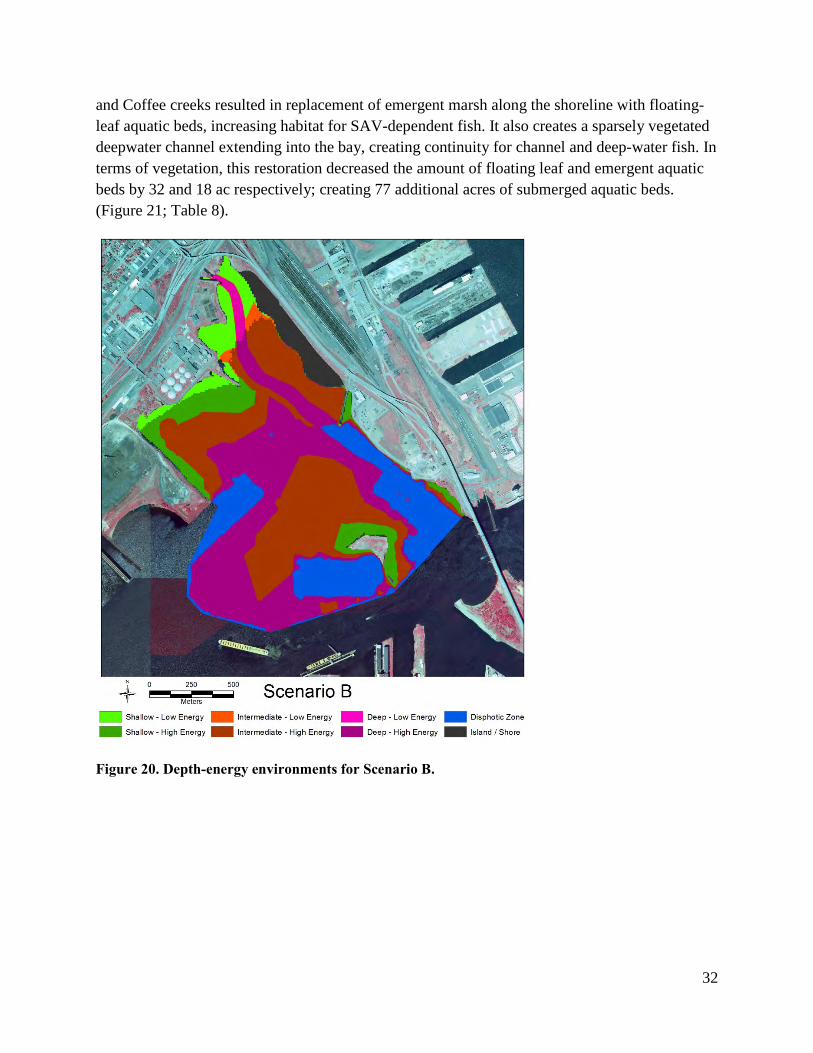
and Coffee creeks resulted in replacement of emergent marsh along the shoreline with floating-leaf aquatic beds, increasing habitat for SAV-dependent fish. It also creates a sparsely vegetated deepwater channel extending into the bay, creating continuity for channel and deep-water fish. In terms of vegetation, this restoration decreased the amount of floating leaf and emergent aquatic beds by 32 and 18 ac respectively; creating 77 additional acres of submerged aquatic beds. (Figure 21; Table 8).
Figure 20. Depth-energy environments for Scenario B.

33
Figure 21. Predicted aquatic vegetation beds for Scenario B.
Again, because this scenario treats only a small portion of the 21st Avenue West site, its ability to affect aquatic macroinvertebrates across the entire site is somewhat limited. In fact, this scenario reduces the amounts of emergent vegetation, which would likely have a negative effect on certain macroinvertebrate species. As in Scenario A, the potential for increased amounts of floating leaf vegetation would increase overall macroinvertebrate richness, provided other issues related to sediment inputs to this bay are resolved. The increase in intermediate depths experiencing high energy is predicted to negatively affect both macroinvertebrate richness and Hexagenia abundance.
Because Scenario B creates new shoreland, a positive response from migratory and breeding shorebirds is expected. However, a potentially negative for the creation of this shoreland habitat may be the attraction for resting gulls and Canada geese. The promotion of aquatic vegetation

34
expected to be created by filling two large areas within the site will also enhance the quality and extent of habitat used by several species of waterbirds and waterfowl. The latter especially for surface-feeding, puddle ducks like Mallard and Blue-winged Teal. These areas may also provide foraging habitat for terns and swallows as well as selected songbirds such as Common Yellowthroat, Red-winged Blackbird, and Swamp Sparrow.
Physical Changes and Ecological Risk Considerations Ecotoxicology
Because of a lack of contaminant data in the newly expanded project area (Figure 5, D), it is difficult to consider contaminant impacts within this area for Scenario B. Data suggest that the area to be dredged may be contaminated. Additional testing is recommended for these sediments before reusing sediment as fill in the 21st restoration area. Data suggest that elevated levels of mercury and PCBs will be covered in this design scenario.
In terms of hydrodynamics, Scenario B resulted in increased current activity between Interstate Island and the southern shore of Rice’s Point (Figure 22). The primary difference in WLSSD effluent distribution is the heightened effect of the fresh, St. Louis estuary water in the west wind scenario, where less of the study area is affected by the WLSSD effluent.
Figure 22. Steady-state dye distribution in the harbor in scenario B under three scenarios: (a) Steady river forcing, no wind; (b) steady river forcing, wind from the west; (c) steady river forcing, wind from the east.

35
Scenario C Scenario C treats a larger area than the previous two scenarios. It adds a significant amount of new shoreline adjacent to Hwy 53, and adds additional fill to the Miller and Coffee Creek Bays, with some dredging to create deeper habitat. It also treats a significant portion of the southwest side of the project area, adding a more complex bathymetry that increases the amount of submerged aquatic vegetation near shore, and grades into floating leaf aquatic beds further out in the bay (Figure 23).
Figure 23. Changes in bathymetry and shoreland additions for Scenario C.
Habitat and biotic response The predominant effect of the restoration, in addition to the expanded shoreline, is to reduce the amounts of deep and disphotic zone habitat (Figure 24; Table 9), converting most of this 70 ac to

36
intermediate depth environments (0.65-1.6m). This resulted in 50 and 13 ac reductions in floating leaf and emergent beds, respectively, and a 60 ac increase in submerged aquatic beds. (Figure 25; Table 10).
Figure 24. Depth-energy environments for Scenario C.
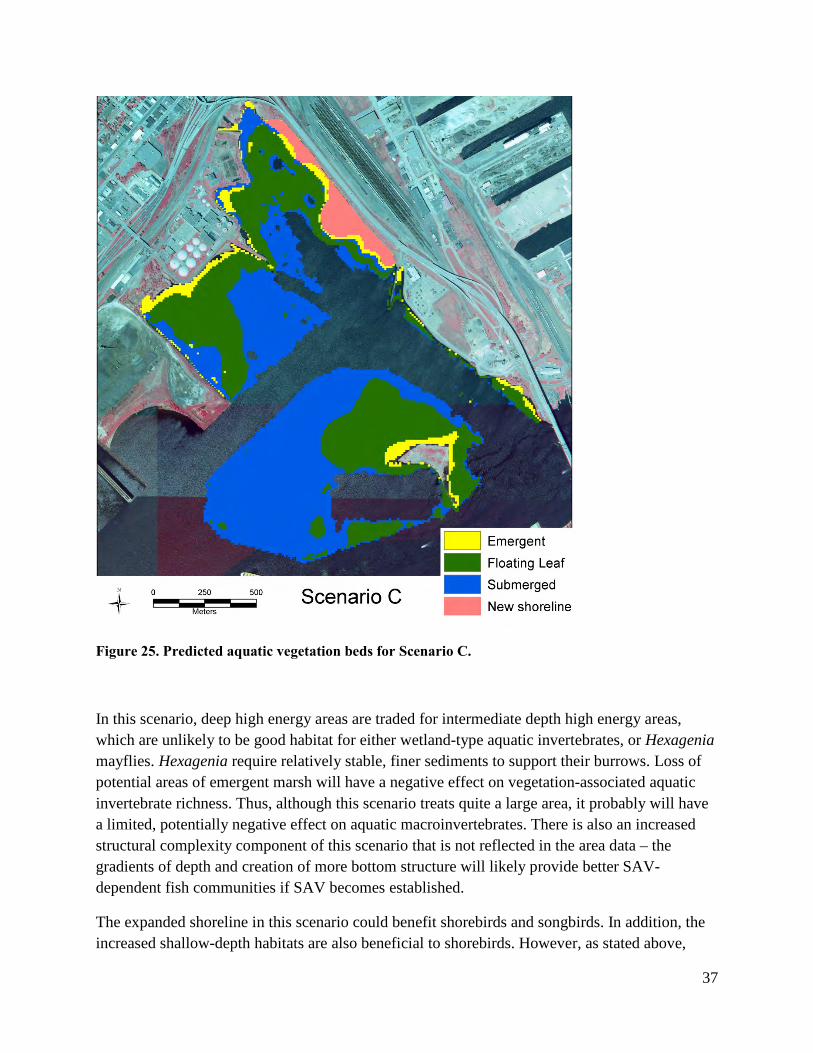
37
Figure 25. Predicted aquatic vegetation beds for Scenario C.
In this scenario, deep high energy areas are traded for intermediate depth high energy areas, which are unlikely to be good habitat for either wetland-type aquatic invertebrates, or Hexagenia mayflies. Hexagenia require relatively stable, finer sediments to support their burrows. Loss of potential areas of emergent marsh will have a negative effect on vegetation-associated aquatic invertebrate richness. Thus, although this scenario treats quite a large area, it probably will have a limited, potentially negative effect on aquatic macroinvertebrates. There is also an increased structural complexity component of this scenario that is not reflected in the area data – the gradients of depth and creation of more bottom structure will likely provide better SAV-dependent fish communities if SAV becomes established.
The expanded shoreline in this scenario could benefit shorebirds and songbirds. In addition, the increased shallow-depth habitats are also beneficial to shorebirds. However, as stated above,

38
concerns remain with the attraction of this shoreland habitat for resting gulls and Canada Geese. This scenario also increases the intermediate-depth habitats used by both waterbirds, such as herons and mergansers, and waterfowl, primarily puddle ducks. The increased vegetation expected to result from filling several areas within the study site should increase the quality and extent of habitat used by waterbirds and waterfowl, assuming these areas will become vegetated.
Physical Changes and Ecological Risk Considerations Ecotoxicology Scenario C proposes filling in an area with elevated PAHs and PCBs, and increasing water depth in areas containing elevated PCBs (testing these sediments for contaminants is recommended before reusing as fill in the 21st restoration area). In addition, it would be best to remove these sediments using a method that would only minimally disturb the sediment.
Hydrodynamic Model
In scenario C, while more effluent is retained, the differences from the control case are very minor (Figure 26).
Figure 26. Steady-state dye distribution in the harbor in scenario C under three scenarios: (a) Steady river forcing, no wind; (b) steady river forcing, wind from the west; (c) steady river forcing, wind from the east.
39
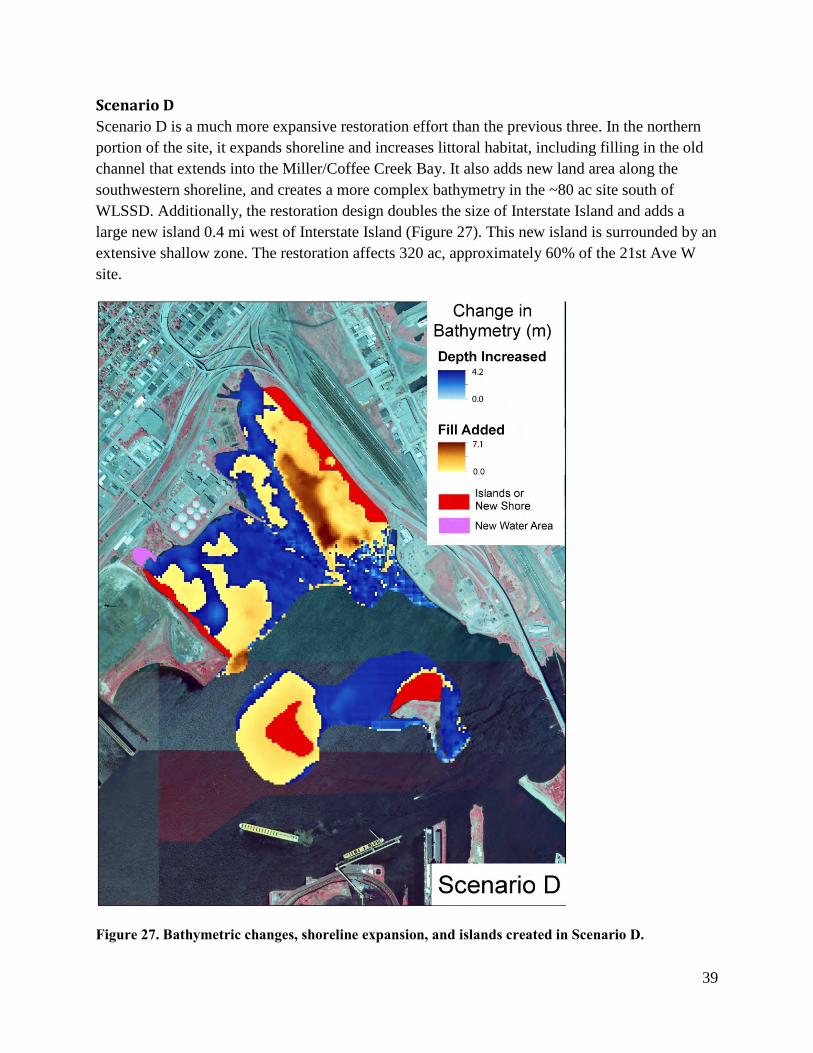
Scenario D Scenario D is a much more expansive restoration effort than the previous three. In the northern portion of the site, it expands shoreline and increases littoral habitat, including filling in the old channel that extends into the Miller/Coffee Creek Bay. It also adds new land area along the southwestern shoreline, and creates a more complex bathymetry in the ~80 ac site south of WLSSD. Additionally, the restoration design doubles the size of Interstate Island and adds a large new island 0.4 mi west of Interstate Island (Figure 27). This new island is surrounded by an extensive shallow zone. The restoration affects 320 ac, approximately 60% of the 21st Ave W site.
Figure 27. Bathymetric changes, shoreline expansion, and islands created in Scenario D.

40
Habitat and biotic response Scenario D creates 38 ac of shallow habitat and 31 ac of intermediate habitat. By filling in the abandoned channel in the Miller Creek bay, it reduces the amount of disphotic and deep habitat by 98 ac. (Figure 28; Table 11). Much of this new habitat is created in the previously deep areas adjacent to the ship canal in the southernmost portion of the project area. This is accomplished through the expansion of Interstate Island and the creation of a new island with gradually sloping shoreline to the west.
Figure 28. Depth-energy environments produced in Scenario D.
41
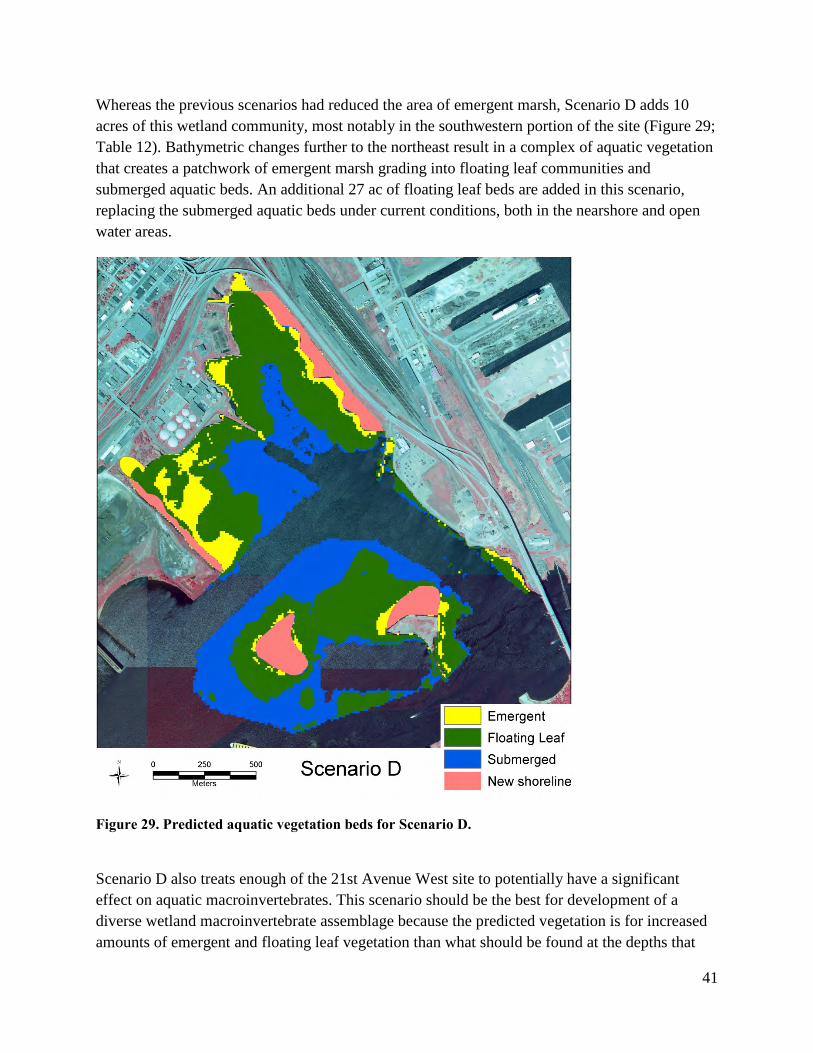
Whereas the previous scenarios had reduced the area of emergent marsh, Scenario D adds 10 acres of this wetland community, most notably in the southwestern portion of the site (Figure 29; Table 12). Bathymetric changes further to the northeast result in a complex of aquatic vegetation that creates a patchwork of emergent marsh grading into floating leaf communities and submerged aquatic beds. An additional 27 ac of floating leaf beds are added in this scenario, replacing the submerged aquatic beds under current conditions, both in the nearshore and open water areas.
Figure 29. Predicted aquatic vegetation beds for Scenario D.
Scenario D also treats enough of the 21st Avenue West site to potentially have a significant effect on aquatic macroinvertebrates. This scenario should be the best for development of a diverse wetland macroinvertebrate assemblage because the predicted vegetation is for increased amounts of emergent and floating leaf vegetation than what should be found at the depths that

42
occur under present conditions. However, these vegetation beds (if they develop) are likely to have relatively sparse stem densities because many of these shallow areas are predicted to have high wind and wave energy exposure. Elsewhere in the estuary, floating leaf vegetation only occurs in quite protected locations. Emergent vegetation can be somewhat hardier, but still typically needs some protection to develop dense diverse stands. Thus, the macroinvertebrate response may not be as strong as could potentially occur if these shallow regions could be provided with more wind and wave protection. If this scenario has any effect on Hexagenia mayflies, it is likely to be negative because deep water (disphotic) area is reduced, while the increased shallower areas are predicted to be high energy. In summary, while reducing disphotic and deep areas should increase macroinvertebrate richness, the increase is in locations subjected to high energy areas. High energy areas are unlikely to develop the diverse aquatic macrophyte assemblage that would in turn support the development of diverse wetland invertebrate assemblages.
The proposed addition of new land, increase of littoral habitat, and expansion of shoreline included in Scenario D would greatly benefit shorebirds, waterbirds, waterfowl, and songbirds. The proposed alterations would increase both low and high energy, shallow environments and intermediate-high energy environments as well as land. Increasing the size of Interstate Island in addition to creating of a new island makes this scenario particularly appealing because it would increase the potential nesting area for common terns and shorebirds already nesting on Interstate Island. Again, this is interpreted with the caveat that unless populations of Ring-billed Gull and Canada Goose are managed, they could limit the success of other species.
Physical Changes and Ecological Risk Considerations Ecotoxicology
It is uncertain what contaminant issues may exist with the new creation of these two islands, but the data suggests that sediment in this area is toxic to benthic organisms. Contaminant data is limited in the newly expanded project area (more southern portion of project area) and additional testing would help inform remedial management. Sediments dredged in the western portion are likely contaminated and may require confined disposal. Additional testing would be required if an objective was to reuse these sediments as fill in the 21st restoration area. Filling areas particularly near the WLSSD outfall would cover contaminated sediment, which could potentially increase the bioavailability of methylmercury. Dredged material removed from near the mouths of Miller and Coffee creek (hotspots for PAH and PCBs) may require disposal; more testing would need to be conducted if plans include to use these sediments as fill in the 21st restoration area.

43
Scenario E Scenario E is the most extensive of the five scenarios. It adds a significant amount of new land, in terms of expanded shorelines, a large breakwall of land extending into Miller Bay from WLSSD, and creation of several new islands (Figure 30). It adds a large amount of fill in Miller Bay, including filling in the abandoned deep channel. In the open water areas in the southern portion of the project area, the plan fills in another deep channel. It also creates a complex of islands and shallow water habitat west of Interstate Island, which is also expanded. The restoration also calls for removing land to create a small bay at the extreme western edge of the project area. The restoration treats a total of 382 ac, or 72% of the site.

44
Figure 30. Bathymetric change, shoreline and breakwall development and islands created in Scenario E.
Habitat and Biotic Response Effects on the depth-energy environments are similar to those of Scenario D but more extreme, creating 51 acres of shallow habitat and 49 acres of intermediate depth habitat (Figure 31; Table 13). Deep habitat is reduced by 71 acres and disphotic habitat is reduced by 56 ac. In addition 22 acres of new land are added to the project area, both as expanded shoreline and islands or island expansion.
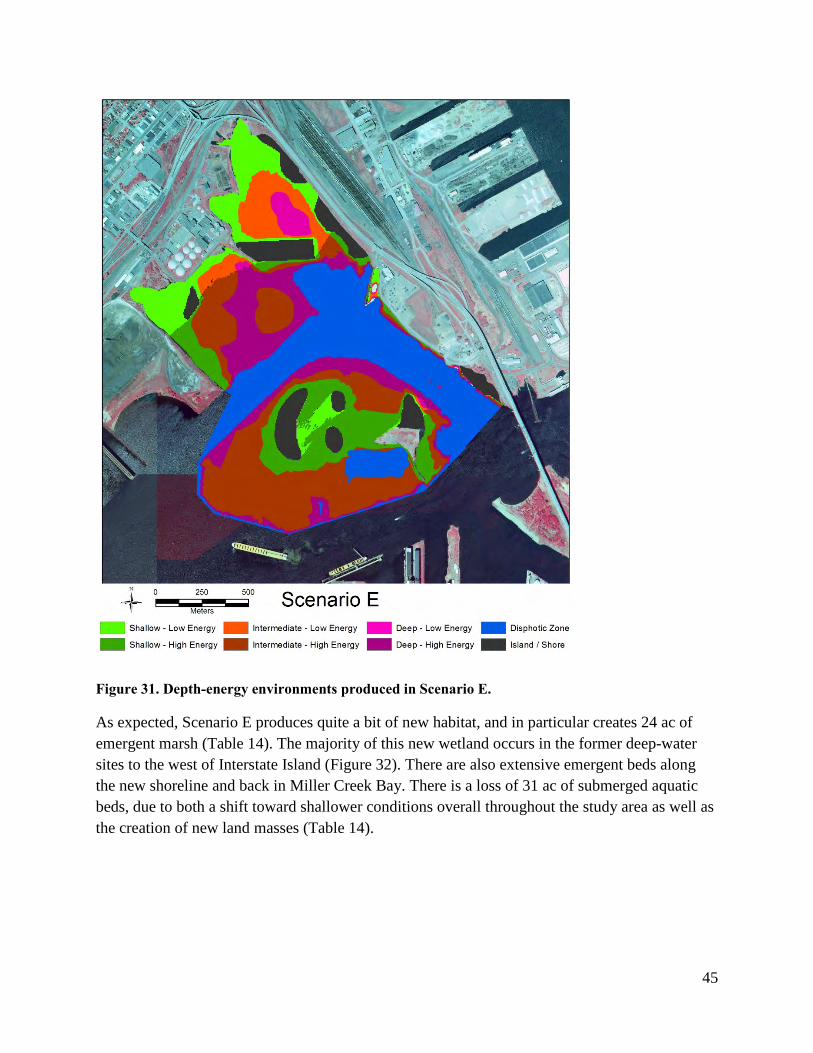
45
Figure 31. Depth-energy environments produced in Scenario E.
As expected, Scenario E produces quite a bit of new habitat, and in particular creates 24 ac of emergent marsh (Table 14). The majority of this new wetland occurs in the former deep-water sites to the west of Interstate Island (Figure 32). There are also extensive emergent beds along the new shoreline and back in Miller Creek Bay. There is a loss of 31 ac of submerged aquatic beds, due to both a shift toward shallower conditions overall throughout the study area as well as the creation of new land masses (Table 14).

46
Figure 32. Predicted aquatic vegetation beds for Scenario E
Scenario E should be the second-best scenario for a wetland-type macroinvertebrate assemblage with high taxonomic richness because it should greatly increase habitat diversity by trading areas with submergent vegetation for areas with emergent and floating leaf vegetation. However, as observed for Scenario D, it is uncertain whether the large emergent vegetation beds will actually

47
develop to any significant amount because so much of this shallow area is predicted to be high energy rather than protected, as is also the case with Scenario D. If this scenario has any effect on Hexagenia mayflies, it is likely to be negative because the disphotic area is reduced, while the intermediate depth areas that increase are predicted to be high energy. While reducing disphotic and deep area should increase macroinvertebrate richness, as in Scenario D, the increase is in high energy areas (with the exception of 5 ac of shallow low energy area). These shallow high energy areas probably will not develop diverse emergent macrophyte beds, which are needed to produce diverse wetland invertebrate assemblages.
Scenario E is the most extensive and structurally diverse. The addition of new shoreline, the large extension of land, and the expansion of Interstate Island, benefit bird communities in the same manner as scenario D. However, the degree of expansion of both low and high-energy shallow environments is greatest in this scenario as is the increase in land area. . The same cautions mentioned for Scenario D apply to this scenario.
Physical Changes and Ecological Risk Considerations Ecotoxicology Sediment dredged in the western portion of the project area is likely contaminated and may require confined disposal. Additional contaminant testing would need to be conducted if these sediments are to be used as fill in the 21st Avenue area. When increasing the depths in areas near the creek delta (a hotspot for PAH and PCBs), it would be best to use a method that would prevent significant amounts of sediment mixing in the water column. In addition, the dredged sediments from this area and from the area near the newly created islands may require disposal and more contaminant testing would be needed if these sediments were to be used as fill in the 21st restoration area. Contaminant data are limited in the newly expanded project area (more southern portion of project area) and additional testing would help inform remedial management. It is uncertain what contaminant issues may exist with the new creation of these two islands, but our data suggest that sediment in this area is toxic to benthic organisms.
Hydrodynamic Model
In scenario E, the most extensive of the scenarios, the northern breakwater clearly reduces the WLSSD effluent load north of it near the mouth of Miller Creek (Figure 33). There is more retention of WLSSD effluent in the vicinity of the island complex west of Interstate Island in the no-wind case, but less of a difference in both the east and west wind scenarios.

48
Figure 33. Steady-state dye distribution in the harbor in scenario E under three scenarios: (a) Steady river forcing, no wind; (b) steady river forcing, wind from the west; (c) steady river forcing, wind from the east.
V. Ecological Concept Plan
AOC Coordinators Recommendations On March 15, 2013, the ecological design scenarios A-E were presented to the AOC Coordinators from MPCA, MNDNR and Fond du Lac. Given the overall goals were to increase habitat diversity and complexity, expand the littoral zone, and reduce wave energy, a number of modifications to Scenario E were made (Figure 34). The depth of the Miller/Coffee Creek bay was increased and the abandoned slip extending into the bay was partially filled, producing a thalweg for the main flows from these streams. The modified scenario, hereafter referred to as the Ecological Concept Plan, also extended two fingers of land that result in a narrow outlet from the bay, making this a much more protected habitat compared with the current condition. WLSSD Bay also received extensive fill, with the intent of increasing the acreage in emergent marsh. In addition, the new design uses shoals – underwater features approximately 12” below the surface – rather than islands to break wind fetch into the bay. Under lower water conditions, these shoals might replicate the mud flats that were extensive features in the bay in presettlement times. The North Channel also received a significant amount of fill.
In the new scenario, Interstate Island is approximately doubled in size, and the area between Interstate Island and the new islands to the west was made shallower. These recommendations were incorporated into the Ecological Concept Plan and the model re-run to predict effects on aquatic vegetation beds and biotic response variables.

49
Figure 34. Bathymetric change, shoreline and breakwall development and islands created in AOC preferred scenario.

50
Habitat and Biotic Response The Ecological Concept Plan significantly increases the area in shallow-low energy habitat (Figure 35; Table 15), by approximately 30 ac. It also increased shallow high energy habitat from 48 to 87 ac. These increases are attained primarily by reduction of deep-high energy habitat (161 to 68 ac). Deep habitat is reduced by 85 acres and disphotic habitat is reduced by 50 ac. In addition 22 acres of new land are added to the project area, both as expanded shoreline, islands or island expansion.
Figure 35. Depth-energy environments from ecological concept plan.
The increase in shallow low energy habitat resulting in an increase of 30 ac of emergent wetland, more than any of the previous scenarios (Table 16). Moreover, the Ecological Concept Plan creates a spatially dispersed distribution of vegetation beds, occupying areas of WLSSD bay,

51
Miller Bay and an extensive complex west of Interstate Island (Figure 36). The design creates a reduction in the areas of floating leaf and submerged aquatic beds, 22 and 13%, respectively. Compared with the current condition, the Ecological Concept Plan produces a much more heterogeneous distribution of aquatic beds, with extensive patches of emergent marsh in the outer portions of WLSSD bay interlaces with floating leaf beds.
The Ecological Concept Plan improves upon Scenarios D and E by creating more protection from wave energy for shallow and intermediate depth areas, giving these areas a much greater likelihood of actually developing dense, diverse beds of aquatic vegetation. And because this scenario treats a significant amount of the site, it has the potential to have a significant effect on aquatic macroinvertebrates. This plan is the best of the 6 developed so far for improvement of the aquatic macroinvertebrate community. In addition, the interspersion should help create diverse and heterogenous vegetative habitats, which are likely to lead to diverse and heterogeneous fish and macroinvertebrate assemblages. On the other hand, there may be a negative effect on Hexagenia mayflies because disphotic and deep water areas are reduced. Hexagenia typically prefer stable, relatively soft, sparsely vegetated substrate, which likely translates to disphotic depths in areas either deep enough to be beneath the wave zone influence, or protected from wave energy.
Increasing emergent wetland habitat will benefit both waterfowl and waterbirds by offering protection from human disturbance and potentially increasing the number and diversity of nesting species in the area. Terns and shorebirds will benefit from the creation of island habitat and the expansion of land and shallow low energy habitat along the shoreline. Deterring Ring-billed Gull and Canada Goose occupancy of these newly created habitats will be crucial to promoting habitation by more sensitive target species. Rare migrating shorebirds and gulls observed in the St. Louis River estuary, including the 21st Avenue West complex, will benefit from the expansion and maintenance of shallow low energy habitats.

52
Figure 36. Distribution of aquatic vegetation beds in the Ecological Concept Plan.
53
Ecotoxicology It would be best to use a method that would prevent significant amounts of sediment mixing in the water column when increasing water depths in the Project Area. Sediment dredged in the western portion of the project area and in areas near the creek delta (a hotspot for PAH and PCBs) is likely contaminated and may require confined disposal. Additional contaminant testing would need to be conducted if these sediments are to be used as fill in the 21st area. In addition, the dredged sediments from this area and from the area near the newly created islands may require disposal and more contaminant testing would be needed if these sediments were to be used as fill in the 21st restoration area. Contaminant data are limited in the newly expanded project area (more southern portion of project area) and additional testing would help inform remedial management. It is uncertain what contaminant issues may exist with the new creation of these two islands, but data suggest that sediment in this area is toxic to benthic organisms.
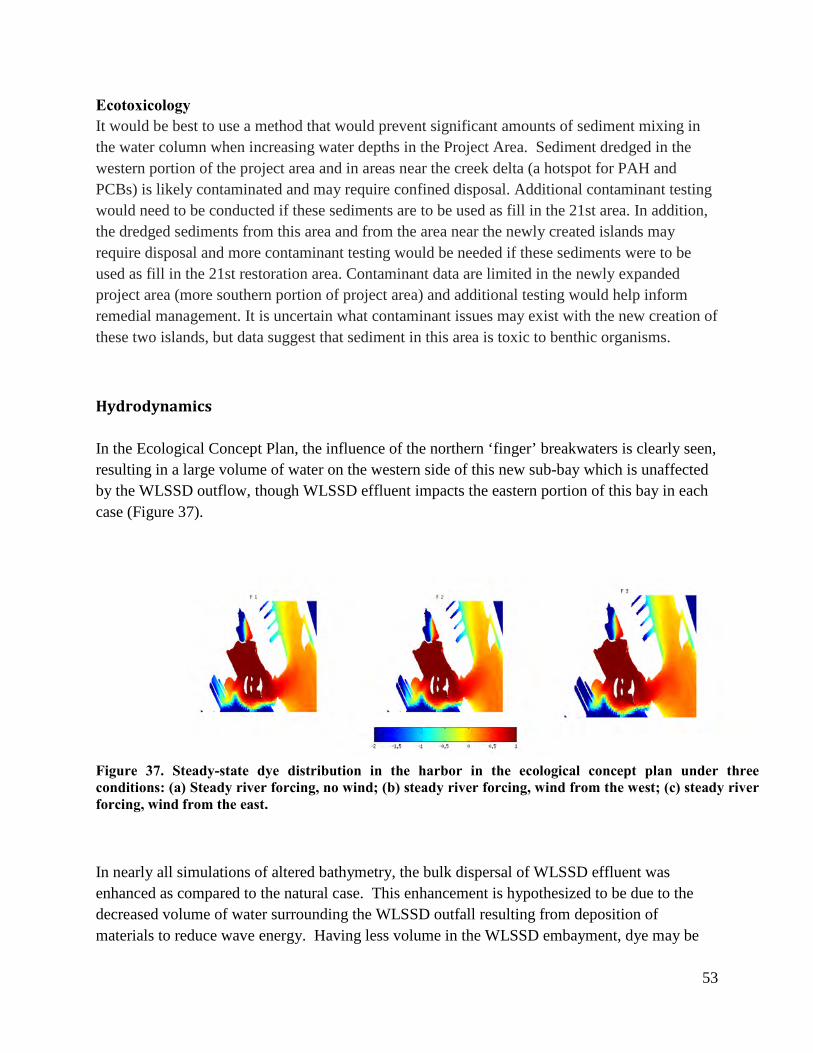
Hydrodynamics In the Ecological Concept Plan, the influence of the northern ‘finger’ breakwaters is clearly seen, resulting in a large volume of water on the western side of this new sub-bay which is unaffected by the WLSSD outflow, though WLSSD effluent impacts the eastern portion of this bay in each case (Figure 37).
In nearly all simulations of altered bathymetry, the bulk dispersal of WLSSD effluent was enhanced as compared to the natural case. This enhancement is hypothesized to be due to the decreased volume of water surrounding the WLSSD outfall resulting from deposition of materials to reduce wave energy. Having less volume in the WLSSD embayment, dye may be
Figure 37. Steady-state dye distribution in the harbor in the ecological concept plan under three conditions: (a) Steady river forcing, no wind; (b) steady river forcing, wind from the west; (c) steady river forcing, wind from the east.

54
more quickly transported to and entrained in the main course of St. Louis River water, where it is carried to the harbor and ultimately the lake via connections at the Superior Entry and Duluth Canal. Locally, the most significant difference between natural and altered scenarios occurs in Scenario E, and to the same extent in the Ecological Concept Plan, where the embayment of Miller Creek creates an area less affected by effluent.
In analysis of time-to-lake measures, there is little difference between the natural and altered cases. This suggests that while modification of WLSSD-area bathymetry and coastline enhances intra-estuary dispersion of WLSSD effluent, lake-estuary exchange remains unaffected and, unsurprisingly, changes in dispersive currents are local to the area of bathymetric modification. Very little if any differences in the distribution of WLSSD outflow can be seen between the control case and the various scenarios outside the immediate vicinity of the bay.

55
VI. Conclusions
Overview of the Project These restoration scenarios provide guidance toward understanding how plant and animal communities might change with the changes to bathymetry, expansion of existing shoreland, and the creation of islands and additional shallow habitat to promote aquatic vegetation and reduce wind energy. The most pronounced effects are predicted to result from scenarios that create new shallow and intermediate depth habitat, especially when this can be done in areas provided protection from wave and wind energy. These areas would, in turn, support development of emergent marsh and floating leaf plant communities. Shallow and, ideally, low energy environments provide increased habitat for macroinvertebrates, wetland-affiliated fish and birds – effects that would be further amplified by the trophic relationships among these communities.
The Ecological Concept Plan incorporates the best elements of the original scenarios, along with new modifications that provide increased emergent habitat, a high degree of habitat heterogeneity, and altered flow patterns (Figure 38). While the specific presettlement conditions for the site are unknown, evidence from the Hearding map and early photos of the harbor imply extensive vegetation beds, numerous shallows, and exposed mud flats. The use of shoals and creation of shallower habitat, particularly in WLSSD bay, should restore this site to a more original representation of plants, fish and bird habitat.

56
Figure 38. Digital rendering of future restoration site following implementation of ecological design. [T. Brown]
Biological Effects and Considerations
Aquatic Plant Community Considerations Since marsh vegetation is a good natural filter for many sewage effluent contaminants, there may be additional benefits to increasing emergent marsh and adjacent floating-leaf marsh vegetation, especially near WLSSD outfall areas. In that respect, the Ecological Concept Plan may be the most beneficial for long-term water quality conditions in the harbor because of the substantial increases in both emergent marsh and submerged aquatic bed vegetation.
Overall aquatic plant diversity was very low at 21st Ave West when sampled in 2011, especially when compared to other sites recently sampled for remediation to restoration projects. Even with

57
a much higher number of sample points in the shallow portions of the Project Area), the number of aquatic plant taxa present was in the very low end of the range for open water sample points.
The low diversity of plant taxa in the shallow portions of the Project Area is not explained by water clarity as expressed by average Secchi depth, nor by water depths, nor even by the combination of depth and energy environment. The range of water depths and Secchi depths are similar to the reference areas. The low diversity of the deep portions of the Project Area may be due to much deeper water depths in the dredged channels, since they have depths much greater than in the comparable reference areas.
Macroinvertebrate Community Considerations The 21st Avenue West site is highly dominated by aquatic earthworms (Oligochaeta) and contains fewer aquatic insects, both in abundance and as representative taxa, than the Reference Area. Lower taxa richness, despite greater sampling effort at 21st Shallow, also indicates an assemblage that is not as good as it could be compared to other areas in the estuary. While part of the cause of this impairment may be due to lack of aquatic vegetation, it is not clear that physical habitat characteristics are the sole reason causing impairment. The finding of sediment toxicity to benthic invertebrates around Interstate Island, and the presence of toxic contaminants at other locations within the project area, suggests that toxicity has a role in explaining the differences in aquatic macroinvertebrates at 21st relative to Reference and other areas in the estuary. Nutrient enrichment from the WLSSD outfall may be another component of the explanation, since the high densities of aquatic oligochaetes and other “hardy” invertebrates suggests nutrient enrichment.
Thus, improvement of the aquatic macroinvertebrate community may depend on more than altering depth and energy environments and coaxing a diverse aquatic macrophyte community to grow. It may also be necessary to remediate legacy toxins and to monitor for contaminants of emerging concern that could affect invertebrates (and fish). The WLSSD outfall will be a source of nutrient enrichment into the future unless tertiary treatment becomes affordable. There may be additional ways to mitigate effects of the enrichment, however, by ensuring that WLSSD outflow mixes quickly with St. Louis River flow.
One favorable observation from this sampling is that the large burrowing mayfly Hexagenia was found within the 21st Shallow location (and also found at Reference and 40th Avenue West). (Note also that the family was found within 21st Deep, but could not be identified to genus). However, large shallow areas further into the bay are void of Hexagenia even though habitat conditions (e.g., depositional mudflats) would appear to provide suitable refuge. These may be areas where either legacy toxins are causing a problem, or where wave energies are too high for Hexagenia to maintain stable burrows. This mayfly is particularly sensitive to dissolved oxygen, and its presence indicates that dissolved oxygen is not a limiting factor in areas where it occurs. Hexagenia are of particular interest to sport fishermen, who often like to fish the “Hex hatch”

58
when the mayfly emerges to become a winged adult. Scientists and managers are interested in Hexagenia because it may also serve as a bioaccumulation link in the estuary food web; it is large-bodied, long-lived, and resides with the sediment, and thus in potentially close proximity to legacy toxins, throughout most of its lifecycle.
Avian Community Considerations The recommendations for 21st Avenue West are nearly identical to those for the 40th Avenue West site, as described in Niemi et al. (2011). Recommendations have been altered where necessary to reflect needs specific to 21st Avenue West. The greatest potential for restoration includes creating wetlands, sandy/cobble shorelines, and a variety of habitat conditions for migratory songbirds. However, this area has a severe ornithological problem due to the attraction to the site of Ring-billed Gulls, Canada Goose, American Crow, and European Starling. The former three are native species of the region, while the European Starling is a non-native, invasive species introduced to the United States in the late 1800’s. Any restoration that could create additional open sandy or cobble habitat will be an attraction to gulls. Restoration that increases wetland habitat in the region will also likely benefit the Canada Goose. The high populations of American Crow and European Starling are due to the food sources available at WLSSD. If these populations are left unmanaged, then it is possible that restoration efforts may make the problems with these species even worse.
Specific remediation of the site should consider the following with respect to bird use of the area:
1) Development of Sandy/Cobble Habitat - The greatest potential for positive benefit for remediation at the site includes considerations for creation of habitat for the endangered Piping Plover and threatened Common Tern. Both of these species require open and protected sandy or cobble beaches. Restoration of open sandy or beach habitat and colonization of subsequent sites by either species would face significant challenges from the presence of gulls and other predators.
2) Enhancement of Emergent Wetlands -Waterfowl and other wetland bird species would greatly benefit by improvement in the quality and expansion of wetland habitats in the area. Each of these species groups were largely confined to shallow water habitats within the study area. The current diversity of waterfowl and waterbird species use of the area would be enhanced further with improvement in wetlands. There were several wetland-associated species that were not observed in the area that may also colonize these areas in the future if the wetland habitats were improved or expanded. These include the American Bittern, Forster’s Tern, Black Tern, Marsh Wren, and Virginia Rail. However, emergent wetlands may also prove attractive to more Canada Geese; the interactions of this species with other species of interest are unclear.
3) Public Access – Due to landownership and the industrialized nature of the location, the area is currently inaccessible to the public. There is no public viewing area for bird watching or

59
other recreational activities, with the exception of the Port Terminal Road beneath the Blatnik Bridge (US Hwy 53), which does not provide an ideal environment for bird watching due to noise pollution created by the high level of use by humans. Improving public exposure and opportunities for wildlife viewing with public access would be beneficial and access to selected portions of the site should be developed. Considerations at this site include safety issues with the railroad tracks and property ownership. The area east of WLSSD is a popular bird watching area already and this could be enhanced; however, there are also sensitive issues regarding the successful operation of WLSSD such as deterring the use of the site by birds. Signage would be important to explain to the public about safety issues to not enter WLSSD property, plus health reasons on why bird use of the compost area is discouraged.
4) Management Coordination – There are several wildlife conflicts that exist in this area such as the presence of prolific species such as Ring-billed Gull and Canada Goose. Encouragement of Common Tern or Piping Plover nesting habitat within the site by the creation of open, protected sandy and cobble areas would also be attractive to Ring-billed and Herring Gulls. There would be little justification for further encouragement of nesting for either of these species in the Duluth-Superior Harbor if these species are not managed. Restoration of the site requires extensive discussion among management agencies, non-government organizations, and the public to achieve an optimum result for the area.
Ecological Risk Management Considerations Available data suggest that there are moderate remedial considerations for the 21st Ave W restoration area. While recent sediment chemistry data (MPCA 2013) suggest that the greatest concentrations are often found in deeper sediment layers (50-100 cm), including the exceedance of Level II SQTs, these data also show that contaminant concentrations exceed the Level I SQTs in the surficial sediments. Additional recent results (FWS 2012) indicate that surficial sediment, in a few areas, exhibit toxic effects on invertebrates. Therefore, the project area presents a significant risk to the aquatic community even if the sediment is left undisturbed in these particular locations (particularly near the State Lines and WLSSD).
60
Recommended remedial practices:
• Ensure that sediments being used as fill in the 21st Ave Project Area are clean and meet state standards.
• Consult with an experienced risk manager during the remediation and restoration processes.
• Consider bioactive zones for the selected project design. • When restoring habitat, avoid disturbing sediment in areas with greater contaminant
concentrations (Figure 6). Disturbance of these contaminated sediments could increase bioavailability of contaminants, and thus increase the toxic effects to fish and wildlife.
Additional Information Needs Contaminant risks in the project area are still somewhat poorly understood because of some data issues and uncertainties which may affect risk determinations. It would be helpful to have more data with depth profiles and acceptable detection limits (below Level I SQTs) to help inform remedial management. For example, data collected in 2008 and 2010 had poor detection limits for select contaminants, such as PCBs and chlorinated pesticides, and were not useable. These data were not considered in this remedial assessment, and therefore it is difficult to quantify risk for these contaminants. Invertebrates for the toxicity and bioaccumulation bioassay exposures were limited to surficial sediments for the 2012 USFWS study. In addition, bioaccumulation data are limited because the oligochaetes from the bioassay were only tested for metals due to low tissue mass. For future studies, it would be beneficial to focus analyses on PAHs, PCBs, toxaphene, dioxin/furans, and mercury for bioaccumulation assays.
However, there are a number of factors that make the 21st Avenue West site different from the previous ecological design study at 40th Ave West (Host et al 2012). In our aquatic plant survey from summer 2011, the aquatic vegetation, especially the floating leaf and submerged aquatic plants, were quite sparse. Approximately 40% of points where we would expect vegetation, and where the model predicts vegetation, substrates were essentially devoid of plant life. Other locations that should support healthy aquatic beds had limited numbers of individuals. The macroinvertebrate community, perhaps partly in response, was also not as expected, with a lack of typical macroinvertebrates for the site and a dominance by oligochaete worms. There are a number of potential causes for these disparities:
• Excessive sediment loading from Miller and Coffee Creeks physically disrupting establishing aquatic plants
• Herbivory by persistent bird populations attracted to the site by year-around open water • Increased loading of dissolved organic carbon (as evidenced by macroinvertebrate
indicators), potentially from WLSSD • Presence of contaminants in sediments that inhibit plant growth

61
It will be critical that the causal factors limiting growth of aquatic macrophytes and creating the anomalous responses of vegetation and biota be understood and resolved before the predicted results of restoration activities can be interpreted with confidence. Several of these factors – contaminants for example-lie in the realm of remediation, the necessary first step in the R-to-R process.
The Hexagenia mayfly is an important species in the food chain that often uses deep habitat as refugia. Increased deep habitat could lead to increases in Hexagenia as well as walleye and other fish. However, the scenarios presented here promote shallow habitat, none increases the amount of disphotic or deep, low energy area that is predicted to benefit Hexagenia.
Recommendations for Future Steps
Vegetation Studies In order to address the question of what is limiting growth of aquatic plants (sediment quality, water quality, or both), we recommend conducting two experiments, one in a controlled mesocosm setting and one at the 21st Avenue West site, to attempt to identify causal factors for the depauparate vegetation at the site:
1) Mesocosm experiments
These experiments will be controlled experiments on growth of aquatic plants in sediments collected from both clean and contaminated sites within the St. Louis River estuary, initially using untreated water from Lake Superior. The experiment will be run in in mesocosm tanks consisting of 50 gallon plastic barrels, with aquatic plants set in 6” diameter sediment core tubes that will serve as planting “pots” for the aquatic plants. The tanks will hold about 20 to 22” of water depth above the tops of sediment tubes placed in the bottom of the tanks. The first year (summer 2013) will be a trial of two mesocosm tanks using clean sediments, to test and refine the mesocosm tank design and confirm that aquatic plants can be successfully grown in the tanks. The second year (summer 2014) will be a comparison of growth of aquatic plants in sediments from clean and contaminated sites: four mesocosm tanks will have “clean” sediments from reference sites within the St. Louis River estuary, and four tanks will have sediments from contaminated sites (e.g. 21st Avenue West and 40th Avenue West). Aquatic plants (e.g. Vallisneria americana) will be grown from buds planted in the tubes of sediment for 12 weeks; plants will be dried and weighed to compare biomass between treatments. This experiment should help determine if contaminated sediments are limiting growth of aquatic plants. Depending on the outcome of the first year’s experiment, the treatments can be modified in the second year (2015) to either compare different water sources, or to amend clean sediments with suspected sources of contamination.

62
2) Reciprocal Transplant experiments
These experiments are similar to a common garden experiment; however in this case the common garden sites will be reference and remediation sites within the St. Louis River estuary. Submerged aquatic plants will be found growing near shore in a “clean” reference site, and a few individual plants will be transplanted to pots filled with sediments from two sources: the same clean reference site (e.g. east of Clough Island) and a contaminated site (21st Ave West). The pots filled with clean sediment will be transplanted to a location in the reference site near where plants were collected, and the pots filled with 21st Ave West sediment will be transplanted to a similar water depth at the 21st Ave West site. A few submerged aquatic plants growing near shore at the 21st Ave West site will also be located, and transplanted into pots with sediments from both sites. Pots with 21st Ave West sediment will be planted near where they were collected, and the pots with reference site sediments will be planted at similar water depths near where the sediment was collected at the reference site. In each case the transplanted plants will be covered with a wire mesh cage to reduce herbivory by waterfowl. Then after a set period of time (e.g. 12 weeks) the transplants will be collected, dried and weighed to compare biomass.

63
VII. Literature Cited
Blouin, M., P. Hudson, and M. Chriscinske. 2004. Habitat selection by two species of burrowing mayfly nymphs in the Les Cheneaux Islands region of northern Lake Huron. J. Freshw. Ecol. 19 (3): 607-514.
Brady, V., C. Reschke, D. Breneman, G. E. Host, and L. B. Johnson. 2010. 40th Avenue West remediation to restoration project: biological survey results. Natural Resources Research Institute. NRRI/TR-2010/24 23 pp.
Coffin, B and L. Pfanmuller. 1988. Minnesota’s endangered flora and fauna. University of Minnesota Press, Minneapolis, MN 465 p.
Canadian Council of Ministers of the Environment. 2001. Canadian tissue residue guidelines for the protection of wildlife consumers of aquatic biota: summary table. Updated. In: Canadian environmental quality guidelines, 1999, Canadian Council of Ministers of the Environment, Winnipeg.
Crane, J.L. 2006. Phase IV GIS-Based Sediment Quality Database for the St. Louis River Area of Concern- Wisconsin Focus: Overview of sediment quality conditions in the St. Louis River Area of Concern. Environmental Analysis and Outcomes Division, Minnesota Pollution Control Agency.
Crane, J.L. and D.D. MacDonald. 2003. Applications of numerical sediment quality targets for assessing sediment quality conditions in a US Great Lakes Area of Concern. Environ.Manage. 32:128-140.
Crane, J.L., D.D. MacDonald, C.G. Ingersoll, D.E. Smorong, R.A. Lindskoog, C.G. Severn, T.A.Berger, and L.J. Field. 2000. Development of a framework for evaluating numerical sediment quality targets and sediment contamination in the St. Louis River Area of Concern. Great Lakes National Program Office, United States Environmental Protection Agency, Chicago, IL. EPA 905-R-00-008.
Crane, J.L., D.D. MacDonald, C.G. Ingersoll, D.E. Smorong, R.A. Lindskoog, C.G. Severn, T.A.Berger, and L.J. Field. 2002. Evaluation of numerical sediment quality targets for the St. Louis River Area of Concern. Arch. Environ. Contam. Toxicol. 43:1-10.
Hoffman, J.C., J.R. Kelly, A.S. Trebitz, G.S. Peterson, and C.W. West. 2011. Effort and potential efficiencies for aquatic non-native species early detection. Canadian Journal of Fisheries and Aquatic Sciences 68:2064-2079.
Host, G. E., P. Meysembourg, C. Reschke, V. Brady, G. Niemi, A. Bracey and L. Johnson. 2012. An ecological design for the 40th Avenue West Remediation-to-Restoration Project. Natural Resources Research Institute. NRRI/TR-2012/27 57 p.
Host, G.E., C. Reschke, V. Brady, D. Breneman, J. Dumke, G. Niemi, J. Austin, M. James, and L. Johnson. 2012. 21st Avenue West Remediation-to-Restoration Project: Biological Survey Results. Report to US Fish and Wildlife Service, 29 p.
Krieger K.A. 1999. Ecosystem change in western Lake Erie: Cause and effect of burrowing mayfly recolonization. Final Report, Ohio Lake Erie Commission, Toledo, OH.

64
MPCA. 2013. Remedial Review and Determination Memorandum. Remedial Assessment Area 57
Niemi, G. J., J. Lind, A. Bracey, C. Lapin, and P. Meysembourg. Avian Survey Results, 40th Avenue West Remediation to Restoration Project. Addendum to Brady, V., C. Reschke, D. Breneman, G. E. Host and L. B. Johnson. 2010. 40th Avenue West remediation to restoration project: biological survey results. Natural Resources Research Institute. NRRI/TR-2010/24
Peterson, G.S., J.C. Hoffman, A.S. Trebitz, C.W. West, and J.R. Kelly. 2011. Establishment patterns of non-native fishes: lessons from the Duluth-Superior harbor and lower St. Louis River, an invasion-prone Great Lakes coastal ecosystem. Journal of Great Lakes Research 37:349-358.
Rohweder, J., J.T. Rogala, B.L. Johnson, D. Anderson, S. Clark, F. Chamberlin, and K. Runyon. 2008. Application of wind fetch and wave models for habitat rehabilitation and enhancement projects. Open-File Report 2008–1200, U.S. Geological Survey, Reston, Virginia.
Yin Y., J. Rogala, J. Sullivan, and J. Rohweder. 2008. Submersed aquatic vegetation modeling output online. USGS Upper Midwest Environmental Science Center. http://umesc-gisdb03.er.usgs.gov/sav_model_p8/viewer.aspx (accessed 6/13/11).

65
Table 1. Habitat Class (depth x exposure) summaries for current condition at 21st Avenue West.
Habitat Classes
Current Condition
(acres) % of Total
Area Shallow (< 0.65 m) - Low Energy 15.0 2.9 Shallow (< 0.65 m) - High Energy 47.6 9.0 Intermediate (< 0.65 - 1.6 m) - Low Energy 8.1 1.5 Intermediate (< 0.65 - 1.6 m) - High Energy 112.0 21.3 Deep (1.6 - 2.5) - Low Energy 1.8 0.3 Deep (1.6 - 2.5) - High Energy 161.4 30.7 Disphotic zone ( > 2.5 m) 174.6 33.2 Island 5.7 1.1 Total Acres 526.2
Table 2. Benthic macroinvertebrate trait comparisons between sampling locations within the St. Louis River Estuary. Total number and total taxa represent mean values + 1 standard error per sample. Trait characteristics are expressed as a percent of total. Metrics were compared using a one-way ANOVA and are significant at the α= 0.05 level. Metric values with the same letter are not significantly different based on Duncan’s Multiple Range Test. Dominance (%) is a proportion of the total numbers represented by a single taxa. ET taxa are those identified as Ephemeroptera or Trichoptera.
Invertebrate metric Reference 40th Ave W 21st Shallow 21st Deep Sample n n=20 n=20 n=48 n=22 Total Abundance (m2) 15,921±134b 20,360±4126 b 34,857±4579 a 44,587±5754 a % Dominance 44±2.6 c 49±2.9 bc 63±2.3 a 57±2.1 ab % Chironomidae 36±3.6 a 22±2.8 b 9±1.3 c 2±0.3 d % Oligochaeta 29±3.1 b 39±3.8 b 55±3.6 a 55±2.6 a % Non-Insects 57±3.6 d 75±3.1 c 91±1.3 b 98±0.4 a Total Taxa 15±0.9 a 9±1.1 b 9±0.3 b 8±0.3 b % Collect-Gather Taxa 40±2.5 b 53±4.7 a 44±1.3 a 37±1.8 c % Grazer-Scraper Taxa 10±1.5 a 8±2.2 ab 8±1.1 b 13±1.6 a % ET Taxa 25±1.3a 14±2.7 b 6±1.5 c 2±1.3 c
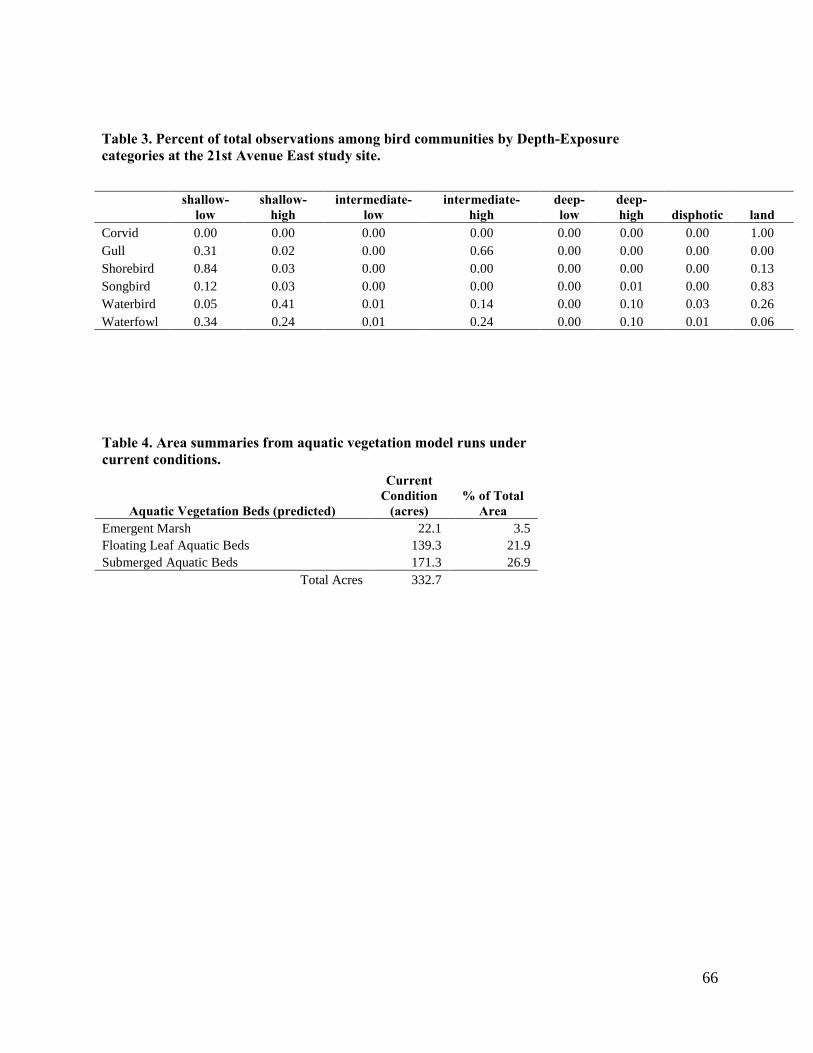
66
Table 3. Percent of total observations among bird communities by Depth-Exposure categories at the 21st Avenue East study site.
shallow-
low shallow-
high intermediate-
low intermediate-
high deep-low
deep-high disphotic land
Corvid 0.00 0.00 0.00 0.00 0.00 0.00 0.00 1.00 Gull 0.31 0.02 0.00 0.66 0.00 0.00 0.00 0.00 Shorebird 0.84 0.03 0.00 0.00 0.00 0.00 0.00 0.13 Songbird 0.12 0.03 0.00 0.00 0.00 0.01 0.00 0.83 Waterbird 0.05 0.41 0.01 0.14 0.00 0.10 0.03 0.26 Waterfowl 0.34 0.24 0.01 0.24 0.00 0.10 0.01 0.06
Table 4. Area summaries from aquatic vegetation model runs under current conditions.
Aquatic Vegetation Beds (predicted)
Current Condition
(acres) % of Total
Area Emergent Marsh 22.1 3.5 Floating Leaf Aquatic Beds 139.3 21.9 Submerged Aquatic Beds 171.3 26.9
Total Acres 332.7

67
Table 5. Summary of Habitat Class (depth x exposure) area and biotic response for Scenario A.
Habitat Classes
Current Condition (acres)
Scenario A (ac)
Change (ac)
% Change over site
Macroinv. Richness
Hexagenia Habitat
Waterbird Waterfowl
Habitat
Songbird Corvid Habitat
SAV-affiliated
fish
Channel or Deepwater
FishShallow (< 0.65 m) - Low Energy 15.0 11.9 -3.1 -0.6Shallow (< 0.65 m) - High Energy 47.6 51.5 3.9 0.7Intermediate (< 0.65 - 1.6 m) - Low Energy 8.1 4.2 -3.9 -0.7Intermediate (< 0.65 - 1.6 m) - High Energy 112.0 115.8 3.8 0.7Deep (1.6 - 2.5) - Low Energy 1.8 0.5 -1.3 -0.2Deep (1.6 - 2.5) - High Energy 161.4 162.4 1.0 0.2Disphotic zone ( > 2.5 m) 174.6 173.8 -0.8 -0.2Island 5.7 6.6 0.9 0.2
Total Acres 526.2 526.7
Table 7. Summary of Habitat Class (depth x exposure) areas and biotic response for Scenario B.
Habitat Classes
Current Condition (acres)
Scenario B
Change (ac)
% Change
Macroinv. Richness
Hexagenia Habitat
Waterbird Waterfowl
Habitat
Songbird Corvid Habitat
SAV-affiliated
fish
Channel or Deepwater
FishShallow (< 0.65 m) - Low Energy 15.0 25.8 10.8 2.1 ++Shallow (< 0.65 m) - High Energy 47.6 44.7 -3.0 -0.6Intermediate (< 0.65 - 1.6 m) - Low Energy 8.1 3.9 -4.2 -0.8Intermediate (< 0.65 - 1.6 m) - High Energy 112.0 167.0 55.0 10.8 +++Deep (1.6 - 2.5) - Low Energy 1.8 5.6 3.8 0.7Deep (1.6 - 2.5) - High Energy 161.4 160.8 -0.6 -0.1Disphotic zone ( > 2.5 m) 174.6 96.3 -78.3 -15.4 ---Island 5.7 5.7 0.0 0.0
Total Acres 526.2 509.7 -16.5
Table 9. Summary of Habitat Class (depth x exposure) areas and biotic response for Scenario C.
Habitat Classes
Current Condition (acres)
Scenario C
Change (ac)
% Change
Macroinv. Richness
Hexagenia Habitat
Waterbird Waterfowl
Habitat
Songbird Corvid Habitat
SAV-affiliated
fish
Channel or Deepwater
FishShallow (< 0.65 m) - Low Energy 15.0 21.5 6.5 1.2 +Shallow (< 0.65 m) - High Energy 47.6 50.5 2.9 0.6Intermediate (< 0.65 - 1.6 m) - Low Energy 8.1 10.5 2.4 0.5Intermediate (< 0.65 - 1.6 m) - High Energy 112.0 158.5 46.5 8.8 +++Deep (1.6 - 2.5) - Low Energy 1.8 2.0 0.2 0.0Deep (1.6 - 2.5) - High Energy 161.4 104.3 -57.1 -10.9 --- ---Disphotic zone ( > 2.5 m) 174.6 161.1 -13.5 -2.6Island 5.7 5.7 0.0 0.0
Total Acres 526.2 514.1 -12.1
Table 11. Summary of Habitat Class (depth x exposure) areas and biotic response for Scenario D.
Habitat Classes
Current Condition (acres)
Scenario D
Change (ac)
% Change
Macroinv. Richness
Hexagenia Habitat
Waterbird Waterfowl
Habitat
Songbird Corvid Habitat
SAV-affiliated
fish
Channel or Deepwater
FishShallow (< 0.65 m) - Low Energy 15.0 22.7 7.7 1.5Shallow (< 0.65 m) - High Energy 47.6 77.5 29.9 5.7 ++ +++Intermediate (< 0.65 - 1.6 m) - Low Energy 8.1 11.8 3.7 0.7Intermediate (< 0.65 - 1.6 m) - High Energy 112.0 139.2 27.2 5.2Deep (1.6 - 2.5) - Low Energy 1.8 0.0 -1.8 -0.3Deep (1.6 - 2.5) - High Energy 161.4 89.8 -71.6 -13.6 --- ---Disphotic zone ( > 2.5 m) 174.6 149.3 -25.3 -4.8 --Island 5.7 24.1 18.4 3.5 +
Total Acres 526.2 514.4 -11.8
Table 13. Summary of Habitat Class (depth x exposure) areas and biotic response for Scenario E.
Habitat Classes
Current Condition (acres)
Scenario E
Change (ac)
% Change
Macroinv. Richness
Hexagenia Habitat
Waterbird Waterfowl
Habitat
Songbird Corvid Habitat
SAV-affiliated
fish
Channel or Deepwater
FishShallow (< 0.65 m) - Low Energy 15.0 51.7 36.7 7.0 +Shallow (< 0.65 m) - High Energy 47.6 62.0 14.4 2.7 +++ +++Intermediate (< 0.65 - 1.6 m) - Low Energy 8.1 27.9 19.8 3.8Intermediate (< 0.65 - 1.6 m) - High Energy 112.0 140.8 28.8 5.5Deep (1.6 - 2.5) - Low Energy 1.8 9.4 7.6 1.4Deep (1.6 - 2.5) - High Energy 161.4 68.0 -93.4 -17.8 ---Disphotic zone ( > 2.5 m) 174.6 124.1 -50.5 -9.6 --- ---Island 5.7 27.9 22.2 4.2 ++
Total Acres 526.2 511.8 -14.4
Table 15. Summary of Habitat Class (depth x exposure) areas and biotic response for Ecological Concept Plan.
Habitat Classes
Current Condition (acres)
Preferred Scenario
Change (ac)
% Change
Macroinv. Richness
Hexagenia Habitat
Waterbird Waterfowl
Habitat
Songbird Corvid Habitat
SAV-affiliated
fish
Channel or Deepwater
FishShallow (< 0.65 m) - Low Energy 15.0 43.9 28.9 5.5 +++ +++ +++Shallow (< 0.65 m) - High Energy 47.6 86.9 39.3 7.5 ++ ++ ++Intermediate (< 0.65 - 1.6 m) - Low Energy 8.1 9.0 0.9 0.2Intermediate (< 0.65 - 1.6 m) - High Energy 112.0 152.9 40.9 7.8 ++Deep (1.6 - 2.5) - Low Energy 1.8 2.5 0.7 0.1Deep (1.6 - 2.5) - High Energy 161.4 75.2 -86.2 -16.4 ---Disphotic zone ( > 2.5 m) 174.6 133.7 -40.9 -7.8 --- ---Island 5.7 27.9 22.2 4.2 +
Total Acres 526.2 532.0 5.8