An earlytime infrared and optical study of the Type Ia ... · find that SN 1998bu peaked at an...
13
University of Groningen An early-time infrared and optical study of the Type Ia Supernova 1998bu in M96 Hernandez, M; Meikle, WPS; Aparicio, A; Benn, CR; Burleigh, MR; Chrysostomou, AC; Fernandes, AJL; Geballe, TR; Hammersley, PL; Iglesias-Paramo, J Published in: Monthly Notices of the Royal Astronomical Society DOI: 10.1046/j.1365-8711.2000.03841.x IMPORTANT NOTE: You are advised to consult the publisher's version (publisher's PDF) if you wish to cite from it. Please check the document version below. Document Version Publisher's PDF, also known as Version of record Publication date: 2000 Link to publication in University of Groningen/UMCG research database Citation for published version (APA): Hernandez, M., Meikle, WPS., Aparicio, A., Benn, CR., Burleigh, MR., Chrysostomou, AC., ... Zapatero- Osorio, MR. (2000). An early-time infrared and optical study of the Type Ia Supernova 1998bu in M96. Monthly Notices of the Royal Astronomical Society, 319(1), 223-234. https://doi.org/10.1046/j.1365- 8711.2000.03841.x Copyright Other than for strictly personal use, it is not permitted to download or to forward/distribute the text or part of it without the consent of the author(s) and/or copyright holder(s), unless the work is under an open content license (like Creative Commons). Take-down policy If you believe that this document breaches copyright please contact us providing details, and we will remove access to the work immediately and investigate your claim. Downloaded from the University of Groningen/UMCG research database (Pure): http://www.rug.nl/research/portal. For technical reasons the number of authors shown on this cover page is limited to 10 maximum. Download date: 28-12-2019
Transcript of An earlytime infrared and optical study of the Type Ia ... · find that SN 1998bu peaked at an...

University of Groningen
An early-time infrared and optical study of the Type Ia Supernova 1998bu in M96Hernandez, M; Meikle, WPS; Aparicio, A; Benn, CR; Burleigh, MR; Chrysostomou, AC;Fernandes, AJL; Geballe, TR; Hammersley, PL; Iglesias-Paramo, JPublished in:Monthly Notices of the Royal Astronomical Society
DOI:10.1046/j.1365-8711.2000.03841.x
IMPORTANT NOTE: You are advised to consult the publisher's version (publisher's PDF) if you wish to cite fromit. Please check the document version below.
Document VersionPublisher's PDF, also known as Version of record
Publication date:2000
Link to publication in University of Groningen/UMCG research database
Citation for published version (APA):Hernandez, M., Meikle, WPS., Aparicio, A., Benn, CR., Burleigh, MR., Chrysostomou, AC., ... Zapatero-Osorio, MR. (2000). An early-time infrared and optical study of the Type Ia Supernova 1998bu in M96.Monthly Notices of the Royal Astronomical Society, 319(1), 223-234. https://doi.org/10.1046/j.1365-8711.2000.03841.x
CopyrightOther than for strictly personal use, it is not permitted to download or to forward/distribute the text or part of it without the consent of theauthor(s) and/or copyright holder(s), unless the work is under an open content license (like Creative Commons).
Take-down policyIf you believe that this document breaches copyright please contact us providing details, and we will remove access to the work immediatelyand investigate your claim.
Downloaded from the University of Groningen/UMCG research database (Pure): http://www.rug.nl/research/portal. For technical reasons thenumber of authors shown on this cover page is limited to 10 maximum.
Download date: 28-12-2019

Mon. Not. R. Astron. Soc. 319, 223±234 (2000)
An early-time infrared and optical study of the Type Ia Supernova 1998buin M96
M. Hernandez,1w W. P. S. Meikle,1 A. Aparicio,2 C. R. Benn,3 M. R. Burleigh,4
A. C. Chrysostomou,5 A. J. L. Fernandes,6 T. R. Geballe,7 P. L. Hammersley,2
J. Iglesias-Paramo,2 D. J. James,8 P. A. James,9 S. N. Kemp,2,10 T. A. Lister,8
D. Martinez-Delgado,2 A. Oscoz,2 D. L. Pollacco,11 M. Rozas,2 S. J. Smartt,14
P. Sorensen,3 R. A. Swaters,12 J. H. Telting,3 W. D. Vacca,13 N. A. Walton3
and M. R. Zapatero-Osorio2
1Astrophysics Group, Blackett Laboratory, Imperial College of Science, Technology and Medicine, Prince Consort Road, London SW7 2BZ2Instituto de Astrofisica de Canarias, 38200 La Laguna, Tenerife, Spain; and Departamento de Astrofisica, Universidad de La Laguna, Tenerife, Spain3Isaac Newton Group, Apartado de Correos 321, 38700 Santa Cruz de La Palma, Islas Canarias, Spain4Department of Physics and Astronomy, University of Leicester, University Road, Leicester LE1 7RH5Joint Astronomy Centre, 660 N. A'ohoku Place, University Park, Hilo, HI 96720, USA6Centro de Astrofisica da Universidade do Porto, Rua das Estrelas, 4150-762 Porto, Portugal. Instituto Superior da Maia, Portugal7Gemini Observatory, 670 N. A'ohoku Place, Hilo, HI 96720, USA8Department of Physics and Astronomy, University of St. Andrews, North Haugh, St. Andrews, Fife KY16 9SS9Astrophysics Research Institute, Liverpool John Moores University, Twelve Quays House, Egerton Wharf, Birkenhead L41 1LD10Instituto de Astronomia y Meteorologia, Av. Vallarta No. 2602, Col. Arcos Vallarta, CP 44130, Guadalajara, Jalisco, Mexico11Astrophysics and Planetary Sciences Division, The Queen's University of Belfast, Belfast BT7 1NN12Kapteyn Institute, Rijksuniversiteit Groningen, Postbus 800, 9700 AV Groningen, the Netherlands13IRTF, Institute for Astronomy, 2680 Woodlawn Drive, Honolulu, HI 96822, USA14IoA, University of Cambridge, Madingley Road, Cambridge CB3 0HA
Accepted 2000 July 3. Received 2000 June 14; in original form 2000 March 20
A B S T R A C T
We present first-season infrared (IR) and optical photometry and spectroscopy of the Type Ia
Supernova 1998bu in M96. We also report optical polarimetry of this event. SN 1998bu is
one of the closest type Ia supernovae of modern times, and the distance of its host galaxy is
well determined. We find that SN 1998bu is both photometrically and spectroscopically
normal. However, the extinction to this event is unusually high, with AV � 1:0 ^ 0:11: We
find that SN 1998bu peaked at an intrinsic MV � 219:37 ^ 0:23: Adopting a distance
modulus of 30.25 (Tanvir et al.) and using Phillips et al.'s relations for the Hubble constant,
we obtain H0 � 70:4 ^ 4:3 km s21 Mpc21: Combination of our IR photometry with those of
Jha et al. provides one of the most complete early-phase IR light curves for a SN Ia
published so far. In particular, SN 1998bu is the first normal SN Ia for which good pre-tBmax
IR coverage has been obtained. It reveals that the J, H and K light curves peak about 5 days
earlier than the flux in the B-band curve.
Key words: supernovae: individual: SN 1998bu.
1 I N T R O D U C T I O N
Supernova 1998bu appeared in the Leo I group Sab galaxy M96
(NGC 3368), and was discovered by Mirko Villi (1998) on May
9.9 UT at a magnitude of about 113 (unfiltered CCD), 10 days
before maximum blue light, tBmax � May 19:8 ^ 0:5 UT (see
below). It is located in one of the spiral arms, and has an offset of
40: 3E, 550: 3N from M96's nucleus (Villi 1998). The supernova was
identified by Ayani, Nakatani & Yamaoka (1998) and Meikle et al.
(1998) as being of type Ia. Its position is RA 10h 46m 45:s95,
Dec.111850 0070: 1 (2000.0). This position was determined by us,
using a V-band image taken with the Wide Field Camera of the
Isaac Newton Telescope. Our value agrees with the positions
reported by Boschini (1998) and Nakano & Aoki (1998) to within
1.2 arcsec. An R-band image of SN 1998bu is shown in Fig. 1.
A pre-discovery observation on May 3.14 UT was reported by
q 2000 RAS
w E-mail: [email protected]
Dow
nloaded from https://academ
ic.oup.com/m
nras/article-abstract/319/1/223/1076457 by Rijksuniversiteit G
roningen user on 18 Decem
ber 2018

Faranda & Skiff (1998). This was about 16.5 days before tBmax,
making it one of the earliest observations of a type Ia supernova
(Riess et al. 1999). The Faranda & Skiff measurement was made
with an unfiltered CCD, and converts to magnitude increments
relative to the B and V maxima of 14:65 ^ 0:18 and 14:75 ^
0:15 respectively (Riess et al. 1999). These are the largest
magnitude increments ever measured for the rising portion of a
type Ia event. Riess et al. (1999) estimate a B-band rise-time of
19:5 ^ 0:2 d for a typical SN Ia. This implies an explosion date for
SN 1998bu of 1998 April 30:2 ^ 0:5 UT.
An important aspect of the discovery of this supernova is that
HST images already exist for its parent galaxy M96. Thus,
Cepheids found in these images can be used to find its distance.
Tanvir et al. (1995) obtained a distance modulus of 30:32 ^ 0:15:Addition of the 0.05 mag `long-vs-short exposure' correction
(Casertano & Mutchler 1998; Gibson et al. 2000) increases this to
30:37 ^ 0:16: This is the value included in Parodi et al.'s (2000)
estimate of H0 based on SN Ia observations. However, Tanvir,
Ferguson & Shanks (1999) have revised their estimate using a
larger number of Cepheids (16 as against seven) in M96 and
applying a correction for metallicity differences between the LMC
and M96. They obtain 30:25 ^ 0:18: Gibson et al. (2000) use 11
Cepheids in M96 to find its distance. Including their `typical
correction factor' of 10.07 mag for metallicity difference between
their six principal host galaxies and the LMC, they obtain a
modulus of 30:27 ^ 0:10rand: ^ 0:16sys: for M96. This is in good
agreement with Tanvir et al. (1999). In this paper we adopt the
distance modulus of Tanvir et al., namely 30:25 ^ 0:18; or a
distance of 11:2 ^ 1:0 Mpc: SN 1998bu is one of the closest type
Ia supernovae of modern times, as well as being observed from an
exceptionally early epoch.
We note that Feldmeier, Ciardullo & Jacoby (1997) estimated
the M96 distance modulus using the Planetary Nebula Luminosity
Function (PNLF) method and found a significantly smaller
distance modulus of 29:91 ^ 0:13: However, Ferrarese et al.
(2000) have commented on the tendency of the PNLF method to
produce systematically shorter distances than does the use of
Cepheids (or, indeed, the use of the Tip of the Red Giant Branch
method or the Surface Brightness Fluctuation method). We
therefore do not make use of the Feldmeier et al. value.
Type Ia SNe are increasingly recognized as being among the
most reliable indicators of cosmological distances (cf. Hamuy
et al. 1996; Riess, Press & Kirshner et al. 1996; Perlmutter et al.
1997). However, calibration of the zero-point requires nearby,
well-observed SNe Ia at accurately known distances. Such events
are quite rare, but SN 1998bu is one such example. A number of
major studies of this event have been carried out. Suntzeff et al.
(1999) gave a detailed description and analysis of the optical light
curves acquired at the Cerro Tololo Inter-American Observatory
(CTIO) and Las Campanas Observatory (LCO). Jha et al. (1999)
presented and discussed optical and IR photometry and spectro-
scopy of the event acquired at a number of telescopes.
In this paper we describe optical and infrared (IR) observations
of SN 1998bu obtained at several telescopes. A preliminary report
of this work is presented in Meikle & Hernandez (2000). In Sec-
tion 2 we describe our optical and IR photometry and spectro-
scopy, plus optical polarimetry of SN 1998bu. In Section 3 the
spectra and light curves are discussed. In Section 3.3 correction
for extinction is determined, and the peak absolute magnitudes for
SN 1998bu are deduced. We use them to give a value for H0. A
brief summary is given in Section 4.
2 O B S E RVAT I O N S
2.1 Optical photometry
Shortly after the discovery of SN 1998bu we began a programme
of UBVRI imaging. Most of the data were obtained using the
82-cm Instituto de Astrofisica de Canarias Telescope (IAC80) on
Tenerife, and the 1.0-m Jacobus Kapteyn Telescope (JKT) at
La Palma Observatory. Some additional photometry was obtained
at the 2.56-m Nordic Optical Telescope (NOT) (La Palma) and the
3.5-m Wyoming-Indiana-Yale-NOAO telescope (WIYN) at Kitt
Peak. The earliest image was taken on May 13 (JD 245 0947.43) at
25 days, i.e., 5 days before the epoch of maximum blue light,
tBmax. The first season optical photometry presented here spans 53
days.
The IAC80 observations were acquired with its 1024 � 1024
CCD camera �scale � 0:433 arcsec pixel21; field of view � 7:3 �7:3 arcmin2�: Its BVRI central wavelengths are 4500, 5250, 6000
and 8800 AÊ . The JKT observations were obtained using its 1024 �1024 CCD camera (plate scale � 0:331 arcsec pixel21; field of
view � 5:6 � 5:6 arcmin2�: Its UBVRI filter transmission charac-
teristics are very close to those of Johnson±Cousins. The central
wavelengths are, respectively, 3600, 4350, 5350, 6450 and
8400 AÊ . The WIYN photometry was obtained with a 2048 �2048 CCD �scale � 0:195 arcsec pixel21; field of view � 6:5 �6:5 arcmin2� and UBVRI filters centred at 3584, 4327, 5448, 6461
and 8387 AÊ respectively. At the NOT, TURPOL was used to obtain
photopolarimetry in BVRI, with central wavelengths at 4400,
5300, 5900 and 8300 AÊ .
IAC80 data were reduced at the IAC using iraf software. The
reduction steps included bias-subtraction, flat-fielding and correc-
tion for bad pixels by interpolation. The reduction of the data from
the NOT is described in Oudmaijer et al. (in preparation). Data
from the other telescopes were reduced at Imperial College using
the Starlink package ccdpack to carry out the standard procedures
of debiassing, flat-fielding and bad-pixel and cosmic-ray removal.
Aperture photometry was then carried out. The flux from the
Figure 1. SN 1998bu in M96 in the R band, 1998 June 8 (WIYN). The five
comparison stars (CS) are labelled. The field of view is 6:5 � 6:5 arcmin2:
North is up, and east is to the left.
224 M. Hernandez et al.
q 2000 RAS, MNRAS 319, 223±234
Dow
nloaded from https://academ
ic.oup.com/m
nras/article-abstract/319/1/223/1076457 by Rijksuniversiteit G
roningen user on 18 Decem
ber 2018

supernova or standard stars was measured in a circular aperture.
The background was estimated and subtracted using an annulus
concentric with the central aperture. The annulus inner and outer
radii were respectively �1.5 and �2.5 that of the central aperture.
For a given night and telescope, the central aperture was selected
to have a diameter equal to 4 times the FWHM of a typical stellar
image. Owing to its spatial variation, particular care had to be
taken in estimating and subtracting the background from the host
galaxy. To check this, we examined VRI images of M96 taken
by N. Tanvir with the INT in 1994. We found that variation of the
aperture annulus radius from ,10 to ,20 arcsec, centred on the
supernova position, would affect the supernova instrumental
magnitudes presented here by no more than 0.01 mag. Instru-
mental magnitudes were then obtained using the Starlink photom
package. Photometry was performed in two steps. First, the
supernova magnitudes relative to comparison field stars were
measured. The comparison stars were then calibrated against
Landolt field stars. The comparison stars are identified as CS1,
CS2, CS3, CS4 and CS5 in Fig. 1. At least three of these were
usually available on a given frame.
For the IAC80 observations, colour-corrected magnitude
differences between the comparison stars and SN 1998bu were
obtained using the canonical equations
Db � Dbo 1 CbD�bo 2 vo�Dv � Dvo 1 CvD�bo 2 vo� �1�Dr � Dro 1 CrD�vo 2 ro�Di � Dio 1 CiD�ro 2 io�;where Dbo, Dvo, Dro and Dio are the instrumental magnitude
differences between a comparison star and the supernova,
D�bo 2 vo�, D�vo 2 ro�; and D�ro 2 io� are the colour differences,
and Cb, Cv, Cr and Ci are the colour coefficients, derived below
using the procedures of Hardie (1962). No airmass term appears
since, for any frame, the comparison stars and supernova were
observed at essentially the same airmass. The comparison stars
were calibrated in BVRI using standard Landolt (1992) fields. The
observations for this were carried out with the IAC80 on 1999
June 13. The colour correction coefficients were also derived from
these data using iraf's photcal package. The respective values
for (Cb, Cv, Cr, Ci) were �0:022 ^ 0:010; 0:014 ^ 0:007; 0:036 ^
0:015; 0:075 ^ 0:020�: These values agree well with those
shown in the IAC80 web-page (http://www.iac.es/telescopes/
iac80/instrumentacion.html#color).
For the WIYN observations, calibration of the comparison stars
in VRI was carried out using Landolt standards observed at the
WIYN telescope on 1998 June 5. Similar procedures were used as
for the IAC80 calibrations. However, no Landolt standards were
observed in U or B. Therefore we used a modified version of
equations (1), namely
Dv � Dvo 1 C 0vD�vo 2 ro�Dr � Dro 1 C 0rD�vo 2 ro� �2�Di � Dio 1 C 0iD�ro 2 io�:Values for (C 0v, C 0r, C 0i) were found to be �0:002 ^ 0:008;20:014 ^ 0:018; 0:073 ^ 0:028�:
The VRI comparison star magnitudes obtained from the IAC80
and WIYN all agreed to within the errors, and so the weighted
mean values from these telescopes were adopted. The BVRI
comparison star magnitudes are shown in Table 1.
Unfortunately, in the case of the JKT the observations that were
obtained of standard star fields did not span an adequate colour
range. Moreover, the constraints of scheduled JKT observers
meant that often only two or three filters were available, and in a
variety of combinations. In view of this, we did not carry out
colour corrections for the JKT data. Colour-correction procedures,
such as those described above, can alter the magnitude by as much
as 0.1, with the U and B filters usually being the most sensitive to
this effect. However, since our SN 1998bu magnitudes were
obtained by averaging the values obtained relative to comparison
stars of different colour indices, we expect the error due to
inadequate colour correction to be small. Nevertheless, for such
cases, we have increased the uncertainty to ^0.075.
We then used the calibrated magnitudes of the comparison stars
(Table 1) to transform the colour-corrected differences from
equations (1) or (2) into apparent magnitudes for SN1998bu using
equations
Bsn � Bcs 2 Db
V sn � Vcs 2 Dv �3�Rsn � Rcs 2 Dr
Isn � Ics 2 Di:
Only a few U-band measurements were obtained. Moreover,
due to the lack of observations of standard stars in this band, we
had to indirectly calibrate the comparison stars. To achieve this,
we used average U-band magnitudes for these stars from Jha et al.
(1999) and Suntzeff et al. (1999). Given the larger uncertainties in
this procedure, we estimate a precision of no better than ^ 0.1 in
the U-band apparent magnitudes of SN1998bu.
Thus, at a given epoch and telescope, for each available
comparison star a set of magnitudes was calculated for SN
1998bu. The weighted mean magnitude in each band was then
obtained. These are listed in Table 2.
2.2 IR photometry
SN 1998bu yielded one of the earliest sets of near-IR photometry
ever obtained for a supernova. Indeed, this is the first time that IR
photometry for a normal type Ia event has been acquired before
tBmax. The earliest IR observation was by Mayya, Puerari & Kuhn
(1998), who acquired JHK photometry at 28.4 days using the
Observatorio Astronomico Nacional 2.1-m telescope (1CAMILA/
NICMOS 3 camera) at San Pedro Martir, Mexico. During the first
season of SN 1998bu observations, IR photometry was acquired at a
number of telescopes. Some of these data have been published in
Jha et al. (1999). Preliminary IR light curves were also displayed in
Meikle & Hernandez (2000). Here, we present a description of IR
photometry carried out at the 1.5-m Telescopio `Carlos Sanchez'
(TCS), Tenerife, the University of Hawaii 2.2-m Telescope
Table 1. Magnitudes of comparison stars near SN1998bu.
Star B V R I
CS1 13.607(18)a 13.092(10) 12.776(10) 12.481(13)CS2 15.559(40) 15.039(15) 14.712(22) 14.393(25)CS3 17.320(93) 16.509(30) 15.867(48) 15.277(55)CS4 16.410(42) 15.807(16) 15.369(25) 14.948(30)CS5 15.497(36) 14.898(12) 14.531(13) 14.180(18)
a Figures in brackets give the internal error of each magnitudeand are quoted in units of the magnitude's least significant digit.
The Type Ia Supernova 1998bu in M96 225
q 2000 RAS, MNRAS 319, 223±234
Dow
nloaded from https://academ
ic.oup.com/m
nras/article-abstract/319/1/223/1076457 by Rijksuniversiteit G
roningen user on 18 Decem
ber 2018

Table 2. Optical photometry of SN1998bu.
Julian Day Epocha U B V R I Telescope Observer(24500001) (d)
947.43 25.87 12.502(28)b 12.199(14) 11.848(16) 11.727(20) IAC80 A. Oscoz948.38 24.92 12.401(75) 11.808(75) JKT P. James948.43 24.87 12.403(28) 12.117(14) 11.818(15) 11.676(19) IAC80 A. Oscoz949.37 23.93 12.340(75) 11.760(75) JKT P. James949.40 23.90 11.99(20) 12.300(40) 12.070(30) 11.770(40) 11.660(50) NOT EXPORTc
950.41 22.89 11.99(20) 12.250(50) 11.770(50) 11.670(50) NOT EXPORT950.42 22.83 12.276(75) 11.727(75) JKT P. James951.37 21.93 12.260(75) 11.698(75) JKT P. James952.36 20.94 12.239(75) 11.704(75) JKT P. James953.37 10.07 12.239(75) 11.684(75) JKT P. James954.37 11.07 12.250(75) 11.682(75) JKT P. James955.36 12.06 12.265(75) 11.881(75) 11.713(75) 11.827(75) JKT M. Burleigh & S. Smartt956.40 13.10 12.326(75) 11.907(75) 11.721(75) 11.859(75) JKT M. Burleigh & S. Smartt957.39 14.09 12.20(10) 12.370(75) 11.960(75) 11.739(75) 11.905(75) JKT M. Burleigh & S. Smartt958.36 15.06 12.30(10) 12.329(75) 11.986(75) 11.809(75) 11.988(75) JKT M. Burleigh & S. Smartt958.38 15.08 12.423(16) 11.962(19) 11.777(20) 11.912(33) IAC80 E. Gonzalez959.40 16.10 12.41(10) 12.470(75) 11.989(75) 11.858(75) 12.055(75) JKT M. Burleigh & S. Smartt963.66 110.36 12.817(26) 12.298(12) 12.249(21) 12.287(30) WIYN D. Harmer964.39 111.09 12.880(75) 12.298(75) 12.261(75) 12.327(75) JKT R. Swaters965.66 112.36 12.920(35) 12.419(16) 12.350(24) 12.352(25) WIYN D. Harmer966.38 113.08 13.104(75) 12.448(75) 12.398(75) 12.398(75) JKT R. Swaters968.38 115.08 13.352(32) 12.558(19) 12.414(25) 12.332(26) IAC80 S. Kemp & P. Hammersley968.72 115.42 13.44(10) 13.367(27) 12.609(12) 12.481(16) 12.309(18) WIYN D. Harmer969.34 116.04 13.381(75) 12.644(75) 12.419(75) JKT D. James969.42 116.12 13.498(36) 12.616(20) 12.431(24) 12.284(25) IAC80 S. Kemp969.70 116.40 13.76(10) 13.480(31) 12.650(14) 12.480(15) 12.275(20) WIYN D. Harmer970.34 117.04 13.487(75) 12.719(75) 12.443(75) JKT D. James971.33 118.03 13.607(75) 12.784(75) 12.444(75) JKT D. James972.35 119.05 13.717(75) 12.834(75) 12.452(75) JKT D. James972.68 119.38 14.16(10) 13.821(28) 12.791(12) 12.489(17) 12.200(18) WIYN D. Harmer973.33 120.03 13.782(75) 12.888(75) 12.465(75) JKT D. James974.33 121.03 13.912(75) 12.958(75) 12.472(75) JKT D. James976.39 123.09 14.60(10) 14.218(75) 12.955(75) 12.494(75) 12.096(75) JKT J. Telting977.45 124.15 14.72(10) 14.316(76) 13.035(19) 12.532(24) 12.102(25) IAC80; U-JKT M. Rozas978.39 125.09 14.461(74) 13.055(18) 12.563(24) 12.077(27) IAC80 M. Rozas981.34 128.04 15.20(10) 14.649(75) 13.246(75) 12.101(75) JKT A. Fernandes983.39 130.09 15.22(10) 14.867(75) 13.461(75) 12.804(75) 12.184(75) JKT A. Fernandes985.35 132.05 14.885(75) 12.473(75) JKT D. Martinez & A. Aparicio985.40 132.10 15.039(50) 13.530(18) 12.899(25) 12.403(25) IAC80 E. Gonzalez & M. Zapatero-Osorio986.34 133.04 14.928(75) 12.473(75) JKT D. Martinez & A. Aparicio990.34 137.04 15.135(75) JKT D. Martinez & A. Aparicio997.40 144.10 15.286(68) 13.990(19) 13.578(20) 13.141(26) IAC80 A. Oscoz
1000.40 147.10 15.372(70) 14.097(21) 13.677(25) 13.292(28) IAC80 S. Kemp
a Relative to tBmax � 1998 May 19.8 UT.b Figures in brackets give the internal error of each magnitude and are quoted in units of the magnitude's least significant two digits.c EXtra-solar Planet Observational Research Team.
Table 3. IR photometry of SN1998bu.
Julian Day Epocha J H K Telescope Observer(24500001) (d)
949.40 23.8 11.55(3)b 11.59(3) 11.42(3) TCS EXPORT team950.40 22.8 11.68(3) 11.86(3) 11.44(3) TCS EXPORT team952.74 20.5 11.71(4) 11.88(4) 11.63(3) UKIRT A. Chrysostomou953.40 0.2 11.89(5) 11.95(5) 11.60(5) TCS P. Hammersley955.40 2.2 11.87(5) 11.83(5) 11.66(5) TCS P. Hammersley957.40 4.2 12.06(5) 11.88(5) 11.61(5) TCS P. Hammersley958.40 5.2 12.05(5) 11.96(5) 11.75(5) TCS P. Hammersley959.84 6.6 12.42(3) 11.97(3) 11.88(3) UKIRT T. Geballe970.35 17.2 ± 11.75(5) 11.84(4) WHT C. Benn976.77 23.6 13.08(1) 11.74(2) 11.92(2) UH2.2 W. Vacca
a Relative to tBmax � 1998 May 19.8 UT.b Figures in brackets give the internal error of each magnitude and are quoted in units of themagnitude's least significant digit.
226 M. Hernandez et al.
q 2000 RAS, MNRAS 319, 223±234
Dow
nloaded from https://academ
ic.oup.com/m
nras/article-abstract/319/1/223/1076457 by Rijksuniversiteit G
roningen user on 18 Decem
ber 2018
(UH2.2), Hawaii, the 3.8-m United Kingdom IR Telescope
(UKIRT), Hawaii, and the 4.2-m William Herschel Telescope
(WHT), La Palma. The data are presented in Table 3.
All the TCS data were taken with the CVF IR photometer. The
photometric system has been accurately characterized (Alonso,
Arribas & Martinez-Roger 1994) and is very similar to the UKIRT
system. For the four epochs in which the observations were carried
out, a 20-arcsec aperture and a chop throw of about 35 arcsec at
6.7 Hz were employed. Conditions were judged to be photometric
on all four nights, and the photometry accuracy was no worse than
^3 per cent. The data were reduced using the IAC data reduction
program tcsphot. Absolute calibration was by means of repeat
measurements of a sequence of standard stars at a range of
airmasses. The stars were BS3304, BS4039, BS4883, BS5384,
BS5423A and BS6538A. Error estimates are based on the
statistical error in the measurement of the supernova, together
with a smaller contribution from the measurement of the cali-
bration sources. TCS observations were also made on two
successive nights by the EXtra-solar Planet Observational
Research Team (EXPORT) during the 1998 international time of
the Canary Islands Observatories.
The UH2.2 observations were made with the QUIRC camera,
which contains a 1024 � 1024 HgCdTe array. The plate scale is
0.189 arsec pixel21. A seven-point dither pattern was used,
chopping to sky after each individual exposure. Sky frames and
flat-fields were made from these offset sky fields. The airmass
ranged between 1.2 and 1.3. The night was photometric, and
observations of the following standard stars were made to
compute the magnitudes: FS21, FS23, FS27 and FS35. The
magnitudes of the FS stars (as well as the additional stars in the
fields of FS23 and FS35) given by Hunt et al. (1998) were used for
transforming between instrumental and intrinsic magnitudes.
Instrumental magnitudes were computed using an aperture of
15 pixels in radius, with a background aperture of 20±30 pixels.
The seeing was typically 0.7±0.8 arcsec.
The UKIRT observations were made with the IRCAM3 camera
which uses a 256 � 256 InSb array. The plate scale was 0.286
arcsec pixel21, and the seeing was typically 1.5 arcsec. The WHT
observations were made with the WHIRCAM camera, which also
uses a 256 � 256 InSb array. The plate scale is 0.240 arcsec
pixel21, and the seeing was typically 0.8±0.9 arcsec. For both the
UKIRT and WHT observations a five-point dither pattern was
used. The data were reduced using the package ircamdr (Aspin
1996). Calibration of the UKIRT data was by means of the
standard stars HD 84800 (May 19) and FS20 (May 26), and the
WHT data by means of FS25. For the UKIRT and WHT images,
instrumental magnitudes were computed by increasing the
aperture size until the supernova-to-standard ratio converged to
a constant value (^1 per cent). This was usually attained for
aperture radii of 10±15 pixels.
2.3 Polarimetry
During the nights of 1998 May 15±17, UBVRI polarimetric
observations were taken of SN 1998bu using the Turpol instru-
ment, mounted on the 2.5-m Nordic Optical Telescope (NOT), La
Palma, Spain. The observations were carried out by members of
the EXPORT team, and data-reduction is discussed in detail in
Oudmaijer et al. (in preparation).
The light from the direction of SN 1998bu was relatively
strongly polarized (see Table 4). We wish to decide whether the
polarization is intrinsic to the source, due to Galactic dust
extinction, or extinction within M96 itself. Time-variability in the
polarization would have proven that it was intrinsic to the source,
but no variation was detected over the three nights. Field stars near
to M96 showed little degree of polarization. This is consistent
with the dust maps of Schlegel, Finkbeiner & Davis (1998), which
indicate that the extinction contribution from our Galaxy is small.
It appears, therefore, that most of the polarization must have been
produced within M96. This is important, since the polarization as
a function of wavelength behaved similarly to that seen for normal
interstellar polarization i.e., the data follow the Serkoswki model
(R. Oudmaijer, personal communication). This indicates that the
ISM of M96 is somewhat similar to that of the Milky Way. In
Section 3.3 we show that SN 1998bu is highly reddened, and that
most of this reddening probably arises from dust extinction within
M96. It therefore seems likely that observed polarization is
associated with interstellar material within M96.
2.4 Optical spectroscopy
Optical spectroscopy was acquired using the ISIS spectrograph of
the William Herschel Telescope (WHT), the IDS spectrograph of
the Isaac Newton Telescope (INT) and the Hydra spectrograph
of the Wisconsin-Indiana-Yale-NOAO Telescope (WIYN). The
log of observations is given in Table 5. The spectra were reduced
by means of the package figaro (Shortridge et al. 1995).
Debiasing and flat-fielding were carried out in the usual manner.
Wavelength calibration was by means of arc-lamp spectra, and the
uncertainty was typically less than ^1 AÊ . The spectra were
relatively fluxed by comparison with the flux standard Feige 34.
However, absolute fluxing was more difficult owing to variable
observing conditions which resulted in uncertain amounts of
vignetting of the target and standard by the slit. To correct for this
systematic error, we used the BVR magnitudes obtained from the
JKT images. Transmission functions for the B, V and R bands were
constructed by multiplying the JKT filter functions by the CCD
response and the standard La Palma atmospheric transmission
function. The relatively-fluxed spectra were then multiplied by the
net transmission functions, and the resulting total flux within each
band compared with JKT-derived magnitudes corresponding to the
same epochs. Thus, correction (scaling) factors were obtained for
each spectrum. Apart from the earliest spectrum (26.8 d), BVR
Table 4. Polarimetry of SN1998bu (EXPORT team).
Julian Day Epocha Band POL Error Posn. Angle Error(245 00001) (d) (%) (%) (deg) (deg)
949.40 23.90 U 1.227 0.076 186.3 1.8949.40 23.90 B 1.597 0.072 184.6 1.3949.40 23.90 V 1.695 0.105 179.1 1.8949.40 23.90 R 2.101 0.068 180.3 0.9949.40 23.90 I 1.871 0.145 173.4 2.2
950.41 22.89 U 1.091 0.075 184.2 2.0950.41 22.89 B 1.469 0.074 181.2 1.4950.41 22.89 V 1.842 0.101 177.8 1.6950.41 22.89 R 1.894 0.065 177.9 1.0950.41 22.89 I 1.788 0.107 174.5 1.7
951.40 21.90 U 1.222 0.079 182.3 1.9951.40 21.90 B 1.689 0.073 181.0 1.2951.40 21.90 V 1.757 0.108 178.6 1.8951.40 21.90 R 1.965 0.105 179.5 1.5951.40 21.90 I 1.668 0.129 176.5 2.2
a Relative to tBmax � 1998 May 19.8 UT.
The Type Ia Supernova 1998bu in M96 227
q 2000 RAS, MNRAS 319, 223±234
Dow
nloaded from https://academ
ic.oup.com/m
nras/article-abstract/319/1/223/1076457 by Rijksuniversiteit G
roningen user on 18 Decem
ber 2018

magnitudes corresponding to the spectroscopy epochs were
obtained either from actual simultaneous observations or by
interpolation within the JKT data. Fluxing of the 26.8 d spectrum
was less certain as it was obtained 2 days before the earliest JKT
photometry point. We therefore used photometry gleaned from the
IAU circulars and from Suntzeff et al. (1999) and Jha et al. (1999)
to estimate the BVR magnitudes at 26.8 d.
Scaling factors ranged from �0.83 to �2.23. The scaling factor
closest to unity (�0.94) was for the 23.8 d spectrum. This was
expected since the flux scale for this spectrum had already been
corrected using a low-resolution spectrum taken through a very
wide (7-arcsec) slit. For a given epoch, the scaling factors for each
band agreed to within ^5 per cent demonstrating good internal
consistency for the procedure. The relatively-fluxed spectra were
therefore multiplied by the geometric mean of the scaling factors
for each epoch. Including the uncertainty in the photometry, we
estimate that the fluxing accuracy is better than ^10 per cent,
except for 26.8 d where the error is probably closer to ^15 per
cent. The optical spectra are shown in Fig. 2. The 26.8 d spectrum
is the earliest reported for SN 1998bu.
2.5 IR spectroscopy
IR spectroscopy at UKIRT was obtained on 1998 June 24.2 UT
(135.5 d) using CGS4, its 40 line mm21 grating and a 0.61-arcsec
(1 pixel) wide slit (see Table 5). The spectra were sampled every 1/2
pixel; the resolution of the spectrometer was approximately 370
km s21 in the I and J bands, and 450 km s21 in the H band. During
the observations the telescope was nodded 7.5 arcsec along the slit.
The spectra were reduced using the standard procedures of the
package figaro, including optimal extraction (Horne 1986).
Wavelength calibration was by means of an arc spectrum, and is
judged to be accurate to better than 2 AÊ in the I and J bands, and
3 AÊ in the H-band. Relative fluxing was by comparison with
spectra of BS 4281 (I and J bands) and BS 4079 (H band). For BS
4281 (F5V) we assumed J � 15:845 and a temperature of
6540 K. For BS 4079 (F6V) we assumed J � 15:770 and a
temperature of 6450 K. Final absolute fluxing was achieved using
the composite J- and H-band light curves described in Section 3.2.2.
From these we obtain J � 113:18 ^ 0:10 and H � 112:24 ^
0:10 at the epoch of the IR spectra. Magnitudes were then derived
from the IR spectra using the combined filter passband plus
atmospheric transmission response functions provided on the
UKIRT web pages, together with the absolute spectrum of Vega.
On comparison with the light-curve-derived values, it was found
that the spectrum-derived magnitudes were too faint by factors of
�1.02 in J and �1.23 in H. The fluxes of the spectra were therefore
multiplied by these factors. The I-band spectrum overlapped the
J-band spectrum in the 10 000±11 000 AÊ region. We multiplied the
I-band flux by �1.14 to bring it into agreement with the J band. We
believe the final fluxing is accurate to ^15 per cent. The IR
spectrum is displayed in Fig. 3. It spans 8175±20 966 AÊ . (The short-
wavelength coverage of CGS4 now overlaps the typical long-
wavelength limit of optical spectrographs, providing access to the
poorly explored 0.9±1.0mm region.)
3 R E S U LT S
3.1 Spectra
3.1.1 Optical spectra
The optical spectra demonstrate that SN 1998bu was a spectro-
scopically normal, but highly reddened type Ia supernova. This is
Table 5. Log of optical and IR spectroscopy of SN1998bu.
Julian Day Date UTa Epochb Telescope/Instrument ll Dl c Observer(1245 0000) (1998) (d) (AÊ ) (AÊ )
946.40 May 12.90 26.8 WHT/ISIS 3590±9097 5.8 J. Iglesias-Paramo949.38 May 15.88 23.8 INT/IDS 3300±9072 13 P. Sorensend
951.40 May 17.90 21.8 INT/IDS 3300±9081 13 EXPORT952.40 May 18.90 20.8 INT/IDS 3207±9460 6.6 D. Pollacco964.72 May 31.22 111.5 WIYN/Hydra 3541±5573 4.0 P.S. Smith966.68 June 2.18 113.5 WIYN/Hydra 4910±10265 5.2 D. Willmarth972.40 June 7.90 119.2 INT/IDS 3602±9298 6.6 D. Pollacco988.75 June 24.25 135.5 UKIRT/CGS4 8175±20966 12.5 & 41 T. Geballe
a Start time for integrations on SN 1998bu.b Relative to tBmax � 1998 May 19.8 UT.c Spectral resolution. The Dl values for UKIRT/CGS4 are for 10 000 and 16 500 AÊ respectively.d Observations carried out during EXPORT telescope time.
Figure 2. Optical spectra of SN 1998bu taken at the WHT and INT (La
Palma) and the WIYN Telescope (Kitt Peak) (see Table 5 for details). The
spectra have not been corrected for redshift or reddening. The epochs are
with respect to tBmax � 1998 May 19:8 � 0 days. For clarity, the spectra
have been displaced vertically. The dotted lines on the left side indicate
zero flux for each of the spectra. For 119.2 d, zero flux is at the x-axis. The
lowest dotted line indicates zero flux for both the 111.5 d and 113.5 d
spectra. In general, the absolute fluxing is accurate to ^10 per cent. For
26.8 d, the uncertainty is closer to ^15 per cent.
228 M. Hernandez et al.
q 2000 RAS, MNRAS 319, 223±234
Dow
nloaded from https://academ
ic.oup.com/m
nras/article-abstract/319/1/223/1076457 by Rijksuniversiteit G
roningen user on 18 Decem
ber 2018

illustrated in Fig. 4, where we compare the spectra of SN 1998bu
at maximum light with those of the normal type Ia SNe 1981B
(Branch et al. 1983) and 1994D (Meikle et al. 1996). The three
spectra are quite similar. The main difference is due to the greater
reddening of SN 1998bu (see below). Redward of 5000 AÊ , SN
1998bu and SN 1981B have greater similarity, although the
calcium triplet absorption around 8250 AÊ is considerably deeper in
SN 1981B. At shorter wavelengths the fine structure of the SN
1998bu spectrum are generally closer in appearance to those of SN
1994D. Jha et al. (1999) pointed out the existence of an
unidentified absorption feature blueward of the Ca ii H and K
absorption, and suggested that it could be due to silicon or
calcium. This feature is clearly visible at ,3700 AÊ in all the SN
1998bu spectra up to tBmax, including the first spectrum at 26.8 d
(Fig. 2). The feature is not present in the maximum-light spectrum
of SN 1981B, but it is very strong in SN 1994D at the same epoch
(Fig. 4). However, later spectra [day 19 (Jha et al. 1999);
day 111.5 (this work)] show that the feature has weakened
considerably. By day 119.2 it has essentially vanished.
3.1.2 IR spectrum
The strong P Cygni feature at 8175±8700 AÊ is due to the calcium
triplet (Filippenko 1997). At ,10 000 AÊ there is a particularly
prominent, isolated feature. In the rest frame of the host galaxy the
feature peaks at 9950 ^ 150 �A; and has a FWHM equivalent to
,8000 km s21. If we interpret the trough to the blueward side as
being the absorption component of a P Cygni profile, then the
blueshift of the trough is 8170 ^ 570 km s21: P. HoÈflich (private
communication) suggests that this line can be identified with the
very strong Fe ii z4F4±b4G5 9,997.56-AÊ line. This line is predicted
in some of the model spectra of Wheeler et al. (1998). Between
10 000 and 12 000 AÊ , SN 1998bu exhibits the dramatic drop
responsible for the typical red J±H colour of type Ia events at this
time. Many of the other features in the IR spectrum are probably
due to singly and doubly ionized cobalt and iron (Bowers et al.
1997).
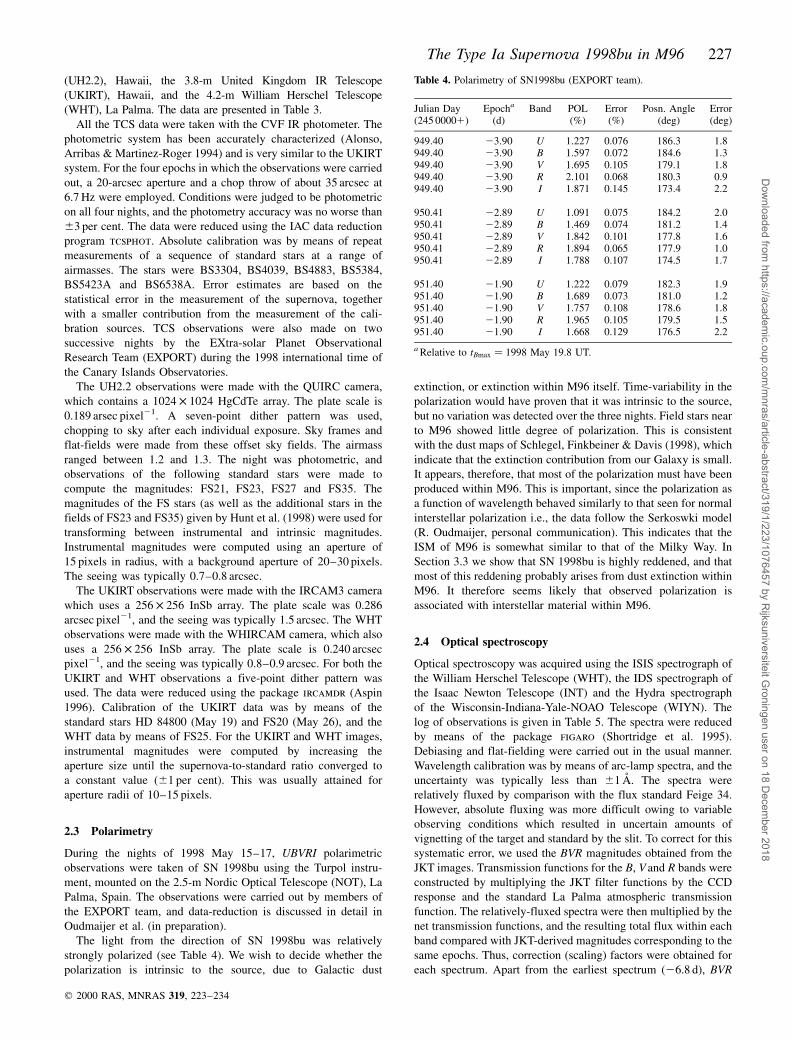
In Figs 5 and 6 we compare the IR spectrum of SN 1998bu with
those of other type Ia SNe over a range of epochs (Bowers et al.
1997). The spectrum nearest in epoch to the SN 1998bu 135.5 d
spectrum is the 140 d spectrum of SN 1992G. The two spectra are
similar. It can be seen that the prominent Fe ii feature at
,10 000 AÊ is quite common in early-time type Ia events, and
persists from as early as 120 days to as late as 160 days. How-
ever, by 192 days the feature appears to weaken. It could prove to
be a valuable line for the determination of both abundance and
velocity distribution (P. HoÈflich, private communication).
3.2 Light curves
3.2.1 Optical light curves
The optical photometry (Table 2) is plotted as light curves in
Fig. 7. The shapes of the light curves are typical for a normal type
Ia supernova, and agree with those presented by Suntzeff et al.
(1999) and Jha et al. (1999). The BRI magnitudes and epochs at
maximum light were estimated by fitting low-order polynomials.
In the V band, the light curve is not well sampled around
maximum. We therefore fitted the V template of Leibundgut
(1988) to find the epoch of maximum light in this band. The
values are shown in Table 6. Maximum light in the B band
occurred on May 19:8 ^ 0:5 days (UT), and we adopt this as the
fiducial tBmax � 0 days. Suntzeff et al. found tBmax to be on May
19:4 ^ 0:5 (UT), and Jha et al. obtained May 19:3 ^ 0:8 days.
Thus all three estimates agree to within the uncertainties.
From our B-band light curve we find the decline rate parameter
Dm15�B� � 1:06 ^ 0:05: This is consistent with the observed
values yielded by the B-band light curves of Suntzeff et al. (1999)
and Jha et al. (1999). Phillips et al. (1999) point out that the
decline rate is a weak function of extinction. In their equation (6)
Figure 3. IR spectrum of SN 1998bu taken at UKIRT at 135.5 days. The
epoch is with respect to tBmax � 1998 May 19.8 UT. The data have not
been corrected for redshift or reddening.
Figure 4. Illustration of the high degree of similarity in the optical spectra
of the type Ia Supernovae SNe 1981B, 1994D and 1998bu. The epochs are
all within about 1 day of tBmax. To aid the comparison the spectra have
been scaled and shifted vertically by arbitrary amounts, and have been
wavelength shifted to the local standard of rest for the respective
supernovae. Their zero flux axes are indicated by the dotted lines on the
left-hand axis. The SN 1981B spectrum is from Branch et al. (1983), and is
courtesy of B. Leibundgut and P. Nugent. The SN 1994D spectrum is from
Meikle et al. (1996).
The Type Ia Supernova 1998bu in M96 229
q 2000 RAS, MNRAS 319, 223±234
Dow
nloaded from https://academ
ic.oup.com/m
nras/article-abstract/319/1/223/1076457 by Rijksuniversiteit G
roningen user on 18 Decem
ber 2018
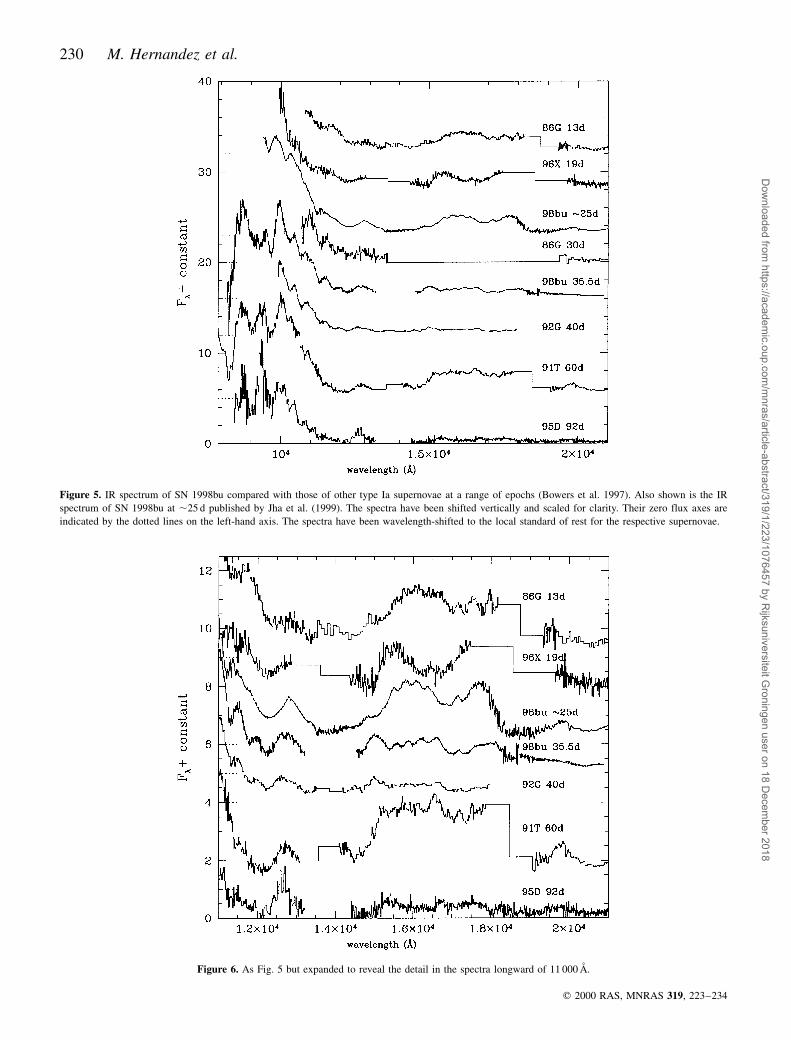
Figure 5. IR spectrum of SN 1998bu compared with those of other type Ia supernovae at a range of epochs (Bowers et al. 1997). Also shown is the IR
spectrum of SN 1998bu at ,25 d published by Jha et al. (1999). The spectra have been shifted vertically and scaled for clarity. Their zero flux axes are
indicated by the dotted lines on the left-hand axis. The spectra have been wavelength-shifted to the local standard of rest for the respective supernovae.
Figure 6. As Fig. 5 but expanded to reveal the detail in the spectra longward of 11 000 AÊ .
230 M. Hernandez et al.
q 2000 RAS, MNRAS 319, 223±234
Dow
nloaded from https://academ
ic.oup.com/m
nras/article-abstract/319/1/223/1076457 by Rijksuniversiteit G
roningen user on 18 Decem
ber 2018

they provide a correction relation, which we find yields a
correction of 10.03 for SN 1998bu (see also Section 3.3). We
therefore adopt Dm15�B� � 1:09 ^ 0:05:The VRI fluxes peaked at, respectively, 11:7 ^ 1:1 d; 10:3 ^
0:7 d and 23:0 ^ 0:7 d: This is consistent with Suntzeff et al.
(1999) who report maxima at 11:2 ^ 0:7; 10:6 ^ 0:7 and
23:4 ^ 1:1 days for VRI respectively, and with Jha et al. (1999)
who find the V-maximum to have occurred at 11:6 ^ 1:3 days.
This behaviour has been noted in other type Ia SNe such as SN
1990N and SN 1992A (Suntzeff 1993; Leibundgut 1998; Lira et
al. 1998). Clearly, this is not the behaviour of a simple cooling
blackbody, where the maximum would occur later at longer
wavelengths. That the photosphere is not a pure blackbody is
confirmed by the contemporary spectra (Fig. 2). We note that for
SN 1998bu the times between maxima in different bands do not
agree with the analysis of SN Ia light curves by Schlegel (1995).
He obtained tRmax 2 tImax � 11:6 d; tRmax 2 tVmax � 13:6 d and
tImax 2 tVmax � 12:0 d; while our results for SN 1998bu are 13.3,
21.4 and 24.7 d respectively. We also see a pronounced second
maximum in I at about 125 d, together with a corresponding
inflection in R. Again, this behaviour has been seen in other type
Ia SNe (e.g. Ford et al. 1993).
3.2.2 IR light curves
In Fig. 8 we show both the optical and IR light curves. The latter
were obtained by plotting our IR photometry (Table 3) together
with data from Mayya, Puerari & Kuhn (1998) and Jha et al.
(1999). These data constitute one of the most complete early-time
IR light curves obtained for a type Ia supernova. As mentioned
above, it is the first time that IR photometry for a normal type Ia
event has been acquired before tBmax. We find that the first
maximum in the IR light curves occurs at about 25 days. Thus
there is a trend in which the epochs of first maximum occur earlier
as we move from the R band through I and into the IR. We also
show in Fig. 8 the JHK template light curves of Elias et al. (1985).
(We have slightly truncated Elias et al.'s original templates so that
the earliest epoch of the template corresponds to Elias et al.'s
earliest observation.) The position of these templates were fixed
on the time axis, assuming that the fiducial time, t0 � 0; of Elias
et al. corresponds to 26.25 days. The IR light curves have been
shifted vertically to provide the best match to the data. A detailed
discussion of the IR light curves is given in Meikle (2000).
3.3 Extinction correction, absolute peak magnitudes and a
value for H0
SN 1998bu exhibited an unusually high degree of reddening. At
tBmax, B 2 V � 0:53 ^ 0:13; much redder than the typical B 2V < 0 of SNe Ia (Branch 1998). However, both the light curve
shapes and the spectral features of SN 1998bu are typical of a type
Ia event; this and the results of our polarimetry lead us to conclude
that SN 1998bu was indeed a normal type Ia supernova, but that it
was heavily reddened by dust. Estimation of the amount of
reddening is, however, a difficult issue. Several methods have
been considered.
One way is to use the relation between the equivalent width
(EW) of interstellar lines such as Na i D and the colour excess,
E�B 2 V� (Barbon et al. 1990). Recently, Munari & Zwitter
(1997) produced an improved determination of the relationship for
the Milky Way by measuring E�B 2 V� for 32 O- and B-type stars.
The spectra of SN 1998bu exhibit narrow Na i D absorption lines
in the rest frames of both the Milky Way and M96 (Munari et al.
1998). The EWs are, respectively, 0.19 and 0.35 AÊ . Centurion et al.
Figure 7. Optical light curves for SN 1998bu. For clarity, they have been
vertically displaced by the amounts indicated. The epoch of maximum blue
light, tBmax, corresponds to 1998 May 19.8 UT.
Table 6. Epochs and magnitudes at maximum light.
Julian Day Epocha Waveband Apparent Mag. Dereddened Mag. Absolute Mag.(12450000) (d)
953.3(0.5) 0.0 B 12.24(08)b 10.90(17)c 219.35(25)d
955.0(1.0) 11.7 V 11.88(10) 10.88(14) 219.37(23)953.6(0.5) 10.3 R 11.68(08) 10.93(11) 219.32(21)950.3(0.5) 23 I 11.66(08) 11.18(10) 219.07(21)948.0(2.0) 25 J 11.55(25) 11.27(25) 218.98(31)948.0(2.0) 25 H 11.60(25) 11.41(25) 218.84(31)948.0(2.0) 25 K 11.40(25) 11.29(25) 218.96(31)
a Relative to tBmax � 1998 May 19.8 UT.b Figures in brackets give the internal errors in units of the least significant two digits.c The error given in this column is the combination of the random photometric error and thesystematic error in the reddening correction.d The error given in this column is the combination of the random photometric error and thesystematic error in the distance and reddening correction.
The Type Ia Supernova 1998bu in M96 231
q 2000 RAS, MNRAS 319, 223±234
Dow
nloaded from https://academ
ic.oup.com/m
nras/article-abstract/319/1/223/1076457 by Rijksuniversiteit G
roningen user on 18 Decem
ber 2018

(1998) also reported single Na i lines in the Milky Way and M96.
With these data, and assuming that the Munari & Zwitter relation
is also valid in M96,1 we obtain a total colour excess (i.e.,
including Galactic reddening) for SN 1998bu of E�B 2 V� � 0:21;or AV � 0:65 assuming RV � 3:1: This is a significantly lower
value than that found by consideration of the SN colours (see
below). Moreover, Munari & Zwitter warn that the use of the Na i
D1 line to account for interstellar extinction is valid only when the
line can be modelled with a single Gaussian component. When
absorption is multicomponent, their relation provides an upper
limit only for E�B 2 V�: Thus, as was also pointed out by Suntzeff
et al. (1999), this is inconsistent with the SN-colour-derived
values.
A different procedure is that followed by Phillips et al. (1999).
They use a technique based on the fact that all type Ia events
show a very similar B 2 V evolution between 30 and 90 days after
V-maximum. For SN 1998bu, they find a total E�B 2 V� �0:355 ^ 0:030; or AV � 1:10 ^ 0:09 �RV � 3:1�: Another SN-
colour procedure is the Multicolour Light Curve Shape method,
developed by Riess et al. (1996). It is a multitemplate (BVRI)
method that uses a training set of well-studied SNe Ia to produce a
`standard SN Ia', and deviations from this fiducial event are
quantified as a function of changes in luminosity and extinction.
Application of this method by Jha et al. (1999) to SN 1998bu gives
a total E�B 2 V� � 0:30 or AV � 0:94; consistent with the value
obtained by Phillips et al.. Yet another SN-colour method has been
proposed by Krisciunas et al. (2000). They compared the V 2 IR
colours of SN 1998bu with those of less-reddened SNe Ia and
infer AV � 1:05 ^ 0:06; again consistent with Phillips et al.
One further approach is to compare SN 1998bu with SN 1981B.
As pointed out in Meikle & Hernandez (2000) and in Section 3.1.1
(above), the detailed optical spectral features of these two SNe Ia
around tBmax are very similar, especially redward of 5000 AÊ (see
Fig. 2). The major difference between the two events is the overall
spectral slope. We therefore assume that the supernovae are
intrinsically identical, and that the difference in slope is due to
extinction. We modified a SN 1981B spectrum taken at tBmax
(Branch et al. 1983) by simultaneously scaling the flux by
wavelength-dependent and wavelength-independent factors. The
behaviour of the wavelength-dependent factor is taken to be the
Cardelli, Clayton & Mathis (1989) extinction law. This procedure
was followed until a good match was obtained between the SN
1981B spectrum and one of SN 1998bu at 20.8 days. This was
achieved with a difference in AV between the two SNe Ia of DAV �0:60 ^ 0:06; or DE�B 2 V� � 0:19 ^ 0:02: Clearly, this repre-
sents a lower limit to the SN 1998bu extinction. The matched
spectra are shown in Fig. 9. It can be seen that there are some
differences between the individual spectral features, but that they
are generally quite small. However, as mentioned earlier, the
calcium triplet absorption is significantly deeper in SN 1981B.
Using their B 2 V evolution method, Phillips et al. (1999) give a
total E�B 2 V� � 0:13 ^ 0:03 for SN 1981B. Adding this to the
extinction difference between SNe 1981B and 1998bu, we obtain
for SN 1998bu E�B 2 V� � 0:32 ^ 0:04; or AV � 1:0 ^ 0:11; in
good agreement with the SN-colour-derived values described
above. We used this value with the Cardelli et al. law, RV � 3:1;and a distance modulus of 30:25 ^ 0:18 (see Introduction) to
determine the absolute intrinsic peak magnitudes. These are
shown in Table 6.
We find that SN 1998bu peaked at V � 219:37 ^ 0:23 (see
Table 6 for other bands). This is 0:26 ^ 0:30 and 0:05 ^ 0:32
fainter than the values found by, respectively, Suntzeff et al.
(1999) and Jha et al. (1999). Applying our values for the absolute
peak BVI magnitudes and reddening-corrected Dm15(B) to Phillips
et al.'s (1999) relations (17±19), we obtain H0 � 70:4 ^ 4:3km s21 Mpc21. Suntzeff et al. derive H0 � 63:9 ^ 2:2�int:�^3:5�ext:� km s21 Mpc21 from their SN 1998bu light curves. The
barely significant difference between our value and that of
Suntzeff et al. can be explained by the choices of extinction
correction and distance modulus.
4 S U M M A RY
We have presented first-season UBVRIJHK photometry and
UBVRI polarimetry of the nearby type Ia SN 1998bu. Also
presented are a set of optical spectra spanning t � 26:8 to 119.2
days plus a single IR spectrum at t � 135:5 days. The optical
light-curve shapes are typical of a normal type Ia supernova. In
addition, dereddening of the 20.8 day optical spectrum using the
standard Galactic extinction law (Cardelli et al. 1989) produces a
spectrum which is very similar to those of classic SNe Ia. This
suggests strongly that the very red colour of SN 1998bu is due to
extinction. It is also likely that the relatively strong polarization is
associated with grains within M96 along the line of sight. We
conclude that both the light-curve shapes and spectra indicate that
SN 1998bu is a normal type Ia supernova.
Figure 8. IR and optical light curves for SN 1998bu. For clarity, they have
been displaced vertically by arbitrary amounts. The IR photometry was
obtained at the OAN (Mayya, Puerari & Kuhn 1998), TCS, IRTF, UKIRT
and WHT telescopes. The optical light curves are as plotted in Fig. 7. Also
shown are template light curves in BV (Leibundgut 1988), RI (Schlegel
1995) and JHK (Elias et al. 1985). The BVRI templates were shifted in
both axes to give the best match to the data. The JHK templates were
shifted only vertically. Their horizontal position was fixed by the epoch of
tBmax as indicated in Elias et al. (see text).
1 Polarimetry results suggest that the ISM in M96 is similar to that of our
own Galaxy; see Section 2.3.
232 M. Hernandez et al.
q 2000 RAS, MNRAS 319, 223±234
Dow
nloaded from https://academ
ic.oup.com/m
nras/article-abstract/319/1/223/1076457 by Rijksuniversiteit G
roningen user on 18 Decem
ber 2018

The BVRI peak magnitudes we obtained are consistent with
those of Suntzeff et al. (1999) and Jha et al. (1999). We
dereddened the photometry using the Cardelli et al. law with
RV � 3:1 and AV derived from estimates of intrinsic SN Ia
colours. The absolute peak magnitudes were then found using a
distance modulus of 30:25 ^ 0:18: We find that SN 1998bu
peaked at V � 219:37 ^ 0:23 (see Table 6 for other bands). Our
results yield a value for the Hubble Constant of H0 � 70:4 ^
4:3 km s21 Mpc21:Combination of our IR photometry with those of Jha et al.
provides one of the most complete early-phase IR light curves for
a SN Ia published so far. In particular, SN 1998bu is the first
normal SN Ia for which good pre-tBmax IR coverage has been
obtained. It reveals that the JHK light curves peak about 5 days
earlier than in the B band. Secondary maxima are seen in the IJHK
bands, with a corresponding inflection in the R band. For further
details see Meikle (2000).
AC K N OW L E D G M E N T S
We are indebted to all those observers who contributed to this
work by giving up some of their telescope time. We are especially
grateful to NOAO WIYN Queue observers P. Smith, D. Willmarth
and D. Harmer. Our gratitude also goes to R. Barrena-Delgado for
his observations at IAC80. We thank D. Branch and N. Tanvir for
helpful comments. MH is supported by PPARC (UK) and TMR
(EU). MRB is supported by PPARC. This work was in part
supported by the Portuguese Foundation for Science and
Technology (grant PESO/P/PESO/1196/97).
The data provided by EXPORT were obtained during the 1998
International Time of the Canary Islands Observatories awarded to
EXPORT, with the observations and data reduction being carried
out by EXPORT members D. de Winter, F. Garzon, L. F. Miranda
and R. Oudmaijer.
The IAC80 and TCS are operated on the island of Tenerife by
the Spanish Observatorio del Teide of the Instituto de Astrofisica
de Canarias. UKIRT is operated by the Joint Astronomy Centre on
behalf of the UK Particle Physics and Astronomy Research
Council. The William Herschel, Isaac Newton and Jacobus
Kapteyn telescopes are operated on the island of La Palma by
the Isaac Newton Group in the Spanish Observatorio del Roque de
los Muchachos of the Instituto de Astrofisica de Canarias. The
WIYN Observatory is a joint facility of the University of
Wisconsin-Madison, Indiana University, Yale University, and the
National Optical Astronomy Observatories.
Figure 9. This illustrates the determination of the relative extinction to SNe 1981B and 1998bu. The solid and dotted lines show the optical spectra of SNe
1998bu and 1981B respectively. The dashed line shows the SN 1981B spectrum reddened by AV � 0:60 to match that of SN 1998bu, using the extinction law
of Cardelli et al. (1989), with RV � 3:1:
The Type Ia Supernova 1998bu in M96 233
q 2000 RAS, MNRAS 319, 223±234
Dow
nloaded from https://academ
ic.oup.com/m
nras/article-abstract/319/1/223/1076457 by Rijksuniversiteit G
roningen user on 18 Decem
ber 2018
R E F E R E N C E S
Alonso A., Arribas S., Martinez-Roger C., 1994, A&A, 282, 684
Aspin C., 1996, Starlink User Note 41.0
Ayani K., Nakatani F., Yamaoka H., 1998, IAU Circ. 6905
Barbon R., Benetti S., Rosino L., Cappellaro E., Turatto M., 1990, A&A,
237, 79
Boschini L., 1998, IAU Circ. 6902
Bowers E. J. C., Meikle W. P. S., Geballe T. R., Walton N. A., Pinto P. A.,
Dhillon V. S., Howell S. B., Harrop-Allin M. K., 1997, MNRAS, 290,
663
Branch D., 1998, ARA&A, 36, 17
Branch D., Lacy C. H., McCall M. L., Sutherland P. G., Uomoto A.,
Wheeler J. C., Wills B. J., 1983, ApJ, 270, 123
Cardelli J. A., Clayton G. C., Mathis J. S., 1989, ApJ, 345, 245
Casertano S., Mutchler M., 1998, WFPC2 Instrument Science Report 98-
02. STScI, Baltimore
Centurion M., Bonifacio P., Walton N., King D., 1998, IAU Circ. 6918
Elias J. H., Matthews K., Neugebauer G., Persson S. E., 1985, ApJ, 296,
379
Faranda C., Skiff B. A., 1998, IAU Circ. 6905,
Feldmeier J. J., Ciardullo R., Jacoby G. H., 1997, ApJ, 479, 231
Ferrarese L. et al., 2000, ApJ, 529, 745
Filippenko A. V., 1997, ARA&A, 35, 309
Ford C. H., Herbst W. R., Richmond M. W., Filippenko A. V., Baker M. L.,
Treffers R. R., Paik Y., Benson P. J., 1993, AJ, 106, 1101
Gibson B. et al., 2000, ApJ, 529, 723
Hamuy M., Phillips M. M., Suntzeff N. B., Schommer R. A., Maza J.,
Aviles R., 1996, AJ, 112, 239B
Hardie R. H., 1962, in Hiltner W. A., eds, Astronomical Techniques. Univ.
Chicago Press, Chicago, p. 178
Horne K., 1986, PASP, 98, 609
Hunt L. K., Mannucci F., Testi L., Migliorini S., Stanga R. M., Baffa C.,
Lisi F., Vanzi L., 1998, AJ, 115, 2594
Jha S. et al., 1999, ApJS, 125, 73
Krisciunas K., Hastings N. C., Loomis K., McMillan R., Rest A., Riess
A. G., Stubbs C., 2000, ApJ, 539, 658
Landolt A. U., 1992, AJ, 104, 340L
Leibundgut B., 1988, PhD thesis, Univ. Basel
Leibundgut B., 1998, in Labhardt L., Binggeli B., Buser R., eds,
Supernovae and Cosmology. Publ. Univ. Basel
Lira P. et al., 1998, AJ, 115, 234
Mayya Y. D., Puerari I., Kuhn O., 1998, IAU Circ. 6907
Meikle W. P. S. et al., 1996, MNRAS, 281, 263
Meikle P., Hernandez M., Fassia A., Iglesias J., 1998, IAU Circ. 6905
Meikle P., Hernandez M., 2000, J. Ital. Astron. Soc., in press, astro-ph/
9902056
Meikle W. P. S., 2000, MNRAS, 314, 782
Munari U., Zwitter T., 1997, A&A, 318, 269
Munari U., Barbon R., Tomasella L., Rejkuba M., 1998, IAU Circ. 6902
Nakano S., Aoki M., 1998, IAU Circ. 6899
Parodi B. R., Saha A., Sandage A., Tammann G. A., 2000, ApJ, 540, 634
Perlmutter S. et al., 1997, ApJ, 483, 565
Phillips M. M., Lira P., Suntzeff N. B., Schommer R. A., Hamuy M., Maza
J., 1999, AJ, 118, 1766
Riess A. G., Press W. H., Kirshner R. P., 1996, ApJ, 473, 88
Riess A. et al., 1999, AJ, 118, 2675
Schlegel E. M., 1995, AJ, 109, 2620
Schlegel P. J., Finkbeiner D. P., Davis M., 1998, ApJ, 500, 525
Shortridge K., Meatheringham S. J., Carter B. D., Ashley M. C. B., 1995,
Publ. Astron. Soc. Aust., 12, 244
Suntzeff N. B., 1993, in McCray R., Wang Z., eds, Proc. IAU Colloq. 145,
Supernovae and Supernova Remnants. Cambridge Univ. Press, Cam-
bridge, p. 41
Suntzeff N. B. et al., 1999, AJ, 117, 1175
Tanvir N. R., Shanks T., Ferguson H. C., Robinson D. R. T., 1995, Nat,
377, 27
Tanvir N. R., Ferguson H. C., Shanks T., 1999, MNRAS, 310, 175
Villi M., 1998, IAU Circ. 6899
Wheeler J. C., HoÈflich P., Harkness R. P., Spyromillio J., 1998, ApJ, 496,
908
This paper has been typeset from a TEX/LATEX file prepared by the author.
234 M. Hernandez et al.
q 2000 RAS, MNRAS 319, 223±234
Dow
nloaded from https://academ
ic.oup.com/m
nras/article-abstract/319/1/223/1076457 by Rijksuniversiteit G
roningen user on 18 Decem
ber 2018