AN E-LEARNING TUTORIAL FOR RADAR REMOTE SENSING … · AN E-LEARNING TUTORIAL FOR RADAR REMOTE...
5
AN E-LEARNING TUTORIAL FOR RADAR REMOTE SENSING WITH RAT G. Koenig a, *, M. Jaeger b , A. Reigber b , T. Weser a a Geodesy and Geoinformation Science, Technical University Berlin, H12, Strasse des 17. Juni 135, 10623 Berlin, Germany – [email protected], [email protected] b Computer Vision and Remote Sensing, Technical University Berlin, FR 3-1, Franklinstrasse 28/29, 10587 Berlin, Germany – (jaeger, anderl)@cs.tu-berlin.de Commission VI, WG VI/1 - VI/2 KEY WORDS: Content development, Assessments and Tests, Blended Learning ABSTRACT: E-Learning materials and courses are becoming increasingly established at German universities. One reason for this is that technical prerequisites for successful e-learning – such as private internet access – have improved considerably. Furthermore, cost has been a driving force for the increase in online professional education. At the Technical University Berlin (TU Berlin), the Departments of Geodesy and Computer Vision are engaged in online education, offering a tutorial for remote sensing. The tutorial, which is divided into several chapters that are accompanied by exercises and tests, allows for performance linked control. User actions and test results are recorded in a personal data file. This information is used to adjust the exercises and to guide students through the course depending on their knowledge. Techniques for processing radar images are a main focus of the tutorial. Hands-on exercises covering SAR (synthetic aperture radar) topics are introduced as practical work to improve the students` understanding of remote sensing algorithms. For this purpose, test data of several study areas are available, and are employed to convey practical experience in the use of radar tools developed at the TU Berlin. Communication between the students happens by means of a forum, where ideas and problems are discussed and solved collaboratively. RAT (Radar Tools) is a collection of tools for processing SAR remote sensing data, developed at the TU Berlin for ongoing research and education. Students are encouraged to actively participate in software development, adding new functionality to the SAR- toolbox. In practice, it has been observed that students are significantly more motivated when they realize that their work contributes to an ongoing, bigger project which is of general use. RAT is an ideal platform for experimentation and learning, as it is easy to extend and provides a convenient data handling framework. The development of RAT is motivated by the fact that modern remote sensing software systems like ERDAS IMAGINE or ENVI provide only basic SAR functionality. Advanced algorithms have to be implemented by each researcher independently. RAT aims to bring modern SAR algorithms to a wider user-base by simplifying the data handling and processing of complex SAR data. RAT can be run inside the free IDL virtual machine on various operating systems. * Corresponding author. 1. INTRODUCTION In 2003, an analysis of six learning programs developed at German universities was done by random sampling. The analysis determined that most e-learning initiatives do not tap into the full potential of the unique modes of presentation and communication available to online systems. In particular it was found that students’ diverse learning needs weren’t sufficiently accommodated (Schiewe 2003). This shortcomings could partially be corrected by the initiative "Neue Medien in der Bildung", an effort endowed with considerable funds from the German Ministry for Science and Culture of Lower Saxony and Federal Ministry of Education and Research (BMBF). Especially projects geoinformation.net (Quadt et all. 2004), Virtual Landscape (Katterfeld 2004), ELAN (Haig et all. 2004) Norddeutscher Methodenlehre-Baukasten (Bill et all. 2004), gimolus (Müller 2004) and FerGI (Schiewe et all. 2004) accelerated the progress in development of internet based learning modules. How well these projects can be sustained after government funding remains to be seen. Despite good technical advances, only few approaches which consider personalized instruction at an adaptive, appropriate pace are realized. In this paper the authors describe a tutorial for remote sensing, which is used for students’ education at the Technical University Berlin. 2. E-LEARNING APPROACH 2.1 General Objectives The central idea of the tutorial, which was initially developed at the Department of Photogrammetry, was to offer students learning material which allows individual navigation depending on respective previous knowledge and skills. The contents of a chapter must be offered in a manner that allows different ways of achieving the learning goal and gives access only to those materials that are relevant to the goal. If
Transcript of AN E-LEARNING TUTORIAL FOR RADAR REMOTE SENSING … · AN E-LEARNING TUTORIAL FOR RADAR REMOTE...

AN E-LEARNING TUTORIAL FOR RADAR REMOTE SENSING WITH RAT
G. Koenig a,*, M. Jaeger b, A. Reigber b, T. Weser a
a Geodesy and Geoinformation Science, Technical University Berlin, H12, Strasse des 17. Juni 135,
10623 Berlin, Germany – [email protected], [email protected] b Computer Vision and Remote Sensing, Technical University Berlin, FR 3-1, Franklinstrasse 28/29,
10587 Berlin, Germany – (jaeger, anderl)@cs.tu-berlin.de
Commission VI, WG VI/1 - VI/2
KEY WORDS: Content development, Assessments and Tests, Blended Learning ABSTRACT: E-Learning materials and courses are becoming increasingly established at German universities. One reason for this is that technical prerequisites for successful e-learning – such as private internet access – have improved considerably. Furthermore, cost has been a driving force for the increase in online professional education. At the Technical University Berlin (TU Berlin), the Departments of Geodesy and Computer Vision are engaged in online education, offering a tutorial for remote sensing.
The tutorial, which is divided into several chapters that are accompanied by exercises and tests, allows for performance linked control. User actions and test results are recorded in a personal data file. This information is used to adjust the exercises and to guide students through the course depending on their knowledge. Techniques for processing radar images are a main focus of the tutorial. Hands-on exercises covering SAR (synthetic aperture radar) topics are introduced as practical work to improve the students` understanding of remote sensing algorithms. For this purpose, test data of several study areas are available, and are employed to convey practical experience in the use of radar tools developed at the TU Berlin. Communication between the students happens by means of a forum, where ideas and problems are discussed and solved collaboratively.
RAT (Radar Tools) is a collection of tools for processing SAR remote sensing data, developed at the TU Berlin for ongoing research and education. Students are encouraged to actively participate in software development, adding new functionality to the SAR-toolbox. In practice, it has been observed that students are significantly more motivated when they realize that their work contributes to an ongoing, bigger project which is of general use. RAT is an ideal platform for experimentation and learning, as it is easy to extend and provides a convenient data handling framework.
The development of RAT is motivated by the fact that modern remote sensing software systems like ERDAS IMAGINE or ENVI provide only basic SAR functionality. Advanced algorithms have to be implemented by each researcher independently. RAT aims to bring modern SAR algorithms to a wider user-base by simplifying the data handling and processing of complex SAR data. RAT can be run inside the free IDL virtual machine on various operating systems.
* Corresponding author.
1. INTRODUCTION
In 2003, an analysis of six learning programs developed at German universities was done by random sampling. The analysis determined that most e-learning initiatives do not tap into the full potential of the unique modes of presentation and communication available to online systems. In particular it was found that students’ diverse learning needs weren’t sufficiently accommodated (Schiewe 2003).
This shortcomings could partially be corrected by the initiative "Neue Medien in der Bildung", an effort endowed with considerable funds from the German Ministry for Science and Culture of Lower Saxony and Federal Ministry of Education and Research (BMBF). Especially projects geoinformation.net (Quadt et all. 2004), Virtual Landscape (Katterfeld 2004), ELAN (Haig et all. 2004) Norddeutscher Methodenlehre-Baukasten (Bill et all. 2004), gimolus (Müller 2004) and FerGI (Schiewe et all. 2004) accelerated the progress in development of internet based learning modules.
How well these projects can be sustained after government funding remains to be seen. Despite good technical advances, only few approaches which consider personalized instruction at an adaptive, appropriate pace are realized.
In this paper the authors describe a tutorial for remote sensing, which is used for students’ education at the Technical University Berlin.
2. E-LEARNING APPROACH
2.1 General Objectives
The central idea of the tutorial, which was initially developed at the Department of Photogrammetry, was to offer students learning material which allows individual navigation depending on respective previous knowledge and skills. The contents of a chapter must be offered in a manner that allows different ways of achieving the learning goal and gives access only to those materials that are relevant to the goal. If

for an average student, for example, five pages are required to understand, the subject will have to be explained in more detail for students with less knowledge, while advanced students could complete the chapter in three steps. This modular conception requires the linking of the pages to be adaptive, which implies a separation of content and links.
This central idea requires the development of small segmented learning modules, each tailored for a certain level of difficulty. Moreover, it is necessary to continuously measure and verify students’ knowledge level. This is the only means to control the operation sequence. 2.2 Database concept for realization
To attain this goal, the information needed must be stored in a database. Figure 1 gives an overview of the tables necessary for realization. Yellow tables refer to user administration, while green tables correspond to content maintenance.
Figure 1. Database tables overview.
MySQL, the popular Open Source alternative, is used as the database management system. Database access and tutorial guidance are programmed in Java using Java Server Pages or servlet technology. For more detailed information, see the paper published for the ISPRS congress in Istanbul (Koenig, Weser 2004). 2.3 Controlling navigation
As mentioned earlier, acquiring information on an individual progress is a prerequisite for adapting the training course to the student's skills. The sequence of actions is controlled by tests, which need to be analysed carefully. As a measure affecting the workflow, the weighted ratio of correctly answered questions in relation to all answered questions is calculated. This weighted performance factor is determined after every test and is stored in the user database. The student is guided through the lecture based on this performance factor.
Test questions are also assigned different ratings. Differentiating between easy, moderate and difficult questions allows for a more precise determination of the learners knowledge, and for a better guidance through the training course.
Depending on his or her knowledge, the student is assigned to one of three classes: beginner, intermediate, advanced. The system allows for a student to answer questions of different levels of difficulty. Two indices, set by the course author, determine the probability of how the questions are
distributed. As illustrated in Figure 2, advanced students could expect 20% questions to be easy, 30% to be medium and 50% to be difficult, whereas a beginner can expect a ratio 50:40:10. The final assignment is handled by a random number in the interval [0,100]. Assuming that 61 is selected randomly advanced students have to answer a difficult question, beginner and average students a medium one.
Figure 2. Indices (30, 70) and a random number
(61) influence the decision about the questions to put.
This approach allows a faster jump to another class and a more sophisticated adjustment to the learner's knowledge. 2.4 Question Pool
Another idea in this tutorial is to implement a pool of questions, which allows an individual selection. The main advantage of this approach is that in case of retaking a test, the same questions are not asked again. Figure 3 shows how, at a specific moment, only a limited part of the pool of questions can be chosen. The relevant questions, determined by the chapter in use, limited to the appropriate level of difficulty and reduced by the questions already asked, are ascertained by the information in the database.
Figure 3. Question database
2.5 General Workflow
Figure 4 illustrates the general workflow of the tutorial in form of a closed loop. If a student decides to participate in the radar remote sensing course, he is requested to login. New users are asked to register. After the initial authentication, the level of existing knowledge is determined by solving questions on a multiple choice basis. This gives the system the ability to relate the user to one of the three classes described earlier.
The student may then select a chapter of interest and proceeds to work through the pages covering the topic. Each chapter is divided into several lessons or sub-chapters, which

are themselves divided into several pages illustrating the logical context, forming a hierarchical tree structure.
Small tasks must be solved in the process of going through the lessons. These include simple multiple choice questions, but also hands-on exercises based on integrated examples. Data sets are available for download as well as a software toolbox, which is necessary for radar image processing. Simple questions are evaluated automatically, while the solutions to more complex exercises must be sent to a tutor, who checks the result and provides comments and advice if the solution is not satisfactory.
When questions are answered incorrectly, the system gives expert's advice to find the correct solution. These pre-tests have no influence on learners' assessment, but control the sequences of learning modules.
Figure 4. Course loop
After completing the main chapters, new tests follow to determine the participants’ marking. The more tests the user has fulfilled, the more precise the personal assessment of his knowledge will be.
At the end of the tutorial, students must pass a final test, in which a representative selection of all questions covering remote sensing topics is chosen from the question database 2.6 Content
At the time of writing, the course covers a number of topics in Remote Sensing. Chapters contain information about the physical principles, analogue and digital data acquisition techniques, sensor platforms (aerial photography, scanner and radar systems) as well as information about how and where Remote Sensing imagery can be obtained. Special attention is paid to online catalogues maintained by the different data suppliers. Data analysis methods, such as visual interpretation, photogrammetric and digital image processing, form another main focus of the tutorial. Finally, a brief overview of applications in several fields is given.
Section 3 of this paper discusses the integration and functionality of a software tool developed for radar remote sensing tasks in more detail. 2.7 Design Aspects
The tutorial must be clear and self-explanatory to the course participants. An unambiguous screen design is an important
requirement for successful learning. Therefore, the screen is divided into different sections (see Figure 5). The right frame includes the table of contents. Its appearance varies depending on the selected chapter and is modified dynamically as the student moves from one chapter to another. Coloured highlighting is used for emphasis and allows for easy orientation and for discerning the lessons already completed at first glance.
Other information and navigation tools which influence the sequence of the program are available at the bottom of the frame. Arrow buttons for scrolling to previous or following pages are also part of this frame.
Figure 5. Radar page – example
3. RADAR TOOLBOX (RAT)
3.1 Integration of radar image processing software
In the current summer term, the tutorial is used as a platform for the course in radar remote sensing. Learning material discussed during the lectures is integrated in the training course. The tutorial is not yet complete, especially implementation of multimedia-based content is still in development. Hands-on exercises are added to the lectures, to be solved using a software tool (RAT) developed by the Computer Vision group. The present chapter will give an overview of the current development status of RAT. 3.2 Radar Toolbox (RAT)
RAT (Radar Toolbox) is a collection of tools for advanced image processing of SAR remote sensing data, originally started as a student’s project and under development ever since. The main motivation for RAT is to provide an experimental platform for advanced SAR image processing. Licensed as open-source software, the complete source-code is available to anyone who is interested in adding their own algorithms. RAT can be downloaded and used free of charge. This makes it an ideal tool for student exercises, since the source code can be modified, corrected and even used in other projects. The programming interface of RAT is kept simple, such that adding new functionality is quite easy. Function templates and a step by step description of how to program a RAT module are part of the distribution package.
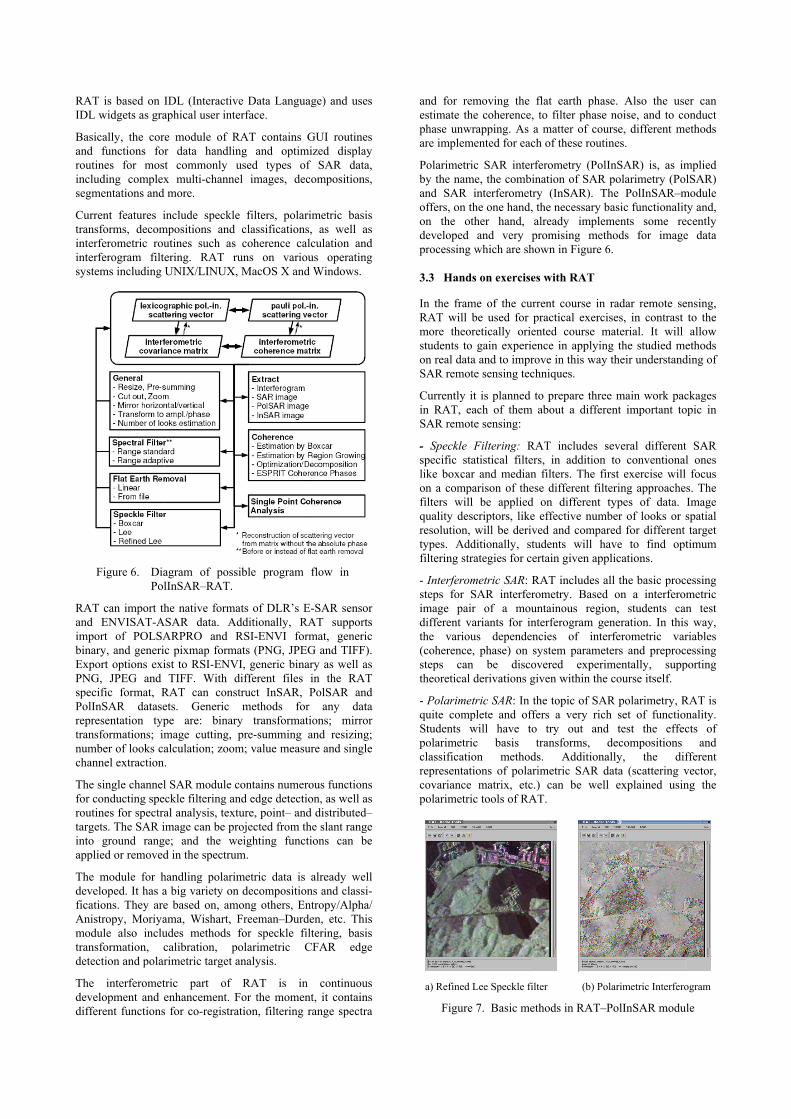
RAT is based on IDL (Interactive Data Language) and uses IDL widgets as graphical user interface.
Basically, the core module of RAT contains GUI routines and functions for data handling and optimized display routines for most commonly used types of SAR data, including complex multi-channel images, decompositions, segmentations and more.
Current features include speckle filters, polarimetric basis transforms, decompositions and classifications, as well as interferometric routines such as coherence calculation and interferogram filtering. RAT runs on various operating systems including UNIX/LINUX, MacOS X and Windows.
Figure 6. Diagram of possible program flow in
PolInSAR–RAT.
RAT can import the native formats of DLR’s E-SAR sensor and ENVISAT-ASAR data. Additionally, RAT supports import of POLSARPRO and RSI-ENVI format, generic binary, and generic pixmap formats (PNG, JPEG and TIFF). Export options exist to RSI-ENVI, generic binary as well as PNG, JPEG and TIFF. With different files in the RAT specific format, RAT can construct InSAR, PolSAR and PolInSAR datasets. Generic methods for any data representation type are: binary transformations; mirror transformations; image cutting, pre-summing and resizing; number of looks calculation; zoom; value measure and single channel extraction.
The single channel SAR module contains numerous functions for conducting speckle filtering and edge detection, as well as routines for spectral analysis, texture, point– and distributed– targets. The SAR image can be projected from the slant range into ground range; and the weighting functions can be applied or removed in the spectrum.
The module for handling polarimetric data is already well developed. It has a big variety on decompositions and classi- fications. They are based on, among others, Entropy/Alpha/ Anistropy, Moriyama, Wishart, Freeman–Durden, etc. This module also includes methods for speckle filtering, basis transformation, calibration, polarimetric CFAR edge detection and polarimetric target analysis.
The interferometric part of RAT is in continuous development and enhancement. For the moment, it contains different functions for co-registration, filtering range spectra
and for removing the flat earth phase. Also the user can estimate the coherence, to filter phase noise, and to conduct phase unwrapping. As a matter of course, different methods are implemented for each of these routines.
Polarimetric SAR interferometry (PolInSAR) is, as implied by the name, the combination of SAR polarimetry (PolSAR) and SAR interferometry (InSAR). The PolInSAR–module offers, on the one hand, the necessary basic functionality and, on the other hand, already implements some recently developed and very promising methods for image data processing which are shown in Figure 6. 3.3 Hands on exercises with RAT
In the frame of the current course in radar remote sensing, RAT will be used for practical exercises, in contrast to the more theoretically oriented course material. It will allow students to gain experience in applying the studied methods on real data and to improve in this way their understanding of SAR remote sensing techniques.
Currently it is planned to prepare three main work packages in RAT, each of them about a different important topic in SAR remote sensing:
- Speckle Filtering: RAT includes several different SAR specific statistical filters, in addition to conventional ones like boxcar and median filters. The first exercise will focus on a comparison of these different filtering approaches. The filters will be applied on different types of data. Image quality descriptors, like effective number of looks or spatial resolution, will be derived and compared for different target types. Additionally, students will have to find optimum filtering strategies for certain given applications.
- Interferometric SAR: RAT includes all the basic processing steps for SAR interferometry. Based on a interferometric image pair of a mountainous region, students can test different variants for interferogram generation. In this way, the various dependencies of interferometric variables (coherence, phase) on system parameters and preprocessing steps can be discovered experimentally, supporting theoretical derivations given within the course itself.
- Polarimetric SAR: In the topic of SAR polarimetry, RAT is quite complete and offers a very rich set of functionality. Students will have to try out and test the effects of polarimetric basis transforms, decompositions and classification methods. Additionally, the different representations of polarimetric SAR data (scattering vector, covariance matrix, etc.) can be well explained using the polarimetric tools of RAT.
a) Refined Lee Speckle filter (b) Polarimetric Interferogram
Figure 7. Basic methods in RAT–PolInSAR module

For all work packages, students will have to prepare a brief elaboration, including answers to some specific questions concerning the experimental part with RAT. The elaboration has to be submitted via Email to the lectures and will be corrected and returned. 3.4 Forum
Besides personal support and e-mail, the students may contact the lecturers as well as discuss with other students via a web-forum (Figure 8). Forum communication has the advantage that it can be read by everybody, i.e. it helps avoiding multiple answers to the same question and offers a kind of database of already discussed topics.
In addition, the forum contains a section about RAT, dedicated for bug reports and questions related to programming issues in RAT itself. This section has no connection to the course material, but helps improving the RAT framework and people who would like to extend RAT on their own.
Figure 8. RAT Forum
4. CONCLUSIONS AND OUTLOOK
The authors proposed a tutorial for remote sensing, including a database system for supplying test questions to students based on their ability. Students are assigned one of three levels - low, moderate and high - based on answers given in an initial test. The questions they are supplied with are then individually tailored to suit their ability. As this knowledge increases, so does the difficulty of the questions.
Moreover, the content itself is administered by a database, which allows first steps to be adapted to the individual knowledge of the students. Pages constituting the chapters are offered to the learner depending on his or her knowledge. This means that a beginner is guided through the course gradually and in easy steps, while advanced students are presented with more condensed material and will not necessarily be burdened with annoyingly basic pages and questions.
There is still much work to do, research and development is ongoing. Future activities will concern administration tools for facilitating the deployment of content in the database.
Also, the short supply of questions has to be extended to form a comprehensive question pool. And of course, even more interactive multimedia applications need to be integrated.
Up to now, the Web-based information is produced in German. The start of the new Masters course “Geodesy and Geoinformation Science” at the TU Berlin in winter 2005 requires the translation into English, which will make the course open for other students around the world.
We are open for discussion, cooperation and data exchange with other groups engaged in the development of e-learning material, and invite interested parties to have a look at the tutorial: http://www.fpk.tu-berlin.de/fern
REFERENCES
Bill, R., Zehner, M. L. Interactive Learning Module on Spatial Visualisation of Statistical Data. In: The International Archives of the Photogrammetry, Remote Sensing and Spatial Information Sciences, Vol. XXXV, Part B6, pp. 163-167. Haig, J., Wiggenhagen, M., Heipke, C. eLearning, Bringing Photogrammetry onto the Internet and Integrating it with Already Existing Courses. In: The International Archives of the Photogrammetry, Remote Sensing and Spatial Infor-mation Sciences, Vol. XXXV, Part B6, pp. 223-227. Katterfeld, C., Sester M. 2004. Desktop Virtual Reality in E-Learning Environments. In: The International Archives of the Photogrammetry, Remote Sensing and Spatial Informa-tion Sciences, Vol. XXXV, Part B6, pp. 154-159. Koenig, G., Weser T. 2004. A Servlet Based Training Course for Remote Sensing. In: The International Archives of the Photogrammetry, Remote Sensing and Spatial Information Sciences, Vol. XXXV, Part B6, pp. 139-144. Müller, M., 2004: gimolus – GIS- und modellgestützte Lernmodule für umweltwissenschaftliche Studiengänge. In: Plümer, L., Asche, H. (Hrsg.): Geoinformation - Neue Me-dien für eine neue Disziplin. Heidelberg, S. 155-166. Reigber, A., Hellwich, O. 2004. RAT (Radar Tools): A free SAR image analysis software package. In: Proceedings of EUSAR’04, pp. 997–1000. Quadt U., Plümer, L., Kolbe, T.,H., Steinrücken, J., 2004. Blended Learning mit geoinformation.net – Eine Plattform für die multimedia-gestützte Präsenzlehre. In: Schiewe, J. (Hrsg.): E-Learning in Geoinformatik und Fernerkundung. Heidelberg, S. 11-20. Schiewe, J., 2003: eLearning Angebote in Geoinformatik und Fernerkundung: Mehrwert oder Mode-Erscheinung?. In: Seyfert, E. (Hrsg.): Auf dem Weg zu operationellen Prozess-ketten in Photogrammetrie, Fernerkundung und Geo-information. PFG - Publikationen der DGPF, 12: S. 53-60. Schiewe, J., Ehlers, M., Grendus, B., 2004. Fernstudien-materialien Geoinformatik (FerGI) – Konzeption und erste Implementierungsbeispiele. In: Plümer, L., Asche, H. (Hrsg.): Geoinformation – Neue Medien für eine neue Disziplin. Heidelberg, S. 143-154. References from websites: (June 2005)
RAT Website: http://www.cv.tu-berlin.de/rat Tutorial: http://www.fpk.tu-berlin.de/fern