An Australian gold miner for global investors › wp-content › uploads › 2017 › 03 ›...
25
An Australian gold miner – for global investors Bank of America Merrill Lynch Exploration Investor Day - March 2017
Transcript of An Australian gold miner for global investors › wp-content › uploads › 2017 › 03 ›...
An Australian gold miner – for global investorsBank of America Merrill Lynch Exploration Investor Day - March 2017
Disclaimer
Competent Persons Statements
The information in this announcement that relates to mineral resource estimations, exploration results, data quality and geological interpretations for the Company’s Paulsens and Jundee Project areas is based on information compiled by Brook Ekers, a
Competent Person who is a Member of the Australian Institute of Geoscientists and a full-time employee of Northern Star Resources Limited. Mr Ekers has sufficient experience that is relevant to the style of mineralisation and type of deposit under
consideration and to the activity being undertaken to qualify as a Competent Person as defined in the 2012 Edition of the "Australasian Code for Reporting of Exploration Results, Mineral Resources and Ore Reserves" for the Group reporting. Mr Ekers
consents to the inclusion in this announcement of the matters based on this information in the form and context in which it appears.
The information in this announcement that relates to mineral resource estimations, exploration results, data quality and geological interpretations for the Company’s Kanowna, EKJV, Kundana and Carbine Project areas is based on information compiled
by Nicholas Jolly, a Competent Person who is a Member of the Australian Institute of Mining and Metallurgy and a full-time employee of Northern Star Resources Limited. Mr Jolly has sufficient experience that is relevant to the style of mineralisation and
type of deposit under consideration and to the activity being undertaken to qualify as a Competent Person as defined in the 2012 Edition of the "Australasian Code for Reporting of Exploration Results, Mineral Resources and Ore Reserves". Mr Jolly
consents to the inclusion in this announcement of the matters based on this information in the form and context in which it appears.
Forward Looking Statements
Northern Star Resources Limited has prepared this announcement based on information available to it. No representation or warranty, express or implied, is made as to the fairness, accuracy, completeness or correctness of the information, opinions
and conclusions contained in this announcement. To the maximum extent permitted by law, none of Northern Star Resources Limited, its directors, employees or agents, advisers, nor any other person accepts any liability, including, without limitation,
any liability arising from fault or negligence on the part of any of them or any other person, for any loss arising from the use of this announcement or its contents or otherwise arising in connection with it.
This announcement is not an offer, invitation, solicitation or other recommendation with respect to the subscription for, purchase or sale of any security, and neither this announcement nor anything in it shall form the basis of any contract or commitment
whatsoever. This announcement may contain forward looking statements that are subject to risk factors associated with gold exploration, mining and production businesses. It is believed that the expectations reflected in these statements are reasonable
but they may be affected by a variety of variables and changes in underlying assumptions which could cause actual results or trends to differ materially, including but not limited to price fluctuations, actual demand, currency fluctuations, drilling and
production results, Reserve estimations, loss of market, industry competition, environmental risks, physical risks, legislative, fiscal and regulatory changes, economic and financial market conditions in various countries and regions, political risks, project
delay or advancement, approvals and cost estimates.
All currency conversions in this presentation have been converted at a currency of AUD/USD conversion rate of A$0.75.
[a] Key highlights presented in the table on page 9 are inclusive of Plutonic operations results for the period ended 31 December 2016 and 31 December 2015.
(1) EBITDA is earnings before interest depreciation, amortisation and impairment and is calculated as follows: Profit before Income tax plus depreciation, amortisation, impairment and finance costs less interest income.
(2) Free Cash Flow is calculated as operating cash flow minus investing cash flow.
(3) Underlying Free Cash Flow is calculated as follows: 31 Dec 2016 - free cash flow ($12.8 million) plus bullion awaiting settlement ($10.6 million), plus stamp duty paid on prior acquisitions ($1.7 million), plus investments in Available for sale assets ($0.8 million), plus FY2016 tax ($33.6
million), less working capital adjustment ($3.4 million). 31 Dec 2015 - free cash flow ($66.4 million) plus bullion awaiting settlement ($9 million), plus acquisition and exploration of Central Tanami Project ($17.3 million), plus stamp duty paid on prior period acquisitions ($5.0 million), less
working capital adjustment ($1.0 million).
EBITDA, Underlying Free Cash Flow and All-in Sustaining Costs (AISC) are unaudited non IFRS measures.
* Source: Bloomberg. All N.A. data points, streaming companies and erroneous data has been removed from the analysis
2
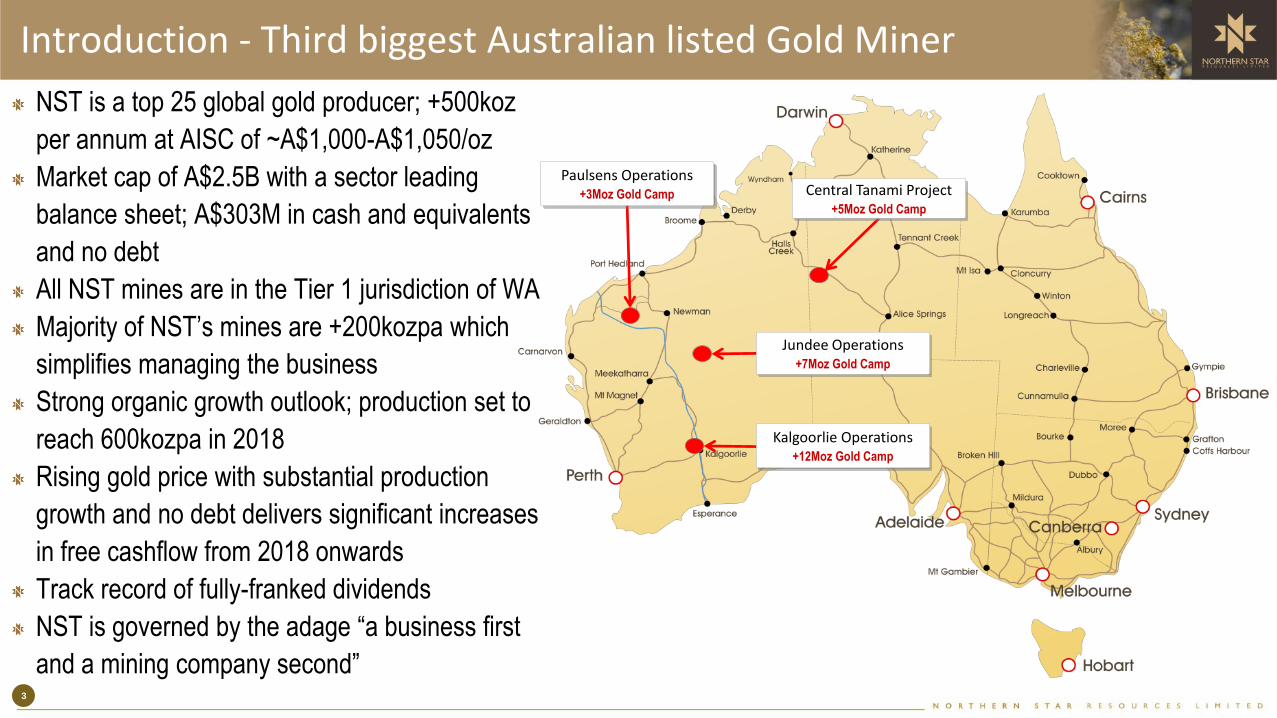
NST is a top 25 global gold producer; +500koz
per annum at AISC of ~A$1,000-A$1,050/oz
Market cap of A$2.5B with a sector leading
balance sheet; A$303M in cash and equivalents
and no debt
All NST mines are in the Tier 1 jurisdiction of WA
Majority of NST’s mines are +200kozpa which
simplifies managing the business
Strong organic growth outlook; production set to
reach 600kozpa in 2018
Rising gold price with substantial production
growth and no debt delivers significant increases
in free cashflow from 2018 onwards
Track record of fully-franked dividends
NST is governed by the adage “a business first
and a mining company second”
Introduction - Third biggest Australian listed Gold Miner
Jundee Operations+7Moz Gold Camp
Paulsens Operations+3Moz Gold Camp
Kalgoorlie Operations+12Moz Gold Camp
Central Tanami Project+5Moz Gold Camp
3

10%
-25%
-15%
-5%
5%
15%FCF Yield to Enterprise Value
$39$48 $51 $52 $53
$58 $62
$85
$105
North American producer peer setNST
30%
-45%
-35%
-25%
-15%
-5%
5%
15%
25%
35% 5 Year Return on Equity (%)27%
-35%
-25%
-15%
-5%
5%
15%
25%
35% 5 Year Average Return on Invested Capital (%)
NST is uniquely positioned to continue to deliver above average returns to its Shareholders
A business first, mining is how NST delivers value
5yr Peer Average -2.8%
Sector Average 0.5%
Consistently generating returns to Shareholders
Low Corporate overheads vs US Peers
US Peer Median US$56/oz
Source: Bloomberg
Source: Bloomberg
Corporate Overhead Per Ounce
5yr Peer Average -3%
Source: Bloomberg
Efficiently allocating Shareholders’ capital
Source: Goldman Sachs
Organic growth with increasing free cash generation4

2016 - Another standout year
Net Profit after Tax up
61% to A$104.6M
Key Half Year Financial Outcomes
Key FY2016 Operational Outcomes
5
Total Reserves grew
by 33% to 2Moz Reserve conversion
cost of A$50/oz
2016 dividends increased; paid A10¢ per share, up 100% on 2015
Resources increased
to 9.25Moz
Earnings per share
up 60% to A17.4¢A$303M Cash &
Equivalents; No Debt

$25.4
$62.3
$148.3$165.6
$180.6
$216.4 $218.8
50
100
150
200
250
1H14 2H14 1H15 2H15 1H16 2H16 1H17
A$
(m
)
EBITDA
35%
28%
36% 38%42%
47%53%
0%
10%
20%
30%
40%
50%
60%
1H14 2H14 1H15 2H15 1H16 2H16 1H17
EBITDA Margin
Financial Highlights for First Half FY2017
6
EBITDA is up 21% EBITDA margins are up 24%
NST has been able to grow earnings, profit margins and payouts to Shareholders consistently for years
2.5
1.0
2.5 2.0
3.0 3.0
4.0
3.0*
0
1
2
3
4
5
6
7
8
1H14 2H14 1H15 2H15 1H16 2H16 1H17A
$cp
s
Dividends per Share
* During the 1H FY2017 NST divested the Plutonic operation and paid a A3¢ special dividend.
Since 2014 NST has been able to increase
dividends as earnings grow
$7.6$14.3
$36.4
$55.5$65.1
$86.3
$104.6
20
40
60
80
100
120
1H14 2H14 1H15 2H15 1H16 2H16 1H17
A$
(m)
Net Profit After Tax
NPAT up 61% in 1H17
to a record A$104.6m
$0
$2
$4
$6
$8
$10
$12
$14
$16
NST Actual 6x EV/EBITDA 9.6x EV/EBITDA
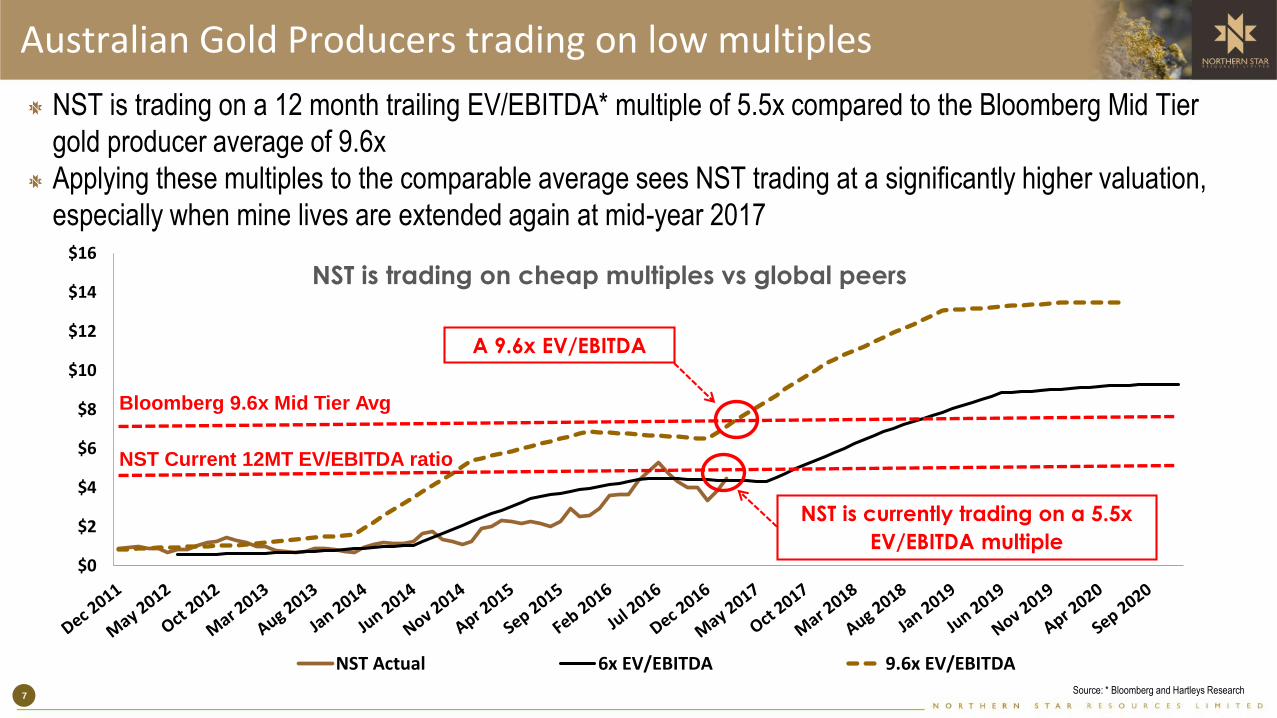
Australian Gold Producers trading on low multiples
NST is trading on a 12 month trailing EV/EBITDA* multiple of 5.5x compared to the Bloomberg Mid Tier
gold producer average of 9.6x
Applying these multiples to the comparable average sees NST trading at a significantly higher valuation,
especially when mine lives are extended again at mid-year 2017
7Source: * Bloomberg and Hartleys Research
NST is trading on cheap multiples vs global peers
A 9.6x EV/EBITDA
Bloomberg 9.6x Mid Tier Avg
NST Current 12MT EV/EBITDA ratio
NST is currently trading on a 5.5x
EV/EBITDA multiple
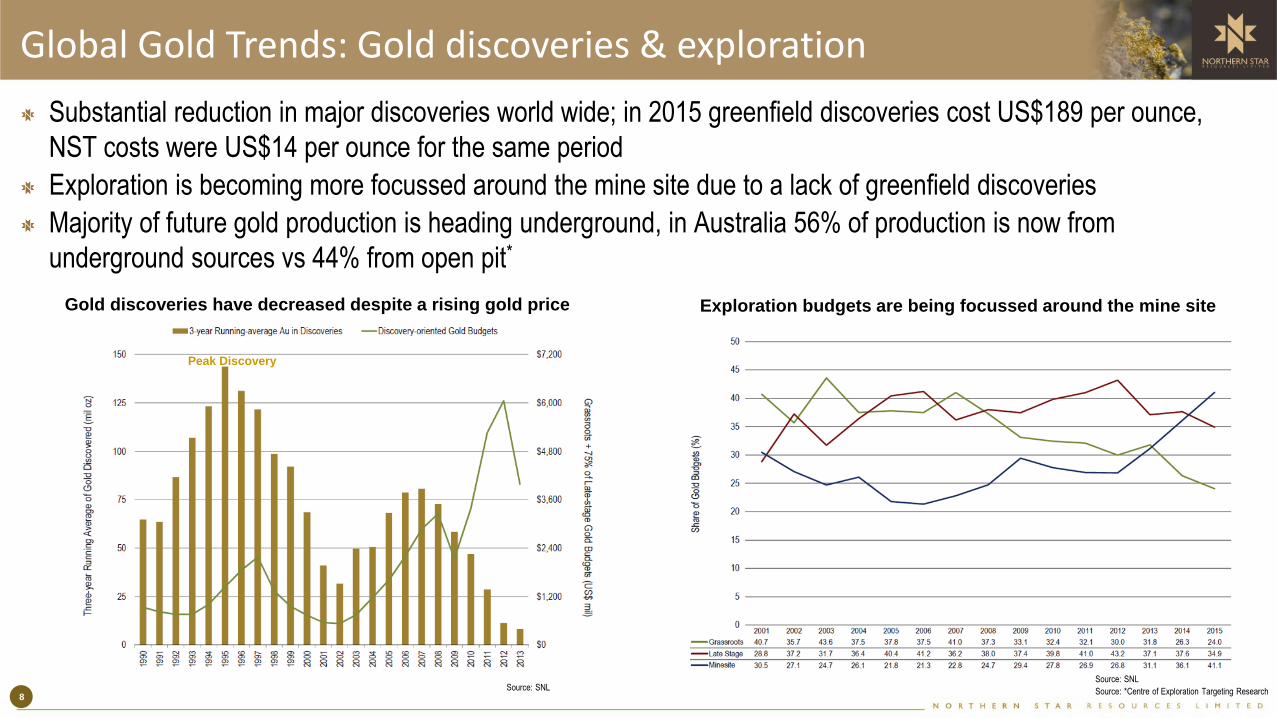
Substantial reduction in major discoveries world wide; in 2015 greenfield discoveries cost US$189 per ounce,
NST costs were US$14 per ounce for the same period
Exploration is becoming more focussed around the mine site due to a lack of greenfield discoveries
Majority of future gold production is heading underground, in Australia 56% of production is now from
underground sources vs 44% from open pit*
Source: SNL
Source: *Centre of Exploration Targeting Research 8
Global Gold Trends: Gold discoveries & exploration
Exploration budgets are being focussed around the mine siteGold discoveries have decreased despite a rising gold price
Source: SNL
Peak Discovery
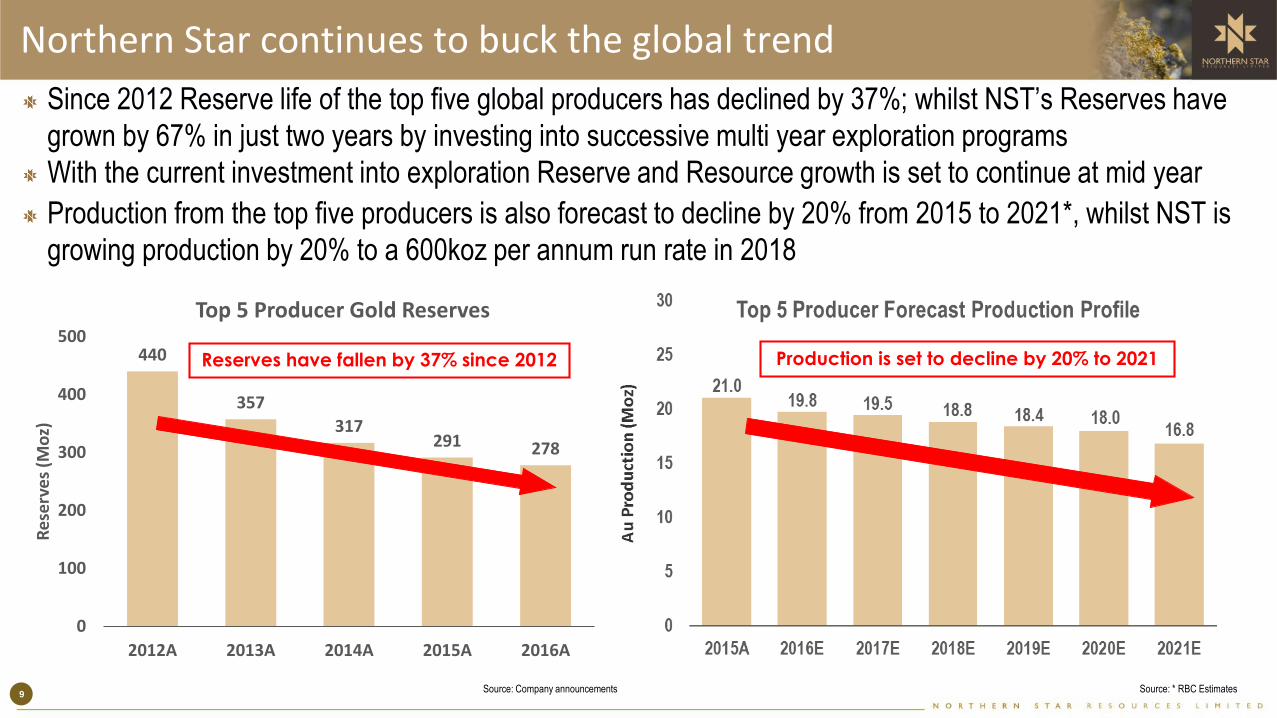
Northern Star continues to buck the global trend
Since 2012 Reserve life of the top five global producers has declined by 37%; whilst NST’s Reserves have
grown by 67% in just two years by investing into successive multi year exploration programs
With the current investment into exploration Reserve and Resource growth is set to continue at mid year
Production from the top five producers is also forecast to decline by 20% from 2015 to 2021*, whilst NST is
growing production by 20% to a 600koz per annum run rate in 2018
9Source: * RBC Estimates
440
357
317291 278
0
100
200
300
400
500
2012A 2013A 2014A 2015A 2016A
Re
serv
es
(Mo
z)
Top 5 Producer Gold Reserves
Reserves have fallen by 37% since 2012 Production is set to decline by 20% to 2021
Source: Company announcements
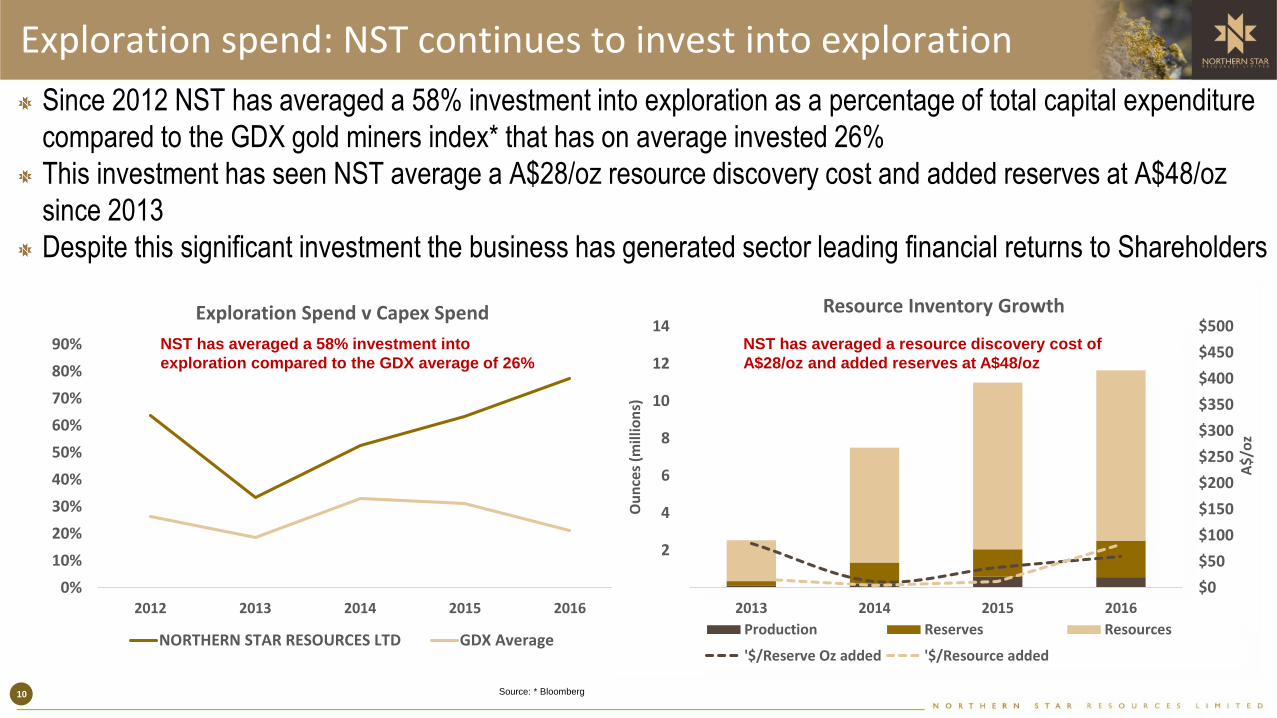
Since 2012 NST has averaged a 58% investment into exploration as a percentage of total capital expenditure
compared to the GDX gold miners index* that has on average invested 26%
This investment has seen NST average a A$28/oz resource discovery cost and added reserves at A$48/oz
since 2013
Despite this significant investment the business has generated sector leading financial returns to Shareholders
Exploration spend: NST continues to invest into exploration
0%
10%
20%
30%
40%
50%
60%
70%
80%
90%
2012 2013 2014 2015 2016
Exploration Spend v Capex Spend
NORTHERN STAR RESOURCES LTD GDX Average
$0
$50
$100
$150
$200
$250
$300
$350
$400
$450
$500
2
4
6
8
10
12
14
2013 2014 2015 2016
A$
/oz
Ou
nce
s (m
illio
ns)
Resource Inventory Growth
Production Reserves Resources
'$/Reserve Oz added '$/Resource added
NST has averaged a 58% investment into
exploration compared to the GDX average of 26%
NST has averaged a resource discovery cost of
A$28/oz and added reserves at A$48/oz
Source: * Bloomberg 10

Growth around concentrated centres is the focus
Globally there are only 30 mines producing over 200kozpa in Tier 1 mining jurisdictions; production and
project development is declining in these regions due to a lack of discoveries
Overlaying an EBITDA margin of over 50% on these assets significantly decreases the peer group
NST’s Jundee and Kalgoorlie Operations operate at an EBITDA margin of 56% and 55% respectively
NST is focussing on materially lifting production and increasing mine lives at these operations
Source: SNL11
Tier 1 mining jurisdictions
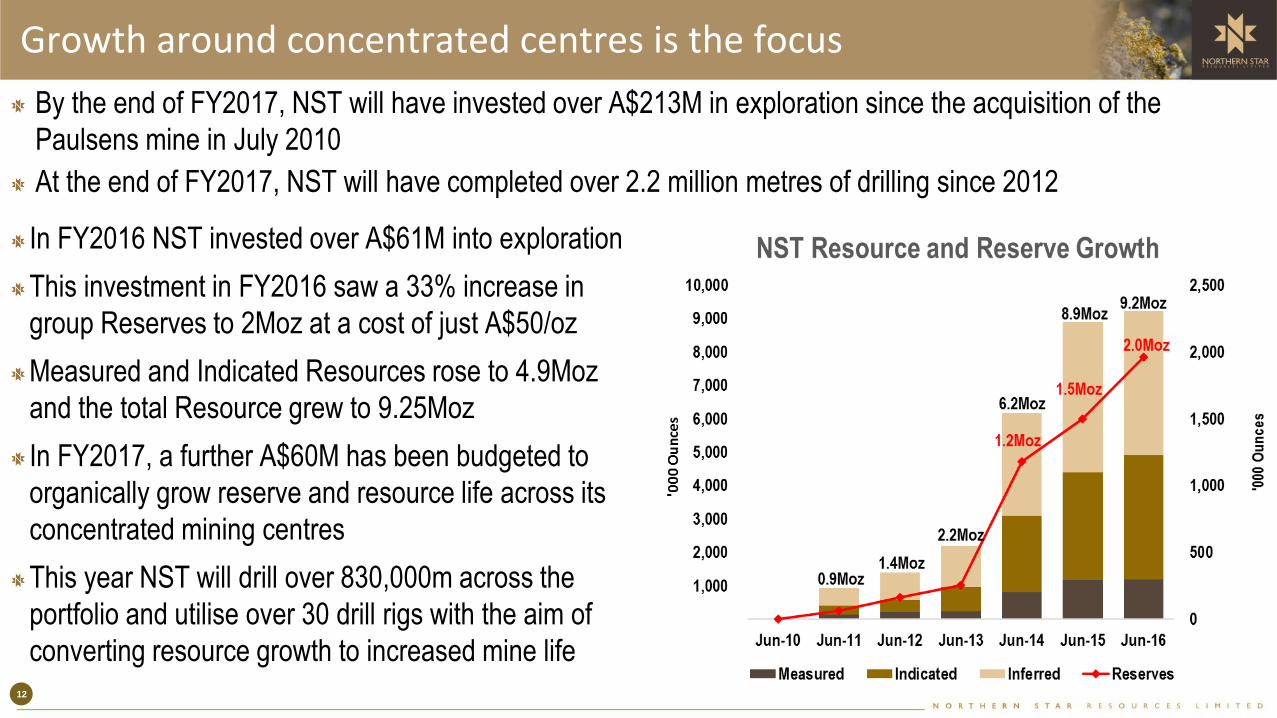
In FY2016 NST invested over A$61M into exploration
This investment in FY2016 saw a 33% increase in
group Reserves to 2Moz at a cost of just A$50/oz
Measured and Indicated Resources rose to 4.9Moz
and the total Resource grew to 9.25Moz
In FY2017, a further A$60M has been budgeted to
organically grow reserve and resource life across its
concentrated mining centres
This year NST will drill over 830,000m across the
portfolio and utilise over 30 drill rigs with the aim of
converting resource growth to increased mine life
Growth around concentrated centres is the focus
By the end of FY2017, NST will have invested over A$213M in exploration since the acquisition of the
Paulsens mine in July 2010
At the end of FY2017, NST will have completed over 2.2 million metres of drilling since 2012
Total Reserves
increased by 33% to
2Moz
Total Measured &
Indicated increased to
4.9Moz
12

NST Exploration: Leveraging the latest technology
NST has been leveraging the latest in geophysical exploration techniques taken from the Oil and Gas industry
with great success at Kundana and now at the Jundee deposit with 2D and 3D seismic surveys
Seismic has successfully identified extensions and parallel targets for future exploration; Pode and Gateway
In FY2017 NST will also be conducting over 4,300km2 of airborne geophysics in the Northern Territory
Potential
Gateway
Extension
Limit of Drilling
13

Jundee: Production and Resource life set to grow
FY2016: Resources 1.25Moz and Reserves up 21% to 720,000oz, even after mining 228koz
NST will be drilling over 432,000m in FY2017 with 12 drill rigs focussing on all areas across the lateral extent and
depth extensions of the ore body
6.75Moz of continuous gold production over the past 21 years, average of 320kozpa with a peak year of 410koz
Opportunities to expand production from known sources: increase mill capacity, bring recent underground
discoveries into production, develop satellite open pits and third party sources
14
Invicta portal Barton portal Gateway portal
Lyons
Armada
Deakin
Cardassian
Invicta
Gateway/Gringotts
Wilson
Nim3
Barton
Barton
Nexus
Westside
1.2km Drill Drive Current areas of drilling focus
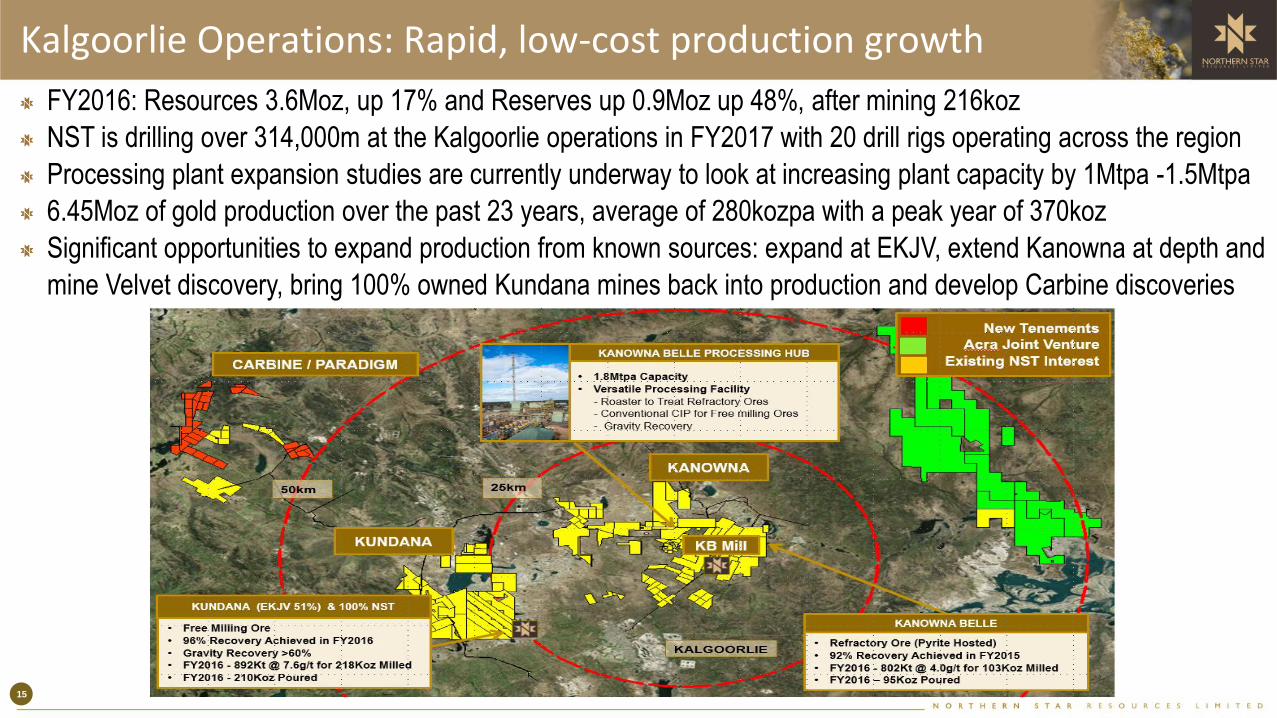
FY2016: Resources 3.6Moz, up 17% and Reserves up 0.9Moz up 48%, after mining 216koz
NST is drilling over 314,000m at the Kalgoorlie operations in FY2017 with 20 drill rigs operating across the region
Processing plant expansion studies are currently underway to look at increasing plant capacity by 1Mtpa -1.5Mtpa
6.45Moz of gold production over the past 23 years, average of 280kozpa with a peak year of 370koz
Significant opportunities to expand production from known sources: expand at EKJV, extend Kanowna at depth and
mine Velvet discovery, bring 100% owned Kundana mines back into production and develop Carbine discoveries
Kalgoorlie Operations: Rapid, low-cost production growth
15

Page 16
Kanowna Belle is a +5Moz orebody, averaging 4koz per
vertical metre with limited exploration below E block
NST will be drilling over 61,000m at Kanowna Belle with 4
rigs focussed on Velvet, E block and Lowes Extension
NST has also aggressively cut costs that has allowed the
current mine plan to be reviewed to bring existing resources
into production (blue areas on long section)
The Velvet deposit remains open up dip, along strike and
down plunge back towards the main Lowes ore body
Lowes orebody remains open along E block with
exploration success at Lowes West and E Block East
Only 12 historic holes have been drilled below the base of E
block; Lowes Extension exploration is currently targeting
this area from the 9245 drill drive with two drill rigs
Mineralisation has been encountered up to 450m below the
existing E Block production area
Velvet
Open
Open
Open
Kalgoorlie Operations: Rapid, low-cost production growth
KB in mine drilling
focussing on E block
and Lowes Extension
9245
Drill Drive
Resources currently outside of mine plan
Troy and Sims Lodes
Lowes Mineralisation
Stopes - 5Moz Produced
16

NST is targeting over 33,000m of exploration drilling on the EKJV ground with up to 4 UG drill rigs
This drilling will provide the next Resource and Reserve update across the mining complex
The new 2.1km drill drive to date is 630m from the Hornet decline and 30% complete, this drive will
provide the next long term drill platform to explore the depth potential of these deposits
Page 17
22
Kalgoorlie Operations: Rapid, low-cost production growth
Current Link Drive Development
17

Past production on the 100% NST ground has yielded 1.25Moz at 6gpt between 1990-2004
NST is drilling over 38,000m across these historic deposits to increase the resources at: Barkers, Strzelecki
and Pope John; each of these ore surfaces has historically produced 50-60kozpa
Current development at Millennium is ahead of schedule, first development ore due in 1Q FY2018
Exploration success will drive multiple development decisions in FY2018 to drive organic growth
Page 18
Kalgoorlie Operations: Rapid, low-cost production growth
18
Current Millennium Development

Paulsens: The Founding Asset
FY2016: Resources: 0.3Moz and Reserves 0.1Moz, after mining 91koz
Over 20,000m will be drilled with exploration being focussed down plunge of the Voyager 2 lode, Titan & Galileo
Excavation of the 160RL drill drive has commenced to provide a platform to further explore the Voyager 2 lode
0.85Moz of continuous gold production over the past 11 years, averaged of 75kozpa with a peak year of 100koz
Record cash flow achieved in FY2016 since the mine commenced in 2005
19

Central Tanami Project “CTP”: Emerging Growth Region
The Tanami region is an exciting new area that is rapidly
developing a reputation for major gold discoveries
NST operations are contiguous to the world class
Newmont Callie mine, endowment 13Moz, Reserves of
4.5Moz at 6gpt, production ~480kozpa at A$966/oz*
Central Tanami Project was divested by Newmont in 2010
before it “unlocked” the geology at Callie Mine
Previous produced 2.1Moz, averaged 120kozpa; only
mined mineralisation via pits to a depth of <125m
Production ceased after mining of the Groundrush pit,
where 610koz at 4.3gpt were recovered over a 4yr period
Past 5 years has seen A$40M invested at Groundrush
and feasibility studies with a current Resource of 1Moz
Recently acquired a substantial strategic land position to
complement existing operations
Has the potential to be a 120-150kozpa producer (100%) NST Interests
Newmont
Mining•Gold Occurrence•Significant Gold Deposit
150km
100km
Endowment >13Moz
Past Production >6Moz
Annual Production: 425-
480koz
AISC: US$700-$750 oz
YE 2016 Reserve: 23.2Mt
at 6.0g/t for 4.5Moz
YE 2016 Resource
(ex.RSV): 5.8Mt at 5.7g/t
for 1.1Moz
Extensive Mineral
Inventory
CALLIE (Newmont)
Open Pit Production
(Newmont) of 610koz
Tanami Gold Resource of
6.5Mt at 4.8g/t for 1Moz
GROUNDRUSH
(NST Earning to 60%)
53 Historic Open Pits
Tanami Gold Resource of
25Mt at 2.1g/t for 1.7Moz
1.2Mtpa Processing Plant
CENTRAL TANAMI
(NST Earning to 60%)
Source: * NEM Investor BMO Presentation 20

FY2017: Production and Cost Guidance
Total gold production of 485,000-515,000oz at an AISC of A$1,000-A$1,050/oz
A$130M to be spent on investing capital following on from the great successes in FY2016, including:
A$60M for drilling to bring more Resources into Reserves and convert new discoveries into Resources
A$70M for Investing/Expansionary capital to bring future deposits on line and lift group production
NST will continue to benefit from the lowest level of capital intensity in the global gold sector; underpinning
sector leading returns in the future
Production is set to rise to an annualised rate of 600,000oz in 2018
FY2017 production guidance on a per asset basis as below:
FY2017 Production AISC
Guidance Range Oz Oz A$/oz A$/oz
Jundee 220,000 230,000 1,000 1,050
Kalgoorlie Operations 200,000 210,000 950 1,000
Paulsens 65,000 75,000 1,200 1,250
Group NST 485,000 515,000 1,000 1,05021
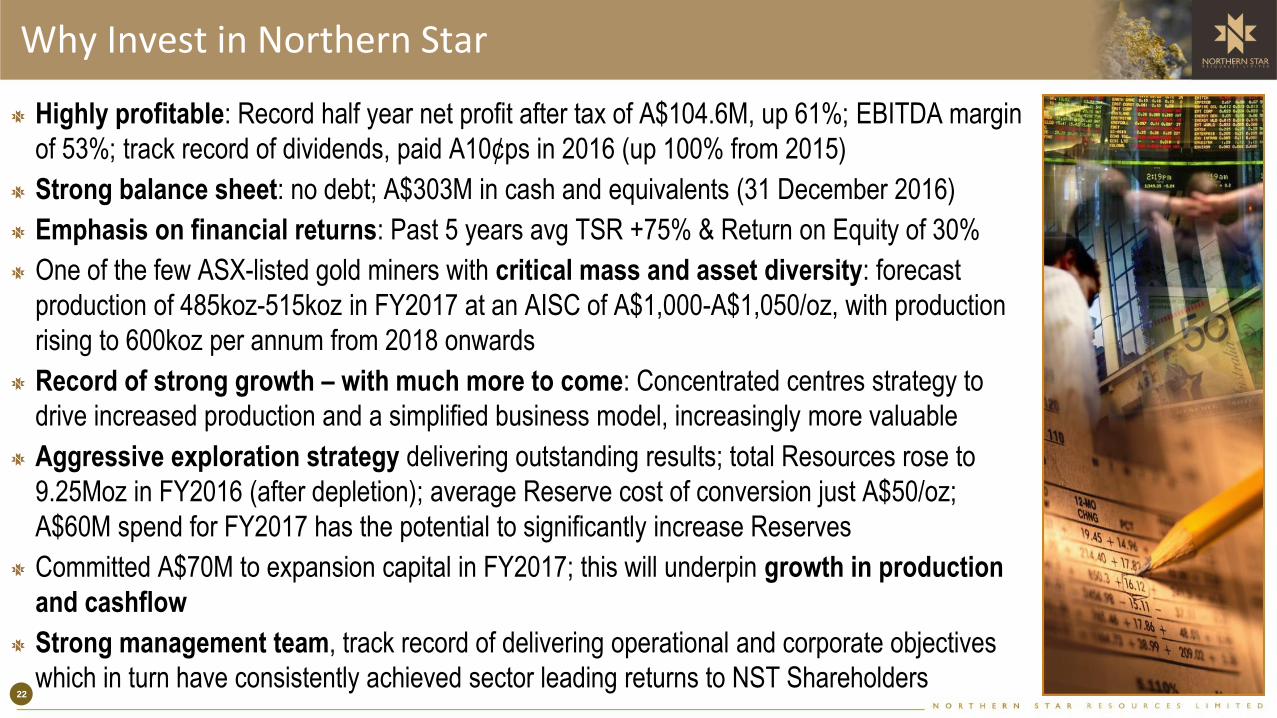
Why Invest in Northern Star
Highly profitable: Record half year net profit after tax of A$104.6M, up 61%; EBITDA margin
of 53%; track record of dividends, paid A10¢ps in 2016 (up 100% from 2015)
Strong balance sheet: no debt; A$303M in cash and equivalents (31 December 2016)
Emphasis on financial returns: Past 5 years avg TSR +75% & Return on Equity of 30%
One of the few ASX-listed gold miners with critical mass and asset diversity: forecast
production of 485koz-515koz in FY2017 at an AISC of A$1,000-A$1,050/oz, with production
rising to 600koz per annum from 2018 onwards
Record of strong growth – with much more to come: Concentrated centres strategy to
drive increased production and a simplified business model, increasingly more valuable
Aggressive exploration strategy delivering outstanding results; total Resources rose to
9.25Moz in FY2016 (after depletion); average Reserve cost of conversion just A$50/oz;
A$60M spend for FY2017 has the potential to significantly increase Reserves
Committed A$70M to expansion capital in FY2017; this will underpin growth in production
and cashflow
Strong management team, track record of delivering operational and corporate objectives
which in turn have consistently achieved sector leading returns to NST Shareholders 22
Northern Star ResourcesAn Australian Mid Cap gold miner – for global investors
Contact Details:Luke Gleeson – Investor Relations +61 8 6188 2100Email – [email protected] – www.nsrltd.com

Appendix
Northern Star ResourcesAn Australian gold miner – for global investors
Appendix
Dedicated drill drives are
positioned perpendicular to
the orebody for better
intersection angles to
achieve better true width
estimates
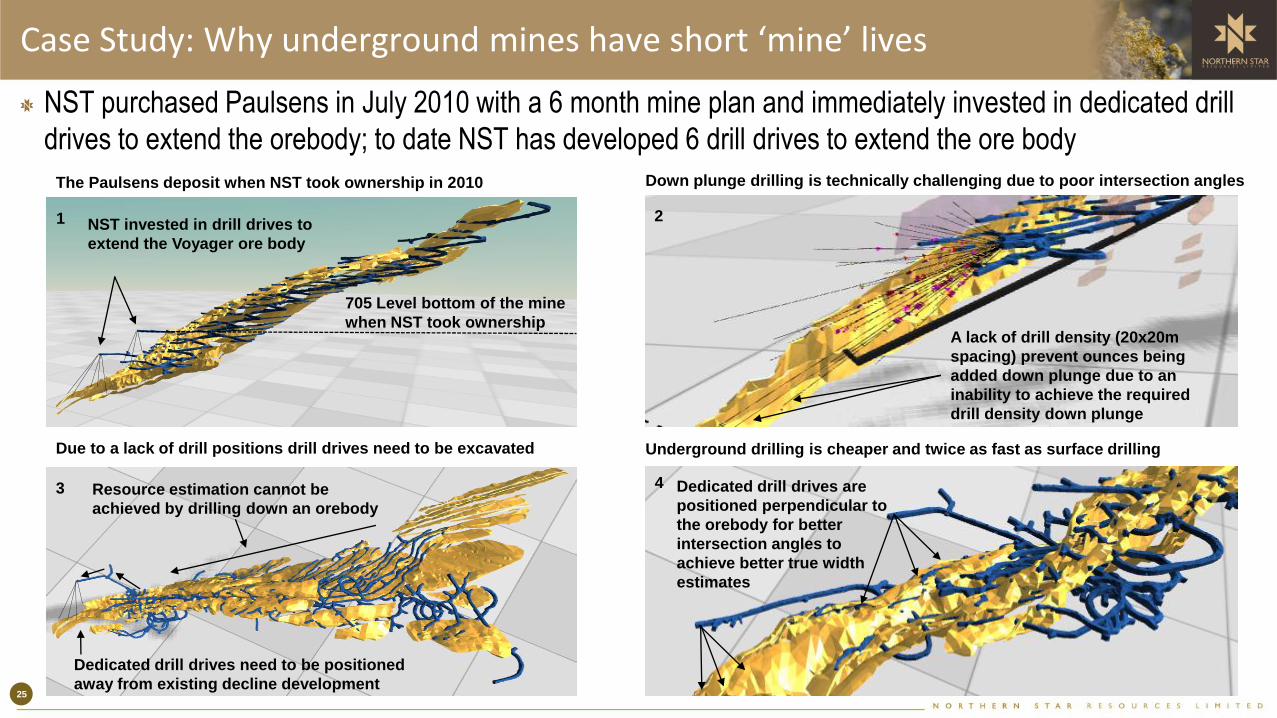
Case Study: Why underground mines have short ‘mine’ lives
NST purchased Paulsens in July 2010 with a 6 month mine plan and immediately invested in dedicated drill
drives to extend the orebody; to date NST has developed 6 drill drives to extend the ore body
The Paulsens deposit when NST took ownership in 2010
Due to a lack of drill positions drill drives need to be excavated
Down plunge drilling is technically challenging due to poor intersection angles
Underground drilling is cheaper and twice as fast as surface drilling
Dedicated drill drives need to be positioned
away from existing decline development
NST invested in drill drives to
extend the Voyager ore body
705 Level bottom of the mine
when NST took ownershipA lack of drill density (20x20m
spacing) prevent ounces being
added down plunge due to an
inability to achieve the required
drill density down plunge
Resource estimation cannot be
achieved by drilling down an orebody
1 2
3 4
25