
An Assessment of the Mineralogy of UK Municipal … · WRc Ref: UC8564.10 December 2012 An...
46
WRc Ref: UC8564.10 December 2012 An Assessment of the Mineralogy of UK Municipal Waste Incinerator Bottom Ash using Geochemical Modelling
Transcript of An Assessment of the Mineralogy of UK Municipal … · WRc Ref: UC8564.10 December 2012 An...

WRc Ref: UC8564.10
December 2012
An Assessment of the Mineralogy of UK
Municipal Waste Incinerator Bottom Ash
using Geochemical Modelling

RESTRICTION: This report has the following limited distribution:
External: Environmental Services Association
© WRc plc 2012 The contents of this document are subject to copyright and all rights are reserved. No part of this document may be reproduced, stored in a retrieval system or transmitted, in any form or by any means electronic, mechanical, photocopying, recording or otherwise, without the prior written consent of WRc plc.
This document has been produced by WRc plc.
Any enquiries relating to this report should be referred to the Project Manager at the following address:
WRc plc,
Frankland Road, Blagrove,
Swindon, Wiltshire, SN5 8YF
Telephone: + 44 (0) 1793 865000
Fax: + 44 (0) 1793 865001
Website: www.wrcplc.co.uk
An Assessment of the Mineralogy of UK
Municipal Waste Incinerator Bottom Ash using
Geochemical Modelling
Report No.: UC8564.10
Date: December 2012
Authors: Jane Turrell, Kathy Lewin and Hans van der Sloot (Hans van der Sloot Consultancy)
Project Manager: Jane Turrell
Project No.: 14728-9
Client: Environmental Services Association

Contents
Summary .................................................................................................................................. 1
1. Aim .............................................................................................................................. 2
2. Background ................................................................................................................. 3
3. Characterisation .......................................................................................................... 4
3.1 Methods ....................................................................................................................... 4
3.2 Results ........................................................................................................................ 4
3.3 Geochemical speciation modelling of IBA ................................................................... 6
4. Conclusions ............................................................................................................... 12
References ............................................................................................................................. 14
Appendices
Appendix A Background Information on Waste Characterisation Tests ..................... 15
Appendix B Leaching Test Data in Context of Dataset for UK Aged IBA ................... 16
Appendix C Leaching Test Data in Context of Worldwide Dataset ............................. 19
Appendix D Geochemical Speciation Modelling of IBA Generated Using
Zinc as Example Species ........................................................................ 23
Appendix E Interpretation of Leaching Test Data ....................................................... 31
Appendix F Plots from Geochemical Modelling – UK and Worldwide
Data ......................................................................................................... 32
List of Tables
Table 3.1 „As received‟ concentrations of key metals in the two UK IBA samples and ESA UK IBA dataset used for hazard assessment ............................................................................................... 5
Table D.1 Model input parameters for IBA1 ............................................................. 26
Table D.2 Model input parameters for IBA2 ............................................................. 27
List of Figures
Figure 3.1 Example of a “good fit” - Zn(SiO3) in UKIBA1 ........................................... 7
Figure 3.2 Examples of “poor fit” – ZnO in UKIBA1 and Zn (OH)2 in UKIBA2 ...................................................................................................... 7
Figure 3.3 Plots showing the geochemical modelling of solid phase fractionation of IBA for nickel (full plots in Appendix F4) ........................... 9
Figure B.1 Cumulative and pH dependent release for selected parameters .............................................................................................. 17
Figure F.1 Geochemical modelling of Zn release from IBA from Germany, Italy and Taiwan including partitioning between dissolved and solid phases ..................................................................... 33
Figure F.2 Geochemical modelling of Zn release from IBAs from Austria, Netherlands and Sweden including partitioning between dissolved and solid phases ....................................................... 34
Figure F.3 Geochemical modelling of Zn release from fresh IBA from UK including partitioning between dissolved and solid phases ..................................................................................................... 35
WRc Ref: UC8564.10/14728-9 December 2012
© WRc plc 2012 1
Summary
Geochemical modelling of IBA from around the world, including aged IBA samples from the
UK, has been undertaken by Hans van der Sloot using LeachXSTM
/ORCHESTRA (van der
Sloot et al, 2008) to support the hazard assessment of IBA currently being undertaken by
WRc for ESA. The same modelling has been carried out on data from two fresh samples of
IBA collected under the ESA protocol (2010) in December 2010. Key characteristics and
model outputs have been placed in context with both UK aged IBA (five samples) and other
IBA samples from around the world (six samples) and have shown that total composition,
leachability and associated mineralogies are broadly similar.
Excluding the portion of zinc and nickel metal in the samples, the exercise has demonstrated
that, at the pH of fresh and aged IBA, the zinc mineralogy that controls release is dominated
by zinc silicates (ZnSiO3 or ZnSiO4).
Nickel geochemistry is dominated by the hydroxide. This is exhibited by the two fresh IBA
samples, the aged UK IBA samples and the worldwide samples that have been modelled.
Excluding copper metal, copper geochemistry of the aged UK IBA samples and worldwide
samples is dominated by copper hydroxide. Calcium copper phosphate hydroxide
(Ca4Cu(PO4)3OH) and sulphate hydroxides can have a minor role at the lower pH range of
aged ashes. In the fresh ashes, copper release is dominated by copper complexed with iron
hydroxide and particulate organic matter.
It is recommended that these key phases are used to inform hazard assessment of IBA
unless facility-specific geochemical modelling information is available.

WRc Ref: UC8564.10/14728-9 December 2012
© WRc plc 2012 2
1. Aim
This Technical Note presents the results of a geochemical modelling exercise to determine
the zinc, nickel and copper species that control observed release in incinerator bottom ash
(IBA) using samples taken from two UK municipal waste energy from waste (EfW) facilities.
The work has been completed to inform the understanding of the underlying mineralogy. This
is needed to assess specific potentially hazardous properties.
WRc Ref: UC8564.10/14728-9 December 2012
© WRc plc 2012 3
2. Background
Previous discussions between the waste sector and the Environment Agency have focused
on the sources of variability in the elemental concentrations of metals in IBA, and the species
of metals present, as well as in the sampling methodology. A sampling protocol (ESA, 2010)
was agreed with the Environment Agency which aims to provide confidence that sampling and
testing is being conducted in a consistent and robust manner.
Zinc, nickel and copper are present in IBA from EfW facilities around the world. Some
compounds of these metals carry risk phrases relevant to a hazard assessment and others do
not (such as nickel and copper in elemental form). For the purposes of assessing the hazard
status of IBA samples, determining which compounds of zinc, nickel and copper control their
release is important as only those with relevant risk phrases need to be considered in the
assessment of a hazard property1. Geochemical modelling provides a means to produce a
chemical fingerprint for the speciation of metals in IBA and this technique has already been
applied and reported for IBA in other countries and indeed wastes from other treatment
processes. IBA from two UK EfW moving grate facilities has been collected for detailed
characterisation according to the procedures detailed in the ESA protocol. Geochemical
modelling of this data has been used to identify candidate zinc, nickel and copper release
controlling species, other than zinc, copper and nickel metal, in the two samples.
1 Although the term „risk phrase‟ is used to describe impacts of exposure to specific compounds at
certain concentrations, the term „hazard classification‟ is used under the Global Harmonised System,
and the regulatory position is currently based on inherent hazard (i.e. the total concentrations of a
potentially hazard compound), not on risk of exposure of a target to the hazard.
WRc Ref: UC8564.10/14728-9 December 2012
© WRc plc 2012 4
3. Characterisation
3.1 Methods
Testing was undertaken to determine composition (e.g. acid soluble metals) and release of a
many major, minor and trace substances over a wide range of pH conditions and liquid to
solid ratios to determine the chemical speciation fingerprint for IBA through geochemical
modelling. Besides a selection of possibly relevant mineral phases, reactive Al/Fe oxides and
organic carbon fractions were quantified to be support the modelling. The primary tests
undertaken included aqua regia and hydrofluoric/perchloric acid composition, pH-dependence
leaching (CEN/TS 14429:2005) and upflow percolation leaching (CEN/TS 14405:2005).
Further background information detailing the basic principles of these tests and the value of
the data produced is provided in Appendix A.
3.2 Results
As the geochemical modelling approach has been applied previously to IBA from around the
world and to samples of aged UK IBA, key results from the characterisation of the two fresh
UK IBA samples have been placed in the context of wider datasets below.
3.2.1 Comparison of UK IBA samples with ESA UK IBA dataset
The 12 month dataset for IBA collected under the ESA IBA sampling and testing protocol
(ESA, 2012) has been used to undertake a full 15 hazard property assessment. Key
determinands for the assessment have been shown to be acid soluble (total) concentrations
of zinc, copper and nickel. These are reported on an „as received‟ basis to represent the
condition of the ash as it left the EfW facility for treatment and recycling. For most samples
this is simply a wet-weight concentration, with others including a calculation of any inert non-
grindable materials (ceramics, glass, stone) removed during the sample preparation stage.
The concentrations of the three key metals for the two fresh UK IBA samples are compared
with the ESA UK dataset in Table 3.1.
WRc Ref: UC8564.10/14728-9 December 2012
© WRc plc 2012 5
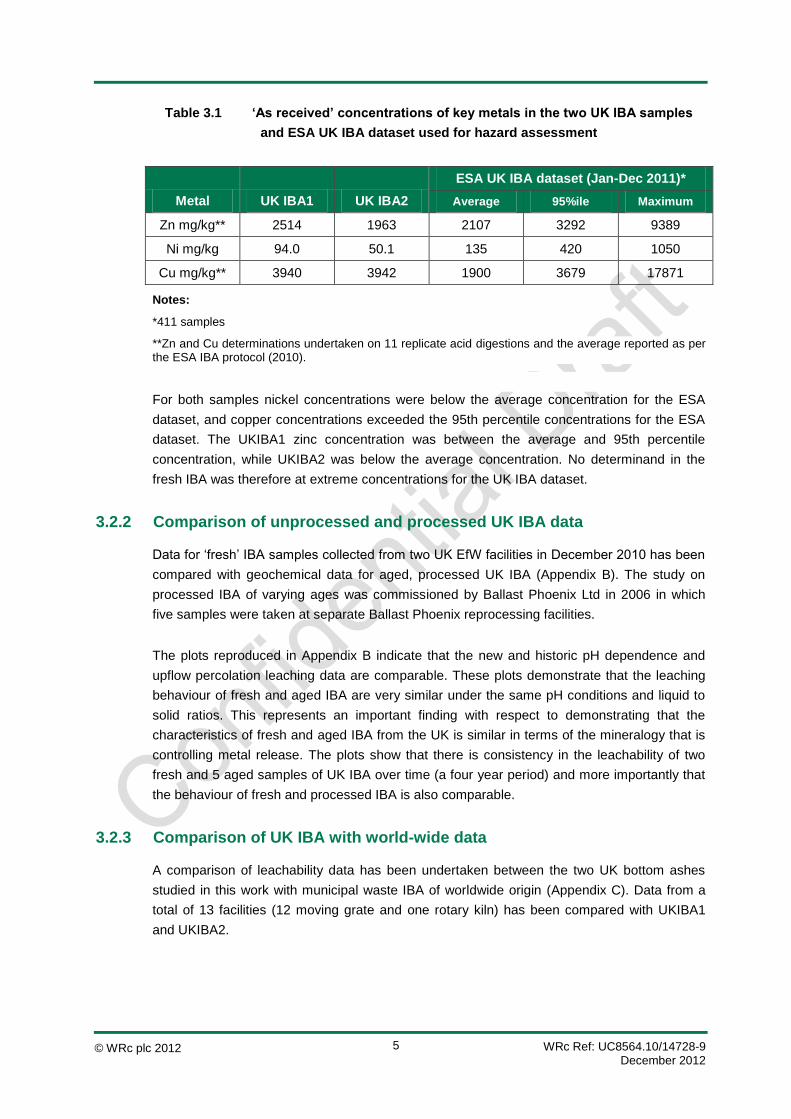
Table 3.1 „As received‟ concentrations of key metals in the two UK IBA samples
and ESA UK IBA dataset used for hazard assessment
Metal UK IBA1 UK IBA2
ESA UK IBA dataset (Jan-Dec 2011)*
Average 95%ile Maximum
Zn mg/kg** 2514 1963 2107 3292 9389
Ni mg/kg 94.0 50.1 135 420 1050
Cu mg/kg** 3940 3942 1900 3679 17871
Notes:
*411 samples
**Zn and Cu determinations undertaken on 11 replicate acid digestions and the average reported as per the ESA IBA protocol (2010).
For both samples nickel concentrations were below the average concentration for the ESA
dataset, and copper concentrations exceeded the 95th percentile concentrations for the ESA
dataset. The UKIBA1 zinc concentration was between the average and 95th percentile
concentration, while UKIBA2 was below the average concentration. No determinand in the
fresh IBA was therefore at extreme concentrations for the UK IBA dataset.
3.2.2 Comparison of unprocessed and processed UK IBA data
Data for „fresh‟ IBA samples collected from two UK EfW facilities in December 2010 has been
compared with geochemical data for aged, processed UK IBA (Appendix B). The study on
processed IBA of varying ages was commissioned by Ballast Phoenix Ltd in 2006 in which
five samples were taken at separate Ballast Phoenix reprocessing facilities.
The plots reproduced in Appendix B indicate that the new and historic pH dependence and
upflow percolation leaching data are comparable. These plots demonstrate that the leaching
behaviour of fresh and aged IBA are very similar under the same pH conditions and liquid to
solid ratios. This represents an important finding with respect to demonstrating that the
characteristics of fresh and aged IBA from the UK is similar in terms of the mineralogy that is
controlling metal release. The plots show that there is consistency in the leachability of two
fresh and 5 aged samples of UK IBA over time (a four year period) and more importantly that
the behaviour of fresh and processed IBA is also comparable.
3.2.3 Comparison of UK IBA with world-wide data
A comparison of leachability data has been undertaken between the two UK bottom ashes
studied in this work with municipal waste IBA of worldwide origin (Appendix C). Data from a
total of 13 facilities (12 moving grate and one rotary kiln) has been compared with UKIBA1
and UKIBA2.

WRc Ref: UC8564.10/14728-9 December 2012
© WRc plc 2012 6
The data indicates there are no substantial differences in the leaching behaviour of metal and
other key parameters between the UK and global data set which includes both fresh and aged
IBA.
As the leaching behaviour of IBA is the result of the underlying mineralogy, sorption reactions
and substitution reactions we would expect IBA produced by municipal EfW facilities around
the world to have a consistent mineralogical fingerprint with respect to metals.
3.3 Geochemical speciation modelling of IBA
Geochemical modelling of the metal species in IBA has been conducted by Hans van der
Sloot (formerly of ECN, Energy research Centre of the Netherlands) on IBA from around the
world using LeachXSTM
/ORCHESTRA. The geochemical modelling of the two composite
samples of fresh IBA from the UK, referred to as UKIBA1 and UKIBA2, is therefore reported in
the context of the wider work.
A resumé of the geochemical modelling work and plots to illustrate model outcomes are
provided in Appendix D1. Multi-element geochemical speciation modelling is equilibrium
based and complex due to the multiple simultaneous interactions between major, minor and
trace elements (e.g. mineral dissolution/precipitation, competition for sorption sites on
hydrated iron oxides and organic matter and substitution in solid solutions). Model run-times
are short and the outcomes of the model can be optimized by iteration and by applying
changes in the „proposed‟ mineral assemblage until simultaneously a good match is obtained
simultaneously between modelled mineral assemblage (and sorption sites) and actual data for
all major, minor and trace elements. The emphasis in this type of modelling is focused on the
concentrations in solution in contact with the solid phase. It therefore provides information
about the solubility controlling phases in the ash. The options to vary mineral selections is
very limited as a good agreement between all major, minor and trace elements is required.
Focusing on a single substance may produce a good fit for one, but a very poor match for
other substances. Incorrect choices of a mineral or a sorption property will show as a
significant deviation of predicted leaching from actual measurement i.e. a “poor fit”. Example
of “good” and “poor fits” for the modelling are presented in Figures 3.1 and 3.2. The model
results from Figure 3.2 indicate that ZnO or Zn(OH)2 are not controlling solubility indicating
that these phases are not in play.

WRc Ref: UC8564.10/14728-9 December 2012
© WRc plc 2012 7
Figure 3.1 Example of a “good fit” - Zn(SiO3) in UKIBA1
Figure 3.2 Examples of “poor fit” – ZnO in UKIBA1 and Zn (OH)2 in UKIBA2
The modelling approach used in this instance takes into account partitioning between the
dissolved (free and bound to dissolved organic carbon (DOC)) and solid phases (iron and
aluminium oxide/hydroxide sorption and clay sorption properties of the material) to determine
the major mineral phases present for each element which are controlling observed leaching
characteristics. Mineral phases are initially selected on the basis of saturation indices (where
0 represents full equilibrium, negative values represent under-saturation and positive values
represent oversaturation) at various pH conditions. A model outcome close to zero over a
broad pH range would indicate that the mineral phase is a good match and likely to be a
controlling phase for observed leaching characteristics. This initial set of possible controlling
minerals is then optimized to obtain a full description of the release at L/S=10 for all major,
minor and trace elements, which is then verified against the measurements at low L/S (first
fraction of the percolation test) by modelling simultaneously the concentrations in solution at a
L/S of 0.3. Modelling of multiple IBA samples from different sources leads to largely the same
mineral set, which provides an adequate description indicating that IBA processed in
incinerators produce an ash with very similar properties from a leaching perspective. An
example of a full elemental fit with associated partitioning is provided in Appendix F.
The plots showing dominant solid phases for the best fit mineral assemblages are presented
in Appendix F for the UK and world-wide dataset. It should be noted that the presence of
elemental or metallic nickel, copper and zinc are not included in the modelling.

WRc Ref: UC8564.10/14728-9 December 2012
© WRc plc 2012 8
3.3.1 Geochemical speciation modelling IBA
Any of the modelling described below for the individual elements zinc, nickel and copper is
based on full multi-element geochemical modelling with variations in the mineral assemblage
to test the stability of the selected mineral set.
Zinc
Zinc has been selected as the parameter to demonstrate the outcome of the geochemical
modelling of IBA from around the world, including aged UK samples and the fresh IBA tested
for ESA. Between these ashes zinc exhibits solubility control by a few poorly soluble phases.
In an environmental situation the pH domain of relevance is defined by the initial pH of the
bottom ash (around pH 12) and a fully carbonated bottom ash (pH around 7.5). The plots
showing dominant phases for the best fit mineral assemblages are presented in Appendix F1
for the UK and world-wide dataset. Plots for solid phase fractionation only are presented in
Appendix F2. It should be noted that the modelling does not take into account the presence of
metallic or elemental zinc in the IBA although this will most likely be present in the sample.
The optimal release match („best fit‟) was achieved for all 12 samples by either of these poorly
soluble mineral phases, in addition to organic matter interaction and sorption on iron
oxide/hydroxide surfaces:
a silicate: ZnSiO3 (or ZnSiO4, willemite); or
a calcium zinc phosphate hydroxide: Ca4Zn(PO4)3OH.
The plots show that the release controlling phases for zinc will be these mineral forms at the
natural pH of the ash.
Reiteration of the modelling with refinements of the mineral suite has shown that the two fresh
samples are controlled by zinc silicate across the pH domain of both fresh and aged ash in
most scenarios. In some combinations of mineral assemblage, calcium zinc phosphate
hydroxide can play a role between pH 9 and 5.5. However, this is the pH domain of aged
ashes and the modelling of actual aged ashes indicates a predominance of the silicate at this
pH range.
Separate model runs were carried out for a range of other minerals as single controlling
phases. A poor match with measured concentrations for the fresh ashes was obtained for
ZnO, cazincate, Zn(OH)2, willemite (ZnSiO4), ZnCl2 and bianchite (Zn0.75Fe2+
0.25(SO4)•6(H2O)).
This implies that the latter phases are not the phases controlling leaching over the pH range
of relevance to IBA in normal exposure conditions, or in fresh ash as it leaves the facility. Any
soluble zinc will dissolve and more or less immediately re-precipitate as the less soluble
silicates and phosphates – as would happen when the ash is quenched as it comes out of the
boiler.
WRc Ref: UC8564.10/14728-9 December 2012
© WRc plc 2012 9
Silicates (ZnSiO3 and willemite, ZnSiO4) or phosphate hydroxides have therefore been shown
to control the release of zinc across the pH domain of both fresh and aged samples in the UK
and around the world, supporting the view that IBA is a generic waste with respect to the
underlying zinc mineralogy that controls its release.
Comparison of the aqua regia zinc concentration in UKIBA1 and 2 with the ESA IBA dataset
(Table 1) shows that the samples are close to the average concentration for the ESA dataset.
The outcome of the modelling is therefore considered to be applicable to the assessment of
hazard status of the ESA dataset.
Nickel
A similar modelling exercise has been undertaken for nickel species, including modelling runs
of different mineral assemblages to test the fit of the predicted and actual measurements. The
plots are presented in Appendix F3. However, as fractionation in the solid phase is of greatest
interest, plots demonstrating fit, liquid to solid partitioning and fractionation in solution are not
reproduced here. The plots for the two fresh UK IBA samples are presented in Figure 3.3.
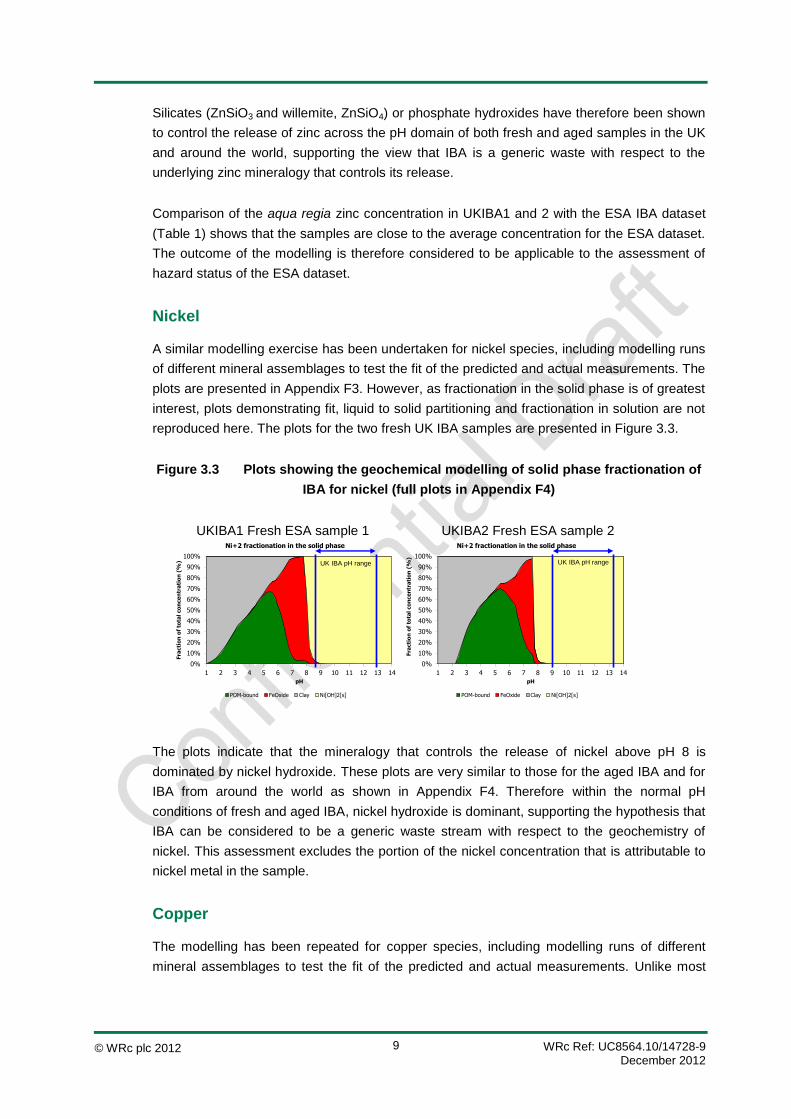
Figure 3.3 Plots showing the geochemical modelling of solid phase fractionation of
IBA for nickel (full plots in Appendix F4)
UKIBA1 Fresh ESA sample 1 UKIBA2 Fresh ESA sample 2
The plots indicate that the mineralogy that controls the release of nickel above pH 8 is
dominated by nickel hydroxide. These plots are very similar to those for the aged IBA and for
IBA from around the world as shown in Appendix F4. Therefore within the normal pH
conditions of fresh and aged IBA, nickel hydroxide is dominant, supporting the hypothesis that
IBA can be considered to be a generic waste stream with respect to the geochemistry of
nickel. This assessment excludes the portion of the nickel concentration that is attributable to
nickel metal in the sample.
Copper
The modelling has been repeated for copper species, including modelling runs of different
mineral assemblages to test the fit of the predicted and actual measurements. Unlike most
0%
10%
20%
30%
40%
50%
60%
70%
80%
90%
100%
1 2 3 4 5 6 7 8 9 10 11 12 13 14
Fra
cti
on
of
tota
l co
nce
ntr
ati
on
(%
)
pH
Ni+2 fractionation in the solid phase
POM-bound FeOxide Clay Ni[OH]2[s]
0%
10%
20%
30%
40%
50%
60%
70%
80%
90%
100%
1 2 3 4 5 6 7 8 9 10 11 12 13 14
Fra
cti
on
of
tota
l co
nce
ntr
ati
on
(%
)
pH
Ni+2 fractionation in the solid phase
POM-bound FeOxide Clay Ni[OH]2[s]
U
K
U
KUK IBA pH range UK IBA pH range

WRc Ref: UC8564.10/14728-9 December 2012
© WRc plc 2012 10
other elements a number of reiterations using different mineral assemblage have been
required to improve the modelling fit for the fresh UK ashes. The plots showing fractionation in
the solid phase are presented in Appendix F3.
The picture for copper is less obviously consistent than for nickel.
Aged ashes: examination of the plots for aged ash from UK and around the world,
shows that the major controlling phase at high pH (>pH12) in aged samples is copper
hydroxide. In some model iterations (not shown) under the pH domain of aged ashes
(<pH10) phosphate hydroxide could be a minor phase for copper release, with copper
hydroxide representing a transient phase before pH reduces during the carbonation
process. In the worldwide samples copper hydroxide dominates copper release at high
and moderate pH values, although copper sulphate hydroxides (e.g. tsumebite and
anterlite) may play a role as the pH decreases (Appendix F3).
Fresh ashes: following the repeated modelling iterations, a different picture has
emerged for the fresh IBA samples, where copper release is dominated by copper
complexed with particulate organic matter bound copper and iron hydroxide. The role of
organic matter in the release of copper has been widely reported (e.g. van Zomeren
and Coumans, 2004), but the levels of available organic matter are higher in the UK
fresh ashes than previously modelled (i.e. in aged IBA). The characterisation exercise
for the UK fresh ashes (WRc, 2010) demonstrated that these samples still contained
relatively high levels of organic matter (e.g. up to 2900 mg/kg organic hydrophyllic
acids). These are normally microbially degraded or washed out during IBA treatment or
rainfall exposure. The modelling therefore shows that in very fresh ashes which still
contain available organic matter, the phases controlling release of copper are iron
hydroxide and particulate organic matter.
The modelling exercise has highlighted that the ash ageing process represents a continuum
until full carbonation of the IBA at pH 7-8 over decades. It is understood that in the early
stages of this process, at the same time that organic matter is gradually removed, copper
hydroxide is formed as part of secondary mineralisation and is repeatedly precipitated as a
coating on inorganic particles. This secondary mineralisation increases the dominance of
copper hydroxide with time, followed by the conversion to other inorganic phases, depending
on the availability of other ions, e.g. phosphate hydroxides or sulphate hydroxides and over
many decades, carbonates.
However, it should be noted that copper metal is easily brought into solution by aqua regia
digestion and therefore a significant but unquantifiable component of the IBA is likely to be
copper metal (e.g. copper wire), in addition to the mineral phases modelled from the
leachability and composition data. Anecdotal evidence from ash reprocessors that recover
and sell ferrous and non-ferrous metals indicates that, of the baseload of 2000 mg/kg Cu in
IBA (average concentration for the ESA dataset, Table 3.1), up to 1000 mg/kg is likely to
represent metallic copper. Similarly, excursions above this value (e.g. values of 3000, 5000 or
WRc Ref: UC8564.10/14728-9 December 2012
© WRc plc 2012 11
10000 mg/kg) almost certainly represent copper metal fragments, such as e.g. copper wire
(van der Sloot, pers. comm.) or alloys such as brass. However, these non-hazardous forms
are indistinguishable from other copper phases dissolved in the aqua regia digest. The
assessment of the copper controlling phases is therefore conservative as it makes no
allowance for the metallic copper in IBA.
Comparison of the aqua regia copper concentrations in UK IBA1 and 2 with the ESA IBA
dataset (Table 1) shows that the fresh samples are slightly higher than the 95%ile
concentration for the ESA dataset (3679 mg kg-1
). The outcome of the modelling of copper
speciation is therefore considered to be applicable to the assessment of hazard status of the
ESA dataset, but can be over-ridden by facility-specific modelling.
WRc Ref: UC8564.10/14728-9 December 2012
© WRc plc 2012 12
4. Conclusions
1. Two samples of fresh IBA have been collected in line with the ESA IBA protocol,
characterised with respect to composition and leaching behaviour and geochemical
fingerprints by multi-element modelling for zinc, copper and nickel species have been
generated using LeachXSTM
/ORCHESTRA.
2. The characteristics of the two fresh IBA samples, UK IBA1 and UK IBA2, fall within the
ranges exhibited by the ESA IBA dataset January-December 2011, which has been
used as the basis of a 15 property hazard assessment (ESA, 2012).
3. The leaching behaviour of the two fresh IBA samples with respect to zinc, copper and
nickel is similar to that exhibited by five UK aged IBA samples and a further five
samples from around the world.
4. Geochemical modelling shows that a small number of mineral phases control the
speciation of zinc, copper and nickel across the majority of samples in the pH domain
of fresh and aged IBA (pH9-13).
5. The dominant zinc controlling phases for the UK IBA samples modelled are silicates
(ZnSiO3 or ZnSiO4). Modelling of the 12 samples from the UK and around the world
indicate that either silicates or phosphate hydroxides control zinc release pointing to an
underlying consistent mineralogy.
6. Within the normal pH conditions of fresh and aged IBA, the release of nickel is
dominated by nickel hydroxide. This is the case for the worldwide samples, the aged
UK IBA and fresh UKIBA, indicating the generic nature of nickel geochemistry in IBA
7. The modelling has indicated that copper release from the two UK samples of fresh IBA
is dominated by copper complexed with iron oxide and particulate organic matter,
whereas copper hydroxide and hydroxide phosphates dominate the release from aged
samples. The secondary mineralisation of the sample with respect to copper hydroxide
precipitation occurs as the particulate organic matter is degraded or washed away. The
modelling highlights the continuing ageing process from the formation of very fresh ash
that still contains relatively high levels of hydrophyllic organic acids, through to full
carbonation, which will take decades, In addition to these phases a high portion of the
total copper, not accounted for in the modelling, is attributable to non-hazardous
copper metal fragments, which is highly soluble in the aqua regia used to digest the
samples. It should also be noted that the proportion of metallic copper dissolved in the
aqua regia (e.g. copper wire) is indistinguishable to the copper that is present in
inorganic phases, and is also not accounted for in the geochemical modelling. The
average concentration of Cu in the ESA dataset is 2000 mg/kg. Anecdotal evidence

WRc Ref: UC8564.10/14728-9 December 2012
© WRc plc 2012 13
indicates that 1000 mg/kg probably represents metallic copper. Similarly, excursions
above 2000 mg/kg almost certainly represent metal fragments, e.g. copper wire. The
assessment of the copper controlling phases is therefore conservative as it makes no
allowance for the metallic copper in IBA.
8. We conclude that the speciation of zinc, copper and nickel in IBA is not specific to a
particular facility but is controlled by the overall conditions present in a high
temperature oxygenated thermal treatment process.
9. It is recommended that these key phases are used to inform hazard assessment of IBA
from unless facility-specific geochemical modelling information is available.

WRc Ref: UC8564.10/14728-9 December 2012
© WRc plc 2012 14
References
ESA (2010) A sampling and testing protocol for the assessment of hazard status of incinerator bottom
ash. Environmental Services Association (2010)
Environment Agency (2011) Technical Guidance WM2 – Hazardous Waste: Interpretation of the
definition and classification of hazardous waste v2.3.
http://www.environment-agency.gov.uk/business/topics/waste/32200.aspx
CEN/TS 14405 (2004): Characterization of waste - Leaching behaviour tests - Up-flow percolation test
(under specified conditions), CEN, Brussels, Belgium.
CEN/TS 14429 (2005). Characterization of waste - Leaching behaviour tests - Influence of pH on
leaching with initial acid/base addition, CEN, Brussels, Belgium.
Garrabrants, A.C., Kosson, D.S., van der Sloot, H.A., Sanchez, F. and Hjelmar, O. (2010). “Background
Information for the Leaching Environmental Assessment Framework (LEAF) Test Methods” USEPA,
EPA/600/R-10/170.Preliminary EPA Method 1313 (2009) - Leaching test (liquid-solid partitioning as a
function of extract pH) of inorganic species in solid materials using a parallel batch extraction test. US
Environmental Protection Agency, 2009.
van der Sloot, H.A., Seignette, P.F.A.B., Meeussen, J.C.L., Hjelmar, O. and Kosson, D.S. (2008). A
database, speciation modelling and decision support tool for soil, sludge, sediments, wastes and
construction products: LeachXS™- Orchestra. In: Second international symposium on energy from
biomass and waste, Venice 2008.
WRc (2011). IBA characterisation data to support geochemical modelling. Analysis report UC8547-draft
March 2011. Kathy Lewin, Jane Turrell, James Peacock, Victoria Benson and Andre van Zomeren.
WRc, 2011a. Statement to support the classification of IBA as non-hazardous waste.
WRc (2012) Assessment of hazard classification of UK IBA Report for the January-December 2011 IBA
dataset : UC8540.09 October 2012. Draft.
WRc Ref: UC8564.10/14728-9 December 2012
© WRc plc 2012 15
Appendix A Background Information on Waste Characterisation Tests
A1 pH-dependence leaching test
The pH-static test (CEN/TS 14429, 2005) was used to characterise the pH dependent
leaching behaviour of size reduced stabilized waste. In short, this leaching test involves
leaching the crushed material at eight pH values ranging from pH 2 to 13, each at a liquid to
solid ratio (L/S) of 10. HNO3 (10 M) and NaOH (10 M) were used to adjust the pH to the
desired value. The pH was checked and adjusted accordingly after 6 hours of equilibration.
After 48 hours, the final pH and electrical conductivity (EC) was measured, and the eluates
were filtered (0.45 µm) and analysed.
A2 Percolation test
The percolation test on the size reduced material (95% < 4 mm) was carried out according to
CEN/TS 14405:2004. In this column test 7 eluate fractions were collected within the range of
L/S = 0.1-10 l/kg. The total test duration was approximately 21 days. The leachant was
demineralised water (DMW). The test material was leached in a column operated in up-flow
mode (14 ml/h) using a column height of 30 cm and a diameter of 5 cm. The eluates were
filtered through 0.45 µm membrane filters and analysed.
A3 Chemical analysis
The eluates from the laboratory tests were analysed for major, minor and trace elements
using ICP-AES, for DOC using a Shimadzu 5000-a TOC analyser, for anions using ion-
chromatography and for cyanides (total and free) using photometry.
A4 Test data presentation
The characterisation of the leaching behaviour of materials like IBA is best carried out by a
combination of the pH dependence leaching test (CEN/TS 14429), and a percolation test
(CEN/TS 14405), as this combination allows many conclusions on release behaviour to be
drawn (including the long term and after full disintegration). It also provides a reference base
for comparison with any type of other leaching test. Plots are presented in the following
Appendices, with explanation in the first section of each. Note: the repeatability in the test
data is good for both leaching test methods2 and we can be confident in these comparisons.
2 A partial validation of both methods is ongoing in parallel with the validation of draft EPA methods 1313 and 1314 (6. Garrabrants, A.C., Kosson, D.S., van der Sloot, H.A., Sanchez, F., and Hjelmar, O., 2010. “Background Information for the Leaching Environmental Assessment Framework (LEAF) Test Methods” USEPA, EPA/600/R-10/170.).
WRc Ref: UC8564.10/14728-9 December 2012
© WRc plc 2012 16
Appendix B Leaching Test Data in Context of Dataset for UK Aged IBA
In this Appendix leaching data is compared with the UK dataset for incinerator bottom ash
generated in 2006. Data from the pH dependence test (CEN/TS14429), and the upflow
percolation test (CEN/TS14405) are shown.
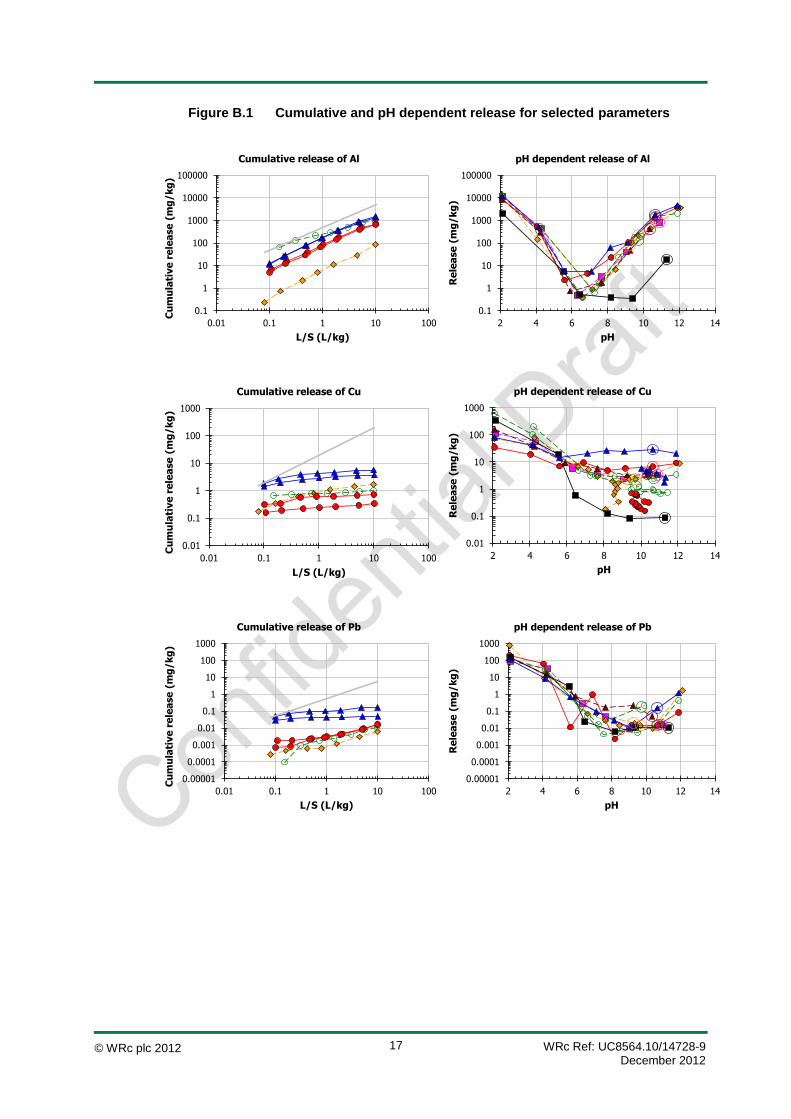
It can be seen that all the data from the two bottom ash samples tested (labelled here MBA
UK1 and MBA UK2) were within the 90% confidence limits for the worldwide data, and
generally showed good agreement with the average. The graph of cumulative release versus
L/S allows conclusions on the main release mechanism. If a slope of one is observed, release
is controlled by solubility limitations. If the release curve is horizontal (= no further release with
increasing L/S), this points to depletion of a fully dissolved species (e.g. Cl).
For the pH dependence plot, the range that is relevant for what species are present in the IBA
are between the natural pH of the IBA (pH 11-12) and pH of fully carbonated IBA (pH 7.5).
WRc Ref: UC8564.10/14728-9 December 2012
© WRc plc 2012 17
Figure B.1 Cumulative and pH dependent release for selected parameters
0.1
1
10
100
1000
10000
100000
0.01 0.1 1 10 100
Cu
mu
lati
ve
re
lea
se
(m
g/k
g)
L/S (L/kg)
Cumulative release of Al
0.1
1
10
100
1000
10000
100000
2 4 6 8 10 12 14
Re
lea
se
(m
g/k
g)
pH
pH dependent release of Al
0.01
0.1
1
10
100
1000
0.01 0.1 1 10 100
Cu
mu
lati
ve
re
lea
se
(m
g/k
g)
L/S (L/kg)
Cumulative release of Cu
0.01
0.1
1
10
100
1000
2 4 6 8 10 12 14
Re
lea
se
(m
g/k
g)
pH
pH dependent release of Cu
0.00001
0.0001
0.001
0.01
0.1
1
10
100
1000
0.01 0.1 1 10 100
Cu
mu
lati
ve
re
lea
se
(m
g/k
g)
L/S (L/kg)
Cumulative release of Pb
0.00001
0.0001
0.001
0.01
0.1
1
10
100
1000
2 4 6 8 10 12 14
Re
lea
se
(m
g/k
g)
pH
pH dependent release of Pb

WRc Ref: UC8564.10/14728-9 December 2012
© WRc plc 2012 18
0.001
0.01
0.1
1
10
100
1000
10000
0.01 0.1 1 10 100
Cu
mu
lati
ve
re
lea
se
(m
g/k
g)
L/S (L/kg)
Cumulative release of Zn
0.001
0.01
0.1
1
10
100
1000
10000
2 4 6 8 10 12 14
Re
lea
se
(m
g/k
g)
pH
pH dependent release of Zn
1
10
100
1000
10000
100000
0.01 0.1 1 10 100
Cu
mu
lati
ve
re
lea
se
(m
g/k
g)
L/S (L/kg)
Cumulative release of SO4
1
10
100
1000
10000
100000
2 4 6 8 10 12 14
Re
lea
se
(m
g/k
g)
pH
pH dependent release of SO4
1
10
100
1000
10000
100000
0.01 0.1 1 10 100
Cu
mu
lati
ve
re
lea
se
(m
g/k
g)
L/S (L/kg)
Cumulative release of DOC
1
10
100
1000
10000
100000
2 4 6 8 10 12 14
Re
lea
se
(m
g/k
g)
pH
pH dependent release of DOC
0.01
10000
2 4 6 8 10 12 14Co
nce
ntr
ati
on
(m
g/L)
pH
pH dependent concentration of AlMBA UK B own pH MBA UK C MBA UK C own pH MBA UK C own pH MBA UK E
MBA UK E own pH MBA UK E own pH MBA UK1 MBA UK 1 MBA UK 1 own pH
MBA UK A own pH MBA UK D own pH MBA UK 2 MBA UK 2 own pH
WRc Ref: UC8564.10/14728-9 December 2012
© WRc plc 2012 19
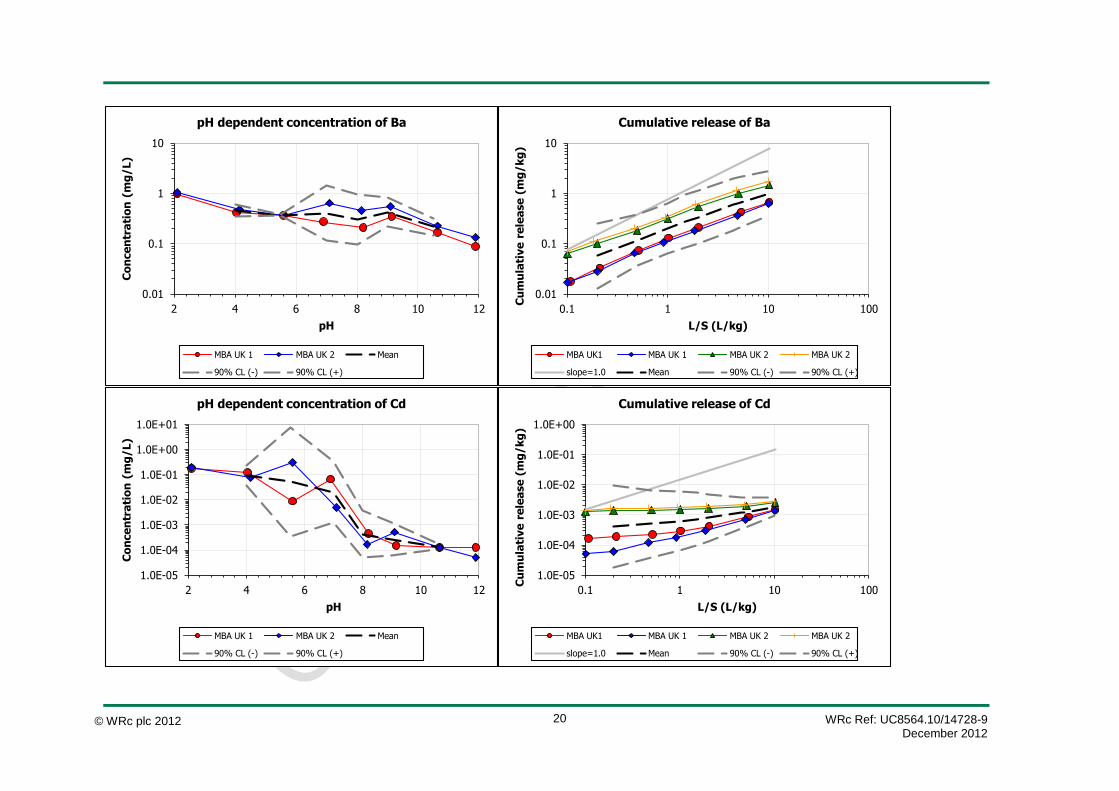
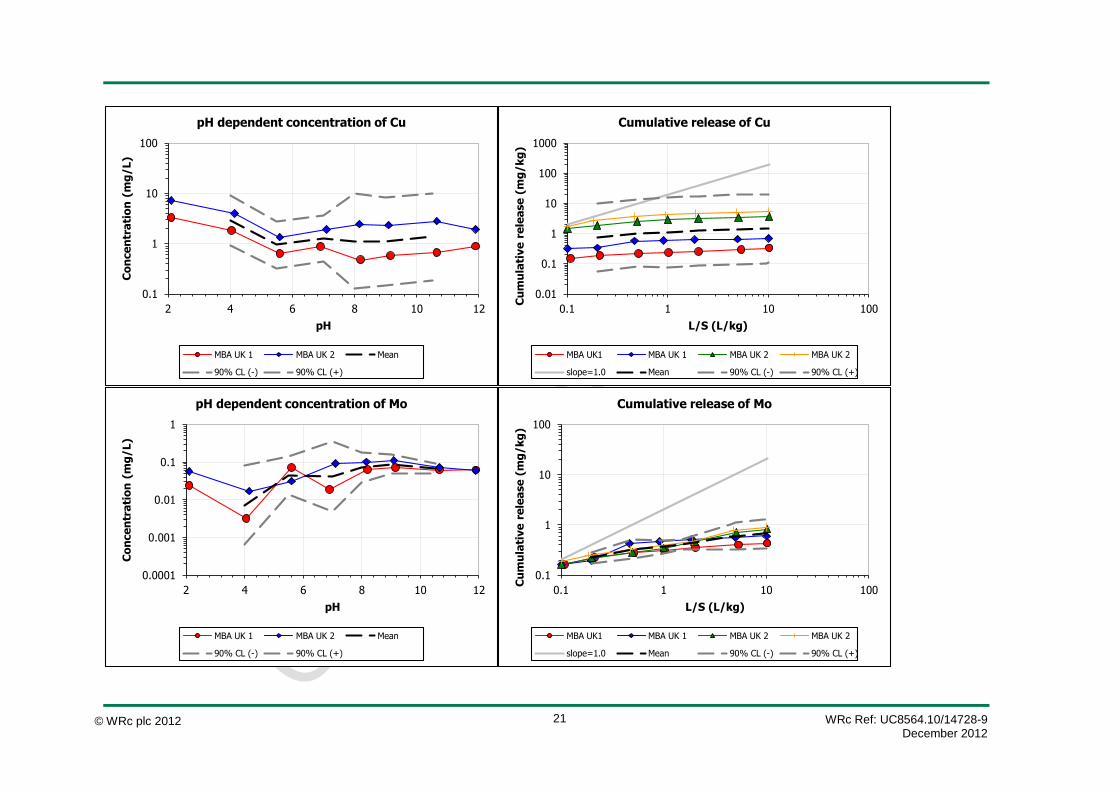
Appendix C Leaching Test Data in Context of Worldwide Dataset
In this Appendix leaching data is compared with the worldwide dataset for incinerator bottom
ash. Data from the pH dependence test are shown on the left (TS14429), with the upflow
percolation test data across varying liquid to solid ratios shown on the right (TS14405).
The average for all data is shown by the black dashed line, with the upper and lower 90%
confidence intervals shown by the grey dashed lines.
It can be seen that all the data from the two bottom ash samples tested were within the 90%
confidence limits for the worldwide data, and generally showed good agreement with the
average.
Note: in the following appendices the labels MBA UK1 and MBA UK2 refer to samples
UK IBA1 and UK IBA2
WRc Ref: UC8564.10/14728-9 December 2012
© WRc plc 2012 20
0.01
0.1
1
10
2 4 6 8 10 12
Co
nce
ntr
ati
on
(m
g/L)
pH
pH dependent concentration of Ba
MBA UK 1 MBA UK 2 Mean
90% CL (-) 90% CL (+)
0.01
0.1
1
10
0.1 1 10 100
Cu
mu
lati
ve
re
lea
se
(m
g/k
g)
L/S (L/kg)
Cumulative release of Ba
MBA UK1 MBA UK 1 MBA UK 2 MBA UK 2
slope=1.0 Mean 90% CL (-) 90% CL (+)
1.0E-05
1.0E-04
1.0E-03
1.0E-02
1.0E-01
1.0E+00
1.0E+01
2 4 6 8 10 12
Co
nce
ntr
ati
on
(m
g/L)
pH
pH dependent concentration of Cd
MBA UK 1 MBA UK 2 Mean
90% CL (-) 90% CL (+)
1.0E-05
1.0E-04
1.0E-03
1.0E-02
1.0E-01
1.0E+00
0.1 1 10 100
Cu
mu
lati
ve
re
lea
se
(m
g/k
g)
L/S (L/kg)
Cumulative release of Cd
MBA UK1 MBA UK 1 MBA UK 2 MBA UK 2
slope=1.0 Mean 90% CL (-) 90% CL (+)
WRc Ref: UC8564.10/14728-9 December 2012
© WRc plc 2012 21
0.1
1
10
100
2 4 6 8 10 12
Co
nce
ntr
ati
on
(m
g/L)
pH
pH dependent concentration of Cu
MBA UK 1 MBA UK 2 Mean
90% CL (-) 90% CL (+)
0.01
0.1
1
10
100
1000
0.1 1 10 100
Cu
mu
lati
ve
re
lea
se
(m
g/k
g)
L/S (L/kg)
Cumulative release of Cu
MBA UK1 MBA UK 1 MBA UK 2 MBA UK 2
slope=1.0 Mean 90% CL (-) 90% CL (+)
0.0001
0.001
0.01
0.1
1
2 4 6 8 10 12
Co
nce
ntr
ati
on
(m
g/L)
pH
pH dependent concentration of Mo
MBA UK 1 MBA UK 2 Mean
90% CL (-) 90% CL (+)
0.1
1
10
100
0.1 1 10 100
Cu
mu
lati
ve
re
lea
se
(m
g/k
g)
L/S (L/kg)
Cumulative release of Mo
MBA UK1 MBA UK 1 MBA UK 2 MBA UK 2
slope=1.0 Mean 90% CL (-) 90% CL (+)

WRc Ref: UC8564.10/14728-9 December 2012
© WRc plc 2012 22
0.0001
0.001
0.01
0.1
1
10
100
1000
2 4 6 8 10 12
Co
nce
ntr
ati
on
(m
g/L)
pH
pH dependent concentration of Zn
MBA UK 1 MBA UK 2 Mean
90% CL (-) 90% CL (+)
0.001
0.01
0.1
1
10
100
0.1 1 10 100
Cu
mu
lati
ve
re
lea
se
(m
g/k
g)
L/S (L/kg)
Cumulative release of Zn
MBA UK1 MBA UK 1 MBA UK 2 MBA UK 2
slope=1.0 Mean 90% CL (-) 90% CL (+)
WRc Ref: UC8564.10/14728-9 December 2012
© WRc plc 2012 23
Appendix D Geochemical Speciation Modelling of IBA Generated Using Zinc as Example Species
Chemical speciation of the eluates obtained from the pH dependence (CEN/TS14429) and
percolation leaching test (CEN/TS14405) carried out on IBA1 and IBA2 was calculated using
the ORCHESTRA modelling framework (Meeussen, 2003). Aqueous speciation reactions and
selected mineral precipitates were taken from the MINTEQA2 database. Ion adsorption onto
organic matter was calculated with the NICA-Donnan model (Kinniburgh et al., 1999), with the
generic adsorption reactions as published by Milne et al. (Milne et al., 2001; Milne et al.,
2003). Adsorption of ions onto iron and aluminium oxides was modelled according to the
generalized two layer model of Dzombak and Morel (Dzombak and Morel, 1990).
The database/expert system LeachXSTM
(www.leachxs.net) was used for data management
and for visualization of the calculated and measured results (van der Sloot et al., 2001; van
der Sloot et al., 2003; van der Sloot et al., 2007; van der Sloot et al., 2008). The coupled
LEACHXS - ORCHESTRA combination allows for very quick data retrieval, automatic input
generation for modelling, processing of calculated results and graphical and tabular data
presentation.
The input to the model consists of metal availabilities, selected possible solubility controlling
minerals, active Fe-and Al-oxide sites (Fe- and Al-oxides were summed and used as input for
hydrous ferrous oxide (HFO) as described by Meima and Comans (Meima and Comans,
1998)), particulate organic matter and a description of the DOC concentration as a function of
pH (polynomial curve fitting procedure). The DOC analysis of the extracts does not represent
the reactive part of the dissolved organic matter. Based on experience with other similar
samples, where the quantification between hydrophilic, fulvic and humic acid fraction in DOC
has been quantified, reactive fractions of DOC are defined as a function of pH (lowest
proportion of reactive forms at neutral pH and increasing towards both low and high pH (van
Zomeren and Comans, 2007)). A polynomial fit is created through the eight data points to
allow quantification of the reactive DOC at intermediate pH values in modelling. Basically, the
speciation of all elements is calculated using a single problem definition in the model with the
same parameter settings. This limits the degrees of freedom in selected parameter settings
considerably, as improvement of the model description for one element may worsen the
outcome for other elements. The maximum value as obtained in the pH dependence leaching
test (between pH 3 and 13) was used as the available concentration. Total inorganic carbon
(TIC) in eluate is not a good measure for the actual carbonate level as upon acidification
carbonate is lost from solution as CO2. This means that TIC (recalculated as carbonate) in the
solid must be taken as the available quantity.
The mineral phases that were allowed to precipitate were selected after calculation of their
respective Saturation Indices (SI) in the original pH dependence leaching test eluates.

WRc Ref: UC8564.10/14728-9 December 2012
© WRc plc 2012 24
Saturation indices were calculated for all > 650 minerals in the thermodynamic database and
a selection of the most likely and relevant phases was made based on the degree of fit over a
wide pH range and the closeness of the SI value to 0 and an expert judgment on suitability of
possible minerals for the waste mixture (e.g. exclusion of high temperature minerals).
Generally, minerals were selected if the SI was in the range of -0.2 to 0.2 for more than two
pH data points. Since the SI calculation does not take competition between substances for the
same sorption sites into account, sometimes phases prove to be relevant that do not seem
relevant from an SI calculation. In addition, phases may appear relevant based on SI
calculation, but are of no relevance due to the slow kinetics of dissolution (Nordstrom, 2009).
This relates in particular to several clay minerals and rock phases. Finally, it should be
realised that there is a significant difference between minerals identified by XRD on bulk
samples and the mineral and sorptive phases controlling leachability. The latter are
sometimes minor quantities present as coatings on particles.
The model results for the MSW IBA, compared with the original pH dependence test data, are
provided in Appendix E. In all cases, the percolation test data are given for comparison, as
the modelling is carried out with the same parameter settings both at L/S=10 and at L/S
around 0.2 to assess the validity of the mineral and sorption parameter selection for both a
wide pH range as well as a wide L/S range.
The starting point for the modelling is the L/S=10 leach test dataset. The optimization of the
mineral selection is based on obtaining a prediction that provides the closest fit between
model and actual test results. The low L/S modelling (around 0.2) using the first fraction of the
percolation test, is meant to test whether the same selection of minerals or a slight
modification can simultaneously predict the release behaviour at low L/S under the
assumption that local equilibrium prevails.
Based on the preliminary model run to determine SI values, expert knowledge (relevant
mineral phases formed under ambient conditions) a preliminary set of minerals is identified to
run the model. Based on a criterion of less than 1‰ of the element present in a given mineral
phase, the selection of relevant minerals can be narrowed down.
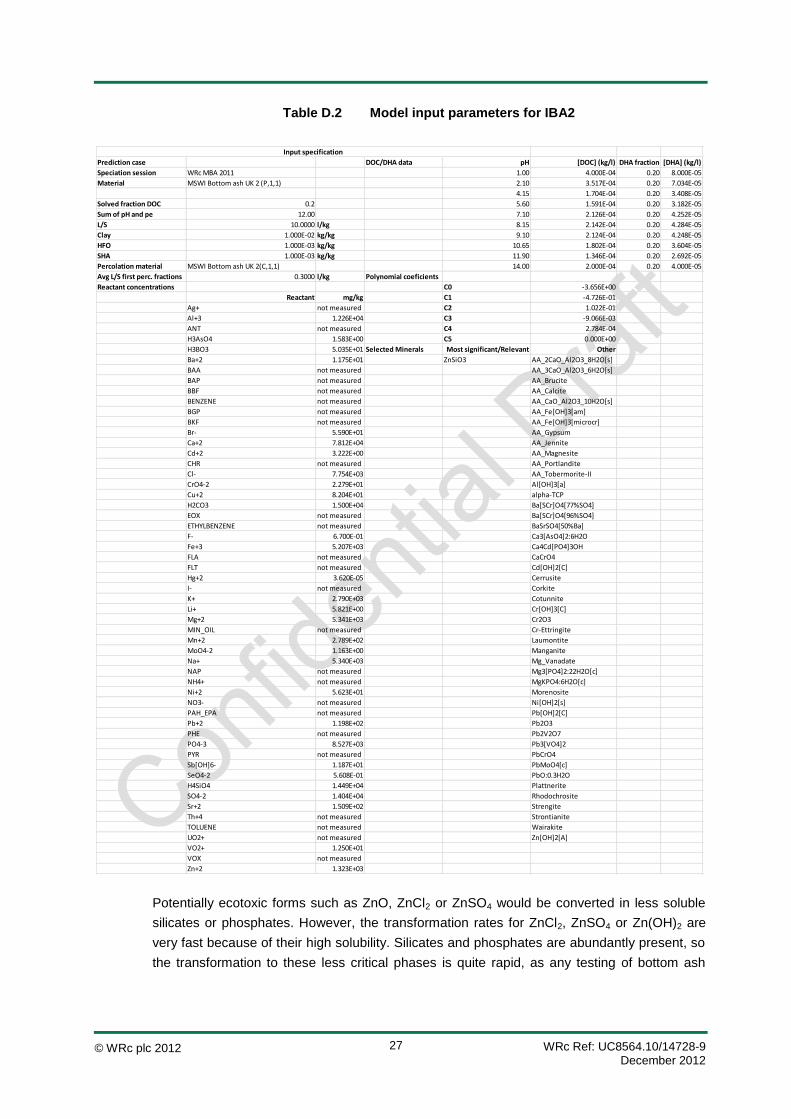
Some 25 elements are taken along in the chemical speciation modelling for the MSWI bottom
ashes. The input parameters for the modelling are given in Tables D1 and D2 for IBA1 and
IBA2 respectively. These comprise the element availabilities, the mineral selection, the
content of clay to the extent relevant, the quantity of reactive Fe- and Al- oxide surfaces and
the reactive part of particulate and dissolved organic matter. The selection of minerals for the
calculation run is wider than the actual minerals found to be of relevance. The material
properties in terms of element availabilities, Fe- and Al-oxide quantity, clay content, relevant
minerals and reactive particulate (designated as solid humic acid - SHA) and dissolved
organic matter (designated as dissolved humic acid DHA) form a chemical speciation
fingerprint (CSF) for the material of interest. This chemical speciation fingerprint (CSF) is used
in subsequent chemical reaction transport modelling as a starting point. It is also a good
starting point for any new sample of MSWI bottom ash, since most minerals identified here
WRc Ref: UC8564.10/14728-9 December 2012
© WRc plc 2012 25
will be relevant in such unknown samples, while the parameter settings for reactive surfaces
may not be too far off.
The multi-element chemical speciation modelling is complex, but still proves very feasible as
the run-time is mostly within two minutes. In the speciation modelling the outcome of the
model result is optimized by iteration by applying changes in the mineral assemblage. A
preliminary model run using saturation indices is used for guidance in this process. As
simultaneously a model run at L/S=10 and L/S around 0.2 is carried out with the same mineral
set and the same sorption properties, a good match for a wide spectrum of major, minor and
trace elements is an indication that a converging solution is approached. Multiple interactions
take place, implying that absolutely wrong choices of a mineral or a sorption property will
show as a significant deviation from the actual measurement. As the modelling assumes
equilibrium and it is certain that in the test equilibrium is not fully reached, in some cases a
difference between model and measurement cannot be resolved. Such cases can only be
recognized by running tests at different contact times. In the work by Dijkstra et al. (2006) this
influence of kinetics has been clearly demonstrated. In other cases the stability constants may
not be well defined. This is particularly the case for some less common trace elements like
Sb, V and Mo. In comparison with the total Zn content of MBA UK1 and MBA UK2 of 2514
and 1963 mg/kg, the maximum fraction available for leaching amounts to respectively 1233
and 1323 mg/kg3.
To assess the question in what chemical form Zn is present in MSWI bottom ash, the
optimized model description has been used as basis to select other Zn minerals than the ones
optimally describing the release behaviour. This implies running the model with respectively,
ZnO, Cazincate, Zn(OH)2, Willemite (ZnSiO4), Ca4Zn(PO4)3OH,d ZnCl2 and Bianchite
(Zn0.75Fe2+
0.25(SO4)•6(H2O)).
Since the full description matches with the measured concentrations of major, minor and trace
elements for both ashes quite well, this indicates that the complex mixture is rather well
described. The description of Zn matches quite good for either ZnSiO3 or Ca4Zn(PO4)3OH.
The other phases - ZnO, Cazincate, Zn(OH)2, Willemite (ZnSiO4), ZnCl2 and Bianchite
(Zn0.75Fe2+
0.25(SO4)•6(H2O)) show a poor match and therefore cannot be considered to be
controlling release.
3 This is the highest concentration released during the pH dependence leaching test, in this case, at pH2.

WRc Ref: UC8564.10/14728-9 December 2012
© WRc plc 2012 26
Table D.1 Model input parameters for IBA1
Prediction case DOC/DHA data pH [DOC] (kg/l) DHA fraction [DHA] (kg/l)
Speciation session WRc MBA 2011 1.00 9.000E-05 0.20 1.800E-05
Material MSWI Bottom ash UK 1 (P,1,1) 2.10 8.370E-05 0.20 1.674E-05
4.05 4.380E-05 0.20 8.760E-06
Solved fraction DOC 0.2 5.60 5.620E-05 0.20 1.124E-05
Sum of pH and pe 11.00 6.90 4.780E-05 0.20 9.560E-06
L/S 10.4565 l/kg 8.20 4.820E-05 0.20 9.640E-06
Clay 1.000E-02 kg/kg 9.15 4.910E-05 0.22 1.080E-05
HFO 1.700E-03 kg/kg 10.65 5.025E-05 0.25 1.256E-05
SHA 4.000E-04 kg/kg 11.90 5.160E-05 0.28 1.445E-05
Percolation material MSWI Bottom ash UK 1 (C,1,1) 14.00 6.000E-05 0.32 1.920E-05
Avg L/S first perc. fractions 0.3000 l/kg Polynomial coeficients
Reactant concentrations C0 -4.586E+00
Reactant mg/kg C1 -1.501E-01
Ag+ not measured C2 1.520E-02
Al+3 8.861E+03 C3 -3.675E-04
ANT not measured C4 0.000E+00
H3AsO4 1.507E+00 C5 0.000E+00
H3BO3 6.684E+01 Selected Minerals Most significant/Relevant Other
Ba+2 1.044E+01 ZnSiO3 AA_2CaO_Al2O3_8H2O[s]
BAA not measured AA_3CaO_Al2O3_6H2O[s]
BAP not measured AA_Brucite
BBF not measured AA_Calcite
BENZENE not measured AA_CaO_Al2O3_10H2O[s]
BGP not measured AA_Fe[OH]3[am]
BKF not measured AA_Fe[OH]3[microcr]
Br- 1.700E+01 AA_Gypsum
Ca+2 5.555E+04 AA_Jennite
Cd+2 1.886E+00 AA_Magnesite
CHR not measured AA_Portlandite
Cl- 4.311E+03 AA_Tobermorite-II
CrO4-2 1.491E+01 Al[OH]3[a]
Cu+2 3.526E+01 alpha-TCP
H2CO3 1.090E+04 Ba[SCr]O4[77%SO4]
EOX not measured BaSrSO4[50%Ba]
ETHYLBENZENE not measured Ca3[AsO4]2:6H2O
F- 3.600E-01 Ca4Cd[PO4]3Cl
Fe+3 6.096E+03 Ca4Cd[PO4]3OH
FLA not measured CaCrO4
FLT not measured CaSeO4:2H2O
Hg+2 3.543E-05 Cd[OH]2[C]
I- not measured Cr[OH]3[C]
K+ 2.528E+03 CuCO3[s]
Li+ 5.029E+00 Fe_Vanadate
Mg+2 5.425E+03 Fe2[MoO4]3[1]
MIN_OIL not measured Fluorite
Mn+2 2.462E+02 Laumontite
MoO4-2 7.897E-01 Manganite
Na+ 1.564E+03 Mg3[PO4]2:22H2O[c]
NAP not measured MgKPO4:6H2O[c]
NH4+ not measured Ni[OH]2[s]
Ni+2 2.365E+01 Pb[OH]2[C]
NO3- not measured Pb2V2O7
PAH_EPA not measured Pb3[VO4]2
Pb+2 2.022E+02 PbCrO4
PHE not measured PbMoO4[c]
PO4-3 5.711E+03 Rhodochrosite
PYR not measured Sb[OH]3[s]
Sb[OH]6- 7.594E+00 Strengite
SeO4-2 7.580E-01 Strontianite
H4SiO4 1.180E+04 Wairakite
SO4-2 1.071E+04 Willemite
Sr+2 1.151E+02
Th+4 not measured
TOLUENE not measured
UO2+ not measured
VO2+ 2.277E+01
VOX not measured
Zn+2 1.233E+03
Input specification
WRc Ref: UC8564.10/14728-9 December 2012
© WRc plc 2012 27
Table D.2 Model input parameters for IBA2
Potentially ecotoxic forms such as ZnO, ZnCl2 or ZnSO4 would be converted in less soluble
silicates or phosphates. However, the transformation rates for ZnCl2, ZnSO4 or Zn(OH)2 are
very fast because of their high solubility. Silicates and phosphates are abundantly present, so
the transformation to these less critical phases is quite rapid, as any testing of bottom ash
Prediction case DOC/DHA data pH [DOC] (kg/l) DHA fraction [DHA] (kg/l)
Speciation session WRc MBA 2011 1.00 4.000E-04 0.20 8.000E-05
Material MSWI Bottom ash UK 2 (P,1,1) 2.10 3.517E-04 0.20 7.034E-05
4.15 1.704E-04 0.20 3.408E-05
Solved fraction DOC 0.2 5.60 1.591E-04 0.20 3.182E-05
Sum of pH and pe 12.00 7.10 2.126E-04 0.20 4.252E-05
L/S 10.0000 l/kg 8.15 2.142E-04 0.20 4.284E-05
Clay 1.000E-02 kg/kg 9.10 2.124E-04 0.20 4.248E-05
HFO 1.000E-03 kg/kg 10.65 1.802E-04 0.20 3.604E-05
SHA 1.000E-03 kg/kg 11.90 1.346E-04 0.20 2.692E-05
Percolation material MSWI Bottom ash UK 2(C,1,1) 14.00 2.000E-04 0.20 4.000E-05
Avg L/S first perc. fractions 0.3000 l/kg Polynomial coeficients
Reactant concentrations C0 -3.656E+00
Reactant mg/kg C1 -4.726E-01
Ag+ not measured C2 1.022E-01
Al+3 1.226E+04 C3 -9.066E-03
ANT not measured C4 2.784E-04
H3AsO4 1.583E+00 C5 0.000E+00
H3BO3 5.035E+01 Selected Minerals Most significant/Relevant Other
Ba+2 1.175E+01 ZnSiO3 AA_2CaO_Al2O3_8H2O[s]
BAA not measured AA_3CaO_Al2O3_6H2O[s]
BAP not measured AA_Brucite
BBF not measured AA_Calcite
BENZENE not measured AA_CaO_Al2O3_10H2O[s]
BGP not measured AA_Fe[OH]3[am]
BKF not measured AA_Fe[OH]3[microcr]
Br- 5.590E+01 AA_Gypsum
Ca+2 7.812E+04 AA_Jennite
Cd+2 3.222E+00 AA_Magnesite
CHR not measured AA_Portlandite
Cl- 7.754E+03 AA_Tobermorite-II
CrO4-2 2.279E+01 Al[OH]3[a]
Cu+2 8.204E+01 alpha-TCP
H2CO3 1.500E+04 Ba[SCr]O4[77%SO4]
EOX not measured Ba[SCr]O4[96%SO4]
ETHYLBENZENE not measured BaSrSO4[50%Ba]
F- 6.700E-01 Ca3[AsO4]2:6H2O
Fe+3 5.207E+03 Ca4Cd[PO4]3OH
FLA not measured CaCrO4
FLT not measured Cd[OH]2[C]
Hg+2 3.620E-05 Cerrusite
I- not measured Corkite
K+ 2.790E+03 Cotunnite
Li+ 5.821E+00 Cr[OH]3[C]
Mg+2 5.341E+03 Cr2O3
MIN_OIL not measured Cr-Ettringite
Mn+2 2.789E+02 Laumontite
MoO4-2 1.163E+00 Manganite
Na+ 5.340E+03 Mg_Vanadate
NAP not measured Mg3[PO4]2:22H2O[c]
NH4+ not measured MgKPO4:6H2O[c]
Ni+2 5.623E+01 Morenosite
NO3- not measured Ni[OH]2[s]
PAH_EPA not measured Pb[OH]2[C]
Pb+2 1.198E+02 Pb2O3
PHE not measured Pb2V2O7
PO4-3 8.527E+03 Pb3[VO4]2
PYR not measured PbCrO4
Sb[OH]6- 1.187E+01 PbMoO4[c]
SeO4-2 5.608E-01 PbO:0.3H2O
H4SiO4 1.449E+04 Plattnerite
SO4-2 1.404E+04 Rhodochrosite
Sr+2 1.509E+02 Strengite
Th+4 not measured Strontianite
TOLUENE not measured Wairakite
UO2+ not measured Zn[OH]2[A]
VO2+ 1.250E+01
VOX not measured
Zn+2 1.323E+03
Input specification
WRc Ref: UC8564.10/14728-9 December 2012
© WRc plc 2012 28
fresh or aged shows the same solubility control. The presence of these more soluble phases
in a MSWI bottom ash matrix is thus highly unlikely.
Since the full description matches with the measured concentrations of major, minor and trace
elements for both ashes quite well, this indicates that the complex mixture is rather well
described. The description of Zn matches quite well for either ZnSiO3 or Ca4Zn(PO4)3OH. The
other phases - ZnO, Cazincate, Zn(OH)2, Willemite (ZnSiO4), ZnCl2 and Bianchite
(Zn0.75Fe2+
0.25(SO4)•6(H2O)) show a poor match with the measured concentrations i.e.
undersaturation with respect to the tested phases. This implies that the latter phases are not
relevant from a leaching perspective over the pH range of relevance to MSWI bottom ash in
normal exposure conditions. In the field these are defined by the initial pH of the bottom ash
(around pH 12) and a full carbonated bottom ash (pH around 7.5). The fraction available for
leaching is a quantity that under any field exposure scenario is very unlikely to be released.
On the exposed surfaces of particles, Zn will be present as ZnSiO3 or Ca4Zn(PO4)3OH
solubility control by these phases over a wide pH domain. A small part of the leachable Zn
fraction is associated with DOC and may be leached. Zn-DOC is less readily available for
organisms than free Zn2+
. The fraction of Zn-DOC is relatively small.
References
CEN/TS 14405 (2004): Characterization of waste - Leaching behaviour tests - Up-flow
percolation test (under specified conditions), CEN, Brussels, Belgium.
CEN/TS 14429 (2005). Characterization of waste - Leaching behaviour tests - Influence of pH
on leaching with initial acid/base addition, CEN, Brussels, Belgium.
CEN/TS 14997 (2005). Characterization of waste - Leaching behaviour tests - Influence of pH
on leaching with continuous pH control. CEN/TC292.
Dijkstra, J.J., van der Sloot, H.A. and Comans, R.N.J. (2006). The leaching of major and trace
elements from MSWI bottom ash as a function of pH and time, Appl. Geochem. 21, 335-351.
Dzombak, D.A. and Morel, F.M.M. (1990). Surface complexation modelling: hydrous ferric
oxide, John Wiley & Sons, Inc., New York.
ISO/TS 21268-3, Soil quality - Leaching procedures for subsequent chemical and
ecotoxicological testing of soil and soil materials - Part 3: Up-flow column test, ISO. 2007.
ISO/TS 21268-4, Soil quality - Leaching procedures for subsequent chemical and
ecotoxicological testing of soil and soil materials - Part 4: Influence of pH on leaching with
initial acid/base addition, ISO. 2007.
WRc Ref: UC8564.10/14728-9 December 2012
© WRc plc 2012 29
ISO/DIS12782 parts 1-5 (2010) Soil quality - Parameters for geochemical modelling of
leaching and speciation of constituents in soils and soil materials - Part 1: Extraction of
amorphous iron (hydr)oxides with ascorbic acid; Part 2: Extraction of crystalline iron
(hydr)oxides with dithionite; Part 3: Extraction of aluminium (hydr)oxides with ammonium
oxalate - oxalic acid; Part 4: Extraction of humic substances from solid samples. Part 5:
Extraction of humic substances from aqueous samples. ISO, Geneve, Switzerland.
Kinniburgh, D.G., van Riemsdijk, W.H., Koopal, L.K., Borkovec, M., Benedetti, M.F. and
Avena, M.J. (1999). Ion binding to natural organic matter: competition, heterogeneity,
stoichiometry and thermodynamic consistency, J. Colloids Surf., A, Vol. 151, pp. 147-166.
Kostka, J.E. and Luther III, G.W. (1994). “Partitioning and speciation of solid phase iron in
saltmarsh sediments”, Geochim. Cosmochim. Acta, 58, 1701-1710.
LeachXS Lite - http://www.vanderbilt.edu/leaching/downloads.html
Meeussen, J.C.L. (2003). “ORCHESTRA: An object-oriented framework for implementing
chemical equilibrium models”, Environ. Sci. Technol., 37, 1175-1182.
Meima, J.A. and Comans, R.N.J. (1998). Application of surface complexation/precipitation
modelling to contaminant leaching from weathered municipal solid waste incinerator bottom
ash, Environ. Sci. Technol., 32, 688-693.
Milne, C.J., Kinniburgh, D.G., van Riemsdijk, W.H. and Tipping, E. (2003). Generic NICA-
Donnan model parameters for metal-ion binding by humic substances, Environ. Sci. Technol.,
Vol. 37, pp. 958-971.
Garrabrants, A.C., Kosson, D.S., van der Sloot, H.A., Sanchez, F. and Hjelmar, O. 2010.
“Background Information for the Leaching Environmental Assessment Framework (LEAF)
Test Methods” USEPA, EPA/600/R-10/170.Preliminary EPA Method 1313 (2009) - Leaching
test (liquid-solid partitioning as a function of extract ph) of inorganic species in solid materials
using a parallel batch.
van der Sloot (2001) Integration of lab-scale testing, lysimeter studies and pilot scale
monitoring of a predominantly inorganic waste landfill to reach sustainable landfill conditions,
Conference Proceeding, van der Sloot, H.A. van Zomeren, A. Rietra, R.P.J.J. Hoede, D.
Scharff, H. Pula, Cagliari, Italy CISA - Environmental Sanitary Engineering Centre, Eighth
International waste management and landfill symposium.
van der Sloot. (2003) Evaluation of environmental aspects of alternative materials using an
integrated approach assisted by a database, Conference Proceeding, van der Sloot, H.A.
Seignette, P. Comans, R.N.J. van Dijkstra, J.J. Meeussen, J.C.L. Kosson, D.S. Hjelmar, O.
2003769790, University of Dundee, Dundee, Scotland, Conference on advances in waste
management and recycling.

WRc Ref: UC8564.10/14728-9 December 2012
© WRc plc 2012 30
van der Sloot. (2007) Interpretation of test method selection, validation against field data, and
predictive modelling for impact evaluation of stabilised waste disposal, Journal, van der Sloot,
H.A. van Zomeren, A. Meeussen, J.C.L. Seignette, P. Bleijerveld, Journal of Hazardous
Materials.
van der Sloot. (2008) Characterisation of waste through leaching and geochemical modelling
to evaluate reuse potential, treatment options and disposal, van der Sloot, H.A. Hjelmar, O.
Kosson, D.S. 2007 S. Margherita di Pula, Cagliari, Italy CISA - Environmental Sanitary
Engineering Centre, Cagliari, Italy 11th international waste management and landfill
symposium.
WRc Ref: UC8564.10/14728-9 December 2012
© WRc plc 2012 31
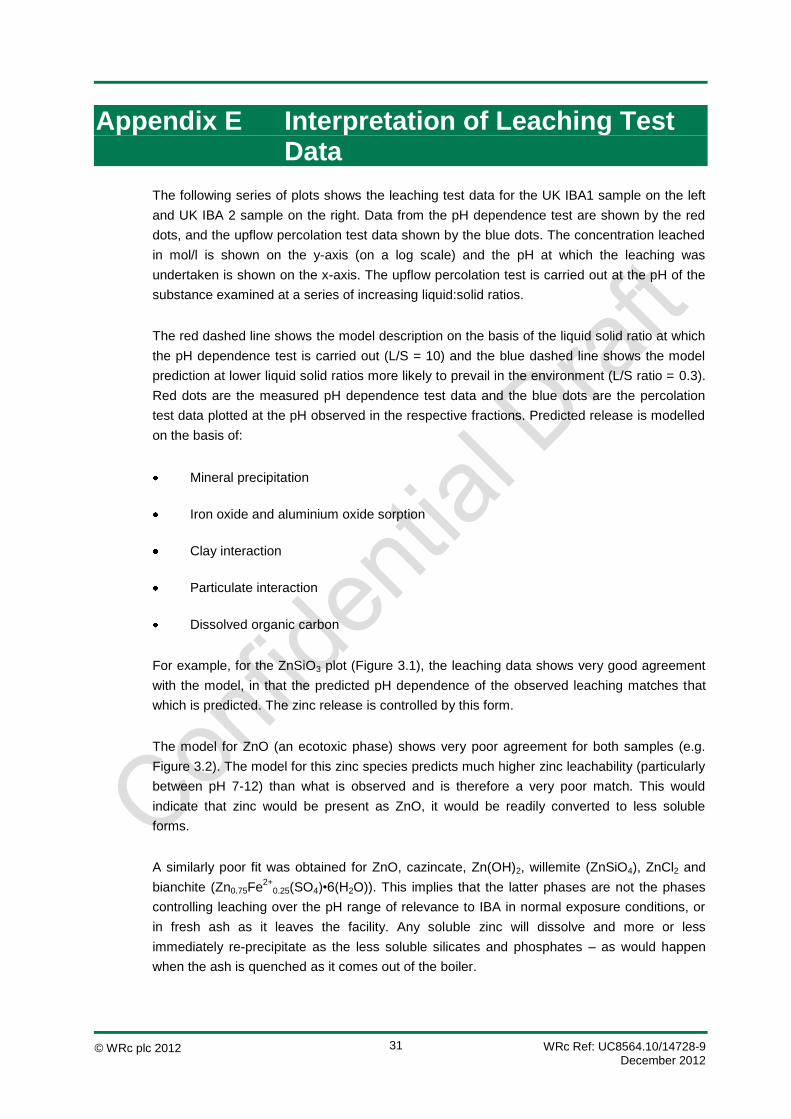
Appendix E Interpretation of Leaching Test Data
The following series of plots shows the leaching test data for the UK IBA1 sample on the left
and UK IBA 2 sample on the right. Data from the pH dependence test are shown by the red
dots, and the upflow percolation test data shown by the blue dots. The concentration leached
in mol/l is shown on the y-axis (on a log scale) and the pH at which the leaching was
undertaken is shown on the x-axis. The upflow percolation test is carried out at the pH of the
substance examined at a series of increasing liquid:solid ratios.
The red dashed line shows the model description on the basis of the liquid solid ratio at which
the pH dependence test is carried out (L/S = 10) and the blue dashed line shows the model
prediction at lower liquid solid ratios more likely to prevail in the environment (L/S ratio = 0.3).
Red dots are the measured pH dependence test data and the blue dots are the percolation
test data plotted at the pH observed in the respective fractions. Predicted release is modelled
on the basis of:
Mineral precipitation
Iron oxide and aluminium oxide sorption
Clay interaction
Particulate interaction
Dissolved organic carbon
For example, for the ZnSiO3 plot (Figure 3.1), the leaching data shows very good agreement
with the model, in that the predicted pH dependence of the observed leaching matches that
which is predicted. The zinc release is controlled by this form.
The model for ZnO (an ecotoxic phase) shows very poor agreement for both samples (e.g.
Figure 3.2). The model for this zinc species predicts much higher zinc leachability (particularly
between pH 7-12) than what is observed and is therefore a very poor match. This would
indicate that zinc would be present as ZnO, it would be readily converted to less soluble
forms.
A similarly poor fit was obtained for ZnO, cazincate, Zn(OH)2, willemite (ZnSiO4), ZnCl2 and
bianchite (Zn0.75Fe2+
0.25(SO4)•6(H2O)). This implies that the latter phases are not the phases
controlling leaching over the pH range of relevance to IBA in normal exposure conditions, or
in fresh ash as it leaves the facility. Any soluble zinc will dissolve and more or less
immediately re-precipitate as the less soluble silicates and phosphates – as would happen
when the ash is quenched as it comes out of the boiler.

WRc Ref: UC8564.10/14728-9 December 2012
© WRc plc 2012 32
Appendix F Plots from Geochemical Modelling – UK and Worldwide Data
F1 Zinc - all plots
F2 Zinc – solid phase fractionation plots only
F3 Copper – solid phase fractionation plots only
F4 Nickel – solid phase fractionation plots only
WRc Ref: UC8564.10/14728-9 December 2012
© WRc plc 2012 33
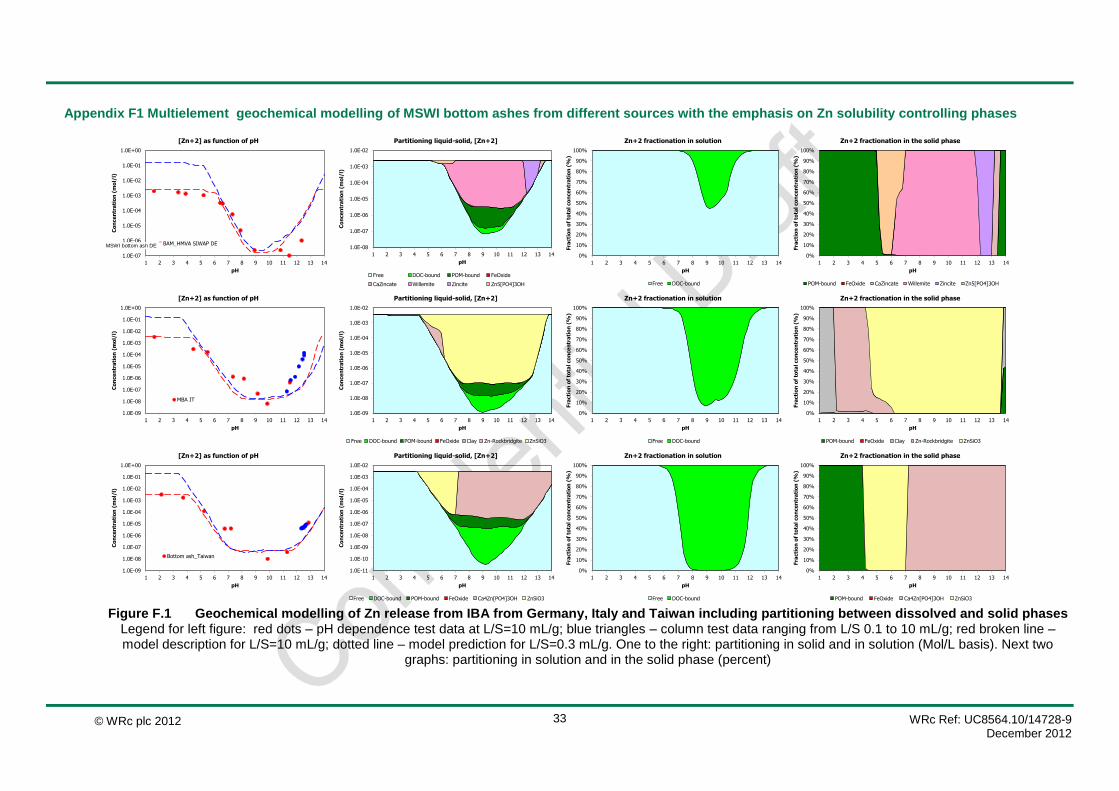
Appendix F1 Multielement geochemical modelling of MSWI bottom ashes from different sources with the emphasis on Zn solubility controlling phases
Figure F.1 Geochemical modelling of Zn release from IBA from Germany, Italy and Taiwan including partitioning between dissolved and solid phases
Legend for left figure: red dots – pH dependence test data at L/S=10 mL/g; blue triangles – column test data ranging from L/S 0.1 to 10 mL/g; red broken line – model description for L/S=10 mL/g; dotted line – model prediction for L/S=0.3 mL/g. One to the right: partitioning in solid and in solution (Mol/L basis). Next two
graphs: partitioning in solution and in the solid phase (percent)
1.0E-07
1.0E-06
1.0E-05
1.0E-04
1.0E-03
1.0E-02
1.0E-01
1.0E+00
1 2 3 4 5 6 7 8 9 10 11 12 13 14
Co
nce
ntr
ati
on
(m
ol/
l)
pH
[Zn+2] as function of pH
BAM_HMVA SIWAP DE1.0E-08
1.0E-07
1.0E-06
1.0E-05
1.0E-04
1.0E-03
1.0E-02
1 2 3 4 5 6 7 8 9 10 11 12 13 14
Co
nce
ntr
ati
on
(m
ol/
l)
pH
Partitioning liquid-solid, [Zn+2]
Free DOC-bound POM-bound FeOxide
CaZincate Willemite Zincite Zn5[PO4]3OH
0%
10%
20%
30%
40%
50%
60%
70%
80%
90%
100%
1 2 3 4 5 6 7 8 9 10 11 12 13 14
Fra
cti
on
of
tota
l co
nce
ntr
ati
on
(%
)
pH
Zn+2 fractionation in solution
Free DOC-bound
0%
10%
20%
30%
40%
50%
60%
70%
80%
90%
100%
1 2 3 4 5 6 7 8 9 10 11 12 13 14
Fra
cti
on
of
tota
l co
nce
ntr
ati
on
(%
)
pH
Zn+2 fractionation in the solid phase
POM-bound FeOxide CaZincate Willemite Zincite Zn5[PO4]3OH
1.0E-09
1.0E-08
1.0E-07
1.0E-06
1.0E-05
1.0E-04
1.0E-03
1.0E-02
1.0E-01
1.0E+00
1 2 3 4 5 6 7 8 9 10 11 12 13 14
Co
nce
ntr
ati
on
(m
ol/
l)
pH
[Zn+2] as function of pH
MBA IT
1.0E-09
1.0E-08
1.0E-07
1.0E-06
1.0E-05
1.0E-04
1.0E-03
1.0E-02
1 2 3 4 5 6 7 8 9 10 11 12 13 14
Co
nce
ntr
ati
on
(m
ol/
l)
pH
Partitioning liquid-solid, [Zn+2]
Free DOC-bound POM-bound FeOxide Clay Zn-Rockbridgite ZnSiO3
0%
10%
20%
30%
40%
50%
60%
70%
80%
90%
100%
1 2 3 4 5 6 7 8 9 10 11 12 13 14
Fra
cti
on
of
tota
l co
nce
ntr
ati
on
(%
)
pH
Zn+2 fractionation in solution
Free DOC-bound
0%
10%
20%
30%
40%
50%
60%
70%
80%
90%
100%
1 2 3 4 5 6 7 8 9 10 11 12 13 14
Fra
cti
on
of
tota
l co
nce
ntr
ati
on
(%
)
pH
Zn+2 fractionation in the solid phase
POM-bound FeOxide Clay Zn-Rockbridgite ZnSiO3
1.0E-09
1.0E-08
1.0E-07
1.0E-06
1.0E-05
1.0E-04
1.0E-03
1.0E-02
1.0E-01
1.0E+00
1 2 3 4 5 6 7 8 9 10 11 12 13 14
Co
nce
ntr
ati
on
(m
ol/
l)
pH
[Zn+2] as function of pH
Bottom ash_Taiwan
1.0E-11
1.0E-10
1.0E-09
1.0E-08
1.0E-07
1.0E-06
1.0E-05
1.0E-04
1.0E-03
1.0E-02
1 2 3 4 5 6 7 8 9 10 11 12 13 14
Co
nce
ntr
ati
on
(m
ol/
l)
pH
Partitioning liquid-solid, [Zn+2]
Free DOC-bound POM-bound FeOxide Ca4Zn[PO4]3OH ZnSiO3
0%
10%
20%
30%
40%
50%
60%
70%
80%
90%
100%
1 2 3 4 5 6 7 8 9 10 11 12 13 14
Fra
cti
on
of
tota
l co
nce
ntr
ati
on
(%
)
pH
Zn+2 fractionation in solution
Free DOC-bound
0%
10%
20%
30%
40%
50%
60%
70%
80%
90%
100%
1 2 3 4 5 6 7 8 9 10 11 12 13 14
Fra
cti
on
of
tota
l co
nce
ntr
ati
on
(%
)
pH
Zn+2 fractionation in the solid phase
POM-bound FeOxide Ca4Zn[PO4]3OH ZnSiO3
MSWI bottom ash DE
WRc Ref: UC8564.10/14728-9 December 2012
© WRc plc 2012 34
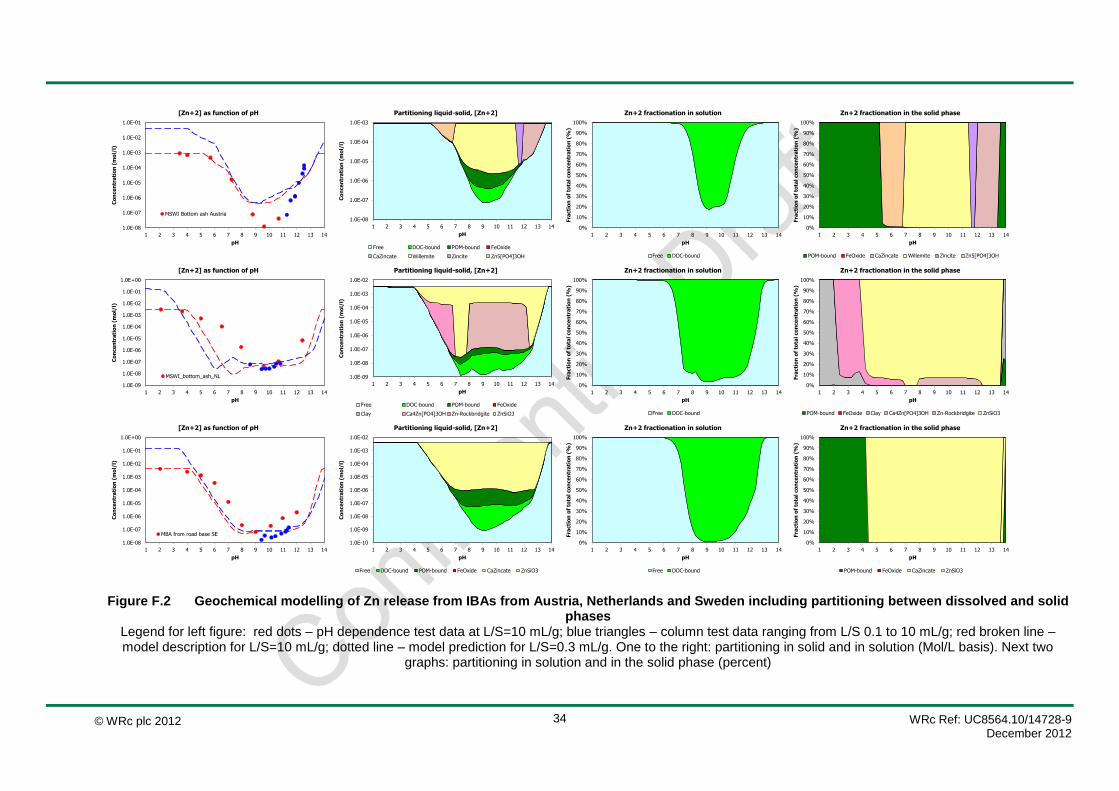
Figure F.2 Geochemical modelling of Zn release from IBAs from Austria, Netherlands and Sweden including partitioning between dissolved and solid phases
Legend for left figure: red dots – pH dependence test data at L/S=10 mL/g; blue triangles – column test data ranging from L/S 0.1 to 10 mL/g; red broken line – model description for L/S=10 mL/g; dotted line – model prediction for L/S=0.3 mL/g. One to the right: partitioning in solid and in solution (Mol/L basis). Next two
graphs: partitioning in solution and in the solid phase (percent)
1.0E-08
1.0E-07
1.0E-06
1.0E-05
1.0E-04
1.0E-03
1.0E-02
1.0E-01
1 2 3 4 5 6 7 8 9 10 11 12 13 14
Co
nce
ntr
ati
on
(m
ol/
l)
pH
[Zn+2] as function of pH
MSWI Bottom ash Austria1.0E-08
1.0E-07
1.0E-06
1.0E-05
1.0E-04
1.0E-03
1 2 3 4 5 6 7 8 9 10 11 12 13 14
Co
nce
ntr
ati
on
(m
ol/
l)
pH
Partitioning liquid-solid, [Zn+2]
Free DOC-bound POM-bound FeOxide
CaZincate Willemite Zincite Zn5[PO4]3OH
0%
10%
20%
30%
40%
50%
60%
70%
80%
90%
100%
1 2 3 4 5 6 7 8 9 10 11 12 13 14
Fra
cti
on
of
tota
l co
nce
ntr
ati
on
(%
)
pH
Zn+2 fractionation in solution
Free DOC-bound
0%
10%
20%
30%
40%
50%
60%
70%
80%
90%
100%
1 2 3 4 5 6 7 8 9 10 11 12 13 14
Fra
cti
on
of
tota
l co
nce
ntr
ati
on
(%
)
pH
Zn+2 fractionation in the solid phase
POM-bound FeOxide CaZincate Willemite Zincite Zn5[PO4]3OH
1.0E-09
1.0E-08
1.0E-07
1.0E-06
1.0E-05
1.0E-04
1.0E-03
1.0E-02
1.0E-01
1.0E+00
1 2 3 4 5 6 7 8 9 10 11 12 13 14
Co
nce
ntr
ati
on
(m
ol/
l)
pH
[Zn+2] as function of pH
MSWI_bottom_ash_NL 1.0E-09
1.0E-08
1.0E-07
1.0E-06
1.0E-05
1.0E-04
1.0E-03
1.0E-02
1 2 3 4 5 6 7 8 9 10 11 12 13 14
Co
nce
ntr
ati
on
(m
ol/
l)
pH
Partitioning liquid-solid, [Zn+2]
Free DOC-bound POM-bound FeOxide
Clay Ca4Zn[PO4]3OH Zn-Rockbridgite ZnSiO3
0%
10%
20%
30%
40%
50%
60%
70%
80%
90%
100%
1 2 3 4 5 6 7 8 9 10 11 12 13 14
Fra
cti
on
of
tota
l co
nce
ntr
ati
on
(%
)
pH
Zn+2 fractionation in solution
Free DOC-bound
0%
10%
20%
30%
40%
50%
60%
70%
80%
90%
100%
1 2 3 4 5 6 7 8 9 10 11 12 13 14
Fra
cti
on
of
tota
l co
nce
ntr
ati
on
(%
)
pH
Zn+2 fractionation in the solid phase
POM-bound FeOxide Clay Ca4Zn[PO4]3OH Zn-Rockbridgite ZnSiO3
1.0E-08
1.0E-07
1.0E-06
1.0E-05
1.0E-04
1.0E-03
1.0E-02
1.0E-01
1.0E+00
1 2 3 4 5 6 7 8 9 10 11 12 13 14
Co
nce
ntr
ati
on
(m
ol/
l)
pH
[Zn+2] as function of pH
MBA from road base SE
1.0E-10
1.0E-09
1.0E-08
1.0E-07
1.0E-06
1.0E-05
1.0E-04
1.0E-03
1.0E-02
1 2 3 4 5 6 7 8 9 10 11 12 13 14
Co
nce
ntr
ati
on
(m
ol/
l)
pH
Partitioning liquid-solid, [Zn+2]
Free DOC-bound POM-bound FeOxide CaZincate ZnSiO3
0%
10%
20%
30%
40%
50%
60%
70%
80%
90%
100%
1 2 3 4 5 6 7 8 9 10 11 12 13 14
Fra
cti
on
of
tota
l co
nce
ntr
ati
on
(%
)
pH
Zn+2 fractionation in solution
Free DOC-bound
0%
10%
20%
30%
40%
50%
60%
70%
80%
90%
100%
1 2 3 4 5 6 7 8 9 10 11 12 13 14
Fra
cti
on
of
tota
l co
nce
ntr
ati
on
(%
)
pH
Zn+2 fractionation in the solid phase
POM-bound FeOxide CaZincate ZnSiO3
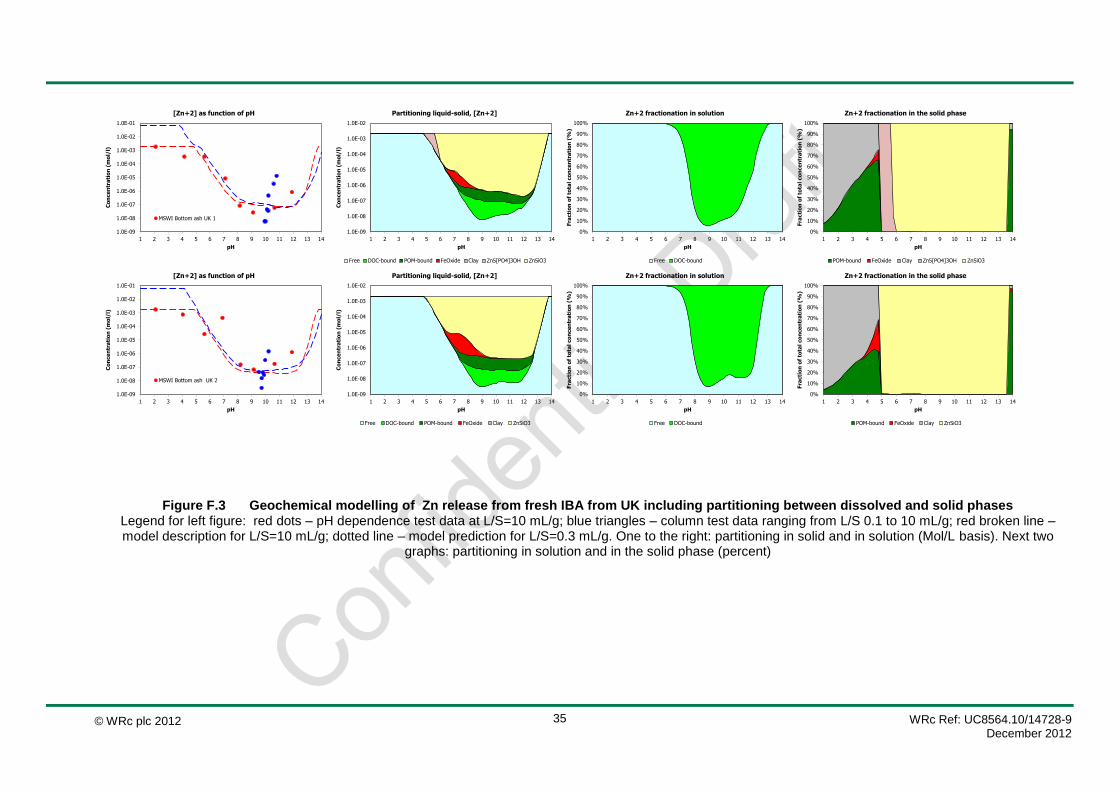
WRc Ref: UC8564.10/14728-9 December 2012
© WRc plc 2012 35
Figure F.3 Geochemical modelling of Zn release from fresh IBA from UK including partitioning between dissolved and solid phases Legend for left figure: red dots – pH dependence test data at L/S=10 mL/g; blue triangles – column test data ranging from L/S 0.1 to 10 mL/g; red broken line – model description for L/S=10 mL/g; dotted line – model prediction for L/S=0.3 mL/g. One to the right: partitioning in solid and in solution (Mol/L basis). Next two
graphs: partitioning in solution and in the solid phase (percent)
1.0E-09
1.0E-08
1.0E-07
1.0E-06
1.0E-05
1.0E-04
1.0E-03
1.0E-02
1.0E-01
1 2 3 4 5 6 7 8 9 10 11 12 13 14
Co
nce
ntr
ati
on
(m
ol/
l)
pH
[Zn+2] as function of pH
MSWI Bottom ash UK 1
1.0E-09
1.0E-08
1.0E-07
1.0E-06
1.0E-05
1.0E-04
1.0E-03
1.0E-02
1 2 3 4 5 6 7 8 9 10 11 12 13 14
Co
nce
ntr
ati
on
(m
ol/
l)
pH
Partitioning liquid-solid, [Zn+2]
Free DOC-bound POM-bound FeOxide Clay Zn5[PO4]3OH ZnSiO3
0%
10%
20%
30%
40%
50%
60%
70%
80%
90%
100%
1 2 3 4 5 6 7 8 9 10 11 12 13 14
Fra
cti
on
of
tota
l co
nce
ntr
ati
on
(%
)
pH
Zn+2 fractionation in solution
Free DOC-bound
0%
10%
20%
30%
40%
50%
60%
70%
80%
90%
100%
1 2 3 4 5 6 7 8 9 10 11 12 13 14
Fra
cti
on
of
tota
l co
nce
ntr
ati
on
(%
)
pH
Zn+2 fractionation in the solid phase
POM-bound FeOxide Clay Zn5[PO4]3OH ZnSiO3
1.0E-09
1.0E-08
1.0E-07
1.0E-06
1.0E-05
1.0E-04
1.0E-03
1.0E-02
1.0E-01
1 2 3 4 5 6 7 8 9 10 11 12 13 14
Co
nce
ntr
ati
on
(m
ol/
l)
pH
[Zn+2] as function of pH
MSWI Bottom ash UK 2
1.0E-09
1.0E-08
1.0E-07
1.0E-06
1.0E-05
1.0E-04
1.0E-03
1.0E-02
1 2 3 4 5 6 7 8 9 10 11 12 13 14
Co
nce
ntr
ati
on
(m
ol/
l)
pH
Partitioning liquid-solid, [Zn+2]
Free DOC-bound POM-bound FeOxide Clay ZnSiO3
0%
10%
20%
30%
40%
50%
60%
70%
80%
90%
100%
1 2 3 4 5 6 7 8 9 10 11 12 13 14
Fra
cti
on
of
tota
l co
nce
ntr
ati
on
(%
)
pH
Zn+2 fractionation in solution
Free DOC-bound
0%
10%
20%
30%
40%
50%
60%
70%
80%
90%
100%
1 2 3 4 5 6 7 8 9 10 11 12 13 14
Fra
cti
on
of
tota
l co
nce
ntr
ati
on
(%
)
pH
Zn+2 fractionation in the solid phase
POM-bound FeOxide Clay ZnSiO3
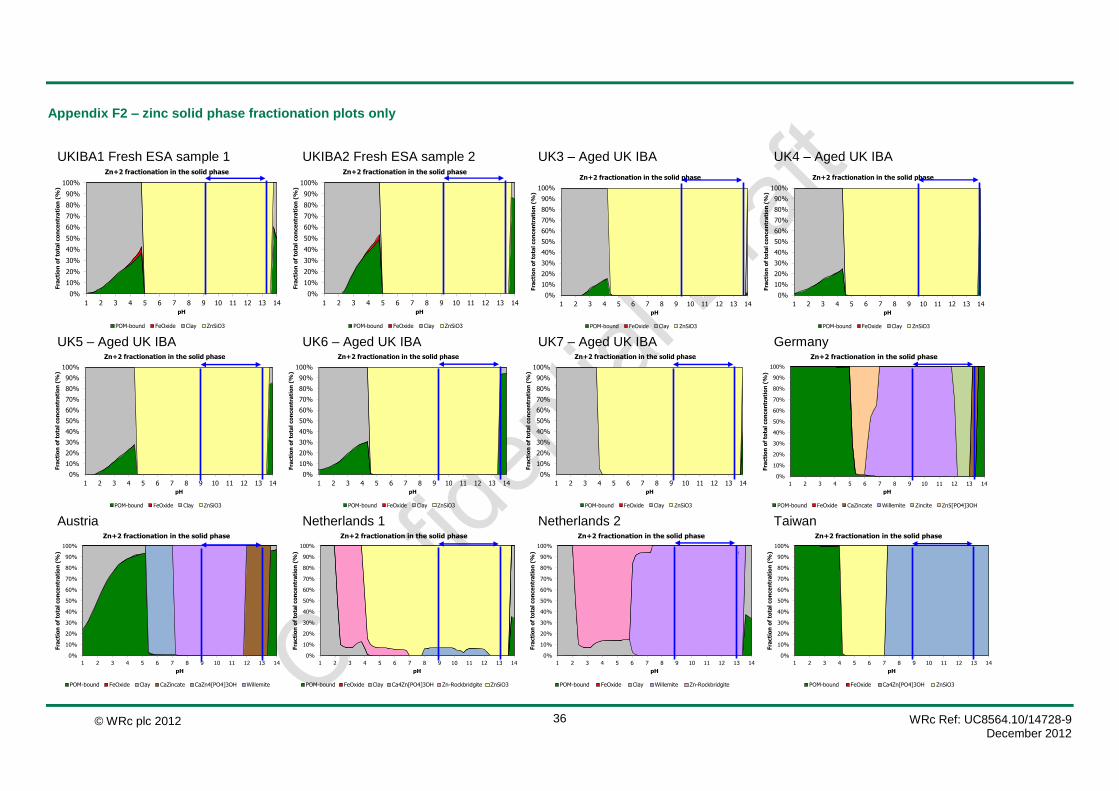
WRc Ref: UC8564.10/14728-9 December 2012
© WRc plc 2012 36
Appendix F2 – zinc solid phase fractionation plots only
UKIBA1 Fresh ESA sample 1 UKIBA2 Fresh ESA sample 2 UK3 – Aged UK IBA UK4 – Aged UK IBA
UK5 – Aged UK IBA UK6 – Aged UK IBA UK7 – Aged UK IBA Germany
Austria Netherlands 1 Netherlands 2 Taiwan
0%
10%
20%
30%
40%
50%
60%
70%
80%
90%
100%
1 2 3 4 5 6 7 8 9 10 11 12 13 14
Fra
cti
on
of
tota
l co
nce
ntr
ati
on
(%
)
pH
Zn+2 fractionation in the solid phase
POM-bound FeOxide Clay ZnSiO3
0%
10%
20%
30%
40%
50%
60%
70%
80%
90%
100%
1 2 3 4 5 6 7 8 9 10 11 12 13 14
Fra
cti
on
of
tota
l co
nce
ntr
ati
on
(%
)
pH
Zn+2 fractionation in the solid phase
POM-bound FeOxide Clay ZnSiO3
0%
10%
20%
30%
40%
50%
60%
70%
80%
90%
100%
1 2 3 4 5 6 7 8 9 10 11 12 13 14
Fra
cti
on
of
tota
l co
nce
ntr
ati
on
(%
)
pH
Zn+2 fractionation in the solid phase
POM-bound FeOxide Clay ZnSiO3
0%
10%
20%
30%
40%
50%
60%
70%
80%
90%
100%
1 2 3 4 5 6 7 8 9 10 11 12 13 14
Fra
cti
on
of
tota
l co
nce
ntr
ati
on
(%
)
pH
Zn+2 fractionation in the solid phase
POM-bound FeOxide Clay ZnSiO3
0%
10%
20%
30%
40%
50%
60%
70%
80%
90%
100%
1 2 3 4 5 6 7 8 9 10 11 12 13 14
Fra
cti
on
of
tota
l co
nce
ntr
ati
on
(%
)
pH
Zn+2 fractionation in the solid phase
POM-bound FeOxide Clay ZnSiO3
0%
10%
20%
30%
40%
50%
60%
70%
80%
90%
100%
1 2 3 4 5 6 7 8 9 10 11 12 13 14
Fra
cti
on
of
tota
l co
nce
ntr
ati
on
(%
)
pH
Zn+2 fractionation in the solid phase
POM-bound FeOxide Clay ZnSiO3
0%
10%
20%
30%
40%
50%
60%
70%
80%
90%
100%
1 2 3 4 5 6 7 8 9 10 11 12 13 14
Fra
cti
on
of
tota
l co
nce
ntr
ati
on
(%
)
pH
Zn+2 fractionation in the solid phase
POM-bound FeOxide Clay ZnSiO3
0%
10%
20%
30%
40%
50%
60%
70%
80%
90%
100%
1 2 3 4 5 6 7 8 9 10 11 12 13 14
Fra
cti
on
of
tota
l co
nce
ntr
ati
on
(%
)
pH
Zn+2 fractionation in the solid phase
POM-bound FeOxide CaZincate Willemite Zincite Zn5[PO4]3OH
0%
10%
20%
30%
40%
50%
60%
70%
80%
90%
100%
1 2 3 4 5 6 7 8 9 10 11 12 13 14
Fra
cti
on
of
tota
l co
nce
ntr
ati
on
(%
)
pH
Zn+2 fractionation in the solid phase
POM-bound FeOxide Clay CaZincate CaZn4[PO4]3OH Willemite
0%
10%
20%
30%
40%
50%
60%
70%
80%
90%
100%
1 2 3 4 5 6 7 8 9 10 11 12 13 14
Fra
cti
on
of
tota
l co
nce
ntr
ati
on
(%
)
pH
Zn+2 fractionation in the solid phase
POM-bound FeOxide Clay Ca4Zn[PO4]3OH Zn-Rockbridgite ZnSiO3
0%
10%
20%
30%
40%
50%
60%
70%
80%
90%
100%
1 2 3 4 5 6 7 8 9 10 11 12 13 14
Fra
cti
on
of
tota
l co
nce
ntr
ati
on
(%
)
pH
Zn+2 fractionation in the solid phase
POM-bound FeOxide Clay Willemite Zn-Rockbridgite
0%
10%
20%
30%
40%
50%
60%
70%
80%
90%
100%
1 2 3 4 5 6 7 8 9 10 11 12 13 14
Fra
cti
on
of
tota
l co
nce
ntr
ati
on
(%
)
pH
Zn+2 fractionation in the solid phase
POM-bound FeOxide Ca4Zn[PO4]3OH ZnSiO3
U
K
U
K
UK
UK
UK
U
KU
K
UK
UK
UK
UK
UK
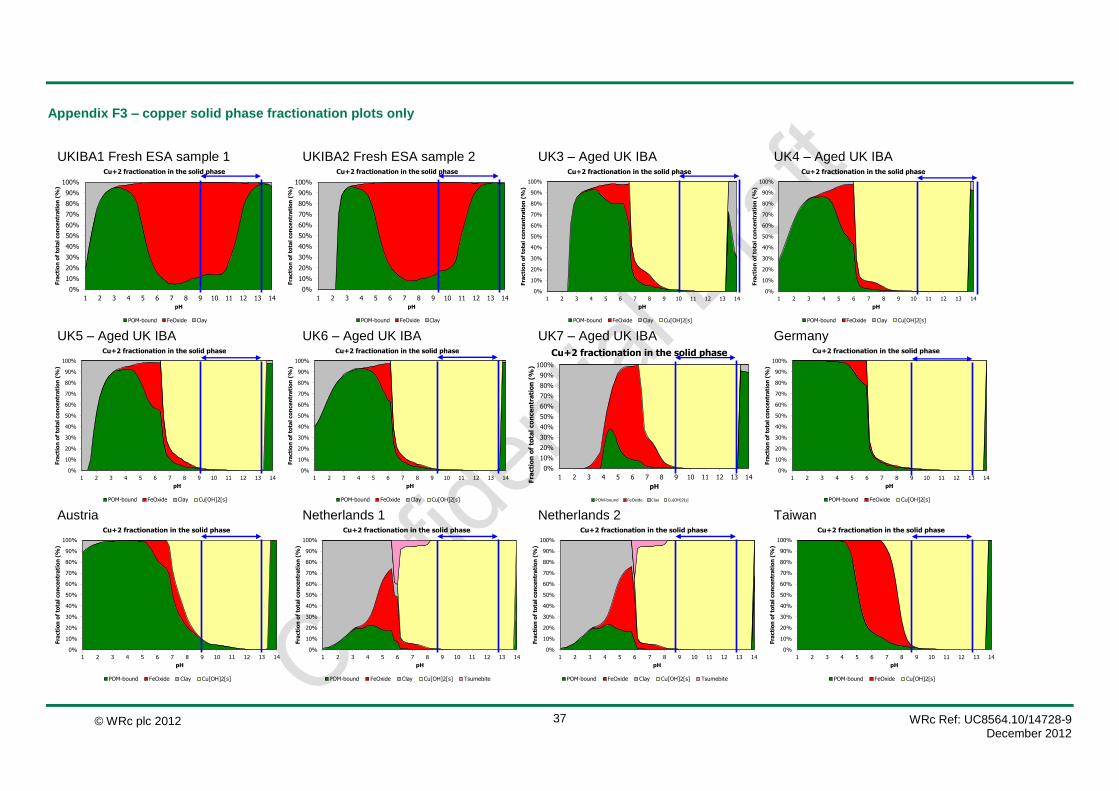
WRc Ref: UC8564.10/14728-9 December 2012
© WRc plc 2012 37
Appendix F3 – copper solid phase fractionation plots only
UKIBA1 Fresh ESA sample 1 UKIBA2 Fresh ESA sample 2 UK3 – Aged UK IBA UK4 – Aged UK IBA
UK5 – Aged UK IBA UK6 – Aged UK IBA UK7 – Aged UK IBA Germany
Austria Netherlands 1 Netherlands 2 Taiwan
0%
10%
20%
30%
40%
50%
60%
70%
80%
90%
100%
1 2 3 4 5 6 7 8 9 10 11 12 13 14
Fra
cti
on
of
tota
l co
nce
ntr
ati
on
(%
)
pH
Cu+2 fractionation in the solid phase
POM-bound FeOxide Clay
0%
10%
20%
30%
40%
50%
60%
70%
80%
90%
100%
1 2 3 4 5 6 7 8 9 10 11 12 13 14
Fra
cti
on
of
tota
l co
nce
ntr
ati
on
(%
)
pH
Cu+2 fractionation in the solid phase
POM-bound FeOxide Clay
0%
10%
20%
30%
40%
50%
60%
70%
80%
90%
100%
1 2 3 4 5 6 7 8 9 10 11 12 13 14
Fra
cti
on
of
tota
l co
nce
ntr
ati
on
(%
)
pH
Cu+2 fractionation in the solid phase
POM-bound FeOxide Clay Cu[OH]2[s]
0%
10%
20%
30%
40%
50%
60%
70%
80%
90%
100%
1 2 3 4 5 6 7 8 9 10 11 12 13 14
Fra
cti
on
of
tota
l co
nce
ntr
ati
on
(%
)
pH
Cu+2 fractionation in the solid phase
POM-bound FeOxide Clay Cu[OH]2[s]
0%
10%
20%
30%
40%
50%
60%
70%
80%
90%
100%
1 2 3 4 5 6 7 8 9 10 11 12 13 14
Fra
cti
on
of
tota
l co
nce
ntr
ati
on
(%
)
pH
Cu+2 fractionation in the solid phase
POM-bound FeOxide Clay Cu[OH]2[s]
0%
10%
20%
30%
40%
50%
60%
70%
80%
90%
100%
1 2 3 4 5 6 7 8 9 10 11 12 13 14
Fra
cti
on
of
tota
l co
nce
ntr
ati
on
(%
)
pH
Cu+2 fractionation in the solid phase
POM-bound FeOxide Clay Cu[OH]2[s]
0%
10%
20%
30%
40%
50%
60%
70%
80%
90%
100%
1 2 3 4 5 6 7 8 9 10 11 12 13 14
Fra
cti
on
of
tota
l co
nce
ntr
ati
on
(%
)
pH
Cu+2 fractionation in the solid phase
POM-bound FeOxide Clay Cu[OH]2[s]
0%
10%
20%
30%
40%
50%
60%
70%
80%
90%
100%
1 2 3 4 5 6 7 8 9 10 11 12 13 14
Fra
cti
on
of
tota
l co
nce
ntr
ati
on
(%
)
pH
Cu+2 fractionation in the solid phase
POM-bound FeOxide Cu[OH]2[s]
0%
10%
20%
30%
40%
50%
60%
70%
80%
90%
100%
1 2 3 4 5 6 7 8 9 10 11 12 13 14
Fra
cti
on
of
tota
l co
nce
ntr
ati
on
(%
)
pH
Cu+2 fractionation in the solid phase
POM-bound FeOxide Clay Cu[OH]2[s]
0%
10%
20%
30%
40%
50%
60%
70%
80%
90%
100%
1 2 3 4 5 6 7 8 9 10 11 12 13 14
Fra
cti
on
of
tota
l co
nce
ntr
ati
on
(%
)
pH
Cu+2 fractionation in the solid phase
POM-bound FeOxide Clay Cu[OH]2[s] Tsumebite
0%
10%
20%
30%
40%
50%
60%
70%
80%
90%
100%
1 2 3 4 5 6 7 8 9 10 11 12 13 14
Fra
cti
on
of
tota
l co
nce
ntr
ati
on
(%
)
pH
Cu+2 fractionation in the solid phase
POM-bound FeOxide Clay Cu[OH]2[s] Tsumebite
0%
10%
20%
30%
40%
50%
60%
70%
80%
90%
100%
1 2 3 4 5 6 7 8 9 10 11 12 13 14
Fra
cti
on
of
tota
l co
nce
ntr
ati
on
(%
)
pH
Cu+2 fractionation in the solid phase
POM-bound FeOxide Cu[OH]2[s]
U
K
UK
UK
UK
UK
U
K
UK
UK
UK
UK
UK
UK

WRc Ref: UC8564.10/14728-9 December 2012
© WRc plc 2012 38
Appendix F4 – copper model input parameters
Prediction case DOC/DHA data pH [DOC] (kg/l) DHA fraction [DHA] (kg/l)
Speciation session WRc MBA 2011 1.00 9.000E-05 0.20 1.800E-05
Material MSWI Bottom ash UK 1 (P,1,1) 2.10 8.370E-05 0.20 1.674E-05
4.05 4.380E-05 0.20 8.760E-06
Solved fraction DOC 0.2 5.60 5.620E-05 0.20 1.124E-05
Sum of pH and pe 11.00 6.90 4.780E-05 0.20 9.560E-06
L/S 10.4565 l/kg 8.20 4.820E-05 0.20 9.640E-06
Clay 1.000E-02 kg/kg 9.15 4.910E-05 0.22 1.080E-05
HFO 1.700E-03 kg/kg 10.65 5.025E-05 0.25 1.256E-05
SHA 4.000E-04 kg/kg 11.90 5.160E-05 0.28 1.445E-05
Percolation material MSWI Bottom ash UK 1 (C,1,1) 14.00 6.000E-05 0.32 1.920E-05
Avg L/S first perc. fractions 0.3000 l/kg Polynomial coeficients
Reactant concentrations C0 -4.586E+00
Reactant mg/kg C1 -1.501E-01
Ag+ not measured C2 1.520E-02
Al+3 8.861E+03 C3 -3.675E-04
ANT not measured C4 0.000E+00
H3AsO4 1.507E+00 C5 0.000E+00
H3BO3 6.684E+01 Selected Minerals Most significant/Relevant Other
Ba+2 1.044E+01 AA_2CaO_Al2O3_8H2O[s]
BAA not measured AA_3CaO_Al2O3_6H2O[s]
BAP not measured AA_Brucite
BBF not measured AA_Calcite
BENZENE not measured AA_CaO_Al2O3_10H2O[s]
BGP not measured AA_Fe[OH]3[am]
BKF not measured AA_Fe[OH]3[microcr]
Br- 1.700E+01 AA_Gypsum
Ca+2 5.555E+04 AA_Jennite
Cd+2 1.886E+00 AA_Magnesite
CHR not measured AA_Portlandite
Cl- 4.311E+03 AA_Tobermorite-II
CrO4-2 1.491E+01 Al[OH]3[a]
Cu+2 3.526E+01 alpha-TCP
H2CO3 1.090E+04 Ba[SCr]O4[77%SO4]
EOX not measured BaSrSO4[50%Ba]
ETHYLBENZENE not measured Ca3[AsO4]2:6H2O
F- 3.600E-01 Ca4Cd[PO4]3Cl
Fe+3 6.096E+03 Ca4Cd[PO4]3OH
FLA not measured CaCrO4
FLT not measured CaSeO4:2H2O
Hg+2 3.543E-05 Cd[OH]2[C]
I- not measured Cr[OH]3[C]
K+ 2.528E+03 CuCO3[s]
Li+ 5.029E+00 Fe_Vanadate
Mg+2 5.425E+03 Fe2[MoO4]3[1]
MIN_OIL not measured Fluorite
Mn+2 2.462E+02 Laumontite
MoO4-2 7.897E-01 Manganite
Na+ 1.564E+03 Mg3[PO4]2:22H2O[c]
NAP not measured MgKPO4:6H2O[c]
NH4+ not measured Ni[OH]2[s]
Ni+2 2.365E+01 Pb[OH]2[C]
NO3- not measured Pb2V2O7
PAH_EPA not measured Pb3[VO4]2
Pb+2 2.022E+02 PbCrO4
PHE not measured PbMoO4[c]
PO4-3 5.711E+03 Rhodochrosite
PYR not measured Sb[OH]3[s]
Sb[OH]6- 7.594E+00 Strengite
SeO4-2 7.580E-01 Strontianite
H4SiO4 1.180E+04 Wairakite
SO4-2 1.071E+04 Willemite
Sr+2 1.151E+02 ZnSiO3
Th+4 not measured
TOLUENE not measured
UO2+ not measured
VO2+ 2.277E+01
VOX not measured
Zn+2 1.233E+03
Input specification
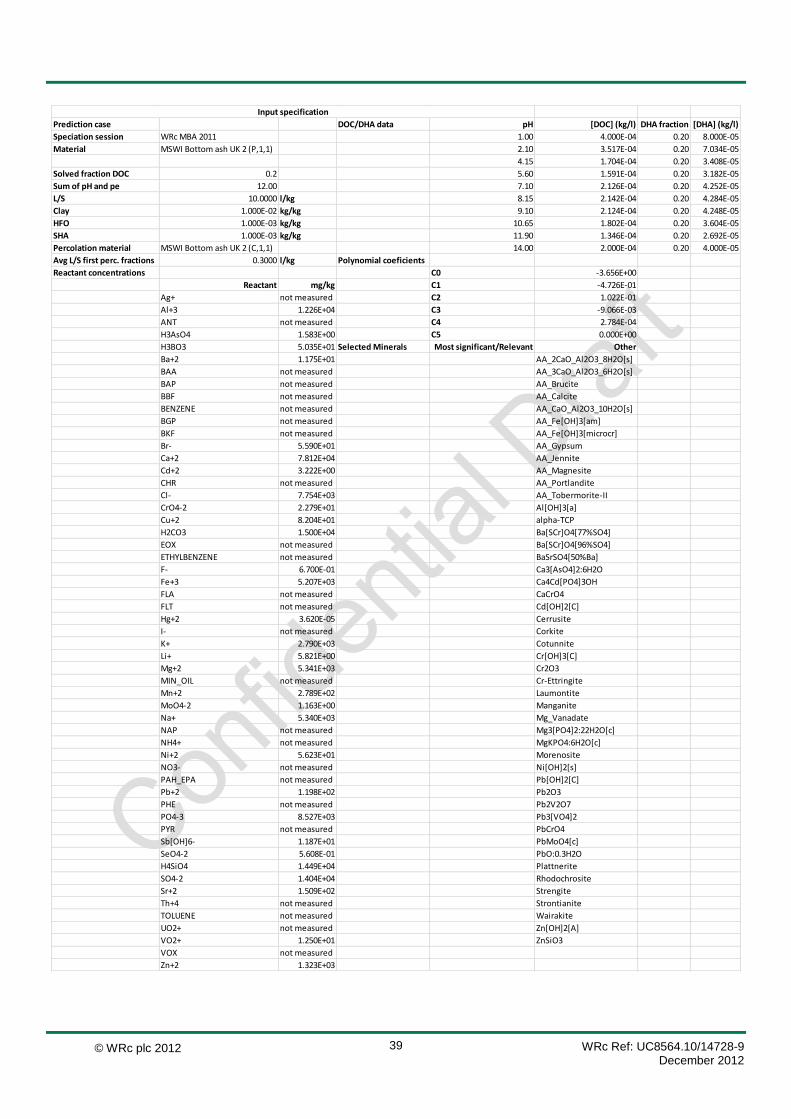
WRc Ref: UC8564.10/14728-9 December 2012
© WRc plc 2012 39
Prediction case DOC/DHA data pH [DOC] (kg/l) DHA fraction [DHA] (kg/l)
Speciation session WRc MBA 2011 1.00 4.000E-04 0.20 8.000E-05
Material MSWI Bottom ash UK 2 (P,1,1) 2.10 3.517E-04 0.20 7.034E-05
4.15 1.704E-04 0.20 3.408E-05
Solved fraction DOC 0.2 5.60 1.591E-04 0.20 3.182E-05
Sum of pH and pe 12.00 7.10 2.126E-04 0.20 4.252E-05
L/S 10.0000 l/kg 8.15 2.142E-04 0.20 4.284E-05
Clay 1.000E-02 kg/kg 9.10 2.124E-04 0.20 4.248E-05
HFO 1.000E-03 kg/kg 10.65 1.802E-04 0.20 3.604E-05
SHA 1.000E-03 kg/kg 11.90 1.346E-04 0.20 2.692E-05
Percolation material MSWI Bottom ash UK 2 (C,1,1) 14.00 2.000E-04 0.20 4.000E-05
Avg L/S first perc. fractions 0.3000 l/kg Polynomial coeficients
Reactant concentrations C0 -3.656E+00
Reactant mg/kg C1 -4.726E-01
Ag+ not measured C2 1.022E-01
Al+3 1.226E+04 C3 -9.066E-03
ANT not measured C4 2.784E-04
H3AsO4 1.583E+00 C5 0.000E+00
H3BO3 5.035E+01 Selected Minerals Most significant/Relevant Other
Ba+2 1.175E+01 AA_2CaO_Al2O3_8H2O[s]
BAA not measured AA_3CaO_Al2O3_6H2O[s]
BAP not measured AA_Brucite
BBF not measured AA_Calcite
BENZENE not measured AA_CaO_Al2O3_10H2O[s]
BGP not measured AA_Fe[OH]3[am]
BKF not measured AA_Fe[OH]3[microcr]
Br- 5.590E+01 AA_Gypsum
Ca+2 7.812E+04 AA_Jennite
Cd+2 3.222E+00 AA_Magnesite
CHR not measured AA_Portlandite
Cl- 7.754E+03 AA_Tobermorite-II
CrO4-2 2.279E+01 Al[OH]3[a]
Cu+2 8.204E+01 alpha-TCP
H2CO3 1.500E+04 Ba[SCr]O4[77%SO4]
EOX not measured Ba[SCr]O4[96%SO4]
ETHYLBENZENE not measured BaSrSO4[50%Ba]
F- 6.700E-01 Ca3[AsO4]2:6H2O
Fe+3 5.207E+03 Ca4Cd[PO4]3OH
FLA not measured CaCrO4
FLT not measured Cd[OH]2[C]
Hg+2 3.620E-05 Cerrusite
I- not measured Corkite
K+ 2.790E+03 Cotunnite
Li+ 5.821E+00 Cr[OH]3[C]
Mg+2 5.341E+03 Cr2O3
MIN_OIL not measured Cr-Ettringite
Mn+2 2.789E+02 Laumontite
MoO4-2 1.163E+00 Manganite
Na+ 5.340E+03 Mg_Vanadate
NAP not measured Mg3[PO4]2:22H2O[c]
NH4+ not measured MgKPO4:6H2O[c]
Ni+2 5.623E+01 Morenosite
NO3- not measured Ni[OH]2[s]
PAH_EPA not measured Pb[OH]2[C]
Pb+2 1.198E+02 Pb2O3
PHE not measured Pb2V2O7
PO4-3 8.527E+03 Pb3[VO4]2
PYR not measured PbCrO4
Sb[OH]6- 1.187E+01 PbMoO4[c]
SeO4-2 5.608E-01 PbO:0.3H2O
H4SiO4 1.449E+04 Plattnerite
SO4-2 1.404E+04 Rhodochrosite
Sr+2 1.509E+02 Strengite
Th+4 not measured Strontianite
TOLUENE not measured Wairakite
UO2+ not measured Zn[OH]2[A]
VO2+ 1.250E+01 ZnSiO3
VOX not measured
Zn+2 1.323E+03
Input specification
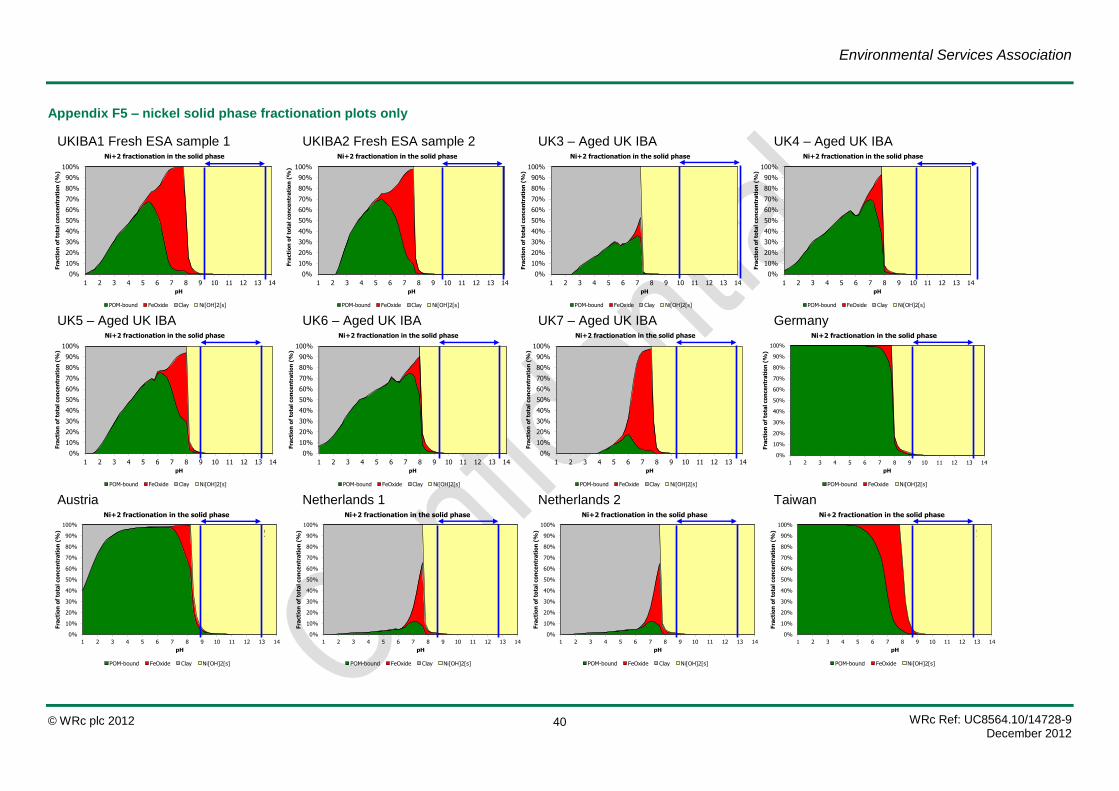
Environmental Services Association
WRc Ref: UC8564.10/14728-9 December 2012
© WRc plc 2012 40
Appendix F5 – nickel solid phase fractionation plots only
UKIBA1 Fresh ESA sample 1 UKIBA2 Fresh ESA sample 2 UK3 – Aged UK IBA UK4 – Aged UK IBA
UK5 – Aged UK IBA UK6 – Aged UK IBA UK7 – Aged UK IBA Germany
Austria Netherlands 1 Netherlands 2 Taiwan
0%
10%
20%
30%
40%
50%
60%
70%
80%
90%
100%
1 2 3 4 5 6 7 8 9 10 11 12 13 14
Fra
cti
on
of
tota
l co
nce
ntr
ati
on
(%
)
pH
Ni+2 fractionation in the solid phase
POM-bound FeOxide Clay Ni[OH]2[s]
0%
10%
20%
30%
40%
50%
60%
70%
80%
90%
100%
1 2 3 4 5 6 7 8 9 10 11 12 13 14Fra
cti
on
of
tota
l co
nce
ntr
ati
on
(%
)pH
Ni+2 fractionation in the solid phase
POM-bound FeOxide Clay Ni[OH]2[s]
0%
10%
20%
30%
40%
50%
60%
70%
80%
90%
100%
1 2 3 4 5 6 7 8 9 10 11 12 13 14
Fra
cti
on
of
tota
l co
nce
ntr
ati
on
(%
)
pH
Ni+2 fractionation in the solid phase
POM-bound FeOxide Clay Ni[OH]2[s]
0%
10%
20%
30%
40%
50%
60%
70%
80%
90%
100%
1 2 3 4 5 6 7 8 9 10 11 12 13 14
Fra
cti
on
of
tota
l co
nce
ntr
ati
on
(%
)
pH
Ni+2 fractionation in the solid phase
POM-bound FeOxide Clay Ni[OH]2[s]
0%
10%
20%
30%
40%
50%
60%
70%
80%
90%
100%
1 2 3 4 5 6 7 8 9 10 11 12 13 14
Fra
cti
on
of
tota
l co
nce
ntr
ati
on
(%
)
pH
Ni+2 fractionation in the solid phase
POM-bound FeOxide Clay Ni[OH]2[s]
0%
10%
20%
30%
40%
50%
60%
70%
80%
90%
100%
1 2 3 4 5 6 7 8 9 10 11 12 13 14
Fra
cti
on
of
tota
l co
nce
ntr
ati
on
(%
)
pH
Ni+2 fractionation in the solid phase
POM-bound FeOxide Clay Ni[OH]2[s]
0%
10%
20%
30%
40%
50%
60%
70%
80%
90%
100%
1 2 3 4 5 6 7 8 9 10 11 12 13 14
Fra
cti
on
of
tota
l co
nce
ntr
ati
on
(%
)
pH
Ni+2 fractionation in the solid phase
POM-bound FeOxide Clay Ni[OH]2[s]
0%
10%
20%
30%
40%
50%
60%
70%
80%
90%
100%
1 2 3 4 5 6 7 8 9 10 11 12 13 14
Fra
cti
on
of
tota
l co
nce
ntr
ati
on
(%
)
pH
Ni+2 fractionation in the solid phase
POM-bound FeOxide Ni[OH]2[s]
0%
10%
20%
30%
40%
50%
60%
70%
80%
90%
100%
1 2 3 4 5 6 7 8 9 10 11 12 13 14
Fra
cti
on
of
tota
l co
nce
ntr
ati
on
(%
)
pH
Ni+2 fractionation in the solid phase
POM-bound FeOxide Clay Ni[OH]2[s]
0%
10%
20%
30%
40%
50%
60%
70%
80%
90%
100%
1 2 3 4 5 6 7 8 9 10 11 12 13 14
Fra
cti
on
of
tota
l co
nce
ntr
ati
on
(%
)
pH
Ni+2 fractionation in the solid phase
POM-bound FeOxide Clay Ni[OH]2[s]
0%
10%
20%
30%
40%
50%
60%
70%
80%
90%
100%
1 2 3 4 5 6 7 8 9 10 11 12 13 14
Fra
cti
on
of
tota
l co
nce
ntr
ati
on
(%
)
pH
Ni+2 fractionation in the solid phase
POM-bound FeOxide Clay Ni[OH]2[s]
0%
10%
20%
30%
40%
50%
60%
70%
80%
90%
100%
1 2 3 4 5 6 7 8 9 10 11 12 13 14
Fra
cti
on
of
tota
l co
nce
ntr
ati
on
(%
)
pH
Ni+2 fractionation in the solid phase
POM-bound FeOxide Ni[OH]2[s]
U
K
U
K
U
K
U
KUK
UK
UK
UK
UK
U
K
UK
U
K
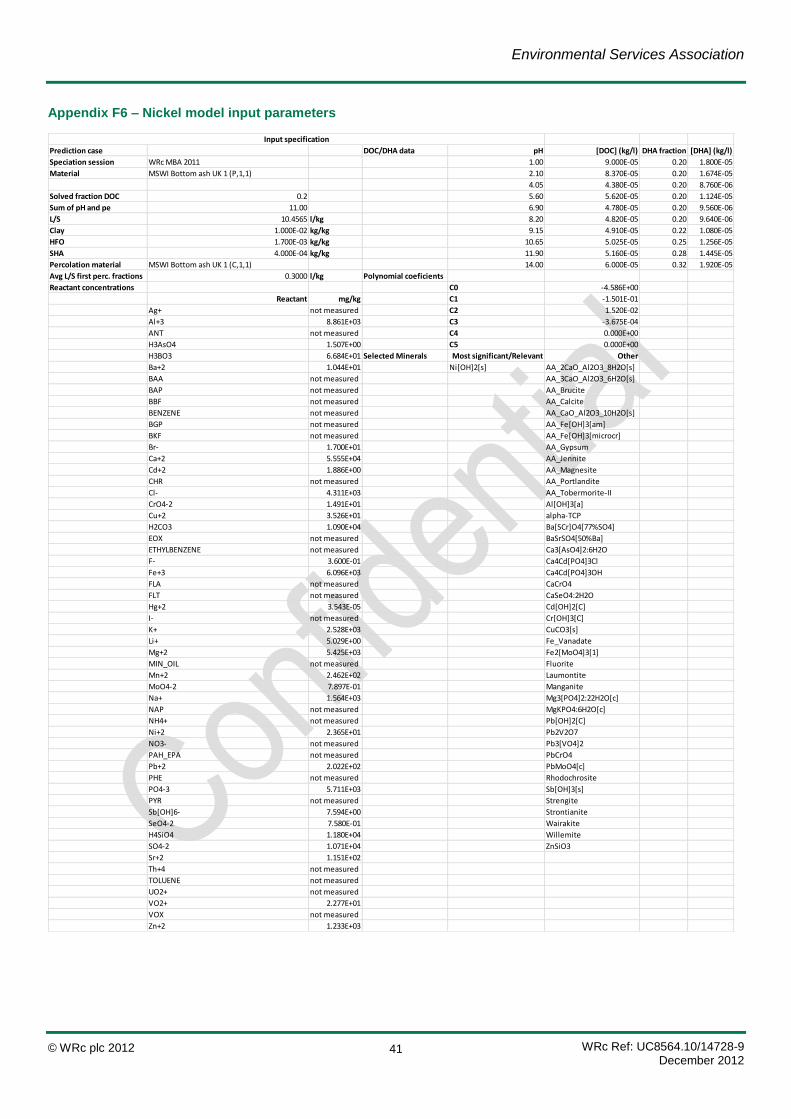
Environmental Services Association
WRc Ref: UC8564.10/14728-9 December 2012
© WRc plc 2012 41
Appendix F6 – Nickel model input parameters
Prediction case DOC/DHA data pH [DOC] (kg/l) DHA fraction [DHA] (kg/l)
Speciation session WRc MBA 2011 1.00 9.000E-05 0.20 1.800E-05
Material MSWI Bottom ash UK 1 (P,1,1) 2.10 8.370E-05 0.20 1.674E-05
4.05 4.380E-05 0.20 8.760E-06
Solved fraction DOC 0.2 5.60 5.620E-05 0.20 1.124E-05
Sum of pH and pe 11.00 6.90 4.780E-05 0.20 9.560E-06
L/S 10.4565 l/kg 8.20 4.820E-05 0.20 9.640E-06
Clay 1.000E-02 kg/kg 9.15 4.910E-05 0.22 1.080E-05
HFO 1.700E-03 kg/kg 10.65 5.025E-05 0.25 1.256E-05
SHA 4.000E-04 kg/kg 11.90 5.160E-05 0.28 1.445E-05
Percolation material MSWI Bottom ash UK 1 (C,1,1) 14.00 6.000E-05 0.32 1.920E-05
Avg L/S first perc. fractions 0.3000 l/kg Polynomial coeficients
Reactant concentrations C0 -4.586E+00
Reactant mg/kg C1 -1.501E-01
Ag+ not measured C2 1.520E-02
Al+3 8.861E+03 C3 -3.675E-04
ANT not measured C4 0.000E+00
H3AsO4 1.507E+00 C5 0.000E+00
H3BO3 6.684E+01 Selected Minerals Most significant/Relevant Other
Ba+2 1.044E+01 Ni[OH]2[s] AA_2CaO_Al2O3_8H2O[s]
BAA not measured AA_3CaO_Al2O3_6H2O[s]
BAP not measured AA_Brucite
BBF not measured AA_Calcite
BENZENE not measured AA_CaO_Al2O3_10H2O[s]
BGP not measured AA_Fe[OH]3[am]
BKF not measured AA_Fe[OH]3[microcr]
Br- 1.700E+01 AA_Gypsum
Ca+2 5.555E+04 AA_Jennite
Cd+2 1.886E+00 AA_Magnesite
CHR not measured AA_Portlandite
Cl- 4.311E+03 AA_Tobermorite-II
CrO4-2 1.491E+01 Al[OH]3[a]
Cu+2 3.526E+01 alpha-TCP
H2CO3 1.090E+04 Ba[SCr]O4[77%SO4]
EOX not measured BaSrSO4[50%Ba]
ETHYLBENZENE not measured Ca3[AsO4]2:6H2O
F- 3.600E-01 Ca4Cd[PO4]3Cl
Fe+3 6.096E+03 Ca4Cd[PO4]3OH
FLA not measured CaCrO4
FLT not measured CaSeO4:2H2O
Hg+2 3.543E-05 Cd[OH]2[C]
I- not measured Cr[OH]3[C]
K+ 2.528E+03 CuCO3[s]
Li+ 5.029E+00 Fe_Vanadate
Mg+2 5.425E+03 Fe2[MoO4]3[1]
MIN_OIL not measured Fluorite
Mn+2 2.462E+02 Laumontite
MoO4-2 7.897E-01 Manganite
Na+ 1.564E+03 Mg3[PO4]2:22H2O[c]
NAP not measured MgKPO4:6H2O[c]
NH4+ not measured Pb[OH]2[C]
Ni+2 2.365E+01 Pb2V2O7
NO3- not measured Pb3[VO4]2
PAH_EPA not measured PbCrO4
Pb+2 2.022E+02 PbMoO4[c]
PHE not measured Rhodochrosite
PO4-3 5.711E+03 Sb[OH]3[s]
PYR not measured Strengite
Sb[OH]6- 7.594E+00 Strontianite
SeO4-2 7.580E-01 Wairakite
H4SiO4 1.180E+04 Willemite
SO4-2 1.071E+04 ZnSiO3
Sr+2 1.151E+02
Th+4 not measured
TOLUENE not measured
UO2+ not measured
VO2+ 2.277E+01
VOX not measured
Zn+2 1.233E+03
Input specification
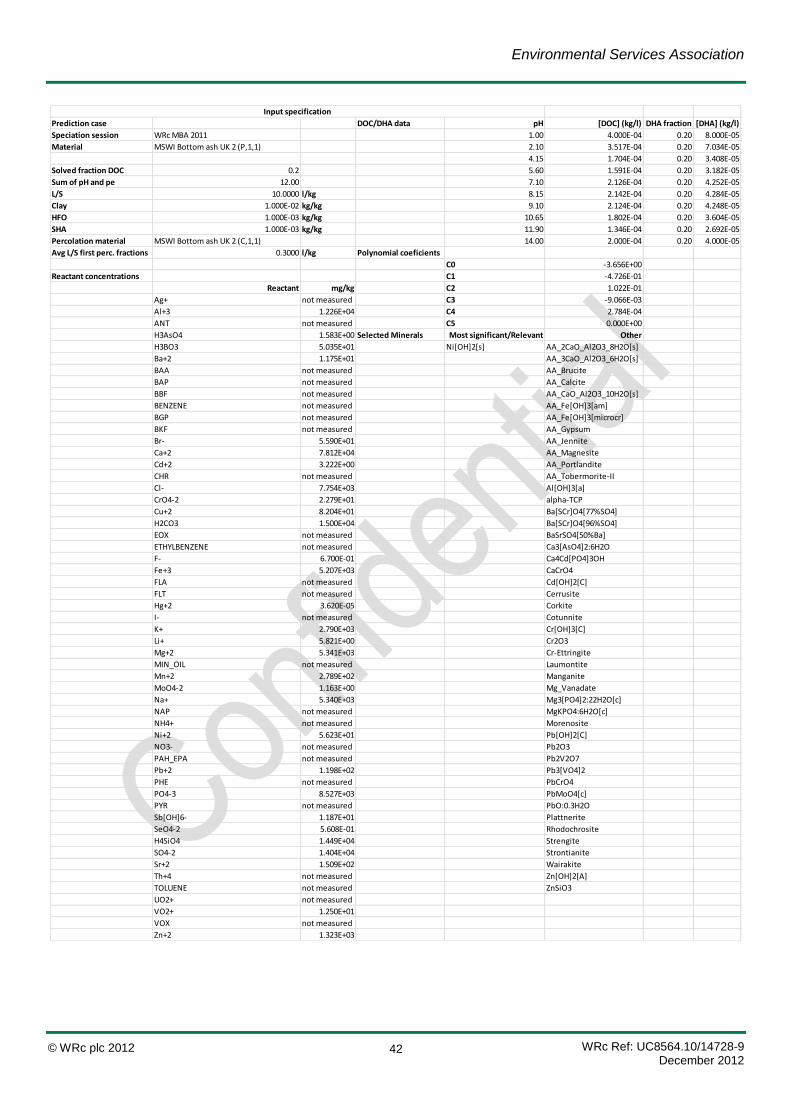
Environmental Services Association
WRc Ref: UC8564.10/14728-9 December 2012
© WRc plc 2012 42
Prediction case DOC/DHA data pH [DOC] (kg/l) DHA fraction [DHA] (kg/l)
Speciation session WRc MBA 2011 1.00 4.000E-04 0.20 8.000E-05
Material MSWI Bottom ash UK 2 (P,1,1) 2.10 3.517E-04 0.20 7.034E-05
4.15 1.704E-04 0.20 3.408E-05
Solved fraction DOC 0.2 5.60 1.591E-04 0.20 3.182E-05
Sum of pH and pe 12.00 7.10 2.126E-04 0.20 4.252E-05
L/S 10.0000 l/kg 8.15 2.142E-04 0.20 4.284E-05
Clay 1.000E-02 kg/kg 9.10 2.124E-04 0.20 4.248E-05
HFO 1.000E-03 kg/kg 10.65 1.802E-04 0.20 3.604E-05
SHA 1.000E-03 kg/kg 11.90 1.346E-04 0.20 2.692E-05
Percolation material MSWI Bottom ash UK 2 (C,1,1) 14.00 2.000E-04 0.20 4.000E-05
Avg L/S first perc. fractions 0.3000 l/kg Polynomial coeficients
C0 -3.656E+00
Reactant concentrations C1 -4.726E-01
Reactant mg/kg C2 1.022E-01
Ag+ not measured C3 -9.066E-03
Al+3 1.226E+04 C4 2.784E-04
ANT not measured C5 0.000E+00
H3AsO4 1.583E+00 Selected Minerals Most significant/Relevant Other
H3BO3 5.035E+01 Ni[OH]2[s] AA_2CaO_Al2O3_8H2O[s]
Ba+2 1.175E+01 AA_3CaO_Al2O3_6H2O[s]
BAA not measured AA_Brucite
BAP not measured AA_Calcite
BBF not measured AA_CaO_Al2O3_10H2O[s]
BENZENE not measured AA_Fe[OH]3[am]
BGP not measured AA_Fe[OH]3[microcr]
BKF not measured AA_Gypsum
Br- 5.590E+01 AA_Jennite
Ca+2 7.812E+04 AA_Magnesite
Cd+2 3.222E+00 AA_Portlandite
CHR not measured AA_Tobermorite-II
Cl- 7.754E+03 Al[OH]3[a]
CrO4-2 2.279E+01 alpha-TCP
Cu+2 8.204E+01 Ba[SCr]O4[77%SO4]
H2CO3 1.500E+04 Ba[SCr]O4[96%SO4]
EOX not measured BaSrSO4[50%Ba]
ETHYLBENZENE not measured Ca3[AsO4]2:6H2O
F- 6.700E-01 Ca4Cd[PO4]3OH
Fe+3 5.207E+03 CaCrO4
FLA not measured Cd[OH]2[C]
FLT not measured Cerrusite
Hg+2 3.620E-05 Corkite
I- not measured Cotunnite
K+ 2.790E+03 Cr[OH]3[C]
Li+ 5.821E+00 Cr2O3
Mg+2 5.341E+03 Cr-Ettringite
MIN_OIL not measured Laumontite
Mn+2 2.789E+02 Manganite
MoO4-2 1.163E+00 Mg_Vanadate
Na+ 5.340E+03 Mg3[PO4]2:22H2O[c]
NAP not measured MgKPO4:6H2O[c]
NH4+ not measured Morenosite
Ni+2 5.623E+01 Pb[OH]2[C]
NO3- not measured Pb2O3
PAH_EPA not measured Pb2V2O7
Pb+2 1.198E+02 Pb3[VO4]2
PHE not measured PbCrO4
PO4-3 8.527E+03 PbMoO4[c]
PYR not measured PbO:0.3H2O
Sb[OH]6- 1.187E+01 Plattnerite
SeO4-2 5.608E-01 Rhodochrosite
H4SiO4 1.449E+04 Strengite
SO4-2 1.404E+04 Strontianite
Sr+2 1.509E+02 Wairakite
Th+4 not measured Zn[OH]2[A]
TOLUENE not measured ZnSiO3
UO2+ not measured
VO2+ 1.250E+01
VOX not measured
Zn+2 1.323E+03
Input specification


