An Assessment of the Impacts of Geocaching on Natural ...• Demonstration parks (offering free GPS...
19
An Assessment of the Impacts of Geocaching on Natural Resources In Minnesota State Parks Jacqueline T. Brost and Edward M. Quinn Minnesota Department of Natural Resources Division of Parks & Trails Saint Paul, MN MN DNR, Division of Parks and Trails. Brost, Jacqueline T., and Edward M. Quinn. 2012. An Assessment of the Impacts of Geocaching on Natural Resources in Minnesota State Parks.
Transcript of An Assessment of the Impacts of Geocaching on Natural ...• Demonstration parks (offering free GPS...
An Assessment of the Impacts of Geocaching
on Natural Resources In Minnesota State Parks
Jacqueline T. Brost and Edward M. Quinn
Minnesota Department of Natural Resources Division of Parks & Trails
Saint Paul, MN
MN DNR, Division of Parks and Trails. Brost, Jacqueline T., and Edward M. Quinn. 2012. An Assessment of the Impacts of Geocaching on Natural Resources in Minnesota State Parks.

ABSTRACT This report summarizes the results of a study conducted by the Minnesota Department of Natural Resources – Division of Parks & Trails (MNDNR-PAT) in 2011 to assess defined impacts on natural resources caused by geocaching in Minnesota state parks. Further, the study describes methodologies used to identify areas and causes of high impact. Procedures were documented throughout this study with the potential to be utilized by the Minnesota Department of Natural Resources or other interested parties in conducting future impact assessments, as well as developing geocaching policies for protected areas.
INTRODUCTION Geocaching is defined as a high-tech treasure hunt that combines hiking with the use of handheld global positioning system (GPS) units (Patubo, 2010). According to geocaching.com (2011), the idea is to locate hidden containers (caches) outdoors, then share your experiences online, with a free account at the geocaching.com website. Multiple forms of geocaches exist. The most common is a standard geocache: a hidden container that includes, at minimum, a logbook for geocachers to sign. Other types include virtual caches, where no physical container exists – this type of cache generally marks a point of interest; an Earth cacheTM, similar to a virtual cache, but pertaining to geologic features, and a multi-cache, which involves two or more locations where the final location is the physical geocache site, and preceding locations (or waypoints) give hints to the following locations. Other less common types of caches are defined at geocaching.com. Geocaching has rapidly grown in popularity since it began in 2000 (Patubo, 2010). The availability of handheld GPS units to the public and, more recently, the accessibility of GPS enabled phones have contributed to its growing number of participants. As with most other recreational activities, geocaching has a measurable amount of impact on the environment in which it takes place. Geocaching in Minnesota The first geocaches appeared in the state, primarily the Twin Cities area, in 2001. By May of 2002, there were 273 caches in Minnesota and as of December, 2011 there were over 4,000 (geocaching.com 2011). The Minnesota Geocaching Association (MnGCA) was also established in 2002 with the mission of providing “a resource for Minnesota geocachers to organize activities and events that will improve the credibility of the sport, protect our natural resources and strengthen the community of geocachers in the state of Minnesota (MN Geocaching Association 2011). MNDNR-PAT received increasing numbers of inquiries regarding geocaching on state park lands as the popularity of geocaching grew. Initially, the division did not allow placement of geocaches on division-administered lands because state park rules (MR 6100.1650 subpart 2), prohibits the storage or abandonment of personal property on state park lands without prior approval of the park manager. The division was also concerned about visitor safety, potential impacts to natural/cultural resources, liability and the likely increase to staff workload. In 2005-06, at the request of the MN Geocaching Association, a number of meetings were held between division staff and MnGCA board members to see if there was a way that geocaching could be allowed on state park lands. As a
1

result of those discussions, the division determined that geocaching may be permitted in state parks so long as it was managed to conform to statutory direction for outdoor recreational activities allowed in state parks. Minnesota Statutes (86A.05 subd. 2c) defines those as activities “which will not cause material disturbance of the natural features of the park or the introduction of undue artificiality into the natural scene”. It also states that parks “shall not be designed to accommodate all forms or unlimited volumes of recreational use”. In 2006, MNDNR-PAT began allowing citizens to apply for permits to place geocaches and letterboxes on division- administered lands. Letterboxing is similar to geocaching but relies on clues rather than geographic coordinates to find a hidden container. The approval process was intended to minimize the potential for geocaching to cause impacts to natural and cultural resources and included such things as review of the proposed location related to rare natural features, cultural resource sites, high quality native plant communities, and areas of active management like prescribed burning. Only a handful of applications from citizens were received over the next two years. In 2008, MN DNR-PAT established a nearly system-wide geocaching program called The History Challenge to coincide with MN’s sesquicentennial. Caches were established at all 72 state park and recreation areas. The program ran for one year. Upon its completion in 2009, a new program was launched, called The Wildlife Safari. It was scheduled to run for three years (2009-2011). Due to the success of these programs in terms of another of the division’s goals to connect people to the outdoors, it is anticipated that MNDNR-PAT may continue to sponsor a system-wide program and continue to allow private citizens to establish geocaches on division-administered-lands through a permit process. As of December, 2011, there were approximately 339 active caches on state park and recreation areas. About 32 percent are owned by private citizens and 68 percent by PAT. Beginning in 2008, anecdotal observations by division staff, such as park managers and resource specialists, and even some visitors, indicated that impacts to natural resources were occurring. Typical impacts noted were trampling of vegetation, exposure of bare soil, soil erosion and damage to woody vegetation. Recognition that impacts were taking place led the division to plan and conduct a study in 2010-2011 to identify and quantify the types of impacts that were occurring, and identify the driving factors behind impacts in order to assist the division in better managing this activity.
STUDY DESIGN The goals of the study were to: 1. Quantify the amounts and types of observed impacts to natural resources that could be
directly attributable to geocaching activity on state park lands. 2. Identify factors that could be correlated with level of impact. 3. Develop a methodology which could be repeated in the future to assess further impacts at
these sites or at new locations. 4. Provide information that could be used by the MNDNR-PAT division or other interested
parties to assist them in developing and implementing policies to manage geocaching activities on protected lands.
2

A literature review was first carried out to determine if other studies such as this one had been conducted. No peer-reviewed articles specifically related to geocaching impacts were found, but some “gray literature” was uncovered as well as numerous journal articles related to impacts of outdoor recreation and tourism on natural and cultural resources in protected areas. Utilizing these articles and observations from division staff, four categories of impact were defined: trampling of vegetation, exposure of bare soil, soil erosion and damage to woody vegetation. 1. Trampled vegetation is self-explanatory. See figure 1 below. 2. Bare dirt is caused from trampling of vegetation to the point that the vegetation is eliminated,
so that only soil remains. See figure 2 below. 3. Eroded soil occurs largely only in those situations where the impact is associated with a
slope. See figure 3 below. 4. Damage to woody vegetation included broken or trampled stems or branches of shrubs and
seedlings or saplings of tree species. See figure 4 below.
Figure 1 - Trampled vegetation
Figure 2 - Bare dirt
Figure 3 - Eroded soil
Figure 4 - Damage to woody vegetation
These impacts were similar to those described by Patubo (2010). He identified environmental impacts associated with geocaching by reviewing past studies of the effects of similar
3

recreational activities on natural resources. Impacts included: trampling of vegetation, soil compaction, change in trail width and the spread on non-native plants. As expected, there is a typical progression which occurs based on the amount of use and level of impact. As use increases, the level of impact increases from trampled vegetation to bare soil and sometimes then followed by eroded soil (depending on slope). Damage to woody vegetation is a stand-alone attribute and can occur singly, or in conjunction with other impacts (i.e., bare dirt, as well as damage to woody vegetation at one site). Observations from division staff had showed that impacts occurred at three distinct locations: 1. Waypoints – places where a geocacher stops to search for the next set of coordinates on their
way to the physical container. Waypoints are typically only associated with multi-caches. 2. Geocache Sites – the physical location that contains the logbook and trinkets to be exchanged
by others finding the cache. 3. Travel ways – the routes along with geocachers travel to find waypoints and ultimately the
geocache. Throughout this report, the term ‘geocache’ encompasses the above three components. In addition to categorizing and quantifying impacts, the study sought to identify factors that were associated with the development of impacts at geocaching sites. These included: 1. Is impact associated with park attendance? 2. Is impact associated with online logbook entries? 3. Is impact associated with vegetation type at cache location? 4. Is impact associated with cache owner (private citizen, or MNDNR)? 5. Is impact associated with “demonstration” State Parks? (see definition under Park Selection) 6. Is impact associated with geocache distance from trail? 7. Is impact associated with surface type at cache locations?
METHODS Park Selection A sample of 21 State Parks was selected, based on the following criteria:
• 2009 total attendance values per park • MNDNR regional location (see appendix 1 for MNDNR region map) • Existing cache types at park locations (Virtual, Traditional, Multi-Cache) • Demonstration parks (offering free GPS rental and an optional ‘Geocaching 101’ course
to visitors) Table 1 shows categorized attendance values based on 2009 total attendance numbers, and percentage of each attendance category comprising sample parks visited. Six low, 5 medium, 6 high, and 4 very high parks were included in the sample. Table 1. 2009 park attendance values, ordinal rank, and percentages of parks per category in sample
Attendance Rank Attendance Values Total Parks Per Category
Park Percentage Per Category
Very High > 200,000 11 16%
2

High 100,000-199,000 22 32% Medium 50,000-99,000 17 25% Low 1,000-49,000 19 28%
Parks were selected based on regional locations as follows: • Region 1: 5 parks (Lake Bronson, Old Mill, Itasca, Lake Carlos, and Glacial Lakes) • Region 2: 4 parks (Bear Head Lake, Gooseberry, Crow Wing, and Moose Lake) • Region 3: 6 parks (Charles A. Lindbergh, Wild River, Afton, Fort Snelling, John A. Latsch,
and Carley) • Region 4: 6 parks (Nerstrand Big Woods, Flandrau, Minneopa, Rice Lake, Split Rock
Creek, and Blue Mounds) See appendix 1 for a map of DNR defined regions and sample park locations.
Eight of the 21 locations visited were demonstration parks. Park selection also carefully ensured a variety of Letterbox, Virtual, Earth, and Traditional caches. Database Development To establish the data collection process, a day was spent assessing impacts to geocaches within Nerstrand Big Woods State Park in September, 2010. Collection variables and methods were planned at this time. Timing of this visit was key in planning appropriate dates for data collection, and allowed for additional time for database development and adjustments to procedures prior to data collection between June – September, 2011. Following the site visit to Nerstrand, an impact assessment database was designed for collection of identified variables. All data collected in this project was gathered and stored in a personal geodatabase, created using ESRI’s ArcCatalog software. The database was developed with the North American Datum 1983 Universal Transverse Mercator Zone 15N projection. This projection was chosen due its designation as the standard projection at the MN DNR, since further analysis of the data was performed in conjunction with existing MN DNR data. The database structure held two feature classes within the feature dataset; a polygon feature class to hold areas of impact, and a polyline feature class to hold linear impact features (see Figure 5).
Figure 5 - Personal geodatabase design
A shapefile of current geocaches within Minnesota State Park boundaries was acquired from geographic information system (GIS) staff working for Groundspeak, owners of geocaching.com. This shapefile was imported into the geodatabase in order to reference current geocache locations and names. Geodatabase construction was planned with the intention of data collection. See figure 6 for data types and fields.
3

Figure 6 - Polygon and Polyline Field Names and Data Types
The Geo_ID field represented a unique identifier existing within the MN DNR’s geocaching Microsoft Access database. This allowed for collected polygon and polyline data to be joined to cache locations for further analysis. Measured length and measured width fields allowed for the data collector to manually measure the area of impact and enter measurement information in these fields. This data was collected with the intention of reviewing the spatial accuracy of the Trimble GeoXH GPS unit used for data collection in this research. Since the Trimble GeoXH was not equipped with a camera, photo fields were included in the database to easily reference photos taken at impact sites. Through database development, coded value domains were created to classify location, type of impact, and width of linear impact features. Domain specifications can be seen in Figure 7, Figure 8, and Figure 9.
Figure 7 - Impact Width Coded Values
Figure 8 - Type of Impact Coded Values
Figure 9 - Assessment Location Coded Values
4

Mobile Data Application Development & Data Collection A Trimble GeoXH GPS unit, equipped with a Zephyr Antenna was used for data collection in this report. The combination of the GPS unit with the antenna allowed for sub-foot accuracy, and provided low multipath, low elevation satellite tracking for enhanced data collection under dense tree cover. ArcGIS Mobile was used for all data collection throughout this project. A map service including the geodatabase developed for this project, as well as the MN DNR’s state park roads & trails GIS layer, and State Park boundary layer were added for locational reference. ArcGIS Mobile Project Center desktop software was then used to access the map service document and the geodatabase, in order to alter cartographic representations, field name displays, and labeling. ArcGIS Mobile streamlines data collection techniques and processes, and allows application developers to limit user controls. For the locational accuracy desired, GPS settings were carefully chosen in ArcGIS Mobile. ‘Stream GPS Position’ was used for all line and polygon data. GPS Quality Filter Settings were set as follows: • Required Fix Type: Fix • Maximum PDOP: 6 • GPS Average Settings:
o Minimum Positions: 5 o Auto Stop When Reaching Minimum Positions
• Streaming Mode: o Time o Enter Time (seconds): 1
Collected data was synced on a regular basis, to its geodatabase on the MNDNR’s GIS Server by connecting the Trimble GeoXH to an internal DNR desktop computer through the ArcGIS Mobile software. In addition to information collected via GPS, hand written notes were taken during site visits for observations not pertaining to database values. Photos were also taken at most sites, and were referenced by State Park name and Geocache unique ID value, derived from the MN DNR’s geocache database. Data collection occurred during summer months, specifically between June 1 through June 30, and July 20 through August 31, 2011, to ensure consistency in vegetation analysis during park visits.
ANALYSIS GIS Analysis Upon completion of data collection, data was imported into ArcMap via ArcGIS Mobile for analysis. Impact area and linear impact features were combined into one feature class, so that area of impact could be spatially analyzed as one dataset. Impact was defined as the dependent
5
variable in this project, while all other variables, such as logbook entries, distance from trail, etc., were defined as independent variables. Measurements of impact reflect those collected at the travel way, waypoints, and geocache container for each geocache visited. GIS was used to calculate the following:
• Total impact (feet2) o Calculate Geometry tool was used in the attribute table, specifying Feet US [ft] as
the unit of measurement • Average online logbook entries per year
o Current date (10/21/2011 – at time of data calculation) was subtracted from placement date to find total days of existence. Total online logbook entries (obtained from geocaching.com) were divided by total days of existence to obtain average online logbook entries per year.
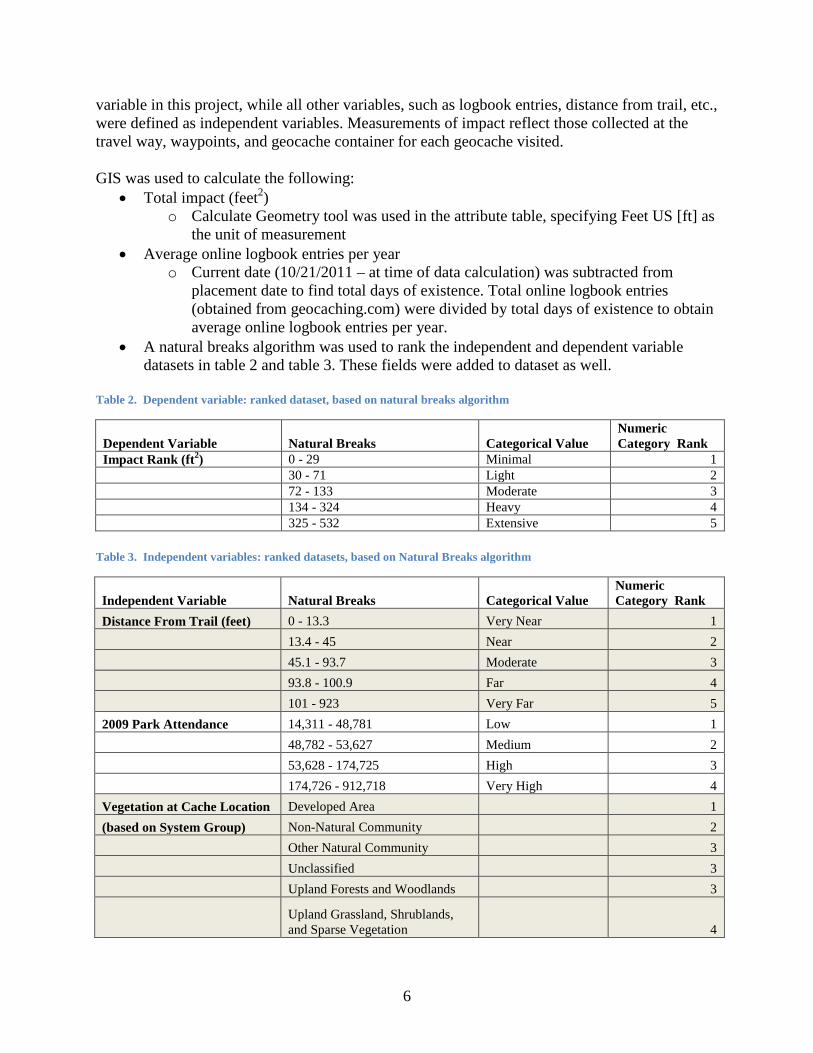
• A natural breaks algorithm was used to rank the independent and dependent variable datasets in table 2 and table 3. These fields were added to dataset as well.
Table 2. Dependent variable: ranked dataset, based on natural breaks algorithm
Dependent Variable Natural Breaks Categorical Value Numeric Category Rank
Impact Rank (ft2) 0 - 29 Minimal 1 30 - 71 Light 2 72 - 133 Moderate 3 134 - 324 Heavy 4 325 - 532 Extensive 5
Table 3. Independent variables: ranked datasets, based on Natural Breaks algorithm
Independent Variable Natural Breaks Categorical Value Numeric Category Rank
Distance From Trail (feet) 0 - 13.3 Very Near 1 13.4 - 45 Near 2 45.1 - 93.7 Moderate 3 93.8 - 100.9 Far 4 101 - 923 Very Far 5 2009 Park Attendance 14,311 - 48,781 Low 1 48,782 - 53,627 Medium 2 53,628 - 174,725 High 3 174,726 - 912,718 Very High 4 Vegetation at Cache Location Developed Area 1 (based on System Group) Non-Natural Community 2 Other Natural Community 3 Unclassified 3 Upland Forests and Woodlands 3
Upland Grassland, Shrublands, and Sparse Vegetation 4
6

Wetland Forests 5
Wetland Grasslands, Shrublands, and Marshes 5
Online Logbook Entries 0 - 34.8 Very Low 1 (average entries per year) 34.9 - 54.8 Low 2 54.9 - 99.6 Medium 3 99.7 - 177.1 High 4 177.2 - 267 Very High 5
Statistical Analysis Levels of impact caused by geocaching were compared to the seven factors listed earlier to determine if any of them (attendance, cache owner) were positively correlated with increased impacts. SPSS software was used to run statistical tests on collected data. Prior to analyses, all data was attributed numerical rank values in GIS, based on natural breaks of the data. Tests run in SPSS included cross-tabular and Pearson’s chi square. Sources of data for each of these factors are described below. 1. Was impact associated with park attendance? - Park attendance data was derived from the
MNDNR-PAT attendance database, based on 2009 total attendance values for each state park.
2. Was impact associated with online logbook entries? - Online logbook entries, from geocaching.com were calculated based on date of existence and individual online logs, as of October 20, 2011. Average number of online logbook entries per year was drawn from this data.
3. Was impact associated with vegetation type at cache location? – The vegetation type at each waypoint, travel way, and geocache site was obtained from MNDNR-PAT’s State Park Land cover GIS layer. System Group attributes were queried for this analysis.
4. Was impact associated with cache owner (private citizen vs MNDNR-PAT)? Cache owner data was obtained from the MN DNR geocache database.
5. Was impact associated with ”demonstration” State Parks, offering free GPS unit rental to visitors? - Demonstration parks included all state parks offering GPS unit rental to visitors, free of charge. This information was obtained from internal MN DNR park reports.
6. Was impact associated with geocache/waypoint distance from trail? - Distance from trails was calculated using ArcGIS, utilizing the MN DNR State Parks Trails and Roads layer, detailed steps to achieve distance results were described in suitability modeling section of this report.
7. Was impact associated with surface type at cache locations? Surface type was manually collected at each cache site, and was categorized as follows: hardened surface defined as gravel or paved ground, use area defined as public use area including but not limited to picnic, beach, playground areas, and natural area defined as any area not categorized as hardened surface or use area.
RESULTS Summary of Impacts A summary of site statistics for the 117 geocaches visited across 21 state parks:
7

• Average Impact Collected: 39.3 ft2 • Average number of visits to geocaches at which point measureable impact occurs: 55 • Geocache Owner:
o 61% of sites visited were MNDNR-PAT owned o 39% of sites visited were owned by private citizens
• Total Impact by Geocache Owner: o MNDNR-PAT: 2,906 ft2 o Private citizen: 1,693 ft2
• Total Area of Impact by Impact Type: o Bare Dirt: 2,550 ft2 o Trampled Vegetation: 1,727 ft2 o Eroded Soil: 321 ft2
• Surface Type: o 32% of sites visited were in use areas o 46% of sites visited were in natural areas o 16% of sites visited were on hardened surfaces o 6% of sites were not found
• Average Online Logbook Entries Per Year by Geocache Owner: o MNDNR: 148 visits per year
o Private citizen: 30 visits per year See table 4 for trends in surface type collected at MNDNR and private citizen owned sites. Table 4. Percentage of surface type, by geocache owner
Surface Type MNDNR-PAT Owned Sites
Private Citizen Owned Sites
Hardened Surface 18 % 17 % Natural Area 49 % 46 % Use Area 32 % 35 % Site Not Found 1 % 2 %
From Table 4, it can be derived that in both DNR and private citizen owned geocaches that natural areas are receiving the most damage, followed by use areas. Areas categorized as hardened surface received the least amount of impact. Statistical Analysis of Collected Data Alpha value outputs of Pearson’s Chi-Square test were analyzed in this study. Any alpha value less than or equal to .05 constituted a statistical significance. A statistically significant alpha value supports an existence of a relationship between the two variables being tested. All Pearson’s Chi-Square tests compared the dependent variable (impact) with an independent variable (online logbook entries, demonstration park, park attendance, etc.) to test for relationship. Expected count was also examined in this analysis. Expected count is defined as the sum of all possible values for a variable, each value multiplied by its probability of occurrence. An expected count of less than 5 in 20 percent of cells supports statistical significance.
8

Impact was initially calculated and classified based on total square feet of impact at each geocache, using a natural breaks algorithm to classify impact into 5 classes (see table 5). Table 5. Ordinal impact rank scale based on total impact ft2, determined by natural breaks
Defined Impact Rank Total Impact (ft2) 0 0 1 1 - 29 2 30 - 71 3 72 - 133 4 134 - 324 5 325 - 532
For all tests performed in SPSS, impact variables were collapsed to meet requirements of the Chi-Square test parameters. Impact ranks then were recoded as follows: (0 = 0), (1, 2 = 1), (3, 4, 5 = 4). See table 6 for collapsed classifications. Table 6. Collapsed impact rank scale based and total impact ft2
Collapsed Impact Rank
Total Impact (ft2)
0 0 1 1-71 4 72-532
Three major findings were concluded in this report (explained in further detail below):
1. Impact is associated with surface type 2. Impact is associated with cache owner 3. Impact is not associated with remaining variables tested, including:
a. Attendance b. Distance to trail c. Demonstration Parks d. Vegetation type at geocache e. Online logbook entries
1. Impact is associated with surface type Analysis of Impact and Surface Type showed less impact occurring at hardened surface and use areas, with the majority of impact collected in natural areas. Pearson’s Chi-Square test resulted in an alpha value of .001. Results of this test further supported statistical significance of the variables being tested, with expected count values showing 11.1% of cells having an expected count less than 5. Table 7. Pearson’s Chi-Square test results of impact and surface type
Value Degrees of Freedom
Alpha value
Pearson Chi-Square
64.060a 4 .001
a.1 cells (11.1%) have expected count less than 5. The minimum expected count is 3.80.
9
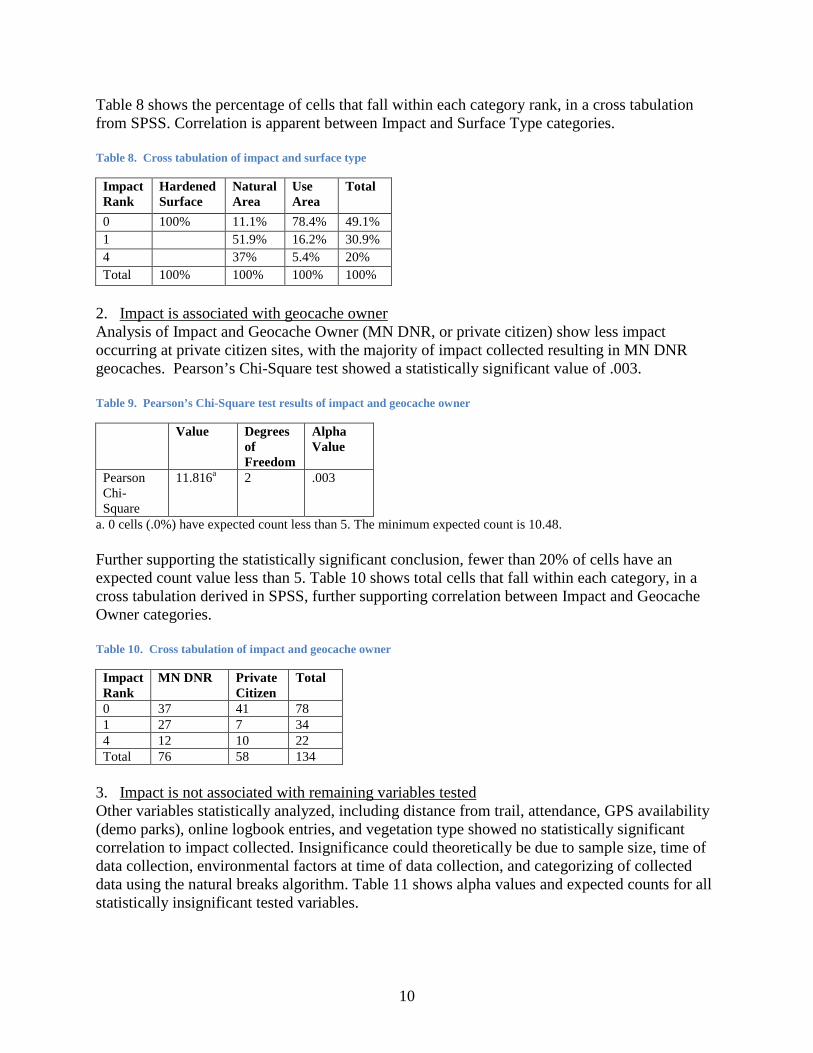
Table 8 shows the percentage of cells that fall within each category rank, in a cross tabulation from SPSS. Correlation is apparent between Impact and Surface Type categories. Table 8. Cross tabulation of impact and surface type
Impact Rank
Hardened Surface
Natural Area
Use Area
Total
0 100% 11.1% 78.4% 49.1% 1 51.9% 16.2% 30.9% 4 37% 5.4% 20% Total 100% 100% 100% 100%
2. Impact is associated with geocache owner Analysis of Impact and Geocache Owner (MN DNR, or private citizen) show less impact occurring at private citizen sites, with the majority of impact collected resulting in MN DNR geocaches. Pearson’s Chi-Square test showed a statistically significant value of .003. Table 9. Pearson’s Chi-Square test results of impact and geocache owner
Value Degrees of Freedom
Alpha Value
Pearson Chi-Square
11.816a 2 .003
a. 0 cells (.0%) have expected count less than 5. The minimum expected count is 10.48. Further supporting the statistically significant conclusion, fewer than 20% of cells have an expected count value less than 5. Table 10 shows total cells that fall within each category, in a cross tabulation derived in SPSS, further supporting correlation between Impact and Geocache Owner categories. Table 10. Cross tabulation of impact and geocache owner
Impact Rank
MN DNR Private Citizen
Total
0 37 41 78 1 27 7 34 4 12 10 22 Total 76 58 134
3. Impact is not associated with remaining variables tested Other variables statistically analyzed, including distance from trail, attendance, GPS availability (demo parks), online logbook entries, and vegetation type showed no statistically significant correlation to impact collected. Insignificance could theoretically be due to sample size, time of data collection, environmental factors at time of data collection, and categorizing of collected data using the natural breaks algorithm. Table 11 shows alpha values and expected counts for all statistically insignificant tested variables.
10

Table 11. Pearson’s Chi-Square test results between impact and independent variables
Independent Variable
Value Degrees of Freedom
Alpha Value
Attendance 3.382a 6 .760 Distance to Trail .743 b 4 .946 Demo Parks 1.726 c 2 .422 Vegetation Type 6.750 d 8 .564 Online Logbook Entries
7.515e 4 .111
a. 3 cells (25%) have expected count less than 5. The maximum expected count is 3.61 b. 0 cells (0%) have expected count less than 5.09. The minimum expected count is 5.09. c. 0 cells (0%) have expected count less than 5. The minimum expected count is 10.51. d. 5 cells (33.3%) have expected count less than 5. The minimum expected count is 2.30. e. 1 cell (11.1%) has expected count less than 5. The minimum expected count is 3.42.
DISCUSSION Factors Affecting Data Collection and Analysis Four factors likely played a role in the level of impact observed at state park geocaching sites. These included: siting of caches to reduce impacts, the 20 day government shut-down in July, flooding, categorization of data and sample size. Prior to placement on state park lands, proposed geocaches are reviewed by park managers, division resource specialists and state park archaeologists in an effort to minimize the potential for a geocache and associated waypoints and travel ways to cause negative impacts to natural/cultural resources. The proposed location is reviewed relative to the presence of rare natural features, cultural resource sites, high quality native plant communities, areas of active management like prescribed burning and ecological reconstruction and possible conflicts with other visitors. This fairly rigorous review process likely has reduced the levels of impact that would have occurred if caches were placed only with geocaching in mind. In the Wildlife Safari program, requirements for placing caches also probably helped minimize impacts. The first waypoint on all Wildlife Safari geocaches had to be in a use area as did all but the final location, the “critter cache”. The critter cache had to be placed within ten feet of the trail. Data collection took place at twenty-one Minnesota State Park locations during the summer of 2011, beginning in early June and concluding by the end of August. However, between July 1 and July 20, 2011, the Minnesota State Government shut down. During that period all state parks, state recreation areas and state waysides were closed to the public. All geocaches in those units were temporarily disabled (cache information was not accessible on geocaching.com).Upon re-opening of the parks, all geocaches were returned to active status and data collection for the project continued. This closure likely affected data collection in two ways. During the latter two weeks of June, typical maintenance at many state parks was reduced as preparations for the shut-down took place which resulted in overgrown vegetation in some locations. Another factor that may have affected levels of impact was the lack of visitation during the first 20 days of July, typically one of the highest visitation periods of the year for state parks.
11

Further, prolonged flooding occurred at two of the highest attended parks visited during this study, Fort Snelling and Nerstrand Big Woods State Parks. Geocaches at both of these parks were located directly within the flood zone. In these areas, impact was indistinguishable, since silt and mud had been carried and deposited across most of the vegetation in assessment areas. In addition, the system used to categorize and rank collected data may have affected analysis outputs in an unfavorable way. Using GIS to obtain natural breaks in the data was one of many categorical outputs that may have been used in this study. Unless a further analysis of categorizing data was performed, it will remain unknown how this system of data ranking has affected the collected data of this project. Finally, statistical calculations provided few significant results when determining independent variables correlation to the dependent variable in this study. A larger sample size can always alter results of a statistical analysis. Many of the statistical analyses employed exhibited no significant trends, likely due to small sample size. Further Research In addition to the research described in this report, an analysis was performed on the accuracy of GIS modeling for geocache placement site suitability. This study is titled ‘Assessing Effects of Geocaching as a Recreational Activity on Natural Resources within Minnesota State Parks’, by Jacqueline T. Brost, Saint Mary’s University of Minnesota, Department of Resource Analysis, 2011. See appendix 2 for a map of the suitability assessment used within Itasca State Park’s boundaries. This model utilized geocache distance from trail, state park landcover system group vegetation data, and SSURGO Soil K-Factor as inputs for weighted analysis in GIS. A similar suitability model could be used as a tool for assisting in planning and selecting sites for geocaches in the future, however further research and consideration should be taken into account when selecting input datasets for weighted analysis.
CONCLUSION Statistical analysis of collected and existing data throughout this project has shown that two variables account for the majority of geocache impacts in the parks sampled. Those two variables were geocache owner (MNDNR-PAT vs. private citizen), and ground surface type at geocaches. Geocache Owner At over 50% of geocaches owned by the division impacts from low to high were observed compared with 29% at citizen owned caches. The difference in impact is likely explained by the variation in visitation rates between the two types. Nearly all MNDNR-PAT caches are associated with the division’s Wildlife Safari program. The program provides a variety of incentives for visitors such as “critter awards” which rewards visitors visiting increasing numbers of caches (10, 20, etc) with a special collectible card (MNDNR 2011).
12

Collected data was analyzed using GIS to determine how many visits it takes for measureable impact to occur. Specifically, online logbook entries for each geocache visited were obtained from geocaching.com, as well as the initial geocache placement date. From this data, an average number of visits per year could be derived. Results showed that impacts to natural surfaces begin to occur after approximately 55 visits. It is important to note that this figure varies based on soil type, slope, and other factors. Surface Type As anticipated, at geocaches placed in areas of hard surfaces no impacts to natural resources were observed. Somewhat surprisingly, approximately 15% of geocaches in use areas exhibited low levels of impact and about 5% showed high levels of impacts specifically related to geocaching. The highest levels of impact were observed in natural areas where 89% of caches or waypoints had impacts with nearly 40% being classified as heavy (134 – 324 ft2). Attendance, Demonstration Parks and Logbook Entries Park attendance, demonstration parks and logbook entries were examined to determine if they could be used to anticipate or track when impacts may occur. While park attendance and demonstration parks clearly weren’t correlated with impact, online entries exhibited a trend, though it was not statistically significant. Distance to Trail and Vegetation Type It had been expected that impacts would rise with increased distance from the trail. However, the paucity of geocaches found > 10 feet from the trail indicates that this question did not have enough data to generate a significant response. Vegetation type on MNDNR-PAT lands was nearly always classified in polygons of five acres or larger so didn’t lend itself well to analysis relative to geocaching sites which are closer to a 100th of an acre in size. Recommendations for Protected Area Managers 1. Proposed locations for geocaches, waypoints and travel ways need to be reviewed to avoid
rare features, archaeological sites, high quality natural communities, insure visitor safety, etc. 2. Incentives for geocachers related to geocaching programs, such as, the MNDNR-PAT
Wildlife Safari, should focus on ways to disperse use, not encourage visitation to the same caches by large numbers of people, OR insure that waypoints, travel ways & cache locations are on surfaces capable of heavy use.
3. It is critical to consider travel routes between waypoints when evaluating proposed multi-caches to insure that geocachers will largely follow existing trails and not go cross-country to reach the cache or next waypoint.
4. Provide boot brush stations or other devices to aid visitors in cleaning boots/equipment as a means of preventing the introduction spread of invasive species.
5. Decide upfront how potential natural/cultural resource impacts will be monitored and addressed.
6. Whenever possible, caches should be placed in disturbed areas such as old fields or low-quality native plant communities. Caches should not be placed in areas where visitors may encounter/transfer invasive species.
7. Cache placement should be carefully assessed to avoid potential impact to historic structures.
13

8. Consider conducting a suitability analysis if a geocaching program is being developed or it is anticipated that multiple geocaching locations will be requested in order to reduce overall staff review time.
References • Groundspeak, Inc. 2011. Frequently Asked Questions about Geocaching. In Geocaching -
The Official Global GPS Cache Hunt Site. Retrieved February 21, 2011, from http://www. geocaching.com.
• Minnesota Department of Natural Resources. 2011. MN State Parks Wildlife safari geocache challenges. Internal division recreational outreach program.
• Minnesota Geocaching Association. 2011. Mission statement. Retrieved December 3, 2011 from http://mngca.org/mission_statement.
• Patubo, B. 2010. Environmental Impacts of Human Activity Associated With Geocaching. Retrieved November 2, 2011, from http://digitalcommons.calpoly.edu/erscsp/12.
14

Appendix 1 - MNDNR Regions and Sample Park Locations
15

Appendix 2 - Suitability map displaying likelihood of impact at based at Itasca State Park
16