
AN ASSESSMENT OF OUT OF HOME FOOD AND DRINK IN€¦ · AN ASSESSMENT OF OUT OF HOME FOOD AND DRINK...
64
AN ASSESSMENT OF OUT OF HOME FOOD AND DRINK IN SCOTLAND Commissioned by Food Standards Agency in Scotland Prepared by NPD Group Inc. Project number FS307009 March 2014
Transcript of AN ASSESSMENT OF OUT OF HOME FOOD AND DRINK IN€¦ · AN ASSESSMENT OF OUT OF HOME FOOD AND DRINK...

AN ASSESSMENT OF
OUT OF HOME FOOD
AND DRINK IN
SCOTLAND
Commissioned by Food Standards Agency in Scotland
Prepared by NPD Group Inc.
Project number FS307009
March
2014

2
Contents
Contents ........................................................................................................ 2
List of Figures ................................................................................................. 4
List of Tables .................................................................................................. 5
Glossary of terms ........................................................................................... 6
Summary ....................................................................................................... 8
1. Introduction ............................................................................................. 10
2. Aims and Objectives ................................................................................. 12
3. Data and Methodology ............................................................................ 13
3.1 Data analysis ............................................................................................................ 14
4. Results ..................................................................................................... 15
4.1 Overview of Scottish out of home market ................................................................. 15
4.11 Overview of channels ................................................................................. 16
4.12 Independents and Brands ........................................................................... 19
4.2 Key demographics and occasions .............................................................................. 20
4.21 Age Group .................................................................................................. 20
4.22 Gender ....................................................................................................... 22
4.23 Socio economic status ................................................................................ 23
4.24 Day of week/Daypart.................................................................................. 23
4.3 Key Food and Beverage Trends ................................................................................. 25
4.31 Key Food Trends ......................................................................................... 27
4.32 Key Beverage Trends .................................................................................. 31
4.33 Key Food and Beverage Trends among 0-12 year olds .................................. 34
4.4 Meal time Peaks ....................................................................................................... 39
4.5 Promotions .............................................................................................................. 40
4.6 Motivations.............................................................................................................. 43
5. Discussion ................................................................................................ 45
6. References ............................................................................................... 48

3
7. Appendices .............................................................................................. 49
Appendix 1 Estimated Population Figures for Scotland (source ONS) ............................. 49
Appendix 2 Definitions of channels and sub-channels.................................................... 50
Appendix 3 CREST Questionnaire .................................................................................... 53
Appendix 4 Food Categories ........................................................................................... 54
Appendix 5 Top Food Categories in Scotland- Top Items by Chain/Independents- 2YE Dec
12 .................................................................................................................................. 55
Appendix 6: Top Beverage Categories in Scotland- Top Items by Chain/Independents- 2YE
Dec 12 ........................................................................................................................... 62
Acknowledgements
Guy Fielding and Jessica Chambers would to acknowledge the Food Standards Agency in
Scotland for commissioning and funding this project and also thank the following people
from the Food Standards Agency in Scotland for their support and guidance throughout the
project.
Anne Milne
Tola Kolawole
Calum Yule

4
List of Figures Figure 1: Total of Home Visits per capita in Scotland .......................................................................... 15
Figure 2: QSR Categories- Visits per Capita (average annual visits per person)- 2YE Dec 12 ............... 17
Figure 3: Traffic Share (%), Traffic Change (000) and % Traffic Change of major channels in Scotland-
YE Dec 12 vs. YE Dec 11 ......................................................................................................................... 18
Figure 4: Scotland Total OOH- Traffic Share & % Traffic Change- YE Dec 12 vs. YE Dec 11 .................. 19
Figure 5: Per Capita Visits (average annual visits) to Scotland Total OOH by age ................................ 20
Figure 6: Share of Total OOH Meal Occasions (%) by Party composition- Scotland vs. the Rest of GB
(excluding Scotland) .............................................................................................................................. 21
Figure 7: Share of Meal Occasions (%) by Party Composition- Channel comparison in Scotland- YE Dec
12 .......................................................................................................................................................... 22
Figure 8: Share of Visits (%) by Social Group- Channel comparison in Scotland .................................. 24
Figure 9: Share of Visits (%) by Daypart- Channel comparison in Scotland .......................................... 24
Figure 10: Top 5 Food Categories by clock time- Scotland Total OOH- 2YE Dec 12 ............................. 39
Figure 11: Share of Total OOH Visits in Scotland- by Promotion- over time ........................................ 40
Figure 12 Share Visits (%) in Scotland by Promotion- Channel Comparison- YE Dec 12 ...................... 40
Figure 13 Distribution of Meal Deal Traffic by Type in Scotland- YE Dec 12 ........................................ 41
Figure 14: Distribution of traffic by top Motivations by Channel in Scotland YE 12 ......................... 43

5
List of Tables Table 1: Total Out Of Home Channels .................................................................................................... 7
Table 2: Global comparison of annual visits ......................................................................................... 15
Table 3: Scotland Major Channels - Visits (000) ................................................................................... 16
Table 4: Share of Total OOH Visits (%)- YE Dec 12 Scotland and GB .................................................... 16
Table 5: Share of OOH Visits to QSR (%)- YE Dec 12 Scotland and GB .................................................. 17
Table 6: QSR Category Traffic Share of Total OOH- YE Dec 12 vs. YE Dec 11 ...................................... 18
Table 7: % Traffic Share Total OOH Ye Dec ’12 for Major Brands ......................................................... 20
Table 8 : Percentage Share of Visits by Age and Channel in Scotland - YE Dec 12 .............................. 20
Table 9: Per Capita Visits (average annual visits) to Scotland QS Ethnic by age- 2YE Dec 12............... 21
Table 10: Top 25 food categories by % Incidence in GB and Scotland Total OOH- 2YE Dec 12 ........... 25
Table 11: Top 12 Beverage categories by % incidence in GB and Scotland Total OOH- 2YE Dec 12 .... 26
Table 12: Top 10 growing food and beverage categories (by Incidence percentage change 2YE Dec 12
vs. 2YE Dec 10) in QSR Scotland ............................................................................................................ 27
Table 13: Top 25 Food Categories by % Share of Servings by Channel in Scotland- 2YE Dec 12 .......... 28
Table 14: Top 25 food categories in QSR Scotland- with share of Total OOH servings- 2YE Dec 12 .... 30
Table 15: Major Brands Share of Food Servings (%) – 2YE Dec 12 ....................................................... 31
Table 16: Top Beverage Categories- by % share of Servings by Channel in Scotland- 2E Dec 12 ......... 32
Table 17: Top Beverage Category -by % Incidence – 2YE Dec 12 ........................................................ 33
Table 18: Share of Servings in Total OOH Scotland, by Beverage Size (%)- 2YE Dec 12 ....................... 33
Table 19: Food and Beverage Incidence (%) among 0-12 year olds vs. Total Scotland 2YE Dec 12 ..... 35
Table 20: Key Food and Beverage Facts ................................................................................................ 36
Table 21 Top Food and Beverages- % of Servings on Promotion- 2YE Dec 12 ..................................... 41
Table 22: Motivations for Going Out- % Share of Meal Occasions- Scotland vs. the rest of GB
(excluding Scotland)- YE Dec 12 ............................................................................................................ 44
6
Glossary of terms Eating Out of the Home
Any occasion where a consumer had something to eat or drink that was purchased for
immediate consumption outside of the home. For example, a sandwich purchased at a
supermarket would be included, however a grocery shop would not be included. Take-away
and home delivered food, such as pizzas are also included.
Raw Sample
Total number of completed eater occasions/transactions from panellists
Sales
Estimate of total consumer expenditures for commercial foodservice meals and snacks,
excluding any tip.
Visits/Traffic
Total consumer-reported meals or snacks from commercial foodservice outlets. “Heads”
through the door.
Servings
The number of times a food or beverage was ordered at a commercial restaurant.
Average Individual Spend
Average amount paid for one person’s food and beverage. Does not include tip, but does
include VAT.
Major Brands
The 26 largest brands in the UK with regard to market share: Asda, Bakers Oven, Beefeater,
Boots, Brewers Fayre, Burger King, Caffe Nero, Co-op, Costa Coffee, Dominos, Greggs,
Harvester, KFC, Marks & Spencer, McDonalds, Morrisons, Nandos, Pizza Express, Pizza Hut,
Pret A Manger, Sainsburys, Starbucks, Subway, Tesco, Toby Carvery, Wetherspoon.
Small Brands
All brands listed in CREST dictionary which were not coded as 'Major'- did not have the same
market penetration as the Major Brands, but are still well known nationally. Details available
from NPD Inc.
Independents
Small usually locally based businesses with very few, if any, additional premises.
Average Price Per Item (**)
Average Individual Spend divided by Items per person
Average Items Per Eater / Order Size / Basket (*)
Average number of different food items per person, per meal/snack. (*) Order size does not
include same item multiples or refills. (**) CREST does not collect item price thus can’t size
market value for specific product (e.g. burgers, cereal, etc.)
Incidence / Menu Importance
The percentage of orders (or visits) that include a specific food or beverage item, group of
items, or category of items.
Per Capita

7
Number of times the average GB or consumer in Scotland eats an out of home meal or
snack in a given year. This can be looked at by any filter with matching population counts
(e.g. age, income, gender, etc.). The Population for Scotland used in calculations is detailed
in Appendix 1. (source: ONS):
Change versus the Same Period Year Ago
YOY (Year on Year) or Percentage change from Year Ago (PCYA) the % change versus same
time period year ago (e.g. annual, quarter, month, etc.).
Frequency
How often a typical consumer frequents a specific brand, category, channel, or segment of
the industry in a 4-week period
Socio-economic groups
Groups A, B, C1, C2, D and E are based on employment status as follows:
o A: HIGHER MANAGERIAL/ADMINISTRATIVE
o B: INTERMEDIATE MANAGERIAL/ADMINISTRATIVE
o C1: SUPERVISORY/CLERICAL,JUNIOR MANAGERIAL
o C2: SKILLED MANUAL WORKERS
o D: SEMI-SKILLED/UNSKILLED MANUAL WORKERS
o E: ON STATE BENEFIT/UNEMPLOYED
Total Out of Home (OOH)
The entire foodservices industry- which includes all channels and sub-channels. Definitions
are provided in Appendix 2.
Table 1: Total Out Of Home Channels
Commercial Non-Commercial
Quick Service Pubs Full Service Travel &
Leisure
Workplace College &
University
Burger Pubs FS Traditional Hotels Canteen Canteen
Fish & Chip FS Ethnic In Store Vending Vending
Chicken FS Pizza Bar/Club
Sandwich Café/Bistro Motorway
Bakery On Board Cat
Coffee Other
Pizza/Italian
Ethnic
Supermarket
Petrol Non-
Commercial
Vending

8
Summary
Background
Overweight and obesity is caused in large part by an over-consumption of calories, which
may be encouraged by the easy availability of calorie-rich foods, beverages and meals when
eating out of the home (OOH).
Aim
Because of a lack of published data on eating OOH, the aim of this project was primarily to
obtain a general overview of OOH catering provision in Scotland and information on foods
and beverages purchased by consumers OOH.
Methods
Data analysis was undertaken by NPD Group Inc, using CREST (Consumer Reports on Eating
Share Trends). The majority of data presented in this report came from consumer research
panel data collected between January 2010 and December 2012. The data was based on
over thirteen thousand eating occasions covering all food and beverage purchased OOH in
Scotland. Children up to 16 were only included if they were accompanied by an adult.
Bespoke food and beverage categories were created from CREST data and analysed for
percentage incidence (proportion of total OOH visits) and by total number of servings.
Main findings
Visits
There were nearly 1 billion (950 million) visits OOH in Scotland in 2012 and an annual
purchase of over 2 billion servings of foods and drinks. The average number of visits
per capita in Scotland decreased slightly from 187 in 2010 to 180 in 2012. The total
spend on OOH occasions was £4.2 billion with an average spend per visit of £4.38.
There was a similar number of total visits per capita and similar pattern of visits in
Scotland and Great Britain (GB). Independent retailers/caterers had the largest share
of visits in Scotland (53%). Major Brands made up 33% of all visits. The top 3 Brands
in Scotland were McDonalds, Greggs and Tesco with 5.6%, 4.3% and 3.5% of OOH
visits respectively.
Quick Service Restaurants (QSR) accounted for almost 50% of visits. There was a
slight bias in Scotland towards QS Ethnic (Indian and Chinese meals), QS Bakery and
QS Fish and Chips.
Food and Beverage consumption
Chips/French Fries was the most commonly consumed food category, eaten at
nearly 10% of all visits. Cakes/Biscuits/ Pastries were consumed on 9% of visits.
Speciality Coffee/Hot Chocolate and Regular Cola were both consumed on 10% of
visits.
Plain Fruit and Vegetable consumption (excluding sandwiches, mixed salads (mainly
dressed) and fruit juice) was consumed on 2% or fewer visits by both adults and
children.

9
There was a similar pattern of food and beverage consumption in Scotland and GB.
However consumers in Scotland were 33% more likely to consume Chinese/Asian
Meals compared to GB, and 50% more likely to consume Regular Fizzy Drinks
excluding Cola. The proportion of visits which included plain Fruit and Vegetables
was much lower in Scotland compared to GB for both adults and children.
Independent caterers/retailers had the largest share of servings for most food and
beverage categories, most notably over 80% and 90% of Indian and Chinese Dishes
respectively, 90% of Water (Bottled & Tap) was purchased through Independent
caterers/retailers.
Major Brands dominated some categories e.g. Fried and Breaded Chicken, Burgers,
Pies/Pastries/Sausage Rolls and Chips/French Fries and Total Cola. Forty-seven
percent of Regular and Diet Cola was purchased from Major Brands.
There was a similar pattern of consumption among 0-12 year olds in Scotland and
GB. Children in Scotland were more likely to consume Burgers, Pizza, Pies, Pasties
and Sausage Rolls, and Chinese/Asian main dishes compared with the same age in
GB and compared to other age groups. The incidence of Total Cola and Total Fizzy
Drinks excluding Cola was higher among 0-12 year olds in Scotland than GB, 22% of
all visits by 0-12 year olds in Scotland included Cola.
Other results
The proportion of visits which included foods and beverages on promotion increased
between 2009 and 2012, including over 25% of visits in 2012. The food categories
that were most likely to be purchased on promotion were Fried Chicken (54%),
Cheese Burgers (53%) and Pizza (43%). There was a similar pattern of promotional
activity in Scotland and GB. Upsized Meal Deals were reported more frequently in
Scotland compared to GB.
In general, nutrition information was available from the Major Brands but not from
Independent caterers/retailers.
Less than 4% of consumers reported that their motivation to eat out was to have
something light/balanced. The only food category which increased on occasions
when consumers wanted something light/balanced was Diet Cola (13.1% Incidence
vs. 8.4%).
Conclusion
From a public health perspective, these results provided a disheartening overview of eating
OOH in Scotland with consumers reporting frequent consumption of calorie dense, high
fat/sugar foods and drinks. The data do however provide a rich source of information which
can usefully inform Food Standards Agency Scotland FSAS and Scottish Government policy
on nutrition.

10
1. Introduction There is a pressing need to reduce the rising levels of obesity in Scotland. Overweight and
obesity is caused in large part, by an over-consumption of calories, which may be
encouraged by the easy availability of large portion sizes and calorie rich foods, beverages
and meals.
Obesity is posing a serious risk to the health of the Scottish population as detailed in
Scottish Government (SG) policy documents1. At a population level, intakes of fats, sugars
and salt persist at levels considerably higher than the Scottish Dietary Goals2. There is a
need to create environments in which access to healthier, less calorie rich food and
beverages and smaller portion sizes becomes the norm in Scotland and people find it easier
to consume a healthy balanced diet.
The SG and FSAS have been engaging with retailers, manufacturers and caterers with the
aim of achieving population reduction in calorie consumption through a draft voluntary
framework for action Supporting Healthy Choices3 published in May 2013. The framework
document states that the balance of products available to consumers in Scotland needs to
shift in favour of those that contain fewer calories, fats, sugars and salt. This includes
reducing the calories and salt content of foods and beverages purchased Out of Home
(OOH).
Food and beverage consumed OOH makes up an important part of our diet. Evidence from
the Living Cost and Food Survey (LCF) indicates that eating out accounts for around 12% of
total energy intake4.
The market for OOH food and beverage purchase is very diverse ranging from formal
restaurant dining to eating on the go, and includes quick service restaurants, workplace
canteens, pub chains, coffee shops, vending machines, supermarkets, corner shops etc.
It has been suggested that food offered OOH is often higher in energy and fat than food
prepared and cooked at home5. It is difficult to get a true picture of the nutritional content
of food eaten OOH because of the diversity of the food sector, the additional challenge of
recording food intakes away from home, and because there is no requirement for
nutritional labelling of unpackaged food.
Recent analysis by FSAS on Scottish data from the LCF found that food eaten OOH in
Scotland had a mean energy density (calorie content per gram) which was 30% higher than
food eaten at home6. The World Cancer Research Fund (WCRF) reported that eating energy
dense foods is likely to result in the consumption of excess energy and hence promote
weight gain and obesity7.
FSAS have used market data from Kantar WorldPanel (KWP) to monitor foods and beverages
purchased into the home, KWP data does not include food and beverage purchased OOH.

11
Because of the lack of published information available on OOH food and beverage
purchases in Scotland, the current study was commissioned by FSAS to better understand
the OOH eating environment and provide data to help develop policy on tackling calorie
and salt reduction OOH in Scotland. NPD Group Inc, have the required expertise covering
the OOH landscape. The CREST (Consumer Reports on Eating Share Trends) service was used
in the production of this report.
12
2. Aims and Objectives The primary aim of this project was to a) obtain a general overview of OOH catering
provision in Scotland and the foods and beverages purchase by consumers OOH. Secondary
aims were to b) better understand the behavioural and social context of eating out of the
home and c) gather information on the availability of nutrition information.
a) A general overview of OOH catering provision in Scotland
The OOH market is very diverse including workplace canteens, pub chains, coffee shops,
vending machines, as well as different types of restaurants (See Appendix 2 for definition of
OOH channels). The aim was to obtain top- line general information on the size of the
market, the importance of the different sectors, the current market situation, recent trends
and comparisons of the headline data between Scotland and the rest of Great Britain
(excluding Scotland).
Including:
• The current size of the OOH foodservice market and recent and future trends
• A breakdown by the different OOH food and beverage providers, including the main
chains important to the Scottish market
• The foods and beverages consumed most frequently
b) Understand the behavioural and social context of eating out of the home
There is a need to understand more about which consumers eat out most, for example by
age, gender, and social class and where and when they eat out, where they take their
children, and how this compares to the rest of GB.
Including:
The key drivers for consumers in Scotland eating out of the home
The consumers eating out most in terms of age, gender, social class
Where different consumers eat out in terms of age, gender, social class
The channels which are most important in relation to eating out with children
Differences in eating out by time of day/day of week
c) Information on the products and meals most commonly consumed
Including:
The main products, meals and beverages most commonly consumed
The availability of nutrition information

13
3. Data and Methodology Data analyses were undertaken by NPD Group Inc, using their CREST (Consumer Reports on
Eating Share Trends) service. CREST is an online consumer survey that has been on-going
since 2007. It is run in Great Britain (GB) and also tracks consumers across the globe.
The sample of consumers was drawn from an existing consumer research panel (managed
by Lightspeed Research), and was geographically and demographically balanced to
represent the GB population. A review of the samples sizes within Scotland was undertaken
to ensure the CREST service could provide robust and detailed information and insight on
the Scottish OOH market.
Data were collected between January 2010 and December 2012 from 13,271 OOH eating
occasions by around 1,800 unique panellists in Scotland, covering all foods and beverages
purchased. Over 6,500 online questionnaires were completed monthly in GB equating to
over 80,000 completed annually. The survey is continuous and online invitations were sent
out to panellists every week. The number of invites sent out each week was monitored and
adjusted to ensure a balanced sample.
Panellists were invited to fill out the questionnaire about their eating and drinking
behaviour over the last 24 hours. The survey asks consumers to report their individual
purchase of prepared meals, snacks and drinks, from any source, including both commercial
and non-commercial outlets. This includes all meals and beverages not prepared at home
including, dining out, take-away, workplace canteens, vending etc.
The survey only included adults (16+); children up to 16 were only included if they were
accompanied by an adult. There was deliberate oversampling of women with children and
the hardest to reach youngest (16-24) and oldest (55+) age groups. Panellists were all
residents, so the results do not include food eaten out by tourists.
The online questionnaire covered:
Where consumers purchased food and beverage - restaurant type, specific chains
What consumers were eating and drinking- product/menu choice, mix of food and
beverages consumed
Why consumers make their choices- consumer preferences, satisfaction with chain,
attitudes for product choice
When consumers were eating- consumer perceived daypart (e.g. Breakfast, Lunch,
Dinner), time of day, weekend (Sat-Sun) versus weekdays (Mon-Fri)
Who eats out - demographics of eaters, age and presence of children
How much consumers spent in total
See Appendix 3 for more information on the online questionnaire

14
3.1 Data analysis
After the data collection was complete, files were downloaded for analysis. Data checking
was carried out to code open ended comments from the survey.
The sample was weighted to the population of GB in terms of age, sex, household size,
number of children, socio-economic status and region by using projection factors. Projection
factors were calculated by comparing panellist demographics to the population of GB (for
example if there is a higher representation of women on the panel, these panellists will have
a lower weighting than men). Data was also adjusted for known biases based on historical
data e.g. panellists were more likely to report breakfast, as breakfast appears at the top of
the survey.
Food and beverage purchase information was collected at a menu item level in the survey
from some of the major chains, including McDonalds, Burger King, KFC and Subway. Bespoke
custom food category definitions were created from all standard and chain menu items in
CREST to meet the specific requirements for this project, allowing food and beverage
purchase to be looked at from a nutritional perspective e.g. separation of diet and regular
cola. The custom categories are listed in Appendix 4.
The Incidence (% of visits which included the food category) and total servings (the number of
times a food or beverage category was ordered) of each food or beverage category were
calculated based on 2 years of data 2011 and 2012 to maximise the sample. Where possible
the top 25 food and top 12 beverage categories were analysed by % incidence and share of
servings and compared among major channels, brands and Independents. For statistical
reasons some food and beverage categories were excluded because the numbers were too
low or not provided for Scotland. Where sample sizes were limited, total GB data were used
to determine the top selling items.
Because no information on calories, fats, sugars, salt and portion sizes were provided by the
majority of OOH businesses, nutrition information has not been included in this report.

15
4. Results
4.1 Overview of Scottish out of home market
Scottish (and British) citizens ate out more frequently in the Commercial OOH market than
most other Europeans- with the exception of Italy (Table 2). There were nearly 1 billion (950
million) visits to the total OOH market in Scotland in 2012. Over 30% of these visits were
snack occasions. The average annual visits in Scotland including non-commercial visits (ie
Education /Workplace Canteens and Vending)declined from 187 in 2010 to 180 in 2012 (Fig
3).
Table 2: Global comparison of annual visits
Country Average Annual Visits
Italy 176
Great Britain 151
Scotland 146
Spain 137
Germany 108
France 89
Russia 83
Figure 1: Total of Home Visits per capita in Scotland
Note: The commercial market included all major channels in Out-of-Home Foodservice, excluding canteens
and non-commercial vending.
187.2
181.6 179.9
176
178
180
182
184
186
188
YE 2010 YE 2011 YE 2012
Total Out of Home visits per capita In Scotland

16
The total spend on OOH1 occasions in Scotland was £4.2 billion compared to a total of £49.6
billion in GB. Whilst the GB market was in slight growth in 2012, the Scottish market was
lagging behind with sales and traffic both declining by around 1% compared to 2011.
The average spend per visit was slightly less in Scotland at £4.38 on 2.4 items compared to
£4.50 in GB for 2.5 items.
4.11 Overview of channels
QSR (Quick Service Restaurants) dominated in both Scotland and GB markets accounting for
half the market. The number of OOH visits in Scotland and the share of total visits in
Scotland and GB are detailed in Tables 3 and 4. There was a similar pattern of visits between
Scotland and GB.
Table 3: Scotland Major Channels - Visits (000)
YE Dec 11 YE Dec 12
TOTAL OUT OF HOME (OOH) 953,442 949,914
QSR 488,866 471,097
Pubs 73,522 74,734
Full Service (incl Cafe/Bistro) 107,547 104,240
Travel & Leisure 111,849 111,614
Canteen (Workplace) 117,588 126,516
Canteen (College/Uni) Low sample 12,635
Vending Total 42,011 49,078
Table 4: Share of Total OOH Visits (%)- YE Dec 12 Scotland and GB
% share 2012
Scotland
% share 2012 total
GB
QSR 49.6 50.9
Pubs 7.9 11.1
Full Service (incl Cafe/Bistro) 8.6 10.5
Travel & Leisure 11.7 10.7
Canteen (Workplace) 13.3 11.0
Vending Total 5.2 4.2
Canteen (College/Uni) 1.3 1.5
Scotland differed slightly from GB in that the share of visits to Travel and Leisure (11.7 vs
10.7) and also Workplace Canteen (13.3% vs 11%). was higher in Scotland. Vending was also
more prominent in Scotland compared to GB(5.2% vs 4.2%).
1 For purposes of this report OOH refers to Total Out of Home Market

17
The QSR market breaks down into many subsectors, so it was important to isolate and
analyse these separately (Table 5). The largest share was the Retail/Supermarket sector for
food and beverages consumed OOH (12.2% compared to 13.4% for GB). This included the
purchase of prepared meals, snacks and beverages for consumption OOH as well as sit in
restaurant meals. QS Burger had a 7.1% share in Scotland compared to 8.3% for GB.
There was a bias in Scotland towards QS Ethnic (Indian and Chinese meals), QS Bakery and
QS Fish and Chips. Per Capita visits were highest at Retail/Supermarket with the average
Scottish consumer visiting this sub-channel 23.9 times per year (Figure 2).
Table 5: Share of OOH Visits to QSR (%)- YE Dec 12 Scotland and GB
% share 2012 Scotland % share 2012 total GB
Retail/Supermarket 12.2 13.4
QS Burger 7.1 8.3
QS Ethnic 6.1 4.8
QS Bakery 5.7 4.5
QS Coffee 4.7 5.4
QS Fish and Chips 3.4 3.0
QS Sandwich 3.1 3.5
QS Other 2.9 2.4
QS Pizza/Italian 1.8 2.0
QS Chicken 1.7 2.6
Petrol Station 1.3 0.9
Figure 2: QSR Categories- Visits per Capita (average annual visits per person)- 2YE Dec 12
13.0
5.6
2.9 5.6
10.4 9.1
3.1
10.8
23.9
1.6
5.2
14.7
5.5 4.7 6.2
8.1 9.7
3.5
8.8
24.1
1.6
4.4
Scotland
Total GB

18
The Scottish market moved very slightly away from QSR in 2012 compared with 2011, with
most growth attributed to Canteens, Café/Bistro and Pubs (Figure 3). Within the QSR
channel there was some growth for QS Ethnic, QS Hotel, QS Sandwich and QS Fish and Chips
(Table 6).
Figure 3: Traffic Share (%), Traffic Change (000) and % Traffic Change of major channels in Scotland- YE Dec 12 vs. YE Dec 11
Note: ++ =a large change where there may be some uncertainty for trend.
Table 6: QSR Category Traffic Share of Total OOH- YE Dec 12 vs. YE Dec 11
Category Scotland Change GB Change
Retail/Supermarket 12.2% 13.4%
QS Burger 7.1% 8.3%
QS Ethnic 6.1% 4.8%
QS Bakery 5.7% 4.5%
FS Traditional 5.1% 4.2%
QS Coffee 4.7% 5.4%
Hotel 4.7% 4.2%
QS Fish & Chips 3.4% 3.0%
QS Sandwich 3.1% 3.5%
QS Other 2.9% 2.4%

19
4.12 Independents and Brands
Independent retailers/caterers can be defined as small usually locally based businesses with
very few if any additional premises. 53% of OOH visits were to Independent
retailers/caterers. Independent retailers/ caterers grew by 3.6% in Scotland in 2012.
Major Brands made up 33% of the total visits to OOH in Scotland (see Glossary of terms for
definition of major and small brands). The top 12 Major Brands had a combined market
share of 27% (Table 7). Small Brands accounted for 14% of visits in Scotland and grew by
9.2% in 2012. Overall visits to Major Brands fell by 9.3% in Scotland in 2012 compared to
2011 as Independents and Small Brands gained shares (Figure 4).
Figure 4: Scotland Total OOH- Traffic Share & % Traffic Change- YE Dec 12 vs. YE Dec 11

20
Table 7: % Traffic Share Total OOH Ye Dec ’12 for Major Brands
Category Scotland Change
McDonald’s 5.6%
Greggs 4.3%
Tesco 3.5%
Asda 2.1%
Morrisons 1.8%
Brewers Fayre 1.5% *
Wetherspoon 1.5%
KFC 1.4% *
Sainsbury’s 1.3%
Costa Coffee 1.3% *
Starbucks 1.2% *
Subway 1.2%
*Not available, sample size below recommended threshold for trending.
4.2 Key demographics and occasions
4.21 Age Group
Figure 5 shows the average annual visits per capita by age group and the change since 2010.
Thirty-five to forty-nine year olds have the highest rate of annual visits at 268 per year.
Despite a slight fall in total visits overall, under 18 year olds increased their visit rate in the 2
years to end of 2012.
Figure 5: Per Capita Visits (average annual visits) to Scotland Total OOH by age
Table 8 : Percentage Share of Visits by Age and Channel in Scotland - YE Dec 12
187
125
230 248
266
179
99
180
136
191
231
268
180
80
TotalConsumers
Under 18 18-24 25-34 35-49 50-64 65+
YE Dec 10 YE Dec 11 YE Dec 12

21
Total
Scotland
QSR Pubs Full
Service
Café/
Bistro
Travel &
Leisure
Workplace
Canteen
Vending
Total
0-12 9.0% 11.7% 7.7% 11.2% 9.9% 11.0% 1.0% 0.0%
13-17 5.7% 8.0% 4.1% 6.9% 4.2% 2.0% 2.0% 0.9%
18-24 10.0% 8.6% 12.6% 5.7% 7.4% 10.3% 11.0% 17.7%
25-34 17.1% 18.4% 17.2% 16.3% 11.2% 13.0% 15.8% 18.4%
35-49 30.8% 31.1% 23.8% 27.4% 26.5% 22.0% 44.7% 35.1%
50-64 19.6% 17.2% 20.2% 19.4% 24.5% 23.1% 23.3% 26.6%
65+ 7.8% 5.0% 14.4% 13.2% 16.2% 18.6% 2.2% 1.3%
Not surprisingly, 35-49 year olds had the highest share of traffic at Workplace Canteens-
which they visit more frequently. 18-24 year olds have a higher share of visits to Vending
compared to other channels with 17.7% share of Vending versus 10% share overall (Table
8).
The QSR Ethnic channel had more visits by all age groups in Scotland compared to GB (Table
9). The QSR Ethnic channel also had a higher proportion of visits by under18 year olds
accounting for 14.9% of all annual visits, suggesting that QS Ethnic is more popular with
families in Scotland.
Table 9: Per Capita Visits (average annual visits) to Scotland QS Ethnic by age- 2YE Dec 12
Age group Scotland Total GB
Total 10.8 8.8
<18 14.9 10.8
18-24 7.5 6.8
25-34 14.1 13.3
35-49 15.8 12.5
50-64 8.6 6.1
65+ * 2.2
* = sample below recommended threshold
Figure 6 shows that there was a lower proportion of OOH meal occasions for Parties with
Children (defined here as aged 17 and under) in Scotland compared to the rest of GB (14.2%
versus 16% in 2012). This may have been driven by more Workplace Canteen visits in
Scotland (13.3% compared to 11% in 2012). QSR and FSR had a higher proportion of families
compared to the other Major Channels (Figure 7).
Figure 6: Share of Total OOH Meal Occasions (%) by Party composition- Scotland vs. the Rest of GB (excluding Scotland)

22
Figure 7: Share of Meal Occasions (%) by Party Composition- Channel comparison in Scotland- YE Dec 12
4.22 Gender
There was a slightly higher proportion of total OOH visits by males within the Scottish
market (50.5% versus 49.6% males in GB), probably driven by more visits to the Workplace

23
Canteen compared to GB. In Scotland, Pubs (52.9%), Travel and Leisure (56.6%) and
Workplace Canteens (52.8%), all had a higher share of visits by men, whereas more women
visited Full Service Restaurants (55.0%) and Café/Bistro (62.8%).
4.23 Socio economic status
Social groups ABC1s had the majority of visits (60.4%) in Scotland compared to 39.6% for
C2DEs. C2DEs had a higher than average proportion of visits to QSR (44.5%) and pubs
(42.3%) whilst ABC1s had a higher than average proportion of visits to Full-Service
Restaurants (72.3%), Café /Bistros (63.5%), travel & leisure (66.9%), Canteen (67.3%)
(Figure 8).
4.24 Day of week/Daypart
71% of all OOH visits were between Monday and Friday, with a higher percentage for
Workplace canteen (87.4%) and Vending (82.4%). A lower percentage of visits were on
weekdays for QSR (68.9%), Full Service Restaurants (62.3%), and Travel and Leisure (60.1%).
The highest proportion of visits to OOH were at lunchtime (32.1%), followed by dinner
(26.3%). It was interesting to note that over 30% of OOH visits were snack occasions (Figure
9). In 2012 11% of visits were for breakfast, and this proportion has increased in Scotland
since 2010 (9.2%). Morning snack gained share (8.2%) in 2012 compared to 2011 (7.9%), but
lunchtime snack and evening snack have lost share (data not shown).

24
Figure 8: Share of Visits (%) by Social Group- Channel comparison in Scotland
Figure 9: Share of Visits (%) by Daypart- Channel comparison in Scotland
60.4% 55.5% 57.4% 72.3%
63.5% 66.9% 67.3% 60.9%
39.6% 44.5% 42.6% 27.7%
36.5% 33.1% 32.7% 39.1%
TotalScotland
QSR Pubs Full Service Café/ Bistro Travel &Leisure
Canteen(Workplace)
VendingTotal
C2DE ABC1
11.0% 11.1% 6.9% 6.6%
21.0%
14.5% 14.3% 8.2% 8.4%
2.5% 3.4%
11.8%
6.3% 11.9%
16.0%
32.1% 31.3%
33.4% 41.0%
44.3%
22.2%
42.1%
6.7%
15.2% 13.5%
9.3% 3.6%
14.9%
15.1%
21.0%
45.4%
26.3% 30.2%
35.9%
44.3%
6.8%
28.2%
7.7% 7.2% 5.5%
12.0% 13.8% 2.9%
26.0%
TotalScotland
QSR Pubs Full Service Café/ Bistro Travel &Leisure
Canteen(Workplace)
VendingTotal
Late Snack/Drink Dinner Afternoon Snack/Drink
Lunch Morning Snack/Drink Breakfast

25
4.3 Key Food and Beverage Trends
There was an estimated annual total of over 2 billion servings of foods and beverages OOH
in Scotland in 2011/2012 (4.53 billion in the two years ending Dec 12). See Table 10 for the
main (top 25) food categories purchased OOH in Scotland. These categories capture 43% of
the total food servings purchased OOH in Scotland (1.95 billion/4.53 billion in 2YE Dec 12).
The most commonly purchased food category out of home based on incidence (i.e. the % of
visits that include a specific food or beverage item) was Chips/French Fries, purchased on
9.5% of all eating OOH occasions, followed by Cakes/Biscuits/ Pastries (8.7%). In terms of
number of servings (i.e. the number of times a food or beverage was ordered) the
Cakes/Biscuits/ Pastries has the largest number of servings, followed by Chips/French Fries.
It is worth noting that Sandwiches were presented in different categories, but if combined
would have the highest % incidence and number of servings.
Table 10: Top 25 food categories by % Incidence in GB and Scotland Total OOH- 2YE Dec 12
GB Scotland
Food Category Incidence
GB
(%)
Incidence
Scotland
(%)
Percentage
change
Scotland
(vs. 2YE Dec 10)
Servings
Scotland 2YE
Dec 2012
(000)
Chips/French Fries 12.1 9.5 -1.1 181,403
Cakes/ Biscuits/ Pastries 8.4 8.7 -0.1 181,504
Meat Main Dish 8.3 6.5 -1.5 141,487
Cured Meat Sandwich 4.9 5.3 0.8 103,165
Chinese/ Asian Main Dish 3.9 5.2 -0.2 125,748
Vegetable/Cheese/Egg Sandwich 4.3 4.6 -0.1 89,863
Total Pizza 4.4 4.4 0.6 87,039
Bacon 3.7 4.0 0.7 75,586
Pies/ Pasties/ Sausage Rolls 3.6 3.8 0.4 76,129
Cheese Burger 4.0 3.7 0.2 73,434
Poultry Sandwich 3.9 3.7 -0.9 72,957
Other Potatoes 4.2 3.6 0.0 74,997
Fried/Breaded Fish 3.4 3.5 0.1 70,010
Confectionery 3.4 3.5 0.3 69,499
Total Pasta 2.5 3.1 0.2 61,928
Sausage 3.2 3.1 0.0 59,692
Puddings/ Desserts 3.1 2.9 -0.5 57,098
Ice Cream 3.4 2.9 -0.3 55,468
Crisps/ Popcorn/ Salty Snacks 2.7 2.8 0.4 54,020
Meat MD Meals 3.7 2.8 -0.4 NA
Salad (No Meat/Fish) 3.5 2.7 -0.2 53,581
Fried/Breaded Chicken 2.9 2.2 -0.3 44,278
Indian Main Dish 2.3 2.1 -0.4 48,218
Vegetables (excluding potatoes) 2.5 2.0 -0.3 37,898

26
Fish/Seafood Sandwich 2.4 1.9 -0.5 38,061
Table 11 provides the main beverage categories purchased OOH in Scotland. Speciality
coffee/hot chocolate was the most common beverage with 10.5% Incidence in Scotland,
however if Regular Cola and other Fizzy Drinks were combined, this would be the top
category by a large margin, both in terms of % incidence and number of servings (nearly 340
million servings over 2 years)
Table 11: Top 12 Beverage categories by % incidence in GB and Scotland Total OOH- 2YE
Dec 12
Drink Category Incidence
* GB
(%)
Incidence
Scotland (%)
% change
Scotland
(vs. 2YE Dec
10)
Servings
Scotland 2YE
Dec 2012
(000)
Speciality Coffee/ Hot Chocolate 10.4 10.5 2.1 205,615
Regular Cola 10.0 9.9 1.4 194,370
Diet Cola 7.4 9.1 -0.9 177,226
Regular Fizzy Drinks excluding
Cola
4.7 7.2 0.7 144,318
Water (Bottled + Tap) 7.6 7.1 -0.5 139,347
Juice Drinks 5.1 4.8 1.2 98,335
Pure Juice 3.2 2.9 -0.9 58,009
Irn Bru (part of Fizzy Drinks
excluding Cola)
0.3 3.0 * 57,624
Energy/ Sports Drinks 1.3 1.1 * 25,391
Milkshakes 1.3 0.8 * 18,653
Squash/ Cordial 0.8 0.9 * 16,393
Diet Fizzy Drinks excluding Cola 0.4 0.5 * 9,093
Table 12 shows the top 10 food and beverage categories for growth in QSR in the last 2
years. ‘Other Fizzy Drinks excluding Cola’ which would include drinks such as Irn Bru and
Specialty Coffee showed the most growth. There was also a slight increase in the purchase
of pies, pasties and sausage rolls of over 1%.

27
Table 12: Top 10 growing food and beverage categories (by Incidence percentage change
2YE Dec 12 vs. 2YE Dec 10) in QSR Scotland
Food/Beverage Category 2YE Dec 10 2YE Dec 12 Percentage
Change
Other Fizzy Drinks excluding Cola 8.2 9.9 1.7
Speciality Coffee/ Hot Chocolate 8.0 9.7 1.7
Pies/ Pasties/ Sausage Rolls 4.0 5.5 1.5
Pizza 3.7 4.5 0.8
Cheese Burger 5.5 6.1 0.6
Bacon 2.3 2.8 0.5
Regular Cola 10.5 10.9 0.4
Beef Burger 2.3 2.6 0.3
Sausage 1.9 2.2 0.3
4.31 Key Food Trends
With QSR accounting for almost half of all visits in Scotland it is unsurprising that this has
the largest share of servings for all food categories (Table 13 and Table 14). However it is
worth noting that the QSR channel includes the dominant Retail/Supermarket sub channel.
Vending was particularly important for confectionary and crisps/popcorn/salty snacks with
over a third of all confectionary sold through vending.

28
Table 13: Top 25 Food Categories by % Share of Servings by Channel in Scotland- 2YE Dec 12
Note QSR includes retail/supermarkets
Share of Servings by Channel (%)
Category QSR Pubs Full
Service(FSR)
Café/
Bistro
Travel &
Leisure
Canteen
(Workplace)
Canteen
(College/
Uni)
Vending
Total
Chips/French Fries 59.8 13.1 10.5 1.0 6.4 7.9 1.2 0.1
Cakes/ Biscuits/ Pastries 48.8 3.3 7.7 5.1 17.5 10.5 2.0 5.2
Meat MD 16.5 29.1 24.6 0.6 19.1 9.0 0.9 0.2
Cured Meat Sandwich 56.7 6.1 3.9 4.5 6.5 19.5 2.7 0.0
Chinese/ Asian Main Dish 76.6 1.6 17.4 0.1 2.7 1.4 0.3 0.0
Vegetable/Cheese/Egg Sandwich 57.9 6.5 4.6 2.8 8.5 17.5 1.8 0.4
Total Pizza 50.5 6.2 27.5 0.6 5.6 7.5 1.8 0.2
Bacon 36.2 10.5 9.1 4.7 16.7 21.0 1.4 0.4
Pies/ Pasties/ Sausage Rolls 74.0 5.2 2.6 0.5 10.2 6.6 0.9 0.0
Cheese Burger 83.0 7.3 3.7 0.1 3.3 1.9 0.6 0.0
Poultry Sandwich 69.5 2.8 3.9 3.8 6.7 10.9 1.7 0.7
Fried/Breaded Fish 53.1 18.6 12.5 1.2 9.6 4.5 0.5 0.0
Confectionery 45.0 0.0 0.8 0.2 6.7 13.0 0.6 33.7
Total Pasta 12.7 17.1 34.6 2.7 12.2 17.5 3.0 0.2
Sausage 35.4 12.8 10.0 6.9 18.3 15.4 1.2 0.0
Puddings/ Desserts 26.2 13.7 29.0 3.2 20.5 3.5 2.6 1.4
Ice Cream 29.2 17.6 21.5 2.5 26.9 0.5 0.6 1.2
Crisps/ Popcorn/ Salty Snacks 53.5 3.8 1.2 1.1 10.1 11.6 0.8 17.9
Fried/Breaded Chicken 73.0 6.4 9.7 0.6 7.5 2.6 0.2 0.0

29
Indian Main Dish Total 63.1 4.6 22.3 0.4 2.5 7.1 0.0 0.0
Vegetables (excl potatoes) 15.8 21.6 22.0 1.5 21.7 14.7 2.7 0.0
Fish/Seafood Sandwich 54.7 7.2 7.1 3.9 12.2 10.9 4.0 0.0
Other Sandwiches 47.1 6.1 4.4 6.5 17.3 12.7 2.7 3.0
Wraps 58.1 6.2 7.8 1.4 9.3 14.1 3.1 0.0
Fruit 47.5 2.9 7.0 0.4 17.7 23.5 0.2 0.7

30
Table 14: Top 25 food categories in QSR Scotland- with share of Total OOH servings- 2YE
Dec 12
Food Category QSR Incidence
(%)
QSR Servings
(000)
QSR share of
Total OOH
Servings (%)
Chips/French Fries 11.3 108,422 59.8
Cakes/ Biscuits/ Pastries 8.5 88,533 48.8
Chinese/ Asian Main Dish 8.3 96,268 76.6
Cheese Burger 6.1 60,946 83.0
Cured Meat Sandwich 6.0 58,537 56.7
Pies/ Pasties/ Sausage Rolls 5.5 56,352 74.0
Vegetable/Cheese/Egg S’wich 5.4 52,064 57.9
Poultry Sandwich 5.2 50,741 69.5
Total Pizza 4.5 43,964 50.5
Fried/Breaded Fish 3.7 37,156 53.1
Confectionery 3.2 31,268 45.0
Fried/Breaded Chicken 3.1 32,305 73.0
Crisps/ Popcorn/ Salty Snacks 3.0 28,913 53.5
Chicken Burger 2.9 28,857 79.5
Bacon 2.8 27,339 36.2
Indian Main Dish Total 2.7 30,436 63.1
Beef Burger 2.6 26,045 74.5
Meat Main Dish 2.2 23,347 16.5
Sausage 2.2 21,121 35.4
Fish/Seafood Sandwich 2.1 20,834 54.7
Wraps 2.1 21,109 58.1
Ice Cream 1.7 16,190 29.2
Puddings/ Desserts 1.5 14,988 26.2
Other Sandwiches 1.5 14,580 47.1
Fruit 1.4 13,108 47.5
Appendix 5 shows the full analysis of food incidence by Independents and Major Brands.
For most food categories a large proportion was sold through the Independents retailers/
caterers. For example, Chinese meals had the highest proportion (94%) followed by Indian
meals (84%) and Fried/Breaded fish (67%). For most other categories, the largest proportion
of servings came from the Major Brands, for example, 75% of all Cheeseburgers and 74% of
all Fried/Breaded Chicken came from McDonalds, Burger King and KFC. Between 38-56% of
all sandwich categories were bought from Major Brands, such as Tesco, Greggs and Subway.
The proportion of servings which came from Major Brands was similar between Scotland
and GB (Table 15).

31
Table 15: Major Brands Share of Food Servings (%) – 2YE Dec 12
Major Brands Share of Servings (%)
Scotland GB
Cheese Burger 74.5 79.3
Fried/Breaded Chicken 73.6 80.4
Poultry Sandwich 56.2 55.1
Pies/ Pasties/ Sausage Rolls 54.4 49.3
Fish/Seafood Sandwich 46.3 44.7
Fruit 45.9 31.3
Total Pizza 44.3 45.6
Vegetable/Cheese/Egg Sandwich 43.6 42.9
Cured Meat Sandwich 43.0 43.7
Chips/French Fries 41.7 45.4
Crisps/ Popcorn/ Salty Snacks 40.8 41.4
Ice Cream 39.2 38.3
Wraps 39.1 49.8
Cakes/ Biscuits/ Pastries 37.7 39.1
Other Sandwiches 37.6 30.6
Bacon 29.3 28.2
Meat Main Dish 29.1 28
Puddings/ Desserts 28.3 27.3
Sausage 26.8 25.2
Vegetables (excl potatoes) 25.1 26.8
Total Pasta 23.3 23.4
Confectionery 22.6 24.4
Fried/Breaded Fish 19.5 16.1
Indian Main Dish 8.4 10.3
Chinese/ Asian Main Dish 3.3 4.3
4.32 Key Beverage Trends
The majority of beverage servings came from the QSR channel with Costa Coffee accounting
for the largest individual share (7.7%) of all Speciality Coffee servings (Appendix 5).
The Independent retailers / caterers had a slightly larger share of beverage servings
compared to the Major Brands (Appendix 5). However Major Brands still make up a
significant proportion for some categories, for example, at least 47% of all Cola. Cola
incidence is highest among Fast Food brands, for example 25.5% of all visits to McDonalds
included a Regular Cola (see Appendix 5). Incidence of Cola was also high at retailers such as
Asda and QSR Bakeries such as Greggs. 65% of Other Fizzy Drinks excluding Cola and 90% of
Water (Bottled & Tap) were sold through Independent Retailer/Caterers. It is worth noting
that FSR and Canteens (which are dominated by Independent retailers/caterers) have a high
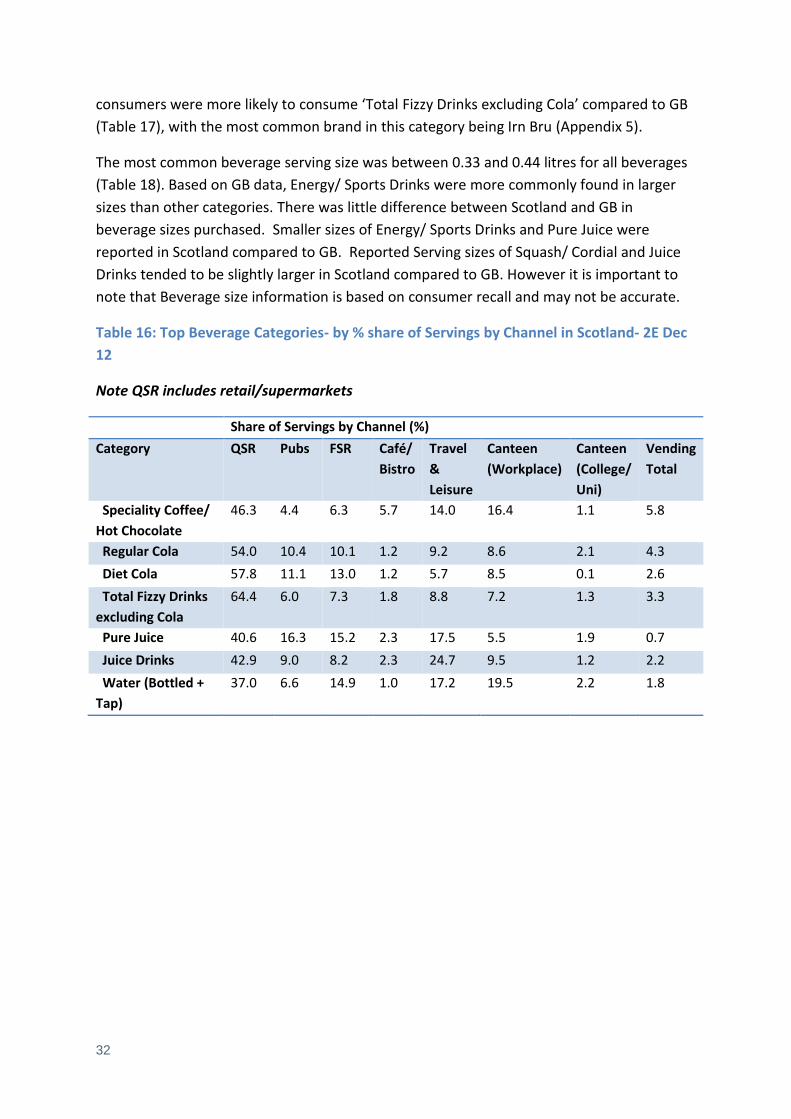
share of Water servings compared to other Beverage categories (Table 16). Scottish
32
consumers were more likely to consume ‘Total Fizzy Drinks excluding Cola’ compared to GB
(Table 17), with the most common brand in this category being Irn Bru (Appendix 5).
The most common beverage serving size was between 0.33 and 0.44 litres for all beverages
(Table 18). Based on GB data, Energy/ Sports Drinks were more commonly found in larger
sizes than other categories. There was little difference between Scotland and GB in
beverage sizes purchased. Smaller sizes of Energy/ Sports Drinks and Pure Juice were
reported in Scotland compared to GB. Reported Serving sizes of Squash/ Cordial and Juice
Drinks tended to be slightly larger in Scotland compared to GB. However it is important to
note that Beverage size information is based on consumer recall and may not be accurate.
Table 16: Top Beverage Categories- by % share of Servings by Channel in Scotland- 2E Dec
12
Note QSR includes retail/supermarkets
Share of Servings by Channel (%)
Category QSR Pubs FSR Café/
Bistro
Travel
&
Leisure
Canteen
(Workplace)
Canteen
(College/
Uni)
Vending
Total
Speciality Coffee/
Hot Chocolate
46.3 4.4 6.3 5.7 14.0 16.4 1.1 5.8
Regular Cola 54.0 10.4 10.1 1.2 9.2 8.6 2.1 4.3
Diet Cola 57.8 11.1 13.0 1.2 5.7 8.5 0.1 2.6
Total Fizzy Drinks
excluding Cola
64.4 6.0 7.3 1.8 8.8 7.2 1.3 3.3
Pure Juice 40.6 16.3 15.2 2.3 17.5 5.5 1.9 0.7
Juice Drinks 42.9 9.0 8.2 2.3 24.7 9.5 1.2 2.2
Water (Bottled +
Tap)
37.0 6.6 14.9 1.0 17.2 19.5 2.2 1.8

33
Table 17: Top Beverage Category -by % Incidence – 2YE Dec 12
(%)
Scotland GB
Speciality Coffee/ Hot Chocolate 10.5 10.4
Total Cola 18.9 17.3
Regular Cola 9.9 10.0
Diet Cola 9.1 7.4
Total Fizzy Drinks (excluding Cola) 7.6 5.0
Regular Fizzy Drinks(excluding Cola) 7.2 4.7
Diet Fizzy Drinks (excluding Cola) 0.5 0.4
Table 18: Share of Servings in Total OOH Scotland, by Beverage Size (%)- 2YE Dec 12
Share of Servings by Beverage Size in Litres (%)
Beverages < 0.33 0.33-0.4 >0.4-0.5
>0.5-
0.75
>0.75-
1.0 > 1.0
Regular Cola Scotland 21.4 48.9 23.7 * * *
Total GB 19.0 49.1 25.7 3.0 1.0 2.1
Diet Cola Scotland 12.0 54.4 25.2 5.6 * *
Total GB 14.4 50.7 27.1 5.0 1.2 1.6
Total Fizzy Drinks
(excluding Cola)
Scotland 12.9 54.2 23.0 * * *
Total GB 18.7 49.5 23.8 3.9 1.7 2.4
Regular Fizzy
Drinks (excluding
Cola)
Scotland 11.2 54.2 24.0 * * *
Total GB 17.6 50.9 23.8 3.8 1.6 2.3
Diet Fizzy Drinks
(excluding Cola)
Scotland * * * * * *
Total GB 27.1 38.9 23.0 * * *
Irn Bru Scotland 8.6 57.6 24.6 * * *
Total GB 9.4 55.7 26.1 * * *
Energy/ Sports
Drinks
Scotland * 32.3 25.3 * * *
Total GB 19.2 29.2 31.5 9.9 5.3 4.8
Squash/ Cordial Scotland 23.1 53.7 * * * *
Total GB 31.8 41.5 22.4 * * *
Pure Juice Scotland 45.0 38.2 * * * *
Total GB 40.1 41.0 13.7 2.9 1.7 *
Juice Drinks Scotland 29.2 34.5 26.3 * * *
Total GB 30.9 39.5 20.8 4.4 2.5 1.9
Water (Bottled + Scotland 22.4 39.5 25.3 * * *

34
4.33 Key Food and Beverage Trends among 0-12 year olds
The food and beverage information among 0-12 year olds detailed in this report only refers
to those occasions when children were with an adult. As you would expect, Soft Drinks are
more prominent among 0-12 year olds compared to all ages. Add-on items like Ice Cream,
Side Dishes and Chips/Fries also over-indexed among children- likely driven by the family
friendly( FSR) channel. Twenty-two percent of all visits from 0-12 year olds included Cola.
There were similar patterns of consumption among 0-12 year olds between Scotland and
GB, with a few exceptions. The incidence of Total Cola and Total Fizzy Drinks excluding Cola
was higher among 0-12 year olds in Scotland than GB. Scottish children also had higher
consumption of Burgers, Pizza, Pies, Pasties and Sausage Rolls, and Chinese/Asian Main
Dishes compared with the same age group in GB and compared to other age groups. This is
likely driven by the family takeaway occasion- which appears to be more popular in Scottish
households. The proportion of visits which included fruit and vegetables was much lower in
Scotland compared to GB (Table 20).
Tap) Total GB 26.4 37.1 24.4 5.7 4.0 2.5
Milkshakes Scotland * * * * * *
Total GB 18.2 41.5 30.7 * * *

35
Table 19 Food and Beverage Incidence (%) among 0-12 year olds vs. Total Scotland 2YE
Dec 12
Incidence (%)
Scotland GB
0-12 year olds All
ages
0-12 year olds All
ages
Total Cola 22.3 18.9 19.6 17.3
Chips/French Fries 17.3 9.5 19.7 12.1
Juice Drinks 15.5 4.8 16.6 5.1
Regular Cola 12.4 9.9 12.1 10.0
Total Fizzy Drinks excluding Cola 11.8 7.6 8.3 5.0
Regular Fizzy Drinks excluding Cola 11.4 7.2 7.9 4.7
Ice Cream 10.1 2.9 10.1 3.4
Diet Cola 9.9 9.1 7.5 7.4
Cheese Burger 9.6 3.7 5.6 4.0
Total Pizza 8.9 4.4 7.9 4.4
Fried/Breaded Chicken 8.4 2.2 9.0 2.9
Chinese/ Asian Main Dish 8.2 5.2 5.0 3.9
Water (Bottled + Tap) 7.4 7.1 8.8 7.6
Cakes/ Biscuits/ Pastries 6.7 8.7 9.3 8.4
Pure Juice 4.9 2.9 6.4 3.2
Pies/ Pasties/ Sausage Rolls 4.2 3.8 3.3 3.6
Vegetable/Cheese/Egg Sandwich 4.1 4.6 3.5 4.3
Beef Burger 3.8 1.8 3.7 1.9
Chicken Burger 3.8 1.8 2.9 2.2
Fried/Breaded Fish 3.8 3.5 4.6 3.4
Meat Main Dish 3.8 6.5 7.2 8.3
Speciality Coffee/ Hot Chocolate 3.6 10.5 3.5 10.4
Squash/ Cordial 3.6 0.9 3.0 0.8
Cured Meat Sandwich 3.4 5.3 3.2 4.9
Sausage 3.3 3.1 3.5 3.2
Total Pasta 3.2 3.1 3.2 2.5
Milkshakes 3.0 0.8 4.1 1.3
Other Potatoes 2.5 3.6 3.8 4.2
Irn Bru 2.3 3.0 0.2 0.3
Puddings/ Desserts 2.2 2.9 2.2 3.1
Confectionery 2.2 3.5 2.0 3.4
Indian Main Dish 2.1 2.1 2.1 2.3
Salad (No Meat/Fish) 2.1 2.7 2.7 3.5
Fruit 1.9 1.4 2.4 1.9
Fish/Seafood Sandwich 1.7 1.9 1.6 2.3
Vegetables (excl potatoes) 1.6 2.0 2.7 2.5
Bacon 1.2 4.0 1.9 3.7

36
Table 20: Key Food and Beverage Facts
Food and beverage
category
Key Food and Beverage Facts
Chips/French Fries Chips were the most popular food category in
Scotland with a 9.5% incidence in relation to total
OOH food purchases equating to over 90 million
servings per year.
The incidence in Scotland was slightly lower than
purchased in GB (12.1%). More than half of all chips
purchased were from QSR (60%) with 19.8% from
McDonalds (18 million servings per year), 4.9% from
KFC (4.5 million servings) and 2.7% from Burger King
(2.4 million servings per year).
Thirteen percent of chips were purchased from Pubs
and 11% from FSR.
Burgers Burgers were in the top 10 fastest growing food and
beverage items.
Cheese burgers were the most popular. McDonalds
alone accounted for 65% of all Cheese Burgers.
Cakes/Biscuits/Pastries
Doughnuts were the top seller for
biscuits/cakes/pastries.
49% of Cakes, Biscuits and Pastries were bought
from QSR.
Greggs was the top brand in Scotland with an 8.8%
share of servings. Biscuits consumption was slightly
higher among Scottish consumers, however other
sweet treats (Cakes, Pastries, Other Desserts) had
similar or lower Incidence.
Confectionery
Candy consumption was slightly higher among
Scottish consumers, however Chocolate had similar
or lower Incidence.
The majority of Confectionery servings originated
from Brands.
One third of all Confectionery purchases OOH were
made from Vending machines.
Fried chicken Like Burgers, the vast majority of fried chicken
originated from Brands.

37
Pizza
Pizza was the fastest growing food category in
Scotland.
The majority of Pizza was purchased from Brands.
Pizza Hut Full Service and Delivery accounted for
more than 20% of all Pizza servings.
Chinese/Asian meals
Scottish consumers were 30% more likely to
consume Chinese/Asian meals compared to GB.
The Independent caterers accounted for 94% of all
Servings.
Plain Fruit and
Vegetables
Plain Fruit and Vegetable consumption (excluding
sandwiches, mixed salads (mainly dressed) and fruit
juice) consumed on only 2% or fewer visits by both
adults and children. The proportion of visits which
included Fruit and Vegetables was lower in Scotland
compared to GB for both adults and children.
Sandwiches
Cured meat/
poultry/cheese/vegetable/egg/fish/seafood
sandwiches if combined together would have
comprised the most commonly purchased food
category.
Around 50% were purchased from the Major Brands
including Supermarkets (eg Greggs, Subway,Tesco).
Pies, pastries and
sausage rolls
Pies, Pastries and Sausage Rolls were one of the
fastest growing categories between 2011 and 2012
in Scotland.
Greggs had 40% share of servings of pies/pasties
/sausage roll OOH in Scotland with the Independent
retailers/ caterers making up much of the rest.
Meat Main Dish Meat Main Dish was the third most popular food
category with a 6.5% incidence overall, lower than
GB. Nearly 30% of Meat Main Dishes were
consumed in Pubs with a further 25% from Full
Service Restaurants.
Speciality Coffees/Hot
Chocolate
Speciality Coffee/Hot Chocolate was both consumed
on 10% of all visits. This was similar to GB.
Soft drinks Regular Cola was the most commonly consumed soft
drink, consumed on 10% of all OOH visits, followed
by Diet Cola consumed on 9% of visits.
Other Fizzy Drinks excluding Cola were more popular

38
in Scotland, mainly due to the higher consumption
of Irn-Bru.
Around one-third of all eating OOH occasions
included a soft drink, with around two-thirds of
servings being non-diet.
Around 50% of all eating OOH occasions for children
included a soft drink.
More than 30% of Regular Cola and Other Fizzy
Drinks were sold on promotion.
Water Water had a 7% incidence overall, with a similar
incidence for children. The incidence of visits
including water consumption was 5% for QSR visits,
compared to 20% for total Cola.

39
4.4 Meal time Peaks
There are clear meal time peaks for certain food categories- with sandwiches showing
lunchtime peaks and Chinese/ Asian Main Dish more important in the evenings. Cakes,
biscuits and pastries are consumed more evenly throughout the day.
Figure 10: Top 5 Food Categories by clock time- Scotland Total OOH- 2YE Dec 12
Chinese/ Asian MD Cakes/ Biscuits/ PastriesCured Meat Sandwich Chips/French FriesMeat MD Meals

40
4.5 Promotions
Promotions have steadily increased in Scotland and now account for over 25% of all visits to
the OOH market.
Figure 11: Share of Total OOH Visits in Scotland- by Promotion- over time
Note- this is a multi-choice question and so will not add up to 100%
Figure 12 Share Visits (%) in Scotland by Promotion- Channel Comparison- YE Dec 12
10.2% 10.0% 11.6% 13.9% 1.0% 1.1% 1.8% 1.2% 10.3% 10.0%
12.1% 12.9%
79.9% 79.8% 76.9% 74.2%
YE Dec 09 YE Dec 10 YE Dec 11 YE Dec 12
NoPromotion
OtherPromotions
Loyalty Card
Meal Deal
13.9% 16.3% 17.2% 12.9% 4.4%
17.2% 4.3%
17.5%
12.9% 10.1% 20.1%
13.6%
6.3%
16.5%
18.0%
74.2% 74.1% 66.7%
73.9% 88.2%
68.4% 78.6% 82.5%
No Promotion or Meal Deal Other Promotions Loyalty/Dining Card Meal Deal

41
Figure 12 shows the distribution of promotions across the Channels. Promotions were much
less prominent at Café/Bistro, whereas nearly one third of all Pub visits were on Promotion.
Looking at Meal Deal splits, there was little difference between Scotland and the rest of GB-
although upsized Meal Deals were more prominent in Scotland (Figure 12).
Figure 13 Distribution of Meal Deal Traffic by Type in Scotland- YE Dec 12
Note: Meal Deal Types will not add up to 100% due to overlapping scenarios
In terms of the Top Food and Beverages, there was a similar pattern of promotional activity
in Scotland and GB. The food categories that were most likely to be on promotion were
Fried Chicken (54.5%), Cheese Burgers (52.7%) and Pizza (43.2%) (Table 22).
Table 21 Top Food and Beverages- % of Servings on Promotion- 2YE Dec 12
Scotland GB
Fried/Breaded Chicken 54.5 48.5
Cheese Burger 52.7 47.5
Total Pizza 43.2 47.8
Wraps 38.9 37.8
Vegetables (excl potatoes) 36.9 30.5
Juice Drinks 36.9 43.6
Chips/French Fries 35.3 35.0
Fish/Seafood Sandwich 34.9 29.1
Crisps/ Popcorn/ Salty Snacks 34.2 29.2
Total Fizzy Drinks excluding Cola 33.7 38.9
Regular Cola 32.9 36.6

42
Total Pasta 31.9 35.5
Diet Cola 31.7 35.7
Meat Main Dish 31.6 29.2
Poultry Sandwich 30.6 32.6
Water (Bottled + Tap) 30.3 28.4
Pure Juice 30.2 37.3
Ice Cream 28.9 28.4
Cured Meat Sandwich 26.1 27.6
Vegetable/Cheese/Egg Sandwich 25.3 27.7
Speciality Coffee/ Hot Chocolate 24.5 24.5
Bacon 24.1 29.9
Confectionery 23.9 20.3
Puddings/ Desserts 22.8 29.0
Indian Main Dish 21.5 25.1
Cakes/ Biscuits/ Pastries 21.1 26.3
Fried/Breaded Fish 20.6 25.3
Sausage 20.4 23.4
Other Sandwiches 17.2 16.8
Chinese/ Asian Main Dish 16.9 18.6
Pies/ Pasties/ Sausage Rolls 16.0 18.8

43
4.6 Motivations
Reported motivations to go out were very similar between Scotland and the rest of GB-
although in Scotland people were slightly less likely to go out for ‘Socialising’ versus more
functional motivations, such as ‘I was at work’.
Scots were more likely to visit QSR restaurants to satisfy hunger, whereas socialising was
the prominent reason for visiting FSR, Café /Bistros and Pubs (fig 14)
Figure 14: Distribution of traffic by top Motivations by Channel in Scotland YE 12

44
Table 22: Motivations for Going Out- % Share of Meal Occasions- Scotland vs. the rest of GB (excluding Scotland)- YE Dec 12
Scotland Rest of GB
I was at work 25.6% 22.7%
To satisfy hunger or thirst 19.3% 20.8%
To treat myself/ others/ kids 12.8% 12.7%
Didn't want to cook 11.9% 11.7%
I needed a break 11.3% 12.5%
Fitted in with a shopping trip 10.4% 9.5%
Socialising with friends 10.1% 11.1%
Other Motivation 8.2% 9.1%
Travel/ Events/ Holiday 6.7% 7.7%
To spend time with family 6.5% 7.3%
Dining as a couple 4.9% 5.0%
Wanted something light/ balanced 3.9% 3.7%
Celebration (special occasion) 3.2% 4.0%
Wanting something light/balanced as a motivation to go out is reported slightly more
frequently in Scotland compared to the rest of GB. However the only food category which
over-indexes for occasions when consumers ‘wanted a light/healthy meal’ was Diet Cola
(13.1% Incidence vs. 8.4%).

45
5. Discussion
The current study was commissioned by FSAS to better understand the OOH eating
environment in Scotland so that policy on tackling calorie and salt reduction could be
further developed. Until now, little has been published on actual consumer behaviour
relating to foods and beverages purchased out of the home in Scotland.
Methods
The use of market research data means that the raw data collected was not unique to this
project and standard CREST methodologies have had to be adapted where possible to
match the focus on nutrition. For our current purposes, we were able to develop coding
rules for food categories which could be easily and cost-effectively replicated to allow
monitoring in future if required.
A key strength of this analysis was that data were collected from a large sample of
households. The sample was selected to be representative of GB and cover all key
demographic groups. The household sampling period was over a longer time period, and the
size of the sample was larger than equivalent food surveys in Scotland e.g. the Living Costs
and Food Survey. There were limitations to the data collected for children. Data were only
collected for children (under 16 years old) when they were accompanied by an adult.
Coding of each individual product on the menu was only available for the Major Brands.
There were limits to the amount of data available from Scotland and only the most
frequently purchased individual menu items were captured. For some categories purchased
less frequently the sample was too small to use Scotland data, and it was necessary to use
GB data as a proxy measure.
All the major chains tracked by CREST provided nutrition information, however not all menu
items were detailed. The information available from Independent retailers/caterers in
particular was very limited. Because no information on calories, fats, sugars, salt and portion
sizes were available for the majority of OOH businesses, nutrition information has not been
included in this report.
Overview of findings
GB and Scotland have very similar OOH eating and drinking patterns with only a few notable
differences. Scotland has a slight bias towards Independent retailers/caterers compared to
GB, which make up over 50% of the OOH market in Scotland. Workplace canteen, and QS
Ethnic, including Chinese and Asian meals were more popular with families. The
Independent retailers/caterers accounted for 93.8% of all servings of Chinese meals which
were consumed more frequently in Scotland. In Scotland there was also recent growth in
OOH visits by the under 18 age group – signs that Scottish teenagers are buying into this

46
market at an earlier age. Education on nutrition should encompass food purchased OOH to
help children and their parents make informed choices.
Almost 50% of servings were purchased from Brands. It was clear from the analyses that a
small number of Major Brands contributed a large proportion of portions purchased within
the top selling categories of foods and drinks, including items known to be high in calories,
fat and salt. Reformulating these foods and beverages and/or providing healthier
alternatives could have a significant impact on population calorie, fat and salt consumption.
Some of the largest contributing categories from the Major Brands may have already been
reformulated, which might make it more challenging to achieve further reductions, but even
small step changes could have a significant impact over the longer term.
There was little evidence that children were able to consume a healthy diet OOH, with Cola,
Chips, and Other Fizzy Drinks the most frequently consumed items, and fruit and vegetables
rarely purchased. Providing healthier more varied menus for children including more plain
fruit and vegetables, and offering smaller portion sizes across the adult menu may help
families make better and more varied choices for their children.
Promotions
Over 50% of Cheese Burgers and Fried Chicken were purchased on promotion in Scotland,
which was higher than GB. Upsize meal deals were also more common in Scotland (24%
versus 16%). Upsize meal deals may encourage excess consumption of calories and the
catering industry needs to increasingly promote healthier choices and reduce the promotion
of upsize meals.
Motivations
Perhaps surprisingly, the Scottish consumer appears to have slightly more motivation to be
healthier when compared to GB consumers, however this was only followed through in
terms of actual food choices by opting for Diet Cola. It was not clear whether this was due to
preference or a lack of other healthy options. Consumers may be looking for a quick fix or an
easier choice to make on health. Calorie counts on menus, educating consumers and more
healthy choices should all help consumers to fulfil this motivation.
Next steps
This project has provided a rich source of information on the OOH market and consumer
behaviour in Scotland, which will inform FSAS and Scottish Government policy on nutrition.
From a public health perspective, these results provided a disheartening overview of eating
OOH in Scotland with consumers reporting frequent consumption of calorie rich high
fat/sugar/salt foods and high fat/sugar drinks.
The data has highlighted where nutrition information is scarce and also has identified the
key players who have the greatest influence over the foods and beverages purchased in
Scotland and across the UK.

47
Results presented here could be further developed to set a baseline for monitoring future
OOH food and beverage purchasing trends, with the expectation that enhanced efforts by
caterers in Scotland will encourage consumers to eat more healthily across the whole day.

48
6. References
1 Scottish Government ( Preventing Overweight and Obesity in Scotland: A Route
Map Towards Healthy Weight
http://www.scotland.gov.uk/Publications/2010/02/17140721/0
2 Scottish Government. (2013). "Revised Dietary Goals for Scotland."
http://www.scotland.gov.uk/Resource/0042/00421385.pdf
3 Scottish Government & Food Standards Agency in Scotland. (2013). "Supporting
healthy choices: a draft framework for voluntary action."
http://www.scotland.gov.uk/Resource/0042/00422516.pdf
4 http://www.foodbase.org.uk//admintools/reportdocuments/749-1-
1324_Final_Report_2001-2009.pdf
5 http://www.foodcomm.org.uk/secure/Food_Magazine_82.pdf
6 Wrieden, W. L. and K. L. Barton. (2011). "The Scottish Diet: Estimations of energy density and expenditure." http://www.foodbase.org.uk//admintools/reportdocuments/749-1-1277_S14035_Energy_Density_Final_Report.pdf
7http://www.wcrf-
uk.org/cancer_prevention/recommendations/energy_density_and_cancer.php

49
7. Appendices
Appendix 1 Estimated Population Figures for Scotland (source ONS)
: Estimated Population Figures for Scotland (000)
2010 2011 2012
Total 5,222 5,251 5,282
<18 1,038 1,035 1,034
18-24 499 499 498
25-34 662 680 702
35-49 1,127 1,111 1,090
50-64 1,018 1,034 1,036
65+ 879 893 923
Male 2,530 2,547 2,565
Female 2,692 2,704 2,717

50
Appendix 2 Definitions of channels and sub-channels
Total Commercial
The entire foodservices industry- which includes all channels and sub-channels below but excludes
Canteens and Non-Commercial Vending
Quick Service Restaurants (QSR)
The largest channel in the out of home market- including Quick Service Restaurants in the following
categories:
o QS Burger
McDonald's
Burger King
QS Burger Other
o QS Fish n Chips
o QS Chicken
KFC
Nandos
QS Chicken Other
o QS Sandwich
Subway
Pret A Manger
QS Sandwich Other
o QS Bakery
Greggs
QS Bakery Other
o QS Coffee
Costa Coffee
Starbucks
Caffé Nero
QS Coffee Shops Other
o QS Pizza/Italian
Domino's Pizza
Pizza Hut Delivery (note the full Pizza Hut read is split into their Full
Service and Quick Service functions)
QS Pizza Other
o QS Ethnic
QS Indian
QS Kebab
QS Oriental/Chinese
QS Ethnic Other
o Retail/Supermarket
Tesco

51
Sainsbury
ASDA
Boots
M&S Off-Premises
Co-op
Morrisons
Retail/Grocery Other
o Petrol Station
o QS Other
Pubs
This channel includes predominantly food-led pubs including the following major chains:
o Wetherspoon
o Brewers Fayre
o Beefeater
o Harvester
o Toby Carvery
o FS Pub Other
Full Service Restaurants (FSR)
Any restaurant with table service (waiter/waitress) including the following major chains and
categories:
o FS Traditional
o FS Pizza/Italian
Pizza Hut Full Service (note the full Pizza Hut read is split into their Full
Service and Quick Service functions)
Pizza Express
o FS Pizza/Italian Other
o FS Ethnic
o FS French
o FS Greek
o FS Indian
o FS Japanese
o FS Oriental/Chinese/
o FS Mexican/Spanish
Café/Bistro
Independent Cafés
Travel & Leisure
Travel & Leisure includes the following categories

52
o Hotel
o In-Store Restaurant (e.g. Debenhams Café)
o Bar/Club
o Motorway Service Stations
o On-Board Catering (airplane, train, etc)
o Ice Cream Shop
o Leisure/Entertainment Other (e.g. cinemas, theme parks, bowling alleys, etc)
Vending (Commercial)
Any Vending machine not located in the Workplace or School/University
Total Non-Commercial:
Canteens and Non-Commercial Vending:
o Canteen (Workplace)
o Canteen (College/Uni)
o Vending (Non-Commercial)
Vending (Workplace)
Vending (College/Uni)
Total Vending
Combines Non-Commercial and Commercial Vending into a total read

53
Appendix 3 CREST Questionnaire

54
Appendix 4 Food Categories
Speciality Coffee/ Hot Chocolate Indian Main Dish
Total Cola Thai/Korean/Viet Main Dish
Regular Cola Meat Main Dish
Diet Cola Total Pasta
Total Fizzy Drinks excluding Cola Total Pizza
Regular Fizzy Drinks excluding Cola Cakes/ Biscuits/ Pastries
Diet Fizzy Drinks excluding Cola Puddings/ Desserts
Irn Bru Confectionery
Energy/ Sports Drinks Fruit
Squash/ Cordial Crisps/ Salty Snacks
Juice Drinks Salad (Meat/Fish)
Pure Juice Salad (No Meat/Fish)
Water (Bottled + Tap) Vegetables (excl potatoes)
Milkshakes Bacon
Total Potatoes Sausage
Beef Burger Poultry Sandwich
Cheese Burger Fish/Seafood Sandwich
Burgers w/ Cured Meats Vegetable/Cheese/Egg Sandwich
Chicken Burger Cured Meat Sandwich
Other Burgers Other Sandwich
Fried/Breaded Chicken Total Pie (Meat/Vegetable)
Fried/Breaded Fish Pie Based Meals
Pies/ Pasties/ Sausage Rolls Meat Main Dish
Chinese MD Total Meat Main Dish Meals
Food and drink category definitions are available from NPD if required.
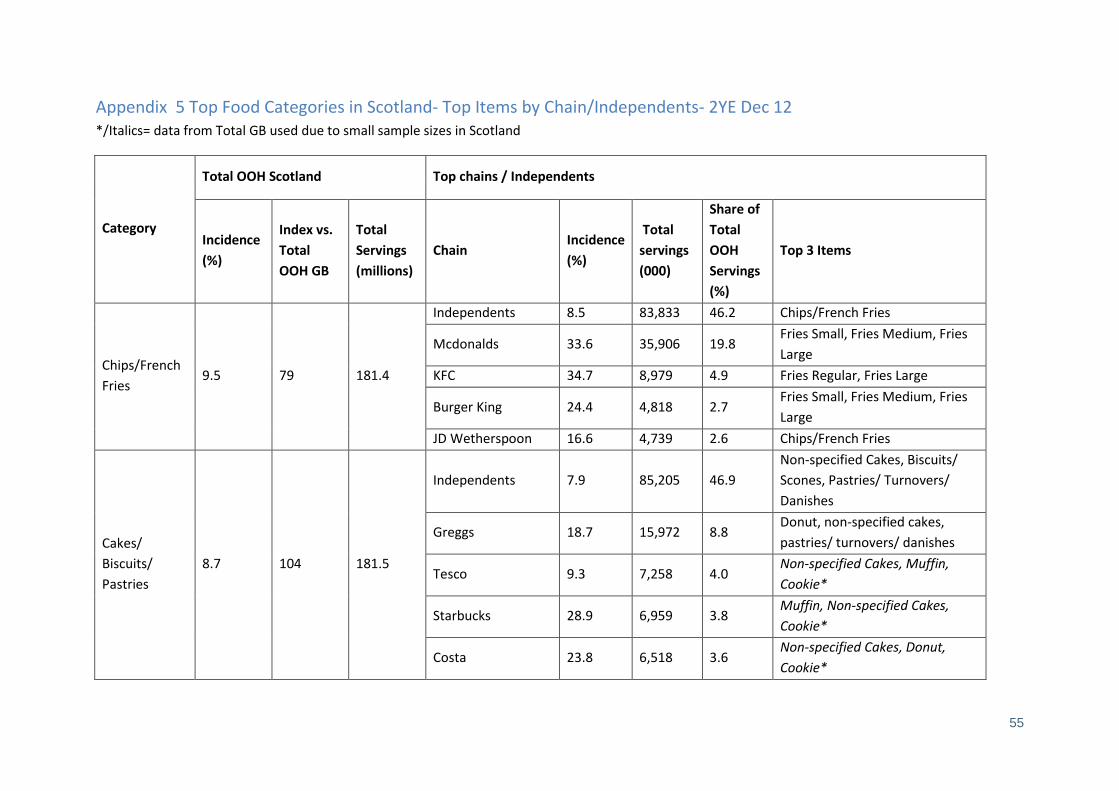
55
Appendix 5 Top Food Categories in Scotland- Top Items by Chain/Independents- 2YE Dec 12 */Italics= data from Total GB used due to small sample sizes in Scotland
Category
Total OOH Scotland Top chains / Independents
Incidence
(%)
Index vs.
Total
OOH GB
Total
Servings
(millions)
Chain Incidence
(%)
Total
servings
(000)
Share of
Total
OOH
Servings
(%)
Top 3 Items
Chips/French
Fries 9.5 79 181.4
Independents 8.5 83,833 46.2 Chips/French Fries
Mcdonalds 33.6 35,906 19.8 Fries Small, Fries Medium, Fries
Large
KFC 34.7 8,979 4.9 Fries Regular, Fries Large
Burger King 24.4 4,818 2.7 Fries Small, Fries Medium, Fries
Large
JD Wetherspoon 16.6 4,739 2.6 Chips/French Fries
Cakes/
Biscuits/
Pastries
8.7 104 181.5
Independents 7.9 85,205 46.9
Non-specified Cakes, Biscuits/
Scones, Pastries/ Turnovers/
Danishes
Greggs 18.7 15,972 8.8 Donut, non-specified cakes,
pastries/ turnovers/ danishes
Tesco 9.3 7,258 4.0 Non-specified Cakes, Muffin,
Cookie*
Starbucks 28.9 6,959 3.8 Muffin, Non-specified Cakes,
Cookie*
Costa 23.8 6,518 3.6 Non-specified Cakes, Donut,
Cookie*

56
Meat MD 6.5 78 141.5
Independents 6.6 75,012 53 Chicken- other, Beef- steak,
Meat MD (other)
Toby Carvery 87.4 7,480 5.3
Traditional Roast Beef,
Traditional Roast Pork,
Traditional Roast- other*
JD Wetherspoon 17.2 5,019 3.5
Traditional Roast Beef,
Traditional roast chicken,
chicken- other*
Harvester* 43.6 NA 3.4 Chicken- non fried, Beef-steak,
Chicken-other
Brewers Fayre* 29.7 NA 3.1
Traditional Roast Beef,
Traditional roast chicken, Beef-
steak*
Cured Meat
Sandwich 5.3 108 103.2
Independents 4.3 43,013 41.7 Hot Bacon Sandwich, Ham
Sandwich, Ham Salad Sandwich
Subway 37.0 9,004 8.7 Hot Italian BMT-6, Ham- 6, Hot
Italian BMT- 12*
Greggs 9.7 7,988 7.7 Hot Bacon Sandwich, Ham Salad
Sandwich, BLT*
Tesco 9.8 6,440 6.2 BLT, Ham Sandwich, Ham Salad
Sandwich*
Sainsburys* 7.9 NA 3.7 BLT, Ham Sandwich, Ham Salad
Sandwich*
Chinese/
Asian MD 5.2 133 125.7 Independents 9.3 117,932 93.8
Chinese MD, Chinese MD Rice,
Chinese MD other
Vegetable/
Cheese/Egg 4.6 107 89.9 Independents 3.6 36,985 41.2
Cheese Sandwich, Hot Cheese
Sandwich, Egg Mayo Sandwich

57
Sandwich Greggs 10.6 8,697 9.7
Cheese Sandwich, Egg Mayo
Sandwich, Hot Cheese Sandwich*
Tesco 11.1 7,325 8.2 Cheese Sandwich, Egg Mayo
Sandwich, Egg Sandwich*
Asda 11.1 4,435 4.9 Cheese Sandwich, Egg Mayo
Sandwich, Egg Sandwich*
Sainsburys* 7.9 NA 4.1 Cheese Sandwich, Egg Mayo
Sandwich, Egg Sandwich*
Total Pizza 4.4 100 87.0
Independents 3.4 33,974 39 Regular crust, Thin crust, Deep
pan
Pizza Hut FS 85.9 10,183 11.7 Thin crust, other*
Pizza Hut Delivery 95.5 9,313 10.7 Deep Pan crust, Thin crust,
other*
Dominos 92.1 9,233 10.6 Regular crust, Deep Pan crust,
Thin crust*
Bacon 4.0 108 75.6
Independents 4.2 41,150 54.4 Bacon
JD Wetherspoon* 12.8 NA 5.8 Bacon
Greggs 4.9 4,027 5.3 Bacon
Tesco 4.4 2,920 3.9 Bacon
Asda* 6.3 NA 2.9 Bacon
Pies/ Pasties/
Sausage Rolls 3.8 106 76.1
Greggs 35.2 30,999 40.7 Sausage Roll, Pasty, Meat/Veg
Pie
Independents 2.6 26,977 35.4 Meat/Veg Pie, Sausage Roll,
Pasty
Tesco* 4.7 NA 3.9 Pasty, Meat/Veg Pie, Sausage
Roll*

58
Sainsbury* 4.7 NA 3.1 Sausage Roll, Pasty, Meat/Veg
Pie*
ASDA* 3.9 NA 1.8 Pasty, Sausage Roll, Meat/Veg
Pie*
Cheese
Burger 3.7 93 73.4
McDonald's 41.6 46,724 63.6 Cheeseburger, Big Mac, Quarter
Pounder with Cheese
Independents 1.4 13,987 19 Beef Burger w Cheese
Burger King 24.1 4,804 6.5
Double cheeseburger, Regular
cheeseburger,Whopper with
cheese*
JD Wetherspoon* 2.9 NA 1.2 Beef Burger w Cheese
Poultry
Sandwich 3.7 95 73.0
Independents 2.1 20,995 28.8 Chicken Sandwich, Chicken Salad
Sandwich, Hot Chicken Sandwich
Greggs 12.4 10,367 14.2
Chicken Salad Sandwich, chicken
sandwich, Hot Chicken
sandwich*
Subway 28.5 6,886 9.4 Chicken Tikka-6, Chicken &
Bacon-6, Hot Chicken-6*
Tesco* 9.1 NA 7.0 chicken sandwich, Chicken Salad
Sandwich*
Other
Potatoes 3.6 86 75.0
Independents 3.2 34,587 46.1 Jacket Potato, Roast potato,
other Potato
Toby Carvery* 55.3 NA 8.0 Roast Potato, Mashed Potato*
JD Wetherspoon* 6.6 NA 2.6 Jacket Potato, Roast Potato,
Mashed Potato*
Brewers Fayre* 11.9 NA 2.5 Roast Potato, Mashed Potato,
Jacket Potato*

59
Harvester* 11.3 NA 1.7 Jacket Potato, Mashed potato,
other Potato*
Fried/Breaded
Fish 3.5 103 70.0
Independents 4.6 47,218 67.4 Other white fish- fried, Haddock-
fried, Cod-fried
McDonalds* 1.6 NA 2.9 Fish Fingers- 3 piece Kids*
JD Wetherspoon* 5.4 NA 2.6 Haddock- fried, Cod- fried,
Scampi
Brewers Fayre* 8.6 NA 2.2 Cod- fried, Scampi*
Harvester* 8.0 NA 1.6 Cod- fried*
Confectionery 3.5 103 69.5
Independents 4.3 43,460 62.5 Chocolate Bar, Candy
Tesco 8.2 5,571 8.0 Chocolate Bar, Candy*
Sainsburys* 6.3 NA 4.2 Chocolate Bar, Candy*
Asda* 5.0 NA 2.4 Chocolate Bar, Candy*
Total Pasta 3.1 124 61.9
Independents 3.2 32,898 53.1 Pasta Other, Macaroni & Cheese,
Lasagne
Pizza Hut FS* 17.6 NA 3.5 Spaghetti, Macaroni and cheese,
Pasta- other*
JD Wetherspoon* 5.0 NA 3.2 Lasagne, Pasta- other,
Spaghetti*
Brewers Fayre* 7.8 NA 2.6 Lasagne, Spaghetti, Macaroni
and cheese,*
Sausage 3.1 97 59.7
Independents 3.5 35,048 58.7 Sausage
JD Wetherspoon* 12.6 NA 6.6 Sausage
Brewers Fayre* 6.5 NA 1.7 Sausage
Greggs* 1.4 NA 1.4 Sausage
Puddings/
Desserts 2.9 94 57.1
Independents 3.2 32,883 57.6 Dessert- other, Traditional
Pudding, Cheesecake
McDonalds* 2.1 NA 4.2 Apple Pie, Dessert- other*

60
Tesco* 2.3 NA 2.3 Dessert-other, Cheesecake*
Sainsburys* 2.9 NA 2.1 Dessert-other, Cheesecake*
Dominos* 8.5 NA 1.6 Dessert-other, Domino's Waffles,
Cheesecake*
Ice Cream 2.9 85 55.5
Independents 2.7 26,258 47.3 Ice Cream
McDonalds 8.0 8,561 15.4 McFlurry Dairy Milk, Ice Cream
Sundae, Ice Cream*
Harvester* 17.5 NA 3.5 Ice Cream
Toby Carvery* 16.7 NA 2.6 Ice Cream
KFC* 4.5 NA 2.4 Rolo Ice Cream Tub, Avalanche*
Crisps/
Popcorn/
Salty Snacks
2.8 104 54.0
Independents 2.5 24,689 45.7 Crisps/Salty Snacks, Popcorn
Tesco 11.0 7,218 13.4 Crisps/Salty Snacks, Popcorn
Sainsbury* 7.7 NA 6.5 Crisps/Salty Snacks, Popcorn
Boots* 12.6 NA 3.8 Crisps/Salty Snacks, Popcorn
ASDA* 4.5 NA 2.8 Crisps/Salty Snacks, Popcorn
Meat MD
Meals 2.8 76 N/A
Toby Carvery* 55.1 NA NA
Vegetables- non fried, Traditional
Roast Beef, Traditional Roast
Chicken*
Beefeater* 21.9 NA NA Chips/French Fries, Beef- steak,
Ice cream*
Harvester* 24.0 NA NA Chips/French Fries, Salad- Mixed
(No Meat), Chicken- non fried*
Wetherspoon* 8.3 NA NA Vegetables- non fried, Beef
steak, Roast Potatoes*
Independents 2.5 NA NA
Vegetables- non fried,
Chips/French Fries, Chicken-
other

61
Salad (No
Meat/Fish) 2.7 77 53.6
Independents 3.0 31,747 59.3 Salad-Mixed (No Meat/Fish),
Salad-Mixed, Salad-Other
Pizza Hut FS 32.7 3,631 6.8 Salad Station Bowl, Side Salad,
Salad Station Plate*
Harvester* 39.3 NA 7.7 Salad-Mixed (No Meat/Fish),
Salad-Other*
KFC* 8.1 NA 4.1 Coleslaw, Salad-mixed*
Fried/Breaded
Chicken 2.2 76 44.3
McDonald's 15.1 16,165 36.5
McNuggets- 6 pieces,
McNuggets- 4 pieces (with kids
meal), Chicken Select Strips- 5
pieces*
KFC 28.7 9,938 22.4 Chicken Pieces, Popcorn chicken,
Crispy strip*
Independents 0.9 9,336 21.1 Fried Chicken (Bone), Chicken
Nuggets/ Strips- Other
Burger King* 16.3 NA 6.5 Chicken Bites*
Dominos* 15.1 NA 2.9 Chicken Strippers, Chicken
Kickers, Chicken Combo*
Indian MD
Total 2.1 91 48.2 Independents 3.3 40,313 83.6
Indian MD Other, Indian MD
Rice, Indian MD
Vegetables
(excl
potatoes)
2.0 80 37.9
Independents 2.1 20,874 55.1 Vegetables- non fried
Toby Carvery* 39.1 NA 8.1 Vegetables- non fried*
KFC* 7.0 NA 5.1 Corn cobette*

62
Appendix 6: Top Beverage Categories in Scotland- Top Items by Chain/Independents- 2YE Dec 12
*/Italics= data from Total GB used due to small sample sizes in Scotland
Category
Total OOH Scotland Top chains / Independents
Incidence
(%)
Index
vs.
Total
OOH
GB
Total
Servings
(millions)
Chain Incidence (%)
Total
servings
(000)
Share of
Total
OOH
Servings
(%)
Top 3 Items
Speciality
Coffee/ Hot
Chocolate
10.5 101 205.6
Independents 9.4 95,972 46.7 Latte, Cappuccino, Hot Chocolate
Costa Coffee 59.9 15,823 7.7 Latte, Cappuccino, Hot Chocolate
Starbucks 53.8 12,891 6.3 Latte, Cappuccino, Hot Chocolate
McDonald's 7.4 7,949 3.9 Cappuccino, Latte, Hot Chocolate
Greggs 8.6 7,090 3.4 Cappuccino, Latte, Hot Chocolate
Caffé Nero 30.5 4,733 2.3 Latte, Cappuccino, Hot Chocolate
Regular Cola 9.9 99 194.4
Independents 7.7 77,180 60.2 Coca Cola, Pepsi, Other Regular Cola
McDonalds 25.5 27,205 14.0 Coca Cola
Greggs 10.5 8,793 4.5 Coca Cola, Cherry Coke, Pepsi
KFC 27.3 7,055 3.6 Pepsi

63
ASDA 17.3 6,814 3.5 Coca Cola, Cherry Coke, Pepsi
Burger King 23.9 4,732 2.4 Coca Cola
Diet Cola 9.1 123 177.2
Independents 7.0 70,172 61.8 Diet coke, Coke Zero, Pepsi Max
McDonalds 18.0 19,422 11.0 Diet Cole, Coke Zero
Tesco 10.9 7,649 4.3 Diet coke, Coke Zero, Pepsi Max
Greggs 8.9 7,467 4.2 Diet Coke, Coke Zero, Pepsi Max
KFC 22.2 5,738 3.2 Diet Pepsi
ASDA 12.3 5,019 2.8 Diet Coke, Coke Zero, Pepsi Max
Total Fizzy
Drinks
excluding
Cola
7.6 152 153.4
Independents 4.1 79,384 65.3 Irn Bru, Other brand, Fanta
McDonalds 14.6 15,717 10.2 Sprite, Fanta
Burger King 24.6 5,153 3.4 Fanta, Sprite
Greggs 5.5 4,505 2.9 Irn Bru, Fanta, 7up
KFC* 14.1 NA 4.9 Tango, 7up
Water
(Bottled +
Tap)
7.1 93 139.3
Independents 6.9 69,100 89.5
Tap water, don't know brand, Other
brand, Volvic
Tesco 7.8 5,191 3.7 Buxton, Tap, Evian*
Greggs 4.4 3,634 2.6 Buxton, Evian, don't know brand

64
Sainsbury's* 9.5 NA 2.8 Tap, Buxton, Evian*
Asda* 10.1 NA 2.2 Buxton, Evian, Tap*
Boots* 13.1 NA 1.4 Buxton, Evian, don't know brand*
Juice Drinks 4.8 94 98.3
Independents 3.7 36,953 58.2 don't know brand, other brand, Fruit
Shoot
Tesco 8.8 5,776 5.9 other brand, Fruit Shoot, Oasis*
McDonalds 3.7 3,993 4.1 Fruit Shoot
Greggs* 5.1 NA 3.2 Oasis, Fruit Shoot, Flavoured Volvic*
Asda* 8.5 NA 3.0 Fruit Shoot H20, Fruit Shoot, Caprisun*
Pure Juice 2.9 91 58
Independents 2.3 22,811 62.9 don't know brand, other juice brand,
Tropicana*
McDonalds 4.2 4,451 7.7 Tropicana
Tesco* 6.3 NA 5.8
other juice brand, Tropicana, don't know
brand*
Sainsbury's* 5.1 NA 3.5
Tropicana, other juice brand, don't know
brand*
Asda* 2.8 NA 1.4
Tropicana, other juice brand, don't know
brand*


![My favourite food and drink. My favourite food is …. Lettuce [ˈletɪs] Salad [ˈsæləd] and Pizza [ˈpi:tsə] and also.](https://static.fdocuments.us/doc/165x107/56649c8b5503460f94945467/my-favourite-food-and-drink-my-favourite-food-is-lettuce-lets-salad.jpg)

