Factors Influencing Small-scale Farmers' Choice of Formal or ...

AN ASSESSMENT OF MANGO FARMERS’ CHOICE OF MARKETING CHANNELS
IN MAKUENI, KENYA
BY
DAVIS NGUTHI MUTHINI
A THESIS SUBMITTED IN PARTIAL FULFILLMENT OF THE REQUIREMENTS
FOR THE DEGREE OF MASTER OF SCIENCE IN AGRICULTURAL AND APPLIED
ECONOMICS OF THE UNIVERSITY OF NAIROBI
2015

ii
Declaration
This thesis is my original work and has not been presented for the award of a degree in any other
academic institution.
Davis Nguthi Muthini
Reg. No. A512/60013/2013
Signature……………………………………..Date…………………………………
This thesis has been submitted with our approval as University supervisors
Dr. Rose Adhiambo Nyikal
Department of Agricultural Economics, University of Nairobi
Signature…………………………………………Date………………......................
Dr. David Jakinda Otieno
Department of Agricultural Economics, University of Nairobi
Signature………………………………………….Date……………………………

iii
Dedication
With sincere appreciation, I dedicate this thesis to my family, my university supervisors, and
friends for the unwavering support.

iv
Acknowledgement
I give thanks to almighty God, for the gift of life and good health, without which this work
would not have been possible.
My profound appreciation goes to my advisors, Dr. Rose Nyikal and Dr. David Otieno, for their
guidance, timely response, and moral support. In you I found academic parents.
I am also grateful to the Government of Kenya and the Africa Economic Research Consortium
(AERC) for awarding me the scholarship to pursue masters in Agricultural and Applied
Economics and for providing my research funds.
I acknowledge the support of the lecturers at the University of Nairobi, Department of
Agricultural Economics, and at the University of Pretoria, for the valuable academic contribution
to my studies. I am also grateful to my fellow students in the Collaborative Masters in
Agricultural and Applied Economics (CMAAE) programme, particularly James Maina and Alex
Riithi for guidance and support.
I would like to thank Mrs. Sarah Nzau, head of MESPT/ABD Makueni office for her support to
reach the farmers, Mr. Waema, Chairman of Makueni County Fruit Processors Cooperative
Society (MCFPCS) for allowing me time in his busy schedule, the mango farmers in Makueni,
and the farmer group leaders for making this study possible.
May the Almighty God bless you abundantly

v
ABSTRACT
Improving market access for small-holder farmers is important in helping towards raising rural
incomes and reducing poverty. The Millennium development goal number one is to eradicate
poverty. Most of the poor are small scale farmers in rural areas of Africa and Asia. The
Comprehensive Africa Agriculture Development Program (CAADP) anticipates that improving
access to market for these farmers will help towards reducing poverty. Small scale farmers in
developing countries are excluded from markets due to long value chains, lack of transparency,
and presence of too many players. Mangoes are produced in the Eastern and Coastal areas in
Kenya. Farmers in the Makueni have taken up mango farming quickly, making Makueni the
leading producer of mangoes in Kenya. Marketing is however not organized. Despite the
presence of several mango buyers in the country, mango farmers are experiencing up to 30
percent post-harvest losses, and gross margins are low at Kshs. 1.70 per piece. Profit should
guide farmers’ choice of market channel, yet this is often not the case, it is not clear what drives
farmer decision of the channel to sell to. There is no study that has actually been carried out to
determine the factors that influence farmers’ decision to participate in the available market
channels; this is the literature gap that this study sought to fill. The aim of this study was to
assess the factors that influence mango farmers’ choice of market channels in Makueni County.
The study used data collected in 2014 from a sample of 227 farmers using multistage and
random sampling techniques. Analysis of Variance was used to determine the difference in the
prices offered by the different channels, while Multinomial logit model was used to quantify the
factors affecting channel choice. Results of the study show that farmers sold to three major
channels, which are brokers, exporters, and direct market. Majority of the farmers (58 percent)
sold to brokers, 30 percent to export, while the rest sold to direct market. Price analysis results

vi
show that farmers selling to direct channel earned the highest average prices, while brokers
offered the lowest prices. Analysis of Variance (ANOVA) results find sufficient evidence that
prices offered by the channels are different. The multinomial logit results show that farmers who
were members of producer marketing groups, had attended training, and had a large number of
mango trees were more likely to sell to exporters relative to brokers. In addition, farmers who
owned a vehicle, were closer to the tarmac road, and had access to market information were
more likely to sell to direct market relative to brokers. Results of this study provide insights for
the ongoing efforts to transform agriculture from subsistence to market oriented activity for
farmers in Kenya. There is need to assist farmers link with organized and formal markets to
bolster their incomes. The study recommends that interventions aimed at providing market
information, as well as training and extension to farmers should be reinforced. Producer
marketing groups can fill the gaps left by marketing boards through linking farmers with buyers,
and assisting farmers attain quality and safety requirements of especially export market. These
quality and safety requirements are a major impediment to access to niche markets. In addition, it
is more effective and cheaper to offer training and extension services to farmers through the
groups. The study recommends further research on the marketing side, to determine the
constraints and challenges faced by marketers would also be beneficial for policy and/or practice.
Keywords: Mango farmers, Market channels, Multinomial logit, Makueni County

vii
Table of Contents
Declaration..................................................................................................................................... ii
Dedication ..................................................................................................................................... iii
Acknowledgement ........................................................................................................................ iv
Abstract .......................................................................................................................................... v
Table of Contents ........................................................................................................................ vii
List of Tables ................................................................................................................................ ix
List of Figures ................................................................................................................................ x
List of Acronyms .......................................................................................................................... xi
INTRODUCTION......................................................................................................................... 1
1.1 Background ........................................................................................................................... 1
1.2. Problem statement ................................................................................................................ 5
1.3 Purpose and Objectives ......................................................................................................... 6
1.4 Hypotheses ....................................................................................................................... 7
1.5 Justification ........................................................................................................................... 7
1.7 Organization of the thesis ...................................................................................................... 8
LITERATURE REVIEW .......................................................................................................... 10
2.1 An overview of the mango sub-sector in Kenya ................................................................. 10
2.2 Review of Kenya’s mango marketing channels .................................................................. 12
2.3 Institutional factors in Agricultural marketing .................................................................... 13
2.3.1 Transaction cost and imperfect information ................................................................. 14
2.3.2 Collective action ........................................................................................................... 16
2.4 Review of past studies in market channels.......................................................................... 18
METHODOLOGY ..................................................................................................................... 21
3.1 Study area ............................................................................................................................ 21
3.2 Conceptual framework ........................................................................................................ 23
3.2 Theoretical framework for analysis..................................................................................... 24
3.3 The empirical model............................................................................................................ 26

viii
3.3.1 Characterization of mango marketing channels used by mango farmers in Makueni .. 26
3.3.2 Evaluation of factors affecting farmers’ choice of market channel .............................. 27
3.4 Sampling and data collection .............................................................................................. 30
RESULTS AND DISCUSSION ................................................................................................. 33
4.1 Characterization of the households and mango marketing channels in Makueni County .. 33
4.2 Characterization of the different mango marketing channels ............................................. 36
4.2.1 Reasons given by farmers for targeting the different channels available ..................... 37
4.2.2 Price trends ................................................................................................................... 39
4.2.3 Testing for variation in prices: Analysis of variance (ANOVA) .................................. 40
4.2.4 Price discovery in different channels ............................................................................ 41
4.3 Institutional factors in mango marketing ............................................................................ 43
4.3.1 Market information ....................................................................................................... 43
4.3.2 Membership to Collective action group, contract, access to training and extension
services and access to credit .................................................................................................. 45
4.3.4 Transaction costs .......................................................................................................... 47
4.4 Results for determinants of mango farmers’ choice of market channel .............................. 48
4.4.1 Test for multicollinearity .............................................................................................. 48
4.4.2 Assessing goodness of fit for the multinomial logit model .......................................... 49
4.4.3 Test for Independence from Irrelevant Alternatives (IIA) ........................................... 49
4.4.4 Determinants of mango farmers’ choice of marketing channels .................................. 49
SUMMARY, CONCLUSIONS AND POLICY RECOMMENDATIONS ............................ 56
5.1 Summary ............................................................................................................................. 56
5.2 Conclusions and policy recommendations .......................................................................... 57
5.3 Contribution to knowledge .................................................................................................. 58
5.4 Suggestions for further research .......................................................................................... 59
References .................................................................................................................................... 60
Appendix I: Variance inflation factors results for multi-collinearity test ............................. 65
Appendix II: Assessment of goodness of fit .............................................................................. 66
Appendix III: Hausman test for IIA ......................................................................................... 67
Appendix IV: Questionnaire for mango farmers marketing practices in Makueni, Kenya 68

ix
List of Tables
Table 1: Mango production trends in Kenya .................................................................................. 2
Table 2: Table of expected explanatory variables ........................................................................ 28
Table 3: Village selection matrix .................................................................................................. 32
Table 4: Socio-economic characteristics of respondents (n=227) ................................................ 34
Table 5: Mango trees per acre in Makueni ................................................................................... 36
Table 6: One way ANOVA results for average net prices between and within groups ............... 40
Table 7: MNL parameter estimates for determinants of choice of market channel (Broker used as
base outcome) ............................................................................................................................... 50
Table 8: Marginal effects of the MNL regression model for mango farmers’ choice of market
channels......................................................................................................................................... 51
x
List of Figures
Figure 1: Selected statistics from top five mango producing counties in Kenya ............................ 3
Figure 2: Mango supply chain in Kenya and regional market ........................................................ 4
Figure 3: Major mango export markets for Kenya ....................................................................... 10
Figure 4: Map of Kenya showing location of Makueni County ................................................... 22
Figure 5: Conceptual framework .................................................................................................. 23
Figure 6: Distribution of farmers that target different channels ................................................... 37
Figure 7: Reasons for using the different channels ....................................................................... 38
Figure 8: Gross price trends for the different channels 2011-2013 .............................................. 39
Figure 9: Gross margin and cost comparison ............................................................................... 40
Figure 10: Price discovery methods used in the different channels .............................................. 41
Figure 11: Distribution of farmers depending on institutional factors ......................................... 43
Figure 12: Sources of market information .................................................................................... 44
Figure 13: Transaction costs incurred by farmers ......................................................................... 47

xi
List of Acronyms
ABD Agricultural Business Development
ANOVA Analysis of Variance
ASALs Arid and Semi-Arid Lands
CAADP Comprehensive Africa Agriculture Development Programme
CE Choice Experiment
COMESA Common Market for Eastern and Southern Africa
CSTI Centre for Science and Technology Innovation
FAO Food and Agriculture Organization (of the United Nations)
IIA Independence from Irrelevant Alternatives
KACE Kenya Agricultural Commodity Exchange
KARI Kenya Agricultural Research Institute
MCFPCS Makueni County Fruit Processors Cooperative Society
MDG Millennium Development Goals
MNL Multinomial Logit
NASEP National Agriculture Sector Extension Policy
NEPAD New Partnership for Africa’s Development
RUM Random Utility Model
RPL Random Parameter Logit
PMGs Producer Marketing Groups
SAPs Structural Adjustment Programs
SPSS Statistical Package for Social Sciences
UN United Nations

1
CHAPTER ONE
INTRODUCTION
1.1 Background
The United Nations (UN) millennium development goal (MDG) number one is to eradicate
extreme poverty and hunger. Over 70 percent of the hungry and poor people live in rural areas,
particularly in Asia and Africa. For most of the rural poor, agriculture is critical to the successful
attainment of MDG number one. Immediate gains in poor households’ welfare can be achieved
through a more productive and profitable agricultural sector (World Bank, 2006).
On the African front, the second pillar of the Comprehensive Africa Agriculture Development
Program (CAADP) aims to accelerate growth in the continents’ agriculture by among other
ways, increasing market access (NEPAD, 2003). According to Food and Agriculture
Organization (FAO, 2014), tropical fruit orchards in developing countries targeting export
market earned 12.8 billion dollars in 2010. Small scale tropical fruit farmers have however been
excluded from value chains due to lack of economies of scale, difficulty in complying with
market access requirements, poor linkages to market and inadequate market information and
dissemination. Despite the supermarket revolution which is creating market for horticulture
farmers in Africa, Neven et al (2009) find that a ‘threshold capital vector for entrance’ in this
channel hampers small, rain-fed farms. Consequently, majority of super-market suppliers are an
emerging crop of fairly-educated farmers who own commercial and medium sized farms targeted
at supermarkets. Promoting participation of small scale farmers in the agricultural value chain
can improve their livelihoods and food security, and hence facilitating achievement of MDG
number one.

2
Horticulture (fruits, flowers and vegetables) is a key agriculture sub-sector in rural Kenya. A
report of the Horticultural Crops Development Authority (HCDA) shows that major fruits
produced in Kenya in terms of volumes are bananas, mangoes, and pineapples (HCDA, 2010).
Mangoes, however, seem more versatile than all others for their ability to thrive in low rainfall
(500-1000mm) and a wide range of temperature (10-42 degrees Celsius) which makes it suitable
even for the Arid and Semi-arid lands (ASALs). The area under mango cultivation in Kenya has
been rising in the last decade as shown in Table 1 below.
Table 1: Mango production trends in Kenya
2001 2002 2003 2004 2005 2006 2007 2008
Hectares (ha) 16,542 17,673 17,268 18,094 17,738 17,264 23,730 28,790
Volume (MT) 179,648 176,504 183,486 183,440 168,663 163,726 396,461 448,572
Value (Million KShs)1,345.7 1,078.8 1,208.4 1,360.4 1,046.4 1,157.1 5,867.5 6,398.4
Source: Agricultural Business Development, 2011
Makueni County is located in the semi-arid lower Eastern region of Kenya. Majority of the
residents (64 percent) are poor, a case that is attributed to the frequent drought that occurs in the
area (Centre for Science and Technology Innovation, 2009). The Kenya Agricultural Research
Institute (KARI) introduced mango farming in the county a decade ago to help mitigate the
effects of the frequent droughts. Farmers in the County have taken up mango farming rapidly
making Makueni the leading Producer of mangoes in the country as shown in Figure 1.

3
Figure 1: Selected statistics from top five mango producing counties in Kenya
Source: Agricultural Business Development, 2011; Msabeni et al. (2010)
From figure 1, Makueni County has a higher value relative to number of farmers and trees,
compared to other counties. This can be attributed to the large proportion of apple mangoes
which fetch higher prices. An estimated 49 percent of mango trees in Eastern region are apple
variety compared to up to 70 percent in Makueni County (ABD, 2011). According to
Mwangangi et al. (2012), in February and March of every year, even when there is a total crop
failure in the area, mangoes are harvested, which creates a major source of income both for the
farmers and casual laborers employed at the time.
Despite the apparent versatility of the fruit, mango marketing in Kenya is not organized. It is
estimated that the margin to mango farmers is very low, at Kshs. 1.70 per fruit in some channels
at farm level, while post-harvest losses could be up to 30 percent which is a disincentive to
production (ABD, 2011). Marketing plays a critical role both in stimulating production and
accelerating the pace of economic development. According to Panda and Sreekumar (2012), an

4
efficient marketing system ensures a high level of producers’ share of consumer price, reduced
number of middlemen, low marketing charges and reduced mal-practices in the marketing
chains. However, most agricultural marketing channels in developing countries are long and
complex, and with high transaction costs that considerably lower the farmers’ share of the
consumer price (Shiferaw, 2006).
Agricultural marketing in Kenya has experienced major changes from the era of marketing
boards to a liberalized and much more diversified market system owing to implementation of
Structural Adjustment Programs (SAPs). Liberalization has seen marketing boards give way to
private market players in the agriculture sector; hence farmers have a wider variety of
buyers/channels to target. Previous studies on Kenya’s mango sub-sector have identified four
main marketing outlets (brokers, processors, exporters and direct selling), as shown in Figure 1.
Figure 2: Mango supply chain in Kenya and regional market
Source: FAO, 2003

5
From Figure 2, a farmer has the option of selling to any of 4 channels, namely; intermediaries
(rural assemblers, wholesalers and brokers), rural retail centers, urban retail centers and
exporters. The channels vary in incentives and conditions such as prices offered, quality and
quantity requirements, contracts, costs, and cash or credit payment among others. Exporters and
intermediaries (mainly brokers) buy mangoes from farmers at the farm-gate, they move from
farm to farm during mango season in search of mangoes. Farmers who sell to both rural and
urban retail centers are classified in this study as selling to direct market; this category of farmers
have to transport their produce to the retail centers either using own or hired means of transport.
1.2. Problem statement
Kenya’s liberalization of agricultural markets was meant to improve efficiency by reducing costs
and increasing accessibility through increased private sector participation, thereby giving
producers a wider choice of marketing channels. Despite the increased private sector
participation, results of improved small scale farmers’ income from markets have not been
achieved in majority of markets (Shiferaw et al., 2006). Generally, marketing chains for
agricultural commodities in Kenya are long, not transparent, and consist of many players,
making them inefficient and unresponsive to producer needs (GoK, 2010a).
The mango sub-sector has not been spared; though mango farming has developed in the last 10
years to become a key source of income for many households in Makueni County, marketing
innovations especially by farmers, have not moved at the same pace. The direct market channel
and other formal channels offer better terms such as high prices. The government and other
stakeholders have focused efforts at linking farmers with these channels by assisting farmers
form groups and organizing forums where farmers and the buyers can link. ABD (2011) however
found that majority of farmers still sell to brokers at farm-gate. This happens in spite of mistrust,

6
accusations of exploitation, and refusal by brokers to sign contracts; as a result, mango farmers
experience heavy losses and a glut situation during peak season due to lack of access to markets.
According to Tsourgiannisa et al. (2008), the marketing channel used when selling a product has
a bearing on the profit farmers may make. Profit should then drive the choice of marketing
channel, yet this often is not the case; it is not clear what drives the decisions of the choice of
marketing channels and the actual consequences for the mango farmers in Makueni County.
There has been extensive research on choice of marketing channels; Ferto and Szabo (2002) on
Hungarian fruit and vegetable sector, Ogunleye and Oladeji (2007) in the cocoa sector in
Nigeria, Martey et al. (2012) on the yam sector in Ghana, among others. Results from these
studies vary depending on the product being considered, number and organization of available
channels, and the institutional, technical, and economic environment the farmers operate in.
Channel choice studies have received very little attention in Kenya and especially the
horticultural sub-sector with the available studies, (for example, Msabeni et al. 2010; ABD
2011), only focusing on other aspects of value chains and production statistics. There is lack of
empirical information on the process of mango farmers’ channel choice decisions and the factors
affecting participation into available marketing channels. There is need to complement the
apparently successful innovations in the primary production with innovations in marketing. This
study therefore seeks to provide empirical information on the decision making process of farmers
on market channels to sell to, and the factors that influence such decisions.
1.3 Purpose and Objectives
The purpose of this study was to analyze the factors that influence mango farmers' choice of
marketing channels in Makueni County

7
Specific objectives
i) To characterize the different marketing channels available for mango farmers in Makueni
County.
ii) To evaluate the factors affecting the mango farmers’ choice of market channels.
1.4 Hypotheses
i. There is no difference in the prices offered by the different channels
There are several points of interaction between buyers and sellers; they include price and price
determination mechanism, payment, payment method and duration, and information transmission
among others. The variation that was tested in the current study is in price, as it is the cardinal
factor that determines whether or not a transaction takes place.
ii. Socio-economic, institutional and technical factors do not affect farmers’ choice of
marketing channel
From literature, several factors have been variously identified as having an influence on farmers’
decision on the channel to target. These include off-farm employment, group membership,
household income, experience, contact with agricultural extension personnel, training, number of
mango trees, years spent in school, distance to the nearest tarmac road, access to market
information, and ownership of a means of transport. In the present study, the potential influence
of some of these factors on farmers’ choice of marketing channels was empirically tested.
1.5 Justification
Agriculture has been identified as one of the key sectors to deliver the 10 per cent annual
economic growth rate under the economic pillar of Kenya’s vision 2030. One of the strategies of
accelerating agriculture sector growth is to improve market access for smallholders through
better supply chain management (GoK, 2007). The importance of market access to agriculture
8
development has also been emphasized in the Agricultural Sector Development Strategy (ASDS)
2010-2020 (GoK, 2010a). The Government aims to help farmers to access markets through
developing marketing infrastructure, especially rural market facilities, ensuring that agricultural
products meet international quality and safety standards, and supporting farmer organizations to
play their role in providing market support services. This study provides insights into the factors,
both farmer and market related, that restrict market access for farmers. The policy
recommendations of the study highlight areas which need policy input from the government and
other stakeholders in order to streamline markets and manage current inefficiencies.
The agriculture sector will be a key player in multilateral and bilateral trade negotiations with the
objectives of expanding and diversifying agricultural markets especially to the Common Market
for Eastern and Southern Africa (COMESA) and other export markets (GoK, 2010a). There is
need for better understanding of how farmers have been able to exploit the available markets,
what challenges and opportunities exist, and how farmers can be assisted to target emerging
niche markets that they have not been able to exploit.
This study provides insights into the interaction between farmers and traders and the factors
which tilt the equilibria of interaction. The results are applicable in other sub-sectors of
agriculture especially in other developing countries where farmers face similar conditions. This
study therefore adds to the body of literature that explains the structure of agricultural markets
after liberalization and the role of institutional factors in influencing transactions.
1.7 Organization of the thesis
Chapter one of the thesis provides general overview of the role of Agriculture, specifically
horticulture and in particular mangoes in poverty reduction, especially among poverty stricken
rural farmers in developing countries. The problem being investigated and objectives of the study

9
are also discussed here. The rest of the thesis is organized as follows: Chapter two is a review of
literature on the mango sub-sector and studies on market channel choices. Chapter three is a
description of the methodology, which includes the conceptual, theoretical, and empirical
frameworks. In these sections, the theory on which the study is based is discussed, as well as a
description of the analysis methods used in the study. Sampling procedure and data collection
methods are also discussed in Chapter three. Chapter four presents the results of the study, while
chapter five presents summary, conclusions and highlights policy recommendations from the
study.

10
CHAPTER TWO
LITERATURE REVIEW
This section provides a review of the literature in the mango sub-sector as well as other studies
that have focused on choice of market channels by producers.
2.1 An overview of the mango sub-sector in Kenya
In Kenya, mangoes are produced by both large scale and small scale farmers for both export and
domestic consumption. The bulk of the mangoes (over 98 percent) are for domestic markets and
about 1-2 percent with a value of approximately Kshs. 150 million per year is exported (Msabeni
et al. 2010). Middlemen, individual farmers or farmer groups sell approximately 5 percent of the
fresh mangoes to processing industries such as Kevian Kenya Limited, Sunny Mango Processors,
and Milly Processors. Mangoes account for 26 percent of fruit exports, second to avocadoes at
62 percent. The major destinations for export mangoes from Kenya are presented in Figure 3.
Figure 3: Major mango export markets for Kenya
Source: HCDA, 2010
Eastern Region leads in mango production in Kenya, with over 3 million trees planted in over
42,000 hectares, followed by coast region with 1.4 million trees. Mango farming generates over

11
Kshs. 2.4 billion at farm level annually, which accounts for 22 percent of farm household income
in the region. At county level, Makueni County with approximately 1,172,636 trees with annual
value of Kshs. 1.3 billion leads in mango production, second is Machakos County with 803,533
trees and annual value of Kshs.300 million (ABD, 2011). There are about 32 mango varieties
grown in Kenya, but only a few are grown on commercial scale, these include; Ngowe, Boribo,
Apple, Kent, Dodo, Tommy Atkins and Van Dyke. Approximately 70 percent of mango trees
grown in Makueni County are apple variety. The apple variety is preferred because it fetches
higher prices compared to the other varieties.
ABD (2011) summarizes key constraints facing mango farmers in Kenya as un-assured markets,
unreliability of buyers, and a poorly organized value chain generally dominated by brokers. FAO
(2003) identified four areas of concern in the mango sub-sector which are classified in 4 stages;
production stage, marketing stage, processing stage and the export stage. At the farm-level,
farmers lack clean planting material, adequate technology, and adequate post-harvest handling
facilities. Constraints at the marketing stage include poorly developed transport infrastructure
and prohibitive transport and shipping costs both within and outside the country. Supply is not
well organized and farmers often lack the necessary information on alternative marketing
possibilities and other options for value addition leading to poor market access and high
transaction costs to both producers and buyers. According to Jayne et al. (2002), the problem of
market access is linked to farmers’ inability to meet market standards, low volumes of produce,
wide dispersion of producers, presence of middlemen and perceived low prices, gender,
education levels and information asymmetry. This study was therefore an attempt to enumerate
the specific constraints faced by mango farmers in accessing their markets of choice. This should

12
help in coming up with crop specific policy and/or practice measures for mango farmers in this
case to enable them better overcome the constraints and increase benefits from mango farming.
2.2 Review of Kenya’s mango marketing channels
Brokers account for the largest portion of mango sales in Kenya (ABD, 2011). They operate in a
climate of uncertainty but are not willing to enter into formal contracts with farmers; hence
farmers do not trust them (Msabeni et al., 2010). Panda and Sreekumar (2012) argue that in cases
where markets have been heavily infiltrated by brokers, farmers would be better off by
organizing themselves into Producer Marketing Groups (PMGs) or cooperatives. This would
give the farmers better bargaining power for their produce over brokers, who manipulate and
control the price in the marketing system.
Over 90 percent of smallholder farmers in almost all regions of Kenya produce horticultural
crops, but only less than 2 percent do so directly for export (Muendo and Tschirley, 2004). The
export market offers better prices but requires reliable supply which should meet the stringent
quality and safety standards required in the world market. Exporters normally buy mangoes from
PMGs and individual farmers through formal and informal contracts.
Some farmers transport their produce to the local markets or major urban centers using own or
hired vehicles or even public transport vehicles that are locally known as “matatus”. Most of
these farmers transport the mangoes in gunny bags which affect quality and price, (Msabeni et al.
2010), but they still earn higher prices than those who sell at farm-gate. Only a small proportion
of farmers target direct market and they operate individually due to lack of organized marketing
groups, the farmers do not engage one of them to transport product to the market for this
channel. Fafchamps and Hill (2005) attribute this behavior to lack of trust among the farmers and
fear of being cheated as prices are continually changing. According to Matin et al. (2008),
13
farmers who sell their produce directly to the ultimate consumers get more benefit. However, in
an environment of information asymmetry as is the case of most agricultural markets in
developing countries, it is difficult for risk-averse farmers to transport their produce to the
market. Faced with choice between waiting for the buyers in the farm-gate, and transporting the
produce to the market where they will get a higher price but must incur transport costs; the
former will be more likely. Fafchamps and Hill (2005) observe that selling directly to the market
is more likely when the quantity sold is large and the market is near. This study therefore sought
to characterize the different channels specifically used by farmers in Makueni County and assess
the factors that influence farmers in accessing the channels. Understanding these factor0 s would
complement efforts to assist farmers’ access especially to niche market outlets that offer higher
profitability.
2.3 Institutional factors in Agricultural marketing
According to Kirsten et al. (2008), African agricultural markets do not always function in the
best interest of the society because of poor communication and transport facilities. Markets are
highly segmented and restricted, leading to market failure and missing markets in some
instances. Janvry et al. (1991) define market failure as when the cost of transacting through
market exchange creates disutility greater than the utility gain that it produces, with the result
that the market is not used for transaction. When such happens, either a surrogate institution will
emerge to allow the transaction to take place or the transaction will simply not occur. Market
failures eventually give rise to institutional arrangements. However, lack of clear definition of
property rights and information asymmetry leads to high efficiency costs of these arrangements;
this is the case in developing countries. There is therefore the need for balance between merits of

14
improved market performance and the efficiency costs brought by the new institutional
arrangements.
There are many definitions of what institutions are, the most commonly used is by North (1990);
institutions are a set of formal (laws, contracts, political systems, organizations, markets) and
informal (norms, traditions, customs, value systems, religions, sociological trends) rules of
conduct that facilitate coordination or govern relationships between individuals or groups.
Institutions facilitate low cost coordinated exchange, resource management, and encourage trust,
thereby providing incentives for exchange and resource management by creating profitable
investments and exchange (Kirsten et al., 2008). Transaction costs, information flows, and
collective action are the major aspects of institutions in Agricultural marketing.
With the low profit margins reported among mango farmers in Makueni County, it is not clear
whether institutional factors play a part in influencing where the farmers sell and ultimately the
profits they earn. This study therefore incorporated institutional factors such as information
access, collective action and transaction costs. These factors are discussed in depth in the sub-
sections that follow below.
2.3.1 Transaction cost and imperfect information
Transaction costs are defined as any other costs, other than cash price, that are incurred during
trading or exchange of goods and services. Transaction costs impede exchange and hence reduce
markets’ ability to reach efficient prices leading to multiple possible price equilibriums in the
market for a similar product. The market equilibrium eventually depends on institutional
arrangements governing that particular market. Kirsten et al. (2008) argue that the assumption of
perfect and free market information by neoclassical economists may not be all that practical.

15
Information is most of the times costly, and when so, various activities related to exchange of
property rights between individuals gives rise to transaction costs. Transaction costs are incurred
in; the search for information on prices and quality of products, bargaining, and the making,
monitoring and enforcement of contracts. Mangisoni (2006) notes that Smallholder farmers find
it difficult to penetrate formal markets due to, among other factors, high transaction costs, high
risks, missing markets and lack of collective action. There is need to define precisely the
situation in Makueni County, if the farmers have to be helped overcome the marketing
challenges they face.
Lack of perfect and free information leads to risk and uncertainty in transactions; sellers have
more information than buyers about the availability and characteristics of the products they are
selling, while buyers have more information than sellers about the nature of their demand and
their ability and intentions to pay for products that they purchase (Kirsten et al., 2008). Searching
for and obtaining information about products and sellers and about demand and buyers is then
necessary for both parties involved in the transaction in order to reduce the risks of transaction
failure. However, searching and obtaining information is not costless; it is an important source of
transaction costs (Kirsten et al., 2008). Better information can improve farmers’ bargaining
position, reduce search costs, and give them the choice to travel to farther markets if prices there
are higher (Zanello et al., 2001). In addition, farmers relying on informal networks for market
information are at risk of getting biased information due to opportunistic behavior of the more
informed group. For instance, Mangisoni (2006) explained that smallholders usually accept low
prices for their crops when the buyer informs them that their produce is of poor quality because
they are unable to negotiate from a well-informed position. More distant markets may have
better infrastructure, more buyers, and potentially higher profits; reasons that can urge

16
households to transport their product to be sold there (Shilpi and Umali-Deininger, 2008).
However, Zanello et al. (2001) argue that distance would increase proportional transaction costs
and possible information on prices may be unreliable adding uncertainty and risk to the
transaction.
Farmers in Makueni County, being in a developing country, are likely to be faced with high
transaction costs due to information asymmetry and poor infrastructure. Transaction costs are a
major aspect of trade in agriculture and especially for small scale farmers, this study therefore
sought to find out the types of transaction costs mango farmers incur, the source of such costs,
and how the transaction costs affect their choice of market outlet. Further, the importance of
market information in market channel decision making has not been adequately documented in
literature. This study sought to find out the sources of market information for mango farmers and
how access or otherwise of the information affects choice of where to sell.
2.3.2 Collective action
Collective action arises when people come together because of common constraints to take joint
action and decisions to accomplish an outcome, the activities affect the interests or wellbeing of
a group (Sandler, 1992). According to Kirsten et al. (2008), collective action among producers in
African countries can help lower transaction costs and empower producers to hold service
providers and buyers accountable for the types and quality of service they deliver. In addition,
Poulton (2014) notes that committed farmers working together can perform some of the
monitoring functions required for traceability at lower cost than can the employees of buying
firms. Fischer and Qaim (2012) found that marketing through a group yields a higher price than
selling individually among banana farmers in Central Kenya; similar results were also found by
Wollni and Zeller (2006) among coffee farmers in Costa Rica. However Fischer and Qaim

17
(2012) noted that prices between the channels cannot be used as proxy for profitability because
farmers selling through groups incurred extra costs of transporting produce to collection centers.
Most smallholder farmers lack collective action in markets; individual marketing of small
quantities of produce weakens the smallholder farmers’ bargaining power and exposes them to
price exploitation by traders (Kherallah and Minot, 2001). Lack of PMGs makes it difficult for
smallholder producers to participate in formal markets. Frank and Henderson (1992) found that
the greater the degree of organization in the market, the smaller the transaction costs are likely to
be and the easier it is to benefit from an exchange opportunity. According to Shiferaw et al.
(2006), producer marketing groups have the potential to simplify and shorten the marketing
chain by directly connecting small producers to markets, coordinating production and marketing
activities and facilitating farmer access to production inputs at fair prices.
The effectiveness of PMGs especially in semi-arid Eastern Kenya is however hampered by lack
of credit, price variability due to seasonal production, low volumes, lack of buyers, and their lack
of cash capital to pay for produce deliveries by farmers. Brokers who normally pay cash on
delivery are still the dominant market channel in majority or rural markets. Shiferaw et al. (2006)
note that due to this factor, cash constrained farmers find it very difficult to sell through PMGs,
even when the PMGs would eventually be in a position to pay prices significantly higher than
other buyers. Hence many small scale farmers choose to sell their produce to other channels
although this may mean receiving lower prices.
In the case of Makueni County, Mwangangi et al. (2012) found that existing farmer groups do
not operate efficiently and only meet when they need to market hence farmers do not have
confidence in them. Farmers in the groups breach contracts when the middlemen offer higher
prices. There is need to evaluate to what extent mango farmers have used the advantage of

18
collective action to access formal channels. This study therefore sought to evaluate, among other
factors, the importance of collective action in choice of market channels among mango farmers
in Makueni County.
2.4 Review of past studies in market channels
A number of studies on choice of market channels have been carried out, revealing institutional,
socio-economic and technical factors influencing marketing channel choice decisions by farmers.
Ferto and Szabo (2002), for instance employed a framework of transaction cost economics in
analyzing the choice of supply channel in Hungarian fruit and vegetable sector. The Multinomial
logit (MNL) model was used to assess the determinants of choice among various supply
channels. The study, however, did not sample randomly as the survey targeted larger, market
oriented farmers. Transaction costs impede small holder poor farmers who due to inability to
afford to pay the cost are not able to participate in the formal channels. The current study
employed a random sampling technique to capture farmers in all categories of wealth. Random
sampling eliminates systematic bias by giving all individuals an equal chance to be chosen.
In Nigeria’s cocoa industry, Ogunleye and Oladeji (2007) identified time of payment, price,
distance from market, transportation cost and grading as the main factors that influenced
farmers’ choice of marketing channel. The study used descriptive statistics to determine the most
patronized channels and factors associated with farmers in those channels. The study, however,
ignored all institutional factors except grading. It is not possible to effectively discuss marketing
in any developing country without recognizing the effect of institutional factors on farmer’s
marketing behavior. To bridge this gap, the current study has taken into consideration
institutional factors such as transaction costs, social capital, collective action, contract farming,
among others, which classical and neo-classical economics will often not address.

19
Martey et al. (2012) found that contrary to most literature, yam farmers in Ghana responded
more to prices than transaction cost. The study however used ownership of a mobile phone as a
proxy for access to market information which may fail to give accurate results. Given the
structure of African markets where buyers withhold information with intention of exploiting
farmers, owning a mobile phone may not necessarily mean that a farmer has access to market
information. The study found that farmers with access to information were more likely to sell to
the rural market which is contrary to expectation, an indication that use of ownership of mobile
phone as proxy for access to information may have been wrong. The current study therefore used
the actual variable, information, as opposed to a proxy. Martey et al. (2002) found that majority
of the farmers preferred the urban market channel because it offered the highest prices. In Kenya,
this may not be the case, because mango markets are located in areas faraway from farms and
majority of farmers lack means of transport and information on the said markets as found by
Msabeni et al. (2010). Although the farmers may be interested in selling to channels offering the
highest prices, their socio-economic and institutional environment may not enable them to
exploit the opportunity. However, farmers who own means of transport may be able to take their
produce to markets as reported by Panda and Sreekumar (2012) among Indian vegetable farmers.
Farmers’ own vehicles allow them to move freely and without relying on others to participate in
formal markets, which are located far off. In Kenya, only the export channel has formal
structures; the exporters collect the produce at the farms hence ownership or otherwise of
transport means may not be a requirement for farmers to participate in formal channels.
A few studies on channel choice have been carried out in Kenya, for instance, Mburu et al.
(2007) on choice of market channels for dairy farmers and Murage and Ilatsia (2010) on use of
breeding services by dairy farmers. The dairy sector in Kenya is fairly organized with many

20
cooperative societies and farmer groups, few large companies, and relatively few brokers. This is
not the case with the horticulture sub-sector which is dominated by brokers. No other study has
been done to determine the factors that affect channel choice by producers in the horticulture
sub-sector, and specifically the mango sub-sector, which is faced with unique challenges; this
literature gap is what this study sought to fill.

21
CHAPTER THREE
METHODOLOGY
This chapter reviews the research methods that were used in collecting and analyzing data from
mango farmers in Makueni County.
3.1 Study area
Makueni County is located in the lower eastern region of Kenya which is mainly semi-arid. The
county has experienced massive planting of new mango trees in the recent past; fruit trees
(mango and citrus), are common in the farms. These are also a main and very important source
of income in the area, with 46 percent of households selling mangoes (Mwangangi et al., 2012).
There is a huge potential for expansion of the mango industry in Makueni because of availability
of land and favorable climate. However, various issues in marketing need to be addressed if this
potential is to be achieved. Despite the high concentration of mango farmers, there is no mango
processing plant in the County nor in any of the neighboring Counties and only one mango
farmers’ cooperative exists (Makueni County Fruit Processors Cooperative Society (MCFPCS).
The county was purposively selected because of its high concentration of mango farmers, and
relatively high poverty levels at 64 percent compared to a national average of half of the
population (Kenya National Bureau of Statistics, 2009). Figure 4 shows a map of Kenya showing
the geographical position of Makueni County.

22
Figure 4: Map of Kenya showing location of Makueni County
Source: Kenya National Bureau of Statistics, 2009

23
3.2 Conceptual framework
The decision of a farmer on choice of market channel by a farmer depends on the socio-
economic, technical and institutional factors the farmer operates in. A schematic diagram of the
framework is presented in figure five.
Figure 5: Conceptual framework
Source: Author conceptualization
As illustrated in Figure 3, the research issue (market channel targeted), is a determinant of the
price a farmer earns and ultimately the income. This is also noted in section 1.2, that the market
channel targeted affects the profit a farmer earns. It is therefore imperative that interventions be
targeted at ensuring that farmers are able to access niche and formal markets to raise incomes.
These interventions need to be targeted at the socio-economic, institutional, and technical
environment within which the farmer operate in.
Institutional aspects in marketing and economic development include transaction costs, market
information flows, grades and standards, market organization, and farmers’ training and
education. There is need for interventions aimed at assisting farmers to come up with new kinds

24
of institutional arrangements such as collective action and contract farming to reduce cost and
improve the bargaining power of farmers. Collective action of farmers, for example, would
reduce transaction cost and increase their bargaining power and ability to meet some of the
stringent conditions of some of the outlets. Technical factors such as training and production
factors like number of trees a farmer has may have some influence on choice of where to sell.
Farmers with fewer trees may not access export market due to lack of economies of scale, but
interventions aimed at encouraging collective action for such farmers may have positive results.
Socio-economic factors such as level of education and income are also hypothesized to influence
choice of market channel. Interventions such as provision of training and credit facilities can
improve access to market for farmers who face challenges of low levels of education and income
respectively. Farmers’ income and the welfare of their households could be improved through
these interventions, by improving access to niche and formal markets.
3.2 Theoretical framework for analysis
This study is based on the random utility model (RUM) which assumes that the decision maker
has perfect discrimination capability. A farmer decides on the marketing channel to be used
based on the option which maximizes their utility, subject to internal and external factors. If the
costs that are associated with using a particular channel are greater than the benefits, households
will be discouraged from using it, shifting to another option that maximizes their utility. The
decision maker has incomplete information and therefore uncertainty has to be taken into
account. The utility is therefore modeled as a random variable in order to reflect the uncertainty.
Following Greene (2003), the utility that individual obtains in associating with alternative is
expressed as;
(1)

25
= deterministic part while is the stochastic part to represent uncertainty.
If the decision maker selects alternative , then it is assumed that is the maximum among
utilities. The statistical model is then driven by the probability that choice is made, which is;
(2)
The Multinomial Logit model was used to relate the decisions to participate in the different
channels and the factors that influence these choices. The Multinomial Logit model is the
standard method for estimating unordered, multi category dependent variables; it allows one to
analyze data where participants are faced with more than two choices (Gujarati, 2005).
The Multinomial Logit model was specified as follows;
(3)
(4)
Where is probability of farmer j choosing alternative i
Market i : 0 = brokers, 1 = exporter, 2 = direct market
iX = vector of household, production and marketing variables
i = the vector of coefficients associated with the market choice
In Multinomial Logit model (MNL), a baseline alternative, corresponding to the status quo also
known as ‘do nothing’ situation is chosen. This is because one of the options must always be in
the respondents’ choice set to be able to interpret the results in standard welfare economic terms
(Hanley et al., 2001). A major condition that has to be satisfied in MNL is the Independence
from Irrelevant Alternatives (IIA). According to Hausman and Mc-Fadden (1984), the IIA
Property requires that the relative probabilities of 2 options being selected are unaffected by the

26
introduction or removal of other alternatives. If IIA is violated, other statistical methods which
relax the assumption are used, they include; Multinomial Probit, Nested Logit (McFadden,
1981), and Random Parameter Logit model [RPL] (Train, 1998).
Gujarati (2009) argues that in cases where the dependent variable is an unordered categorical
variable, as was the case in this study, multinomial logit is most appropriate, subject to not
violating the IIA. The Multinomial logit has been used in many of the studies dealing with
choice, not just in marketing; other case examples include use in choice of animal breeds
(Murage and Ilatsia, 2010), and in determining adoption of various milk marketing channels
(Mburu et al., 2007). According to Cattani et al. (2002), choice models based on the MNL
formulation are standard in marketing science applications and yield optimal pricing policies
which align with observed sales and pricing strategies of firms. This study therefore used
MNL to determine the factors that influence farmer choice of marketing channel in the mango
sub-sector.
3.3 The empirical model
Market channel choice, with three possibilities; brokers, exporters and direct market was used as
the dependent variable. Brokers and exporters buy at the farm-gate while direct market is used in
this study represent farmers who transport their produce to sell to retailers and wholesalers in
towns. The choice ‘brokers’ was used as the baseline group. The specific objectives were
attained through the analysis discussed in the sections below.
3.3.1 Characterization of mango marketing channels used by mango farmers in Makueni
Descriptive statistics was used to exhibit characteristics of the different marketing channels and
to determine any variation in interaction between channels. The main items considered were

27
prices, price discovery mechanisms and sources of market information. The Statistical Package
for Social Sciences (SPSS 20) was used to characterize mango farmers in Makueni County and
the market channels they used to sell mangoes. Sample mean and percentage for various socio-
economic factors was also computed using SPSS. One way Analysis of Variance (ANOVA) was
used to test whether there was any significant difference between the prices offered by the 3
channels. Analysis of variance is a statistical method used to test the differences between two or
more means. The analysis involves carrying out a variance ratio test (F-test) to determine
whether all group means are the same. A non-significant F-test would indicate no meaningful
differences among the means while a significant F-test suggests real differences among the
treatment means, (Armstrong et al., 2000), and therefore rejection of hypothesis one.
3.3.2 Evaluation of factors affecting farmers’ choice of market channel
The Multinomial Logit model was used to quantify the factors influencing marketing channel
choice (brokers, exporters, direct market) by mango farmers in Makueni County. The P values
were tested at 1 percent, 5 percent, and 10 percent significance level. The positive sign of the
coefficient indicates an increase in the likelihood that a farmer will change to the alternative
option while a negative value shows that it is less likely that a farmer will consider the
alternative (Panda and Sreekumar, 2012). Marginal effects were also computed to determine the
exact effect of a change in the independent variable on the dependent variable. Based on the
conceptual framework and on past empirical work on market channel choice, a number of
relevant and suitable independent variables likely to affect the choice of marketing channel were
identified and used in the MNL analysis. Table two shows the list of the explanatory variables
and their expected signs.

28
Table 2: Table of expected explanatory variables
Variables Description
Expected
signs
GROUP_MEMBER Membership to group (yes=1, 0 otherwise) +
OFF_FARM Head or spouse working off-farm (1=yes, 0 otherwise) +
OWN_VEHICLE Ownership of vehicle (yes=1, 0 otherwise) +
HH_INCOME Monthly household income in Kshs. +
YEARS_IN_SCHOOL Years completed in school +
MARKET_INFORMATION access to market information (1=yes, 0 otherwise) +
DISTANCE_TO_TARMAC Distance to the nearest tarmac road in Kms -
TRAINING Access to training (1=yes, 0 otherwise) +
EXTENSION Number of times of contact with extension services in the last 3 years +
EXPERIENCE Number of years growing mangoes +
TOTAL_TREES Number of mango trees in production stage +
By fitting the variables, the model can be presented as
)5...(_`
__
____
____
11
10987
654
3210
TREESTOTAL
EXPERIENCEEXTENSIONTRAININGTARMACTODISTANCE
NINFORMATIOMARKETSCHOOLINYEARSINCOMEHH
VEHICLEOWNFARMOFFMEMBERGROUPchoiceC
Membership of a household to a marketing group increases access to information important to
production and marketing decisions. Collective action of groups also reduces transaction cost
incurred by farmers in searching for markets and increases their bargaining power in setting
prices. If a household belongs to a farmer group, then it is likely the household will shift from
selling to brokers and probably target formal channels such as exporters as found out by Panda

29
and Sreekumar (2012). Large buyers who are exporters tend to prefer buying from farmers in
groups because of economies of scale and ease of enforcing quality standards and contracts.
Household income was expected to have a positive and significant influence on both the direct
and export market channel. Wealthier farmers either own means of transport or are able to pay
for transport to the market. Fafchamps and Hill (2005) found that wealthy coffee farmers in
Uganda with large quantity of coffee for sale were more likely to sell it to a distant market
because they are able to pay for transport.
Number of mango trees that a farmer owns was expected to have a positive and significant
relationship with choice of both direct and export channel. Farmers with large farms produce
more and so are likely to seek outlets/markets outside the farm-gate. In addition, Jari (2009)
observed that small farmers find it difficult to penetrate the ‘formal markets’ due to high
transaction costs, high risks, missing markets, and lack of collective action.
Another variable hypothesized to affect channel choice is ownership of a means of transport.
Availability of own or hired transport is positively related to market participation as found by
Panda and Sreekumar (2012). The positive relationship was also expected in Kenya because the
farmers’ own vehicles will not only minimize time of reaching the marketing center but also the
produce is delivered fresh and undamaged which increases its marketability. The motorbike,
locally known as “boda boda”, is a major means of transport in Kenya; it is however rarely used
to transport mangoes because mangoes are extremely bulky. As a result only vehicles that could
be used to transport mangoes were considered as a means of transport in this study.
Off farm employment reflects off farm income. Income from other sources may enable the
farmer to target channels which do not offer prompt payment especially the exporter channel
(Shiferaw et al., 2012). Shiferaw et al. (2006), finds that cash strapped farmers are not able to

30
wait for delayed payments; they sell to buyers who pay on cash immediately to satisfy the
immediate financial needs. The positive relationship was expected in Kenya because these
farmers are able to purchase inputs and produce higher quality mangoes enabling them to target
formal channels because they are able to meet the stringent conditions set by these channels.
Market information is an important factor when farmers are choosing where to sell, a more
important factor is the source of the information that the farmer gets. Farmers with market
information are expected to make more informed decision; hence the sign for variable
information was expected to be significant and positive. Martey et al. (2012) says that the choice
of a marketing channel depends on the information of the channel available to the participants.
Distance to the nearest tarmac road was expected to have a negative effect on farmer’s choice of
channel; the farther the location of the farmer from tarmac road, the less likely they are expected
to change from the baseline channel. Farmers farther from tarmac are poorly connected in terms
of roads and communication networks; hence they are likely to be less served by formal channels
due to increased transportation and transaction costs. The second hypothesis would be rejected in
a situation where the respective βi estimate is not significant
3.4 Sampling and data collection
The study used both primary and secondary data; secondary data was obtained from government
sources, journals and sessional papers, previous studies and internet sources. Primary data set
was obtained by use of semi-structured questionnaires administered face to face to respondents
randomly selected from the study area. Respondents were the heads of commercial mango
farming households selected in the study area. Interviews were also carried out on farmer group
and cooperative society leaders.

31
Respondents were selected through multistage and systematic sampling techniques. In the first
stage 3 locations (Kilili, Mumbuni and Kilala) were selected purposively from the county. The
locations were selected purposively in order to capture important segments of the target
population and allow data collection in areas where mango farming is prevalent in the county;
there was observed concentration of mango farmers in the locations. Villages were selected
based on two criteria; level of market organization and access to market. The level of market
organization was based on organization of the farmers in to marketing groups while the access to
market was measured by distance to the nearest tarmac road. The criteria were measured as
either high or low. High was if the farmers were organized or close to tarmac road and low if the
farmers were not organized or were far from the tarmac road. Purposive sampling allows
selection of rich information that provides a great deal of insight into the issues of central
importance to the research (Patton 1990).
Respondents, who were commercial mango farmers, were selected through systematic random
sampling. Logistic regressions require larger samples that linear regression. According to
Schwab (2005), the minimum number of cases per independent variable required in logistic
regression is 10; the current study used 20 cases to one. With 11 independent variables, a
minimum 220 cases were required, the study proposed 240 cases to cater for non-response and
incomplete questionnaires. Following Kothari (2004), systematic sampling was used to select the
respondents, the nth farmer (where n =3) was selected along the determined routes with a
random start in each of the villages to give a total of 227 respondents. This was within the
project budget, timeline and market channel choice literature reviewed. The number of farmers
interviewed from each village was based on the estimated total number of mango farmers in the

32
respective village. The selection criteria and number of respondents interviewed from each
village from the three locations is presented in table three.
Table 3: Village selection matrix
High organization and low access No. of respondents Location District
Kathatu 13 Kilili Nzaui
Kilumbu 20 Kilili Nzaui
Kavuliloni 8 Kilili Nzaui
Mulenyu 12 Kilili Nzaui
Itaa 13 Mumbuni Makueni
Low organization and low access No. of respondents Location District
Kilanga 12 Mumbuni Makueni
Kisuu 12 Mumbuni Makueni
Kithiani 18 Mumbuni Makueni
Mboani 15 Kilili Nzaui
Wee 20 Kilili Nzaui
Low organization and high access No. of respondents Location District
Muselele 12 Kilala Kaiti
Itangini 6 Kilala Kaiti
Nduundune 12 Kilala Kaiti
Kaseve 16 Mumbuni Makueni
High organization and high access No. of respondents Location District
Nzueni 16 Mumbuni Makueni
Kyumu 9 Kilala Kaiti
Ngutw'a 13 Mumbuni Makueni
Source: Survey data, 2014
33
CHAPTER FOUR
RESULTS AND DISCUSSION
This chapter presents both descriptive and econometric results of the study. The first section
presents descriptive statistics that addresses the first objective; to characterize the different
market channels available for mango farmers in Makueni County. Hypothesis one; that there is
no difference in the prices offered by the different channels, is also tested in this section. The
second section addresses the second objective; to evaluate the factors affecting farmers’ choice
of market channel. The second hypothesis; that socio-economic, institutional and technical
factors do not affect farmers’ choice of marketing channel, is also tested.
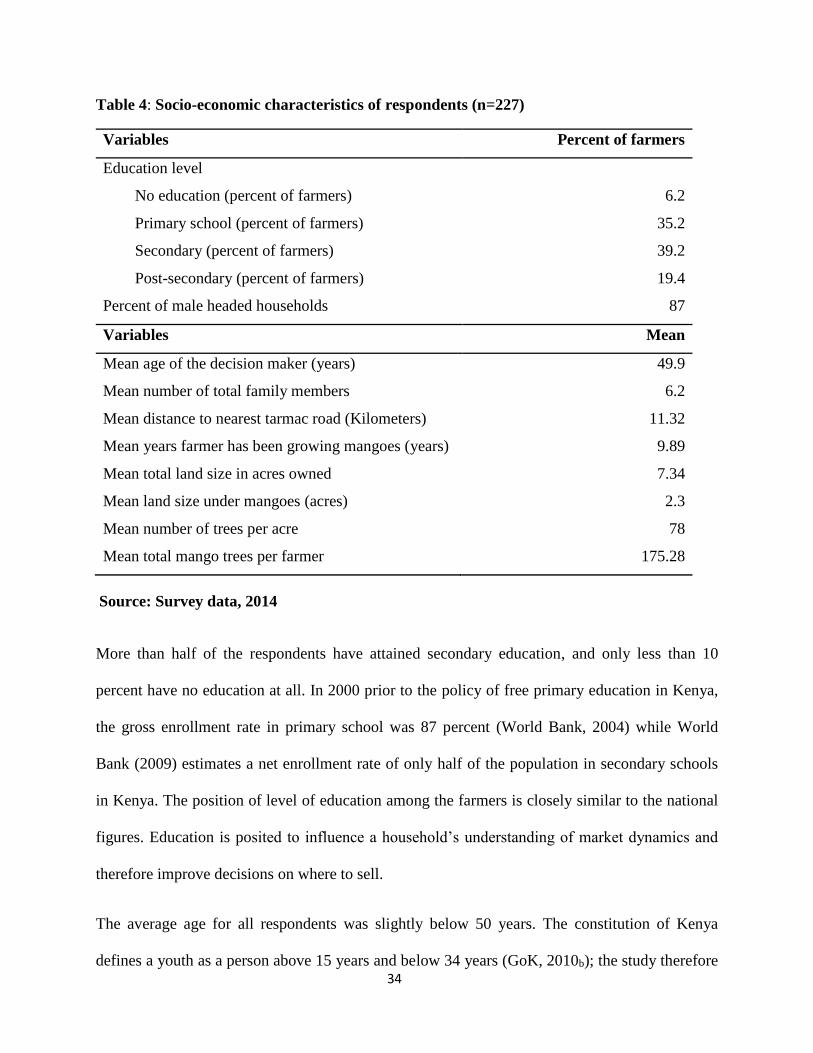
4.1 Characterization of the households and mango marketing channels in Makueni County
Data on the socioeconomic and institutional characteristics of mango farmers analyzed through
descriptive statistics such as means and percentages. Results are presented in Table 4.
34
Table 4: Socio-economic characteristics of respondents (n=227)
Variables Percent of farmers
Education level
No education (percent of farmers) 6.2
Primary school (percent of farmers) 35.2
Secondary (percent of farmers) 39.2
Post-secondary (percent of farmers) 19.4
Percent of male headed households 87
Variables Mean
Mean age of the decision maker (years) 49.9
Mean number of total family members 6.2
Mean distance to nearest tarmac road (Kilometers) 11.32
Mean years farmer has been growing mangoes (years) 9.89
Mean total land size in acres owned 7.34
Mean land size under mangoes (acres) 2.3
Mean number of trees per acre 78
Mean total mango trees per farmer 175.28
Source: Survey data, 2014
More than half of the respondents have attained secondary education, and only less than 10
percent have no education at all. In 2000 prior to the policy of free primary education in Kenya,
the gross enrollment rate in primary school was 87 percent (World Bank, 2004) while World
Bank (2009) estimates a net enrollment rate of only half of the population in secondary schools
in Kenya. The position of level of education among the farmers is closely similar to the national
figures. Education is posited to influence a household’s understanding of market dynamics and
therefore improve decisions on where to sell.
The average age for all respondents was slightly below 50 years. The constitution of Kenya
defines a youth as a person above 15 years and below 34 years (GoK, 2010b); the study therefore

35
finds very few youth engaging in agriculture. According to the Institute of Economic affairs
(IEA, 2010), up to 80 percent of Kenyans are below 34 years old. The current study agrees with
World Bank (2013) report that indicates very low involvement of the youth in agriculture.
Various reasons have been fronted on why agriculture is not attractive to the youth, in the current
study, it could be attributed to lack the requisite resources especially land, to carry out mango
farming.
A large majority of decision makers among mango farmers in the study area are male, at 87
percent. In contrast, KNBS, (2009) found that slightly less than half of the households in
Makueni district are headed by females. ABD (2011) attributes the low number of women in
mango farming to the prevailing socio cultural factors where land and permanent crops are
generally owned by men. The variable ‘gender’ was therefore left out of the econometric
analysis because of the insignificant number of female farmers involved in mango farming.
The average distance in kilometers to the nearest market connected to electricity for all
respondents was slightly less than 5 kilometers. From discussions with farmers, it was
discovered that most of the farmers selling directly to the market targeted towns and cities far
away such as Nairobi, Mombasa and Makindu and so the short distance to nearest center may not
be an important factor. This is probably because during the mango season, most of the market
centers nearby are already fully supplied with mangoes and hence the prices are more or less the
same as at the farm gate. This means distance to tarmac was the more important factor as
compared to distance to market center. The average distance to the nearest tarmac road for all
respondents was more than 10 kilometers. Remote areas far from tarmac roads are sparsely
populated compared to those closer to tarmac road, and so farmers own larger parcels of land as
compared to their counterparts closer to the tarmac road.

36
The average trees per acre were 78, against a recommended rate of 28 trees per acre and 57 trees
per acre for intensive farming (ABD, 2011). This shows that spacing of mango trees in Makueni
was extremely small and this may affect long term productivity of the trees. Table 5 shows a
comparison of recommended spacing against the practice by farmers in Makueni.
Table 5: Mango trees per acre in Makueni
Trees per acre
Makueni
Intensive Recommended
Max Min Average (7m x 10m) (12m x 12m)
188 12 78 57 28
Source: Survey data, 2014
The recommended spacing for ASALs is 12m x 12m due to infertile soils are poor rainfall. The
difference between minimum and maximum trees per acre also provides insight in to mango
farming in Makueni. Some farmers did not follow any specific spacing, rather they would scatter
the trees all over the farm, or as an intercrop with citrus trees. As such, size of land under
mangoes was not included in the econometric model as including it would have yielded wrong
results. Instead, the number of mango trees a farmer had was more accurate in estimating the
production, as opposed to land size.
4.2 Characterization of the different mango marketing channels
Different aspects of the channels in consideration were analyzed to determine any variation in
the way that the different buyers interacted with farmers. More than half of the respondents
mainly sold to brokers while only slightly more than ten percent sold directly to the market as
illustrated in Figure 6.

37
Figure 6: Distribution of farmers that target different channels
Source: Survey data, 2014
Only channels used as the main outlets are presented here, some farmers would sell most of the
mangoes to these main outlets and the remaining few and low quality mangoes, which is a
negligible quantity, to rural retailers or brokers. This was not considered as it only accounted for
a negligible proportion of the total quantity a farmer produced. Such a case was common with
farmers who sold to exporters as their main outlet because of their preference for quality as
mentioned earlier.
4.2.1 Reasons given by farmers for targeting the different channels available
Farmers were probed on the reasons for targeting the channels they sold to. Figure 7 presents a
summary of reasons that farmers stated for targeting the different channels.

38
Figure 7: Reasons for using the different channels
Source: Survey data, 2014
Farmers gave varied reasons for selling to the different channels they targeted; a majority of
farmers who sold to exporters and direct market cited high price as their main motivation when
selecting market outlet. Up to 40 percent of farmers who sold to brokers were served by no other
buyer (channel); this means these farmers were located in areas that were served by very few
buyers. Fafchamps and Hill (2005) attribute this factor to small farms and geographical isolation
of the farmers. In addition, Janvry et al. (1991) noted that the poorer the infrastructure, the less
competitive the marketing systems, the less information available, and the more risky the
transactions. Almost a quarter of respondents said they were forced to sell to brokers because
their mangoes were of low quality and so not fit for especially the export channel. Reasons for
low quality produce ranged from lack of credit to purchase pesticides, lack of expertise/training
and lack of access to extension services, among others.

39
4.2.2 Price trends
Data was collected on gross prices that were paid by the different channels for the years 2011 to
2013; the results are presented in the Figure 8.
Figure 8: Gross price trends for the different channels 2011-2013
Source: Survey data, 2014
As shown in Figure 8, gross prices had been relatively constant within the channels for the
period 2011-2013; direct market had the highest gross prices while brokers paid the lowest. High
prices are however not tantamount to high profitability because of the difference in costs
incurred in targeting the channels. Farmers who sold directly to the market incurred very high
marketing costs in transport and storage. Farmers who sold to brokers incurred the lowest costs
because brokers moved around in the farms in search of mangoes. These farmers incurred very
low costs of searching for buyers, entering contracts, being in groups, transport, and monitoring
as compared to those who sold to exporters and direct market. Gross margins were calculated to
determine net prices paid by the channels, the gross margin results show that gross prices were a
reflection of the average gross margins for farmers selling to the different channels as shown in
figure 9.

40
0
1
2
3
4
5
6
7
Direct Export Broker
Kshs.
Channel targeted
Average gross margin per piece Average cost per piece
Figure 9: Gross margin and cost comparison
Source: Survey data, 2014
4.2.3 Testing for variation in prices: Analysis of variance (ANOVA)
To test whether there was any difference between the net prices paid by the different channels, a
one way ANOVA was carried out on the average net prices for 2013 and the results are
presented in Table 6.
Table 6: One way ANOVA results for average net prices between and within groups
Sum of Squares df Mean Square F P-value.
Between Groups 82.862 33 2.511 16.482 0.000
Within Groups 29.402 193 0.152
Total 112.264 226
Source: Survey data, 2014
With p = 0.000 < 0.05, the test supports the rejection of the null hypothesis that there is no
difference in prices offered by the different channels and conclusion that means for the prices
offered by the different channels are different.

41
4.2.4 Price discovery in different channels
The different channels used various approaches to arrive at prices with the farmers, 4 approaches
were identified;
1. Individual negotiation; this is where there was a negotiation of prices between the farmer
and buyer, but the farmer negotiated as an individual as opposed to a group.
2. Group negotiation; this where there was a negotiation between buyer and a farmer group
as opposed to individual farmer.
3. Buyer decides; this is where the price was decided by the buyer and there was no
negotiation whatsoever.
4. Farmer decides; this is a case where the farmer decided the price with no negotiation with
the buyer.
Results of how prices were arrived at between buyers and farmers are presented in Figure 10.
0
10
20
30
40
50
60
70
80
90
Broker Export Direct market
Percen
t of
farm
ers
Channels
individual negotiation
group negotiation
Buyer decides
Farmer decides
Figure 10: Price discovery methods used in the different channels
Source: Survey data, 2014

42
Brokers mainly bought from individual farmers and not groups; even for farmers in groups,
brokers negotiated with individual farmers and not groups. As such, prices offered by brokers
differed from farmer to farmer whereby even neighboring farmers received different prices from
the same broker. Brokers often refused to sign contracts and were secretive, the price a farmer
would receive from a broker would depend on several factors including; negotiation skills,
bargaining power, among others. Farmers with few mango trees, poor quality and low quantity
have low bargaining power and would accept the price offered by the buyer in fear that he/she
may not get a better price before mangoes start ripening and rotting in the farms.
Exporters mainly negotiated with farmer groups either in group meetings or the groups would
send their representatives to the exporters to negotiate for prices on behalf of the group. As the
picking season progressed, quality would drop with every subsequent pick, and supply also
increased, consequently a renegotiation of price would be done between the exporter and the
group. Unlike the norm in other sectors, it was not a requirement for farmers in mango marketing
groups to sell through the group or to the specific exporter whom the group had negotiated prices
with; this may have been because the existing exporters were few and lacked capacity to serve
the many farmers willing and able to sell to exporters. Being in a group reduces transaction cost
of both the buyer and the farmers hence raising farm gate prices, group also improves the
bargaining power of sellers and thus they are able to obtain a better price. The direct market had
a sizeable proportion of farmers who could decide price which could be attributed to the fact that
these farmers transported their produce to the market where they had a broad choice of buyers.

43
4.3 Institutional factors in mango marketing
Distribution of farmers in relation to collective action, information access, transaction costs,
contracts and access to training is presented in Figure 11 and discussed in the sections that
follow.
Figure 11: Distribution of farmers depending on institutional factors
Source: Survey data, 2014
4.3.1 Market information
Access to market information is important in that it reduces risk and uncertainty in markets and
allows optimal allocation of resources by producers. More important is the source of the
information; majority of rural small scale farmers are poor and therefore have no means to obtain
information, they rely on the buyer as their source of information and this opens opportunities for
exploitation by buyers. Contrary to the assumption of neo-classical economics that information is

44
perfect and free, Kirsten et al. (2008) argue that information is costly and thus farmers incur cost
in looking for market information. Figure 12 shows the different sources of market information
used by mango farmers in Makueni County.
Figure 12: Sources of market information
Source: Survey data, 2014
From Figure 12, the study established 6 sources of information for mango farmers; government
extension officers, buyer, fellow farmers, group, visiting market, and radio. The buyer, fellow
farmer, and visiting market were the most actively used sources. These results partly agree with
Mangisoni (2006) who found that majority of farmers rely friends, relatives and agricultural
extension agents for market information. As such, the accuracy of such information is doubtful.
Of interest here is that approximately half of respondents depended on the buyer as their source
of market information. This category of farmers incurred minimum or no costs in looking for
information; they waited for the buyer in the farms when produce was ready. However, as noted
by Mangisoni (2006), farmers are more likely to accept low prices if the buyer informs them that

45
their product is of low quality. Slightly less than a quarter of the farmers obtained market
information from farmer groups. Some of the groups normally sent their representatives to the
buyers in Nairobi to negotiate prices on their behalf; the price reached was then communicated to
group members in their meetings. This kind of negotiations enhances trust between the buyer and
farmers.
Only a very small proportion (5 percent) of farmers obtained information from the market, this is
the only group that can be said to have accurate information. Majority of these farmers were
most likely selling to direct market. A major reason was that most of the households selling to
direct market had at least one member of the family working off-farm in major towns. Similar
information was provided by the chairman of Makueni County Fruit Processors Cooperative
Society (MCFPCS); “farmers do not know that when there is a mango glut in the county, there is
scarcity elsewhere”.
4.3.2 Membership to Collective action group, contract, access to training and extension
services and access to credit
More than half of the farmers were not members of any mango marketing groups. This shows a
very disadvantaged situation of the farmers considering the importance of collective action in
marketing by increasing farmers bargaining power, reducing transaction costs and improving
information flows. Such benefits of collective action have been outlined by several institutional
economics authors such as Fafchamps and Hill, 2005; Shiferaw et al., 2006 and Kirsten et al.,
2008. There is only one mango cooperative society in Makueni County, the Makueni County
Fruit Processors cooperative Society (MCFPCS). MCFPCS had been able to improve market
access for its members by exporting mangoes mostly to Dubai and selling the low quality to
processors in the country. MCFPCS however faces financial challenges due to the complex

46
logistic issues involved in exporting. Cost of transport, cooling, and storage at the port of
Mombasa were some of the costs that were cited as impediment to export by MCFPCS.
Furthermore, MCFPCS was out of reach for many poor farmers due to the high financial
commitment required as membership fee to join the cooperative. The small farmer groups lacked
financial ability to carry out cold storage so as to slow ripening and minimize post-harvest losses,
or carry out any other form of value addition. The county government was in the process of
setting up a fruit processing plant in the county to process excess mangoes and compete with the
other buyers, which would raise prices at peak season.
In Makueni a non-governmental organization (Agricultural Business Development) funded by
the Government of Netherlands had supported mango farmer groups by training service
providers to serve the groups. Service providers were members of the different groups who had
been trained on mango farm management; they worked as group extension officers by making
visits to farms on call. As noted by Fischer and Qaim (2012), farmer organizations have the
potential to take over responsibilities for accessing agricultural extension, input provision and
distribution, bulking, grading, selling, and even processing. Some of the services that farmers
mentioned that they accessed through groups include extension services, training, credit
facilities, market, and market information. Only about a quarter of the respondents had pre-
agreed contracts with buyers, majority of whom sold to the export channel. Most of the contracts
were agreed between groups and main buyer as opposed to individual farmers. Having a contract
was however more of a consequence of the channel selected rather than a determining factor.
Majority of farmers interviewed (64 percent) had received training in various areas of mango
farm management comprising grafting, pruning, pest and disease control, marketing, post-harvest
management and record keeping. Only about a quarter of farmers interviewed had been able to

47
access credit; among the different channels. Key reasons that respondents mentioned for failure
to access credit was information on the sources and availability of credit and fear of risk.
Similarly, Kloeppinger-Todd and Sharma (2010) note that most rural households lack access to
reliable and affordable finance for agriculture and other livelihood activities as they live in
remote areas where retail banking is limited and production risks are high.
4.3.3 Transaction costs
Respondents were asked whether they incurred any of these costs during marketing; negotiation
costs (includes cost of travel to buyer location), cost of searching for buyers, and cost when
signing contracts with buyers. Other transaction costs considered are cost of interest on any
credit they borrowed to facilitate marketing, cost of communication (includes airtime), cost of
monitoring pickers (and sometimes bribing them) and ensuring buyer keeps agreement, and cost
of being a member of a marketing group. Distribution of farmers in relation to the types of
transaction costs they incurred is presented in Figure 13.
Figure 13: Transaction costs incurred by farmers
Source: Survey data, 2014

48
Communication and search costs were due to farmers calling their colleagues to enquire about
prices and buyers. Farmers in groups paid the cost of travel to Nairobi and accommodation for
their leaders as they searched for buyers and negotiated prices. Those selling directly to the
market incurred very high transaction costs because they actively looked for buyers in the major
towns. These farmers either physically visited the markets or called through mobile phones
before transporting the produce to the market. Most of the farmers selling to brokers did not
incur any costs as they waited for the buyers in the farm, price negotiation was also done in the
farm after which the buyer would be allowed to pick the mangoes and pay on cash. Brokers
incurred very high transaction costs as they dealt with individual farmers and had to move from
farm to farm in search of mangoes, this partly explains why they offered the lowest prices.
4.4 Results for determinants of mango farmers’ choice of market channel
Before carrying out the multinomial logit regression, diagnostics tests for multicollinearity,
goodness of fit and IIA were carried out. Respective relevant tests were carried out to obtain the
best transformation for the various continuous variables. Results for the tests are presented in the
sections below;
4.4.1 Test for multicollinearity
Variance Inflation Factor (VIF) is used to test for presence of multicollinearity by estimating
‘artificial’ ordinary least squares (OLS) regressions with each of the farm characteristics as the
‘dependent’ variable and the rest as independent variables. All the variables selected for
regression had VIF below 2. Following Maddala (2000), variables that had VIF<5 were
considered to have no multicollinearity. Further results are presented in appendix I.

49
4.4.2 Assessing goodness of fit for the multinomial logit model
The MNL model gives a McFadden’s R2 (Pseudo R2) of 0.4351, a likelihood ratio test (lrtest)
gave a χ2 value of 60.08 and P value of 0.000, which means the model fits the data well. More
results are presented in the appendix II.
4.4.3 Test for Independence from Irrelevant Alternatives (IIA)
The Haussman test was carried out to determine IIA. All choices gave a P-value of 1, and
therefore no reason was found to conclude that the MNL model in this application was miss-
specified, hence the IIA was not violated. Results are presented in appendix III.
4.4.4 Determinants of mango farmers’ choice of marketing channels
Parameter estimates (coefficients and marginal effects) from the multinomial logit model are
presented in Tables 7 and 8 respectively. The parameter estimates of the multinomial logit
provide direction and not probability or magnitude of change. The marginal effects measure the
actual effect of a unit change in each of the explanatory variables on farmers’ choice of market
channel.

50
Table 7: MNL parameter estimates for determinants of choice of market channel (Broker
used as base outcome)
Export Direct market
Variable Coef
Std
error p>|z| Coef
Std
error p>|z|
YEARS_IN_SCHOOL -0.066 0.065 0.303
0.060 0.087 0.49
OFF_FARM 0.810 0.510 0.112
1.083 0.656 0.09*
HH_INCOME 0.458 0.217 0.035**
0.698 0.277 0.01**
DISTANCE_TO_TARMAC 0.461 0.214 0.031**
-0.395 0.243 0.10*
TOTAL_TREES 0.924 0.318 0.004***
-0.456 0.398 0.25
GROUP_MEMBER 0.984 0.459 0.032**
-0.208 0.573 0.71
MARKET_INFORMATION 0.013 0.466 0.977
1.837 0.574 0.00***
TRAINING 0.279 0.110 0.012**
-0.064 0.161 0.69
EXTENSION 0.681 0.223 0.002***
0.039 0.269 0.88
OWN_VEHICLE -0.198 0.646 0.760
1.446 0.659 0.02**
EXPERIENCE 0.121 0.052 0.021**
0.061 0.070 0.38
Cons -11.363 1.945 0.000 -3.128 1.916 0.10
n = 227
LR Chi2 (22) = 185.00 Prob > chi2 = 0.000
Pseudo R2 = 0.4351
Log likelihood = -120.085
***, **, * significance levels at 1, 5 and 10 percent respectively
Source: Survey data, 2014
As mentioned earlier, coefficients from multinomial logit can be difficult to interpret because
they are relative to the base outcome; a better way to evaluate the effect of covariates is to
examine the marginal effect of changing their values on the probability of observing an outcome.
Table 8 shows the marginal effects computed.

51
Table 8: Marginal effects of the MNL regression model for mango farmers’ choice of
market channels
Export Direct market
Variable dy/dx
Std
error p>|z| dy/dx
Std
error p>|z|
YEARS_IN_SCHOOL -0.012 0.011 0.262
0.006 0.005 0.38
OFF_FARM 0.119 0.085 0.166
0.059 0.046 0.19
HH_INCOME 0.066 0.036 0.002**
0.038 0.019 0.05**
DISTANCE_TO_TARMAC 0.082 0.035 0.018**
-0.031 0.015 0.03**
TOTAL_TREES 0.159 0.052 0.002***
0.042 0.024 0.08*
GROUP_MEMBER 0.169 0.761 0.026**
0.027 0.347 0.43
MARKET_INFORMATION 0.029 0.072 0.686
0.140 0.053 0.00***
TRAINING 0.047 0.018 0.009***
-0.008 0.010 0.41
EXTENSION 0.113 0.036 0.002***
-0.012 0.167 0.47
OWN_VEHICLE 0.060 0.085 0.481
0.146 0.089 0.09*
EXPERIENCE 0.019 0.009 0.026**
0.002 0.004 0.61
***, **, * significance levels at 1, 5 and 10 percent respectively
Dy/dx is for discrete change of dummy variable from 0 to 1
Source: Survey data, 2014
Household income (HH_INCOME) is significantly associated with a higher probability of
choosing export and direct market as compared to brokers. The probability of choosing export
and direct market relative to brokers increases by 6 percent and 4 percent respectively for every
unit increase in the household income. Similarly, Fafchamps and Hill (2005) found that wealthy
farmers were less likely to sell directly to the market, possibly because the shadow value of their
time is higher. But if they have a large quantity for sale, they are more likely to sell it to the
market. They are also more likely to travel to a distant market. Wealthy farmers are more likely
to afford farm inputs which would enable them attain required quality for export market;
alternatively they are able to afford transport to sell their produce in distant markets where prices
are high.

52
Contrary to the apriori expectations, distance away from tarmac (DISTANCE_TO_TARMAC)
is positively associated with a higher likelihood of farmers selling to export market relative to
brokers. This may be because farmers farther from the tarmac road were more likely to have
large farms which exporters prefer because of economies of scale. Another reason may be what
Martey et al. (2012) found among Nigeria’s yam farmers; that farmers farther from the tarmac
roads were more likely to participate in marketing cooperatives, which exporters prefer to deal
with as opposed to dealing with individual farmers. A Pearson correlation test proved that there
was a significant positive relationship between distance to tarmac road and membership to
mango marketing group. Jari (2009) found closely similar results in South Africa; that farmers
with good road infrastructure participated more in informal markets and not formal markets.
However, farmers close to the tarmac road were more likely to sell to direct market relative to
brokers as expected apriori. This is because they are able to access the urban areas easily and at
lower cost than their counterparts farther from the tarmac.
Farmers with a large number of mango trees were more likely to sell to export market relative to
brokers. As noted by Martey et al. (2012), farmers who produce more prefer selling at their
immediate market (rural market) to avoid post-harvest loss. This is especially if the product in
question is highly perishable, as is the case with mangoes. In addition, Shilpi and Umali-
Deininger (2008) explain that farmers incur very high transaction cost selling to the market as
compared to traders if the physical market infrastructure is poor. Poor market infrastructure
results in long waiting periods which will affect farmers more negatively than traders who may
have better access to facilities even in congested markets, thus farmers with large quantities may
be discouraged to sell directly in the market. They will sell at the farm gate but are more likely to
sell to exporters at the farm gate relative to brokers. Results on direct market agree with the

53
above argument, farmers with a few number of mango trees were more likely to sell to direct
market. Apart from being a perishable product, mangoes are fairly seasonal, buyers preferred
unripe mangoes to avoid losses hence those with large quantities avoided transporting to the
market because of their low capacity to sell at the market which is not organized as compared to
the farm-gate buyers.
Membership to a mango marketing group (GROUP_MEMBER) is associated with increased
likelihood of a farmer selling to the export channel relative to the broker channel. Being a
member of a marketing group increased the probability of a farmer selling to export market
relative to brokers by up to 17 percent. The importance of collective action has been emphasized
by most institutional economics authors; Janvry et al. (1991); Kirsten et al. (2008); Elizabeth and
Martin (2012), among others. Farmers in groups have the advantage of bulking hence gaining
economies of scale. It is also easier and cheaper for exporters to enforce quality and grade
requirements of the export market through reaching farmers in groups rather than individually.
Membership to marketing group is, however, not significant for direct market channel; it is
important to note here that farmers selling to the market do not bulk their produce to reduce cost.
A similar result was found by Fafchamps and Hill (2005), which the study attributed to lack of
trust among the farmers and especially in a climate of changing market prices. “The benefit from
pooling sales may thus be outweighed by the cost of peer monitoring”, the study notes. In
addition to the trust theory, the current study noted that farmers selling to the market were wide
apart and so collective action may be hampered by the geographical separation.
Access to market information (MARKET_INFORMATION) is significantly associated with
farmers selling to direct market channel relative to broker. Access to information increases the
probability of a farmer selling to the direct market relative to brokers by 14 percent. From

54
discussions with farmers, lack of information was reported as one of the main challenges to
access to direct market, which makes it very risky for farmers to try and access this channel. An
important aspect of information is its source; farmers who receive information from buyers at the
farm-gate would not be classified as having access to information because the legitimacy of this
information cannot be guaranteed. A significant proportion of farmers in the study area were
found not to actively search for market information, they waited for the buyer at the farm-gate
and ‘had no choice’ but to accept what the buyer told them, including the price.
Having access to training (TRAINING) is significantly associated with higher probability of
selling to the export channel relative to brokers. As explained earlier, the export channel only
buys grade 1 mangoes of high quality. Only farmers who had gone through training were able to
attain these quality requirements. Similarly increased contact with extension services
(EXTENSION) increased farmer’s likelihood of selling to the export channel relative to the
broker channel; the probability of selling to the export channel increased by 11 percent for every
extra contact with extension personnel. The results from the two variables may be attributed to
their ability to produce quality mangoes free from pests and diseases.
Ownership of a vehicle (OWN_VEHICLE) is significantly associated with a higher probability
of selling to the direct market relative to brokers by up to 15 percent. As registered from
discussions with farmers, lack of transport means to the market and information were the main
challenges to selling directly to the market. Hiring transport means was too expensive and risky
for most of the farmers considering that they had no information on the market. Further, as
explained by Panda and Sreekumar (2012), farmers’ own vehicles allow them to access
marketing centers located far off at a lower cost and within a shorter period as compared to their
colleagues who had no transport means.

55
Number of years that a farmer had been growing mangoes (EXPERIENCE) is significantly
associated with selling to the export channel relative to brokers. The probability of the farmer to
choose export market relative to broker increases by 2 percent for every additional year of
experience of the farmer. Farmers who had been growing mangoes for a long period had
developed networks with fellow farmers and exporters, experience in growing mangoes also
shows that farmers had gained expertise overtime and were able to meet the quality requirements
of exporters.

56
CHAPTER FIVE
SUMMARY, CONCLUSION AND POLICY RECOMMENDATIONS
5.1 Summary
Mango farming has the potential to improve the income of farmers in ASAL areas such as
Makueni County due to its adaptability to the climate and soil in such areas. Marketing is
however not organized and thus farmers incur heavy losses .The study used the MNL model to
analyze determinants of mango farmer’s choice of market channel in Makueni, Kenya. Specific
objectives of the study were; to characterize the different market channels available for mango
farmers, and to determine the factors that influence farmer choice of market channel.
Results revealed three major channels in the mango sub-sector; brokers, export, and direct
market; majority of farmers sell to brokers while direct market account for the smallest
percentage of farmers. The channels exhibit varying characteristics in terms of prices and
interaction with farmers; brokers offer the lowest prices while farmers selling to direct market
earn the highest prices. Other varying characteristics include price determination mechanisms
where whereas those selling to export use farmer groups to negotiate prices, majority of those
selling to brokers negotiate individually and in most cases the buyer single handedly determines
the price.
The study found that several factors influenced farmer choice of supply channels, they include;
distance to the nearest tarmac road, household income, number of mango trees that farmer has,
access to market information, contact with agricultural extension personnel, access to training,

57
membership to mango marketing group, time period that farmer has been involved in mango
farming, and ownership of a means of transport.
5.2 Conclusion and policy recommendations
The findings of this study suggest that institutional factors are central in determining farmers’
access to niche high value markets such as export and direct market. Initiatives aimed at ensuring
access to market information by farmers would reduce the risk associated with direct market.
There are private market information providers Kenya Agricultural Commodity Exchange
(KACE), but the coverage and impact has been low. The government can partner with these
privately owned initiatives to increase especially their financial ability in disseminating
information, considering that there may not be any financial benefit to the private entity doing
so. In addition to providing market information, facilitating farmers to acquire transport means
would assist in reducing reliance on brokers and middlemen. Majority of farmers seem to prefer
price regulation by the county government to reduce exploitation by middlemen. Though this is
technically not feasible, the county government could perhaps regulate the activities of the
middlemen to eliminate exploitation.
In addition, efforts by NGOs, the cooperatives directorate, and county government aimed at
increasing farmers’ participation in PMGs should be intensified. Further, building capacity in
farmers already in groups and the group leadership would help them avoid the pitfalls that befall
several groups that disintegrate a few months into operation. PMGs should be assisted to
diversify their activities from just marketing, this would increase benefits farmers get from the
groups and encourage participation. Assisting PMGs build financial capital would help them add
value to their produce, and probably install cold storage to slow ripening and reduce post-harvest
losses. Furthermore, higher levels of social capital such as cooperative societies can assist
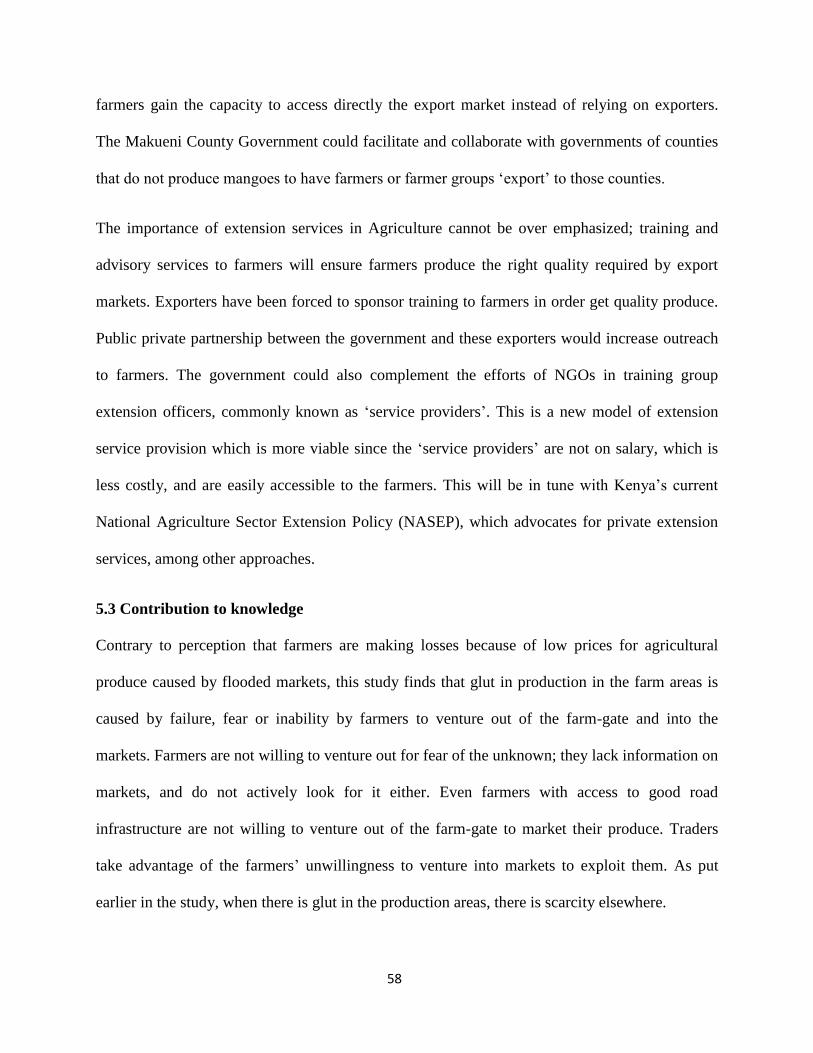
58
farmers gain the capacity to access directly the export market instead of relying on exporters.
The Makueni County Government could facilitate and collaborate with governments of counties
that do not produce mangoes to have farmers or farmer groups ‘export’ to those counties.
The importance of extension services in Agriculture cannot be over emphasized; training and
advisory services to farmers will ensure farmers produce the right quality required by export
markets. Exporters have been forced to sponsor training to farmers in order get quality produce.
Public private partnership between the government and these exporters would increase outreach
to farmers. The government could also complement the efforts of NGOs in training group
extension officers, commonly known as ‘service providers’. This is a new model of extension
service provision which is more viable since the ‘service providers’ are not on salary, which is
less costly, and are easily accessible to the farmers. This will be in tune with Kenya’s current
National Agriculture Sector Extension Policy (NASEP), which advocates for private extension
services, among other approaches.
5.3 Contribution to knowledge
Contrary to perception that farmers are making losses because of low prices for agricultural
produce caused by flooded markets, this study finds that glut in production in the farm areas is
caused by failure, fear or inability by farmers to venture out of the farm-gate and into the
markets. Farmers are not willing to venture out for fear of the unknown; they lack information on
markets, and do not actively look for it either. Even farmers with access to good road
infrastructure are not willing to venture out of the farm-gate to market their produce. Traders
take advantage of the farmers’ unwillingness to venture into markets to exploit them. As put
earlier in the study, when there is glut in the production areas, there is scarcity elsewhere.

59
The study also reinforces the importance of institutional economics in understanding how
agricultural product markets operate in developing countries. Results show that assumptions of
perfect markets by classical and neo-classical economics are not applicable in most agricultural
markets in developing countries. Information is not perfect and there is no trust between buyers
and sellers hence market forces of supply and demand are not used to determine prices. Rather,
the price that a farmer gets is determined by majorly institutional factors such as collective
action, transaction costs and information access.
5.4 Suggestions for further research
There is need for future studies to focus on both the buyer and seller side, this study focused
more on the producer and discussions are based on the perspective of the producer. Further
research on the opportunities and constraints faced by buyers will help in coming up with broad
based all-inclusive policy and/or practice interventions.

60
References
Agricultural Business Development (ABD). (2011). The Mango Sector in Eastern Kenya: Eastern
Region Mango Census and Baseline Survey. 2011. Draft Report validated at a
stakeholders’ forum in February, 2011 in Nairobi, Kenya.
Armstrong R. A., Slade, S. V. and Eperjesi, F. (2000). An introduction to analysis of variance
(ANOVA) with special reference to clinical experiments in optometry. Elsevier Science
Ltd Ophthal Physiol Opt 20: 235-241. www.elsevier.com/locate/ophopt, accessed May
2014.
Ben-Akiva, M.E. (1973). Structure of Passenger Travel Demand Models: PhD thesis,
Department of Civil Engineering MIT Cambridge.
CSTI. (2009). Increasing Community Resilience to Drought in Makueni District: the Sakai
Community’s Experience, Kenya. Arid Lands Resource Management Project Report.
Centre for Science and Technology Innovation (CSTI), Nairobi, Kenya.
Cattani, K., Dahan, E., and Schmidt, G. (2002). “Spackling: Smoothing Make-to-order
Production of Custom Products with Make-to-stock Production of Standard Items.”
Anderson Graduate School of Marketing, University of California, Los Angeles,
Marketing Paper 384, October 2002.
Elisabeth F. and Matin Q. (2012). Linking Smallholders to Markets: Determinants and Impacts
of Farmer Collective Action in Kenya. World Development Vol. 40, No. 6, pp. 1255–
1268, 2012; Available online www.elsevier.com/locate/worlddev, accessed May 2014.
Fafchamps, M. and Hill, R. (2005). Selling at the Farm-gate or Traveling to Market. American
Journal of Agricultural Economics 87(3) (August 2005): 717–734.
Fischer, E. and Qaim, M. (2012). Linking Smallholders to Markets: Determinants and Impacts of
Farmer Collective Action in Kenya. World Development Vol. 40, No. 6, pp. 1255–1268.
FAO. (2003). Food and Agriculture Organization. Value Chain Analysis: A Case Study of
Mangoes in Kenya. Available online at www.responsibleagroinvestment.org/, last
accessed Feb 2014.
FAO. (2014). Food and Agriculture Organization. Smallholder Participation in the Tropical
Super-fruits Value Chain: Ensuring Equitable Share of the Success to Enhance their
Livelihood. Report presented by the Secretariat at the International Symposium on Super-
fruits: Myth or Truth? Ho Chi Minh City, Viet Nam, 1- 3 July 2013.
Ferto, I. and Szabó, G. (2002). The Choice of Supply Channels for Hungarian Fruit and
Vegetable Sector. Economics of contracts in agriculture: second annual workshop.
Annapolis, Maryland July, 2002. Department of Agricultural and Resource Economics at
the University of Maryland

61
Frank, S. D. & Henderson, D. R. (1992). Transaction costs as determinants of vertical
coordination in the US food industries. American Journal of Agricultural Economics,
74(4): 941-950.
Greene, W. H. (2003). Econometric Analysis, (5th ed); Englewood Cliffs, N. J: Prentice Hall,
Government of Kenya [GoK]. (2007). Government of Kenya; Vision 2030 Document.
Government Printer, Nairobi, Kenya
Government of Kenya (GoK). (2010a). Government of Kenya; Agricultural Sector Development
Strategy 2010–2020. Government Printer, Nairobi, Kenya
Government of Kenya (GoK). (2010b). Government of Kenya: The Constitution of Kenya.
Revised Edition 2010 Published by the National Council for Law Reporting, Nairobi.
Gujarati, D. (2005). Basic econometrics, (4th edition); New Delhi, India: Tata McGraw-Hill.
Hanley, N., Mourato, S., and Wright, R. (2001). Choice Modeling Approaches, a Superior
Alternative for Environmental Modeling? Journal of Economic Surveys; Vol 15, No. 3
Hausman, J., and Mc-Fadden, D. (1984). Specification tests for Multinomial Logit Model.
Econometrica, 52, 1219-1240.
HCDA. (2010). Horticultural Crops Production Report 2010, available at www.hcda.or.ke/, last
accessed 18th Feb 2014. Horticultural Crops Development Authority (HCDA), Nairobi,
Kenya.
Kloeppinger-Todd, R. and Sharma, M. (2010). Innovations in Rural and Agriculture Finance.
2020 Vision for Food, Agriculture, and the Environment, FOCUS 18. International Food
Policy Research Institute (IFPRI), Washington, USA.
IEA. (2010). Youth Fact Book: Infinite Possibility or Definite Disaster? Institute of Economic
Affairs (IEA), Nairobi, Kenya.
Janvry, A., Fafchamps, M., and Sadoulet E. (1991). “Peasant Household Behavior with Missing
Markets: Some Paradoxes Explained.” Economic Journal 101(1991):1400–17.
Jari, B. (2009). Institutional and technical factors influencing agricultural marketing channel
choices amongst smallholder and emerging farmers in the Kat River Valley (Master’s
thesis, University of Fort Hare, Alice, South Africa)
Jayne, T.S., Govereh, J., Mwavumo, A., Nyoro, J.K., and Chapoto, A. (2002). False promise or
false premise? The experience of food and input market reform in Eastern and Southern
Africa. World Development 30(11): 1967-1985.
KNBS. (2009). Makueni District Multiple Indicator Cluster Survey 2008: Kenya National
Bureau of Statistics (KNBS), Nairobi, Kenya.

62
Kherallah, M. and Minot, N. (2001). Impact of Agricultural Market Reforms on Smallholder
Farmers in Benin and Malawi. IFPRI Collaborative Research Project. International Food
Policy Research Institute (IFPRI), Washington DC.
Kiriti, T. and Tisdell, C. (2003). Gender Inequality, Poverty and Human Development in Kenya:
Main Indicators, Trends and Limitations. Social Economics, Policy and Development,
Working paper No. 35.
Kirsten, J., Doward, A., Poulton, C., and Vink, N. (2008). Institutional Economics, Perspectives
on African Agricultural Development. Published by International Food Policy Research
Institute; 2033 K Street, NW Washington, D.C. 20006-1002, U.S.A.
Kothari, C.R. (2004). Research Methodology; Methods and Techniques (2nd edition): New Delhi,
India; New Age International Publishers.
Maddala, G. S. (2000). Introduction to Econometrics (3rd edition). New Jersey: Prentice-Hall
Inc.
Mangisoni, J. (2006). Markets, Institutions and Agricultural Performance in Africa. ATPS
special paper series No. 27, the African Technology Policy Studies (ATPS) Network,
Nairobi.
Matin, M.A., Baset, M.A., Alam, Q.M., Karim, M.R., and Hasan, M.R., (2008). Mango
Marketing System in Selected Areas of Bangladesh. Bangladesh, Journal of Agricultural
Research. 33(3): 427-438.
Martey, E., Annin, K., Nimo, A.W., Attoh, C., (2012). Does Access to Market Information
Determine the Choice of Marketing Channel among Smallholder Yam Farmers in the
Brong Ahafo Region of Ghana? A Multinomial Logit Regression Analysis, Journal of
Economics and Sustainable Development Vol.3, No.12, 2012.
Mburu, L.M., Wakhungu, J.W.,and Gitu, K.M. (2007). “Determinants of smallholder dairy
farmers' adoption of various milk marketing channels in Kenya highlands”, Livestock
Research for Rural Development 19 (9) 2007, Nairobi, Kenya.
McFadden, D. (1981). Economic models of probabilistic choice. Cambridge: MIT press.
Msabeni A., Masinde G., Matoke S., and Gathaara V., (2010). Sweetening the Mango,
Strengthening the Value Chain, an Analysis of the Organizational Linkages along and
Within the Mango Value Chain in Mbeere District, Eastern Province, Kenya.
International Centre for development oriented Research in Agriculture (ICRA) Working
Document 136 Kenya – 2010.
Muendo, K.M., and Tschirley, D. (2004). Improving Kenya's Domestic Horticultural Production
and Marketing System: Current Competitiveness, Forces of Change, and Challenges for
the Future. Tegemeo Institute of Agricultural Policy and Development; Working Paper
No. 08A/2004.

63
Murage, A.W., Ilatsia, E. (2010). Factors that determine use of breeding services by smallholder
dairy farmers in Central Kenya. Tropical Animal Health and Production, 43:199-207.
Mwangangi, M., Mutie, M., and Mango J. (2012). Summary of Baseline Household Survey
Results: Makueni, Kenya. CGIAR Research Program on Climate Change: Agriculture
and Food Security (CCAFS), Copenhagen, Denmark. Available online at:
www.ccafs.cgiar.org. Accessed May 2014.
Neven, D., Odera, M.M., Reardon, T., and Wang, H. (2009). Kenyan Supermarkets, Emerging
Middle-Class Horticultural Farmers, and Employment Impacts on the Rural Poor. World
Development 37(11):1802-1811.
North, D.C. (1990). Institutions, Institutional Change and Economic Performance. Cambridge:
Cambridge University Press.
Ogunleye, K., and Oladeji, J. (2007). Choice of Cocoa Market Channels among Cocoa Farmers
in ILA Local Government Area of Osun State, Nigeria. Middle-East Journal of Scientific
Research 2 (1): 14-20, 2007.
Panda, R. and Sreekumar. (2012). Marketing Channel Choice and Marketing Efficiency
Assessment in Agribusiness, Journal of International Food & Agribusiness Marketing,
24:3, 213-230, DOI: 10.1080/08974438.2012.691812.
Park, T., and Lohr, L. (2006). "Choices of Marketing Outlets by Organic Producers: Accounting
for Selectivity Effects," Journal of Agricultural & Food Industrial Organization: Vol. 4:
Issue 1, Article 4.
Patton, M.Q. (1990). Qualitative evaluation and research methods. Beverly Hills, Sage
publications California. U.S.A.
Poulton, C. (2014). Collective Action among African Smallholders: Trends and Lessons for
Future Development Strategies. Thematic Research Note 05 • March 2014. International
Food Policy Research Institute (IFPRI), Washington DC.
Sandler, T. (1992). Collective action: Theory and applications. University of Michigan Press,
Ann Arbor, MI. USA
Schwab, J. A. (2002). Multinomial logistic regression: Basic relationships and complete
problems. http://www.utexas.edu/courses/schwab/sw388r7/SolvingProblems/. Last
accessed March, 2015
Shiferaw, B., Obare, G., and Muricho, G. (2006). Rural institutions and producer organizations
in imperfect markets: Experiences from Producer Marketing Groups in semi-arid eastern
Kenya; ICRISAT Socioeconomics and Policy Working Paper Series No. 23, International
Crops Research Institute for the Semi-Arid Tropics
Shilpi, F. and Umali-Deininger, D. (2008). Market facilities and agricultural marketing: evidence
from Tamil Nadu, India. Agricultural Economics 39 (2008) 281–294.

64
The New Partnership for Africa’s Development (NEPAD). (2003). The Four Pillars of CAADP,
available at http://www.nepad.org/system/files/caadp.pdf. Last accessed May 2014.
Train, K. E. (1998). Recreation Demand Models with Taste Differences across People. Land
Economics, 74, 2, 230-239.
Tsourgiannisa, L., Eddison, J., and Warrena, M. (2008). Factors affecting the marketing channel
choice of sheep and goat farmers in the region of east Macedonia in Greece regarding the
distribution of their milk production. Small Ruminant Research 79 (2008) 87–97.
Wollni, M., and Zeller, M. (2006). Do farmers benefit from participating in specialty markets
and cooperatives? The case of coffee marketing in Costa Rica. Contributed paper
prepared for presentation at the International Association of Agricultural Economists
Conference, Gold Coast, Australia. August 12-18.
World Bank. (2004). “Strengthening the Foundation of Education and Training in Kenya:
Opportunities and Challenges in Primary and General Secondary Education”, Report
No.28064-KE.
World Bank. (2006). Agriculture and Achieving the Millennium Development Goals. Agriculture
& Rural Development Department1818 H Street, N.W. Washington, D.C. 20433,
http://www.worldbank.org/rural. Report No. 32729-GLB.
World Bank. (2009). EdStats Database 2009. Available on http://go.worldbank.org/. Last
accessed June 2014.
World Bank. (2013). Agriculture as a Sector of Opportunity for Young People in Africa.
Agriculture and Environmental Services Department, Policy Research Working Paper
6473.
Zanello, G. Shankar, B. and Srinivasan C. S. (2001). Transaction Costs, Information
Technologies, and the Choice of Marketplace amongst Farmers in Northern Ghana.
Contributed paper prepared for presentation at the 86th annual conference for Agricultural
Economics Society, University of Warwick, United Kingdom.

65
Appendix I: Variance inflation factors results for multi-collinearity test
Variable VIF 1/VIF
HHINCO 1.84 0.55
trained_areas 1.45 0.69
OFFARM 1.39 0.72
logt_mtrees 1.37 0.72
SchlgYrs 1.26 0.76
ext_times 1.17 0.81
exp_mango 1.17 0.85
GRPMBR 1.16 0.87
TransMNS 1.12 0.88
MKTINFO 1.10 0.91
D_tmcX 1.08 0.93
Mean VIF 1.30
There was no multi-collinearity as VIF for all explanatory variables is below 5

66
Appendix II: Assessment of goodness of fit
Measures of fit for multinomial logit model
Log-like intercept only -212.59 Log-lik full model -120.09
D(203) 240.169 LR(22) 185
Prob > LR 0.000
McFadden's R2 0.435 McFadden's Adj R2: 0.322
ML (Cox-snell) R2 0.557 Cragg-Uhler (Nagelkerke) R2 0.385
Count R2 0.74 Adj Count R2 0.385
AIC 1.269 AIC* 288.169
The model fitted well with a McFadden’s R2 of 0.435 and prob>LR of 0.000
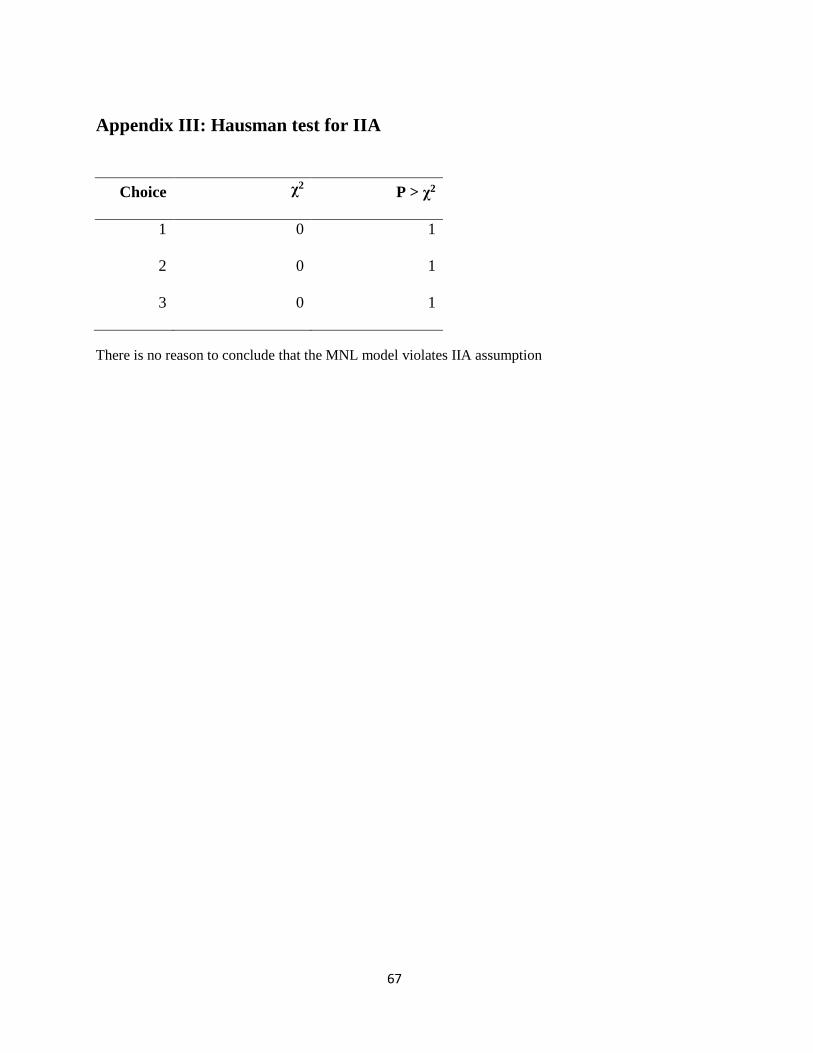
67
Appendix III: Hausman test for IIA
Choice χ2 P > χ2
1 0 1
2 0 1
3 0 1
There is no reason to conclude that the MNL model violates IIA assumption

68
Appendix IV: Questionnaire for mango farmers marketing practices in Makueni, Kenya
UNIVERSITY OF NAIROBI
DEPARTMENT OF AGRICULTURAL ECONOMICS
MANGO FARMERS’ QUESTIONNAIRE
This questionnaire is meant to collect data on mango marketing in Makueni
County; information obtained is for academic purposes for the researcher
only and no commercial purpose whatsoever. Responses obtained will be
treated with utmost confidentiality and no names will appear in the report.
The questionnaire will take about 30 minutes. Your assistance will be highly
appreciated
General information:
Name of the farmer_________________________________________________
Location _________________________________________________
Sub location______________________________________________________
Mobile No._______________________________________________________
Questionnaire No.___________________________________________________

69
Part 1: Socio-demographic factors
i. Who makes decisions on farming
Household head ____
Spouse ____
ii. What is the gender of the decision maker
Male ____
Female_____
iii. What is the age of the decision maker (years) _____
iv. Number of years completed in school____________
v. What is his/her main occupation? State income from each and note the main source
1. Farming___
2. Business (non-farming)___
3. Employed___
vi. Are there household members working or doing business off farm? Yes__No__.
vii. If yes, specify who?___1. Household head (man) 2. Wife 3.Son_ 4. Daugher_
viii. What is the total average monthly income of the household
1. Below Kshs. 10,000
2. Kshs. 10,001-20,000
3. Kshs. 20,001- 30,000
4. Kshs 30,001-40,000
5. Kshs. Above 40,000
ix. What is the total number of family members? Total___. Above 18 yrs__below18 yrs__
x. What is the distance in Kms to the nearest market Centre connected to electricity __
xi. What is the distance in Kms to the nearest tarmac road___
xii. For how many years have you been growing mangoes___
Part 2: Production factors
i) What is the total size of your land in acres____?
ii) What size of land is under mangoes in acres_____?
iii) How many mango trees in production stage do you have?
1. Apple___
2. Ngowe___
3. Indigenous___
4. Other___
iv) Is mango farming your main on-farm enterprise? Yes___No___

70
v) Apart from mangoes, what are your other on-farm sources of income? (Specify the items
and income obtained from each per year)* Assist farmer to calculate*
Codes: 1. Fruits _________2. Dairy ________ 3. Livestock ________4. Food
crops__________5. Other
vi) Input use per year/season on the mango farm
Input codes: 1. Manure 2. Fertilizer 3. Foliar fertilizer 4. Insecticide 5. Fungicide 6. Other
(specify)
Quantity codes: 1. Kgs 2. Cart 3.Wheelbarrow 4. Tractor 5. Litres
vii) What is your main source of labor: 1)Family 2)Employed (Casuals) 3)Employed
(permanent)
viii) How much in Kshs do you spend on labor per season/year? ____
ix) Tick farm assets owned: 1. Jembes 2. Panga 3. Water pump 4. Knapsack sprayer 5.
Wheel barrow 6. Cart 7. Tractor 8. Car 9. Mobile phone 10. Tv 11. Lorry 12. Pick up
Part 3: Marketing activities
Marketing trends
Buyer
Quantity
sold
Unit Price
per unit
Cash
income
Payment
cash/credit
Reason why
that channel
Requirement
of channel
Quantity not
able to sell
2013
2012
2011
Buyer codes: 1. Broker 2. Exporter 3. Retail market 4. Direct market 5. Processor 6. Other
(specify)
Quantity codes: 1. Pieces 2. Boxes 3. Kgs 4. Bags
Input* Unit Quantity Cost per unit Total cost*
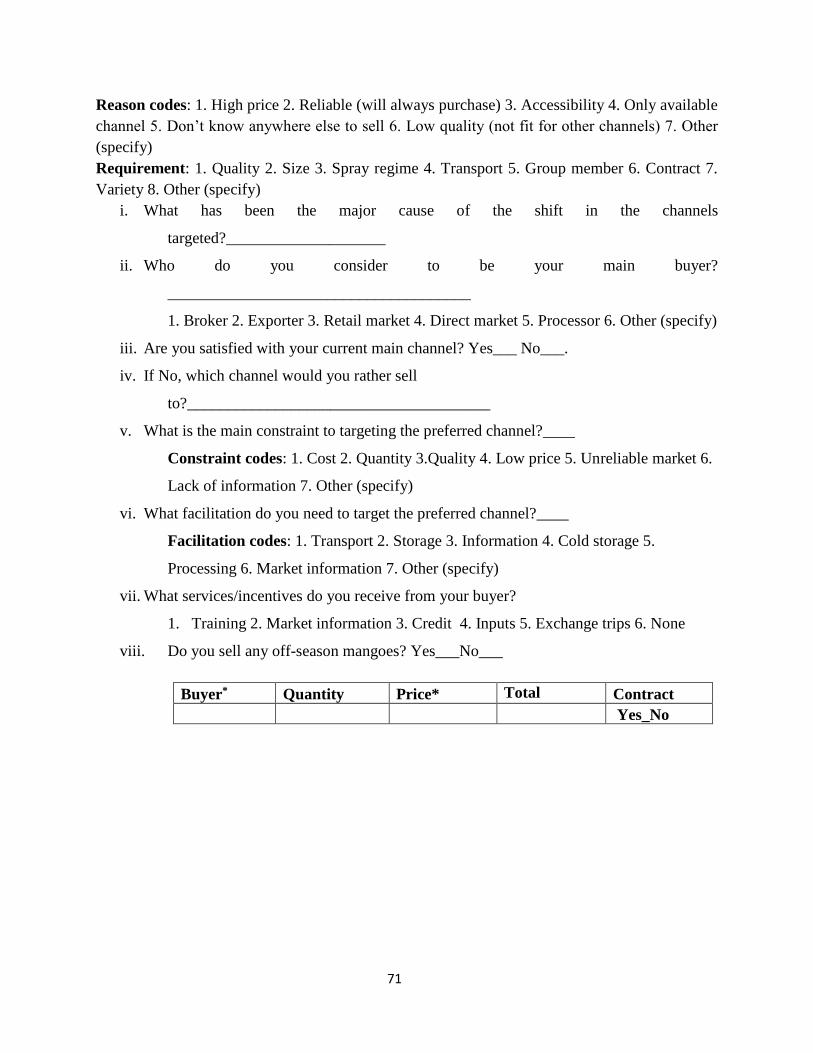
71
Reason codes: 1. High price 2. Reliable (will always purchase) 3. Accessibility 4. Only available
channel 5. Don’t know anywhere else to sell 6. Low quality (not fit for other channels) 7. Other
(specify)
Requirement: 1. Quality 2. Size 3. Spray regime 4. Transport 5. Group member 6. Contract 7.
Variety 8. Other (specify)
i. What has been the major cause of the shift in the channels
targeted?____________________
ii. Who do you consider to be your main buyer?
______________________________________
1. Broker 2. Exporter 3. Retail market 4. Direct market 5. Processor 6. Other (specify)
iii. Are you satisfied with your current main channel? Yes___ No___.
iv. If No, which channel would you rather sell
to?______________________________________
v. What is the main constraint to targeting the preferred channel?____
Constraint codes: 1. Cost 2. Quantity 3.Quality 4. Low price 5. Unreliable market 6.
Lack of information 7. Other (specify)
vi. What facilitation do you need to target the preferred channel?____
Facilitation codes: 1. Transport 2. Storage 3. Information 4. Cold storage 5.
Processing 6. Market information 7. Other (specify)
vii. What services/incentives do you receive from your buyer?
1. Training 2. Market information 3. Credit 4. Inputs 5. Exchange trips 6. None
viii. Do you sell any off-season mangoes? Yes___No___
Buyer* Quantity Price* Total Contract
Yes_No

72
Part 4: Institutional factors
i. Activities carried out by the farmer (production, harvesting, post-harvest)
Farm
activities
Annual
cost
Post-harvest
activities
Annual
cost
Areas where have been
trained
Trainer
Cost
yes/no
Apply manure Picking Grafting
Weeding Packing Pruning
Pruning Cooling Pest and disease control
Grafting Storage Marketing
Irrigation Grading Post-harvest management
Spraying Transport Grading
Keep records Processing Record keeping
Other Other Other
Trainer codes: 1 Extension officer 2. NGO 3. Buyer 4. Fellow farmer 5. Other (specify)
ii. Do you visit or get visited by NGO/Govt agency/private organization to assist in mango
development? Yes__No__. If yes, provide name(s)
_______________________________
iii. If yes what services have you received from them? ______Name the NGO.
1.Training 2. Funding exchange trips 3. Looking for buyers 4. Giving market
information 5. Organizing seminars/workshops 6. Credit 7. Transport 8. Witness
contracts 9. Other (specify)
_____________________________________________________________________
______
iv. Have you received any visit from government/private extension officer in the last 3
years? Yes__No__. If yes, how many times? __
v. Do you have information on mango market (prices, product requirements, location)
Yes_No_
vi. From where do you get information on markets
1. Government extension 2. Buyer 3. Fellow farmer 4. Group 5. I don’t receive
information on markets
vii. How often do you receive this information?
Codes: 1. Daily 2. Weekly 3. Monthly 4. Once per season 5. Once per year

73
viii. What is the means used to obtain the
information?___________________________________
1. Visit buyer/market (word of mouth) 2.Mobile phone 3. Buyer visits farm (word of
mouth) 4. Farmer to farmer (word of mouth) 5. Other (specify)
ix. On a scale of 1-5, 1 being lowest and 5 highest, how much do you trust information from
these sources? 1. Government extension___ 2. Buyer___3. Fellow farmer ___4.
Group____
x. Do you incur cost during the following marketing activities?____
1. Negotiating prices (fare/transport,
airtime)__________________________________
2. Looking for market(airtime,
fare/transport)_________________________________
3. Maintaining contract with buyer (fee, lawyer,
etc)____________________________
4. Interest on
loans/Credit_________________________________________________
5. Communication
______________________________________________________
6. Monitoring costs (monitoring pickers,
bribes)_______________________________
7. Group membership (registration fee, membership
fee)________________________
8. Mention any other costs incurred during
market_____________________________
xi. What means do you use to arrive at a price with buyer? Name the buyer for every method
if different; broker___, exporter___, retail market___, direct market ___, processor
___
1. Individual negotiation 2. Group negotiation 3. Buyer sets price 4. I set price 5.
Other
xii. Do you consider the price attained to be fair? Yes__No__. Give
reason________________
xiii. Are you a member of any mango marketing group? Never__ Yes__Left
group(year)__

74
Group services: 1. Marketing 2. Training 3. Information 4. Exchange trips 5. Bulk
input sourcing 6. Other
Reason for leaving group: 1. Mismanagement 2. Favoritism 3. High cost 4. Other
(specify)
xiv. If never a member, why?
__________________________________________________-
xv. Have you signed a contract with any buyer? Yes_Never_Left contract_. If yes or left
contract fill table
Behavior of buyer when
Buyer/channel
Terms of
contract
Market prices
are lower
Market prices
are higher
Excess*
supply
buyer
violates
contract*
Yes
No
Terms of contract: 1. Quality 2. Price 3. Grading 4. Transport 5. Size 6. Other (specify)
If left, what was the reason for leaving?
__________________________________________________
1. Buyer violated contract 2. Group disintegrated 3.Could not meet terms 4. Not enough to
sell
xvi. Have you applied for credit or loan in the last 3 years: yes_ no_? If yes fill the table
below
Duration
(years) Joining Group services
Channel sold
to via group
Other group
terms
If left group,
give reason
Free
Charges
75
Source of credit: 1. Banks 2. Rural microfinance 3.Sacco 4. Merry go round 5. Buyer 6. Other
Purpose of credit: 1. School fees 2. Medical 3.Farm (non-mango, specify) 4. Farm (mango) 5.
Other
Activity carried out: 1. School fees 2. Medical 3.Farm (non-mango, specify) 4. Farm (mango)
5. Other
xvii. If not borrowed in question x above, why did you not borrow?
1. No need 2.Fear of risk 3. High interest rate 4. Lack of collateral 5.Other (specify)
xviii. What would say is the major impediment to the mango sub-sector in Makueni
County?
1. High cost of production 2.Pests and diseases 3. Lack of market 4. Brokers 5. Lack
of expertise/training 6. Other (specify)
xix. What would be the best way to improve your access to market_______________
Amount
applied
Amount
obtained Source
Form
(cash/inputs) Purpose
Activities
carried out
2013
2012
2011