AN ASSESSMENT OF LANDSCAPE HETEROGENEITY IN … · AN ASSESSMENT OF LANDSCAPE HETEROGENEITY IN THE...
12
XI CONGRESO INTERNACIONAL DE INGENIERIA DE PROYECTOS LUGO, 26-28 Septiembre, 2007 AN ASSESSMENT OF LANDSCAPE HETEROGENEITY IN THE EUROPEAN UNION USING CORINE LAND COVER 2000 and LUCAS SURVEY DATA L.C. Frost , E. Willems (p) ,C. Lathuy, M.S. Calvo Iglesias Abstract This paper explores the spatial dimension of the landscape, with the aim of building an indicator of landscape state for the European Union that accounts for the difference in heterogeneity among rural landscapes across Member States. The investigation mainly utilised land cover data from the CORINE Land Cover 2000 inventory. This was later compared with ground truth photographic data for specific focus regions, obtained from the European Commission LUCAS area frame survey. Landscape characterisation was conducted across the European Union by means of five landscape pattern metrics calculated within a 3 x 3km grid, assuming that this extent represents the range of human view. Grid-level data were synthesised at the level of NUTS 2/3 to assess the landscape median heterogeneity per region. Results reveal significant differences between landscape heterogeneity in the EU-15 and EU-N12. In particular, CLC2000 reveals extreme homogeneity in Denmark, the United Kingdom, and the Netherlands. In Northern Portugal and the Baltic states heterogeneity is high. Reasons for this discrepancy were analysed in terms of agricultural policy and environmental attributes of the different Member States. Individual areas were then investigated in greater depth to assess the degree to which the CORINE data analysis is representative of true landscape heterogeneity. The analysis with LUCAS uncovers a high level of consistency between the two datasets in the focus regions, and discernible ground-level distinctions between areas of "high" and "low" heterogeneity. Despite the promising results, this consistency is not universally conclusive; therefore further analyses are needed to ascertain its reliability. Keywords: landscape analysis, European Union, Corine Land Cover, LUCAS survey Resumen Este estudio explora la dimensión espacial del paisaje, con el objetivo de contribuir a la construcción de un indicador de "estado del paisaje" para la Unión Europea que recoja la diferencia en heterogeneidad de los paisajes rurales en los distintos Estados Miembros. Para esta investigación se utilizaron fundamentalmente los datos de Corine Land Cover 2000, que posteriormente fueron comparados con fotografías procedentes del muestreo LUCAS. El análisis paisajístico fue llevado a cabo mediante el cálculo de cinco índices de paisaje calculados en grids de 3x3 km, asumiendo que este tamaño representa el campo de visión humano. Los resultados fueron sintetizados a nivel de NUTS 2/3 para analizar la heterogeneidad de cada región a partir de su mediana. Se han observado diferencias significativas de heterogeneidad para los paises EU-15 y EU-N12. En concreto se ha 872
Transcript of AN ASSESSMENT OF LANDSCAPE HETEROGENEITY IN … · AN ASSESSMENT OF LANDSCAPE HETEROGENEITY IN THE...

XI CONGRESO INTERNACIONAL DE INGENIERIA DE PROYECTOS
LUGO, 26-28 Septiembre, 2007
AN ASSESSMENT OF LANDSCAPE HETEROGENEITY IN THE EUROPEAN UNION USING CORINE LAND COVER 2000 and LUCAS SURVEY DATA
L.C. Frost , E. Willems(p) ,C. Lathuy, M.S. Calvo Iglesias
Abstract
This paper explores the spatial dimension of the landscape, with the aim of building an indicator of landscape state for the European Union that accounts for the difference in heterogeneity among rural landscapes across Member States.
The investigation mainly utilised land cover data from the CORINE Land Cover 2000 inventory. This was later compared with ground truth photographic data for specific focus regions, obtained from the European Commission LUCAS area frame survey.
Landscape characterisation was conducted across the European Union by means of five landscape pattern metrics calculated within a 3 x 3km grid, assuming that this extent represents the range of human view. Grid-level data were synthesised at the level of NUTS 2/3 to assess the landscape median heterogeneity per region. Results reveal significant differences between landscape heterogeneity in the EU-15 and EU-N12. In particular, CLC2000 reveals extreme homogeneity in Denmark, the United Kingdom, and the Netherlands. In Northern Portugal and the Baltic states heterogeneity is high. Reasons for this discrepancy were analysed in terms of agricultural policy and environmental attributes of the different Member States.
Individual areas were then investigated in greater depth to assess the degree to which the CORINE data analysis is representative of true landscape heterogeneity. The analysis with LUCAS uncovers a high level of consistency between the two datasets in the focus regions, and discernible ground-level distinctions between areas of "high" and "low" heterogeneity. Despite the promising results, this consistency is not universally conclusive; therefore further analyses are needed to ascertain its reliability.
Keywords: landscape analysis, European Union, Corine Land Cover, LUCAS survey
Resumen
Este estudio explora la dimensión espacial del paisaje, con el objetivo de contribuir a la construcción de un indicador de "estado del paisaje" para la Unión Europea que recoja la diferencia en heterogeneidad de los paisajes rurales en los distintos Estados Miembros.
Para esta investigación se utilizaron fundamentalmente los datos de Corine Land Cover 2000, que posteriormente fueron comparados con fotografías procedentes del muestreo LUCAS.
El análisis paisajístico fue llevado a cabo mediante el cálculo de cinco índices de paisaje calculados en grids de 3x3 km, asumiendo que este tamaño representa el campo de visión humano. Los resultados fueron sintetizados a nivel de NUTS 2/3 para analizar la heterogeneidad de cada región a partir de su mediana. Se han observado diferencias significativas de heterogeneidad para los paises EU-15 y EU-N12. En concreto se ha
872

observado gran homogeneidad en Dinamarca, UK y Holanda, mientras que Portugal y los Países Bálticos son muy heterogéneos. Estos resultados fueron analizados posteriormente en el contexto de la política agraria y de las características ambientales de los Paises Miembros.
Del análisis de los datos LUCAS se obtuvieron resultados similares permitiendo la diferenciación de áreas con alta y baja heterogeneidad. A pesar de los prometedores resultados, el carácter exploratorio del estudio muestra la necesidad de realizar posteriores investigaciones para evaluar el grado de complementariedad entre ambas fuentes de datos.
Palabras clave: análisis del paisaje, Unión Europea, Corine Land Cover, encuesta LUCAS
1. Introduction
The diversity of rural landscapes in Europe is a distinctive feature of the continent (Stanners and Bourdeau, 1995). Land use patterns have evolved around two significant factors: the type and accessibility of natural resources and the dynamics of demographic processes, Stanners and Bourdeau (1995) – factors which inevitably fluctuate in extremes across the European Union's 4,336,790 sq km area. As such, there is great variation between different landscapes in terms of the distribution and intensity of human occupancy, forest, arable, grassland, permanent crops and other agricultural uses. Hedgerows and other linear elements are likewise an important feature, EEA (2005). This spatial mosaic of landscape elements is the major determinant of the physical semblance, visual appearance, and human perception of landscape. It is the defining characteristic of regional environments and the scene with which local people identify and frame their lives, contributing to the formation of local cultures, natural and cultural heritage and human well-being, Council of Europe (2000). It is an important part of the quality of life for people everywhere. Furthermore, the configuration and composition of landscape elements – in terms of habitat fragmentation and ecosystem viability – play an important role for ecological functionality and biological diversity, McGarigal and Marks (1994). Thus, landscape structure and form represent "complex human-environment systems", O'Neill et al. (1989), crucial for both social and environmental sustainability, as well as for the economic activities which they support Jessel (2006), Stanners and Bourdeau, (1995), Council of Europe (2000).
As such, landscape analysis is of increasing importance in the bid to comprehend landscape structures in a way which yields functional results for policy formation. Bailey et al. (2006)observe the wide use of landscape quantification to monitor environmental quality at regional scales e.g. O'Neill et al. (1997); to measure and monitor landscape change e.g. Lausch and Herzog (2002); to quantify ecological processes e.g. Bender et al. (2003); to study the effects of society on landscape e.g. Saura and Carballal (2004); and to aid in landscape design Gustafson and Parker (1994). Documenting trends in land use, land cover and landscape pattern contributes to a better understanding of the interaction between landscape structure and ecological and human processes Griffith et al. (2003); Calvo-Iglesias et al. (2006). But landscape is an inherently difficult concept to capture on the basis of available information EEA (2005). Possessing the dual dimensions of variation through both time and space, landscapes may be seen as a palimpsest of specific, sometimes intangible, local conditions. This necessitates analysis of both the trajectories of change and its spatial distribution Mertens and Lambin (2000); Bürgi et al. (2004); Calvo-Iglesias et al., (2006). This paper examines the spatial dimension, exploring the roles of two key European sources of landscape data in understanding the varying structure and form of landscape throughout the EU-27.
873

The investigation surveys landscape heterogeneity and fragmentation across the European Union, mainly utilising spatial data from the CORINE Land Cover 2000 inventory. These data were used to conduct landscape analysis across the EU by means of five landscape pattern metrics, calculated within a 3 x 3 km grid. The computed results were later compared with visual information for specific focus regions, provided by the ground images of the LUCAS area frame survey. The study examined the complementarity between the ground truth images and satellite-based data, and assessed the added value of LUCAS data to landscape analyses based on medium-resolution satellite imagery.
2. Materials and methods
2.1. Materials
The investigation mainly utilised land cover data from the CORINE Land Cover 2000 inventory. This was later compared with ground truth photographic data for specific focus regions, obtained from the European Commission LUCAS area frame survey.
The initial Corine inventories, incorporating the majority of the EU-25, took place between 1986-95 (Corine Land Cover 1990). We used the update launched in January 2000, which covers all EU-27 countries. The mapping units of the CORINE survey measure 25ha in area, classified based on the dominant type of land cover within the polygon. Linear features of less than 100m wide are disregarded. The scale of the final output is 1:100,000 equating to a location precision of 100m. CLC describes land cover based on a nomenclature of 44 classes, organised hierarchically in three levels. It was decided to use an intermediate thematic resolution by aggregating some of the classes at the first and second level. This reduced the number of CORINE classes to 22. The finest differentiation is used for agricultural classes and shrub or herbaceous vegetation associations; the intermediate level is used for forests, sparsely vegetated areas, and for wetlands and water bodies; artificial surfaces are undifferentiated, meaning that urban areas constitute just one of the 22 land cover classes. The emphasis here is thus on the heterogeneity of the non-urban landscape.
LUCAS is an European area frame survey based on the observation of a sample of geo-referenced points, with the primary objective to provide representative and harmonised estimates of land cover and land use at EU level. It also includes more environmental information. The base sample with the latest methodology is linked to a 1km grid corresponding to around 4,000,000 points for the entire EU. The master sample incorporates a subset of these points, corresponding to a 2km grid and consisting of around 1,000,000 points. The master sample has been combined with NUTS boundaries to extract points on the EU territory and allocate them by country. Each point of the master sample has been photo-interpreted in order to classify the sample into seven strata, based on the most recent ortho-photography or on satellite imagery. From the stratified master sample, a sub-sample of around 250,000 points is extracted, to be classified by field visit according to the full land nomenclature. These visits are intended to focus on agricultural land. Due to the low quality and lack of harmonised methodology for the collection of the pictures in the survey in 2000, this research employs landscape images from the most recent inventory in 2006 which covers 11 Member States.
2.2. Methods
874

Raw CLC data were quantified into workable statistics using five landscape pattern metrics: Simple Diversity, Patch Density, Edge Density, Shannon and Simpson Diversity. The five diversity indices were chosen based on general acceptance of their efficacy in the wider literature, and their potential ease of interpretation, both spatially and visually from the LUCAS images. The metrics represent different ways of classifying the landscape and thus yield differing information concerning landscape configuration. For instance, whilst Simple Diversity quantifies landscape composition, the Patch Density, Edge Density, Shannon and Simpson Diversity indices also consider the configuration of patch types within the landscape. For description and mathematical formulae detailed information can be found in McGarigal et al. (1994). The base unit for computation of each index was a grid cell of 3 x 3km2, in which the indices are calculated. The grid size was decided based on the approximate limits of human view in an almost flat environment, following trials in previous studies using cells of 10 x 10km (Willems et al. 2000). Furthermore, this cell dimension provides a high number of squares for aggregation at regional (NUTS 2/3) level, a good picture of intra-regional diversity and fine inter-regional comparisons.
Based on the results of the CORINE analysis, a subset of LUCAS points was selected for ground-level analysis of the landscape in five regions of the Member States featuring low, medium and high heterogeneity values. The selection of focus regions was restricted by the areas for which reliable data were available. After filtering out the poorer quality images from the initial subset of 5 LUCAS points per test region, photographs for 2-3 points per Member State remained for comparison with the CLC data.
Visual image interpretation of photographs is a non-numerical approach based on the perceived image characteristics, Antrop and Van Eetvelde (2000). Important factors for interpretation are the degree of detail in the photographs and their comparability with the other material used, Nüsser (2001). It was assumed in the CORINE analysis that a grid size of 3 x 3km approximates the limits of human view. As such, it is assumed that the human view depicted in the LUCAS landscape photographs is roughly simultaneous with the spatial reference units of the CORINE analysis. Only LUCAS points located in the centre of grid reference squares were chosen, since these would approximate the spatial extent of the landscape metrics more accurately. Hence, for this exploratory exercise, the two datasets are considered comparable. The inaccuracies in this assumption may be resolved by future research.
The LUCAS analysis focused on three specific landscape metrics for comparison with the CORINE data – Simple Diversity, Patch Density and the Simpson Diversity Index – since these were the easiest to estimate through visual interpretation. Bearing in mind the resolution of the satellite data and the aggregation of CLC classes, the number and density of visible land cover types and patches were counted for each landscape photograph, and the dominant CLC class identified. The results were compared with the values obtained during the CORINE analysis to assess the consistency of the two datasets. The photographs were also analysed to determine the additional landscape information yielded by ground truth data, which can expand upon the details obtained from the CORINE analysis.
3. Results
Figure 1 shows landscape heterogeneity across the EU-27 at the regional level, as reflected by the simple diversity index. The mean heterogeneity of all countries is 3.7 (within a range from 0.9 to 6.2), with a standard deviation of 0.6. Thus, approximately 2/3 of the Member States display a mean Simple Diversity within a distance of 0.6 units either side of the mean.
875

Figure 1. Distribution of NUTS Regions according to Simple diversity index
Figure 2 categorises regions of the EU based on the Patch Density index. The average PD for the EU-27 is 10.5 (within a range from 0.9 to 34.0), with a standard deviation of 3.3. Approximately 2/3 of the Member States exhibit a PD within 3.3 units either side of the mean.
Patch density reveals the lowest landscape heterogeneity at Member State level to be that of Denmark, where the diversity is 54.1% lower than the EU average, at 5.1. The Netherlands also possesses a particularly low degree of landscape heterogeneity. At regional level, London (0.9), Paris (1.0) and København (1.5) constitute the three regions of lowest heterogeneity. 30 regions have a PD of below 4.0, of which 19 are located in the UK.
876
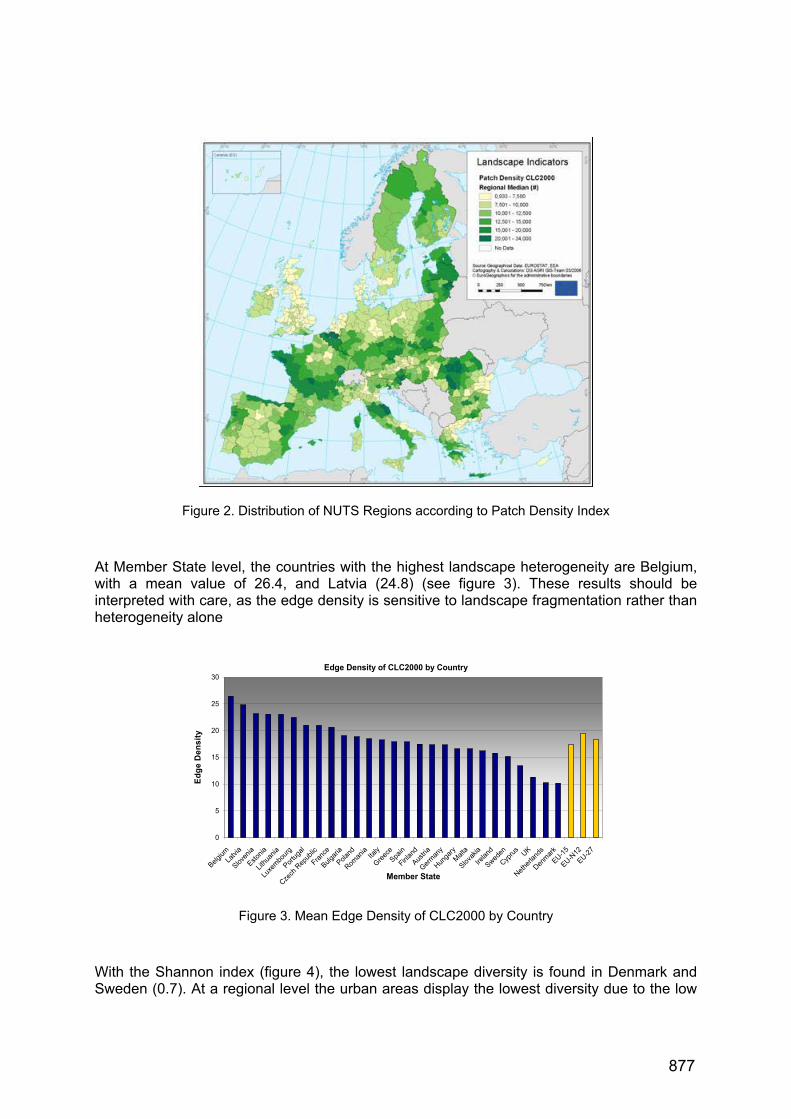
Figure 2. Distribution of NUTS Regions according to Patch Density Index
At Member State level, the countries with the highest landscape heterogeneity are Belgium, with a mean value of 26.4, and Latvia (24.8) (see figure 3). These results should be interpreted with care, as the edge density is sensitive to landscape fragmentation rather than heterogeneity alone
Edge Density of CLC2000 by Country
0
5
10
15
20
25
30
Belgium
Latvi
a
Sloven
ia
Estonia
Lithu
ania
Luxe
mbo
urg
Portu
gal
Czech
Rep
ublic
Franc
e
Bulgar
ia
Poland
Roman
iaIta
ly
Greec
eSpa
in
Finlan
d
Austri
a
Germ
any
Hunga
ryM
alta
Slovak
ia
Irelan
d
Sweden
Cypru
sUK
Nethe
rland
s
Denm
ark
EU-15
EU-N12
EU-27
Member State
Ed
ge
Den
sity
Figure 3. Mean Edge Density of CLC2000 by Country
With the Shannon index (figure 4), the lowest landscape diversity is found in Denmark and Sweden (0.7). At a regional level the urban areas display the lowest diversity due to the low
877
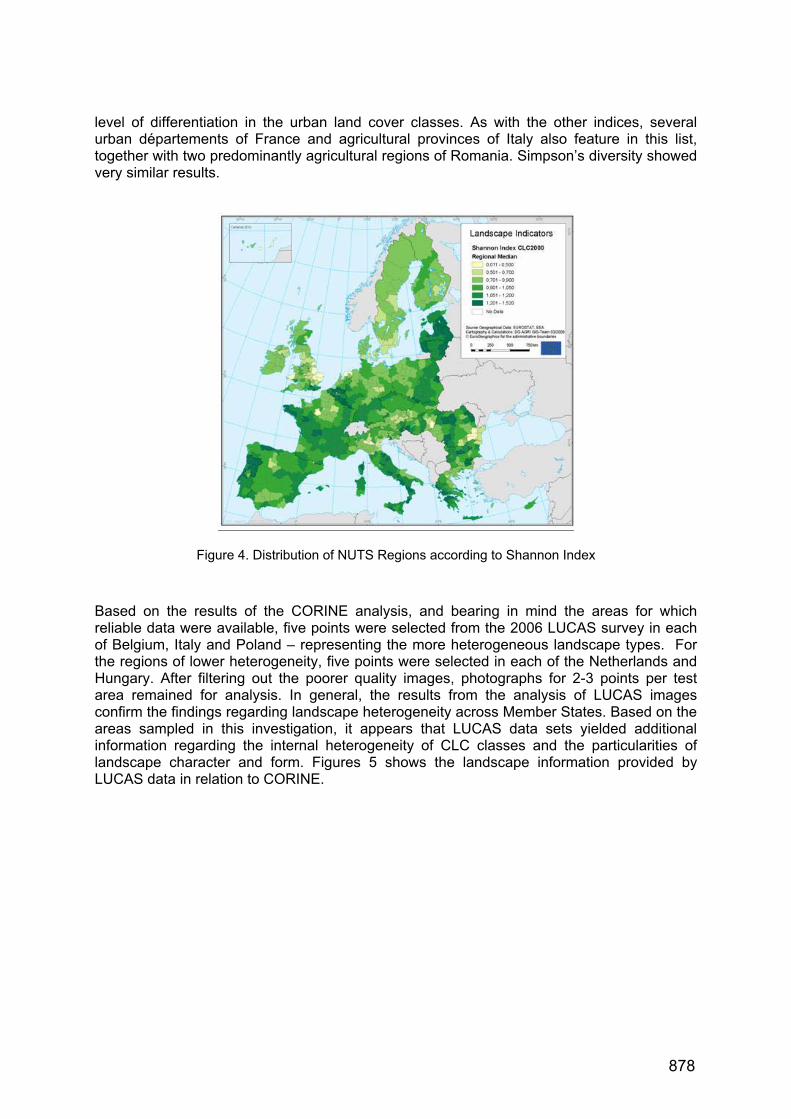
level of differentiation in the urban land cover classes. As with the other indices, several urban départements of France and agricultural provinces of Italy also feature in this list, together with two predominantly agricultural regions of Romania. Simpson’s diversity showed very similar results.
Figure 4. Distribution of NUTS Regions according to Shannon Index
Based on the results of the CORINE analysis, and bearing in mind the areas for which reliable data were available, five points were selected from the 2006 LUCAS survey in each of Belgium, Italy and Poland – representing the more heterogeneous landscape types. For the regions of lower heterogeneity, five points were selected in each of the Netherlands and Hungary. After filtering out the poorer quality images, photographs for 2-3 points per test area remained for analysis. In general, the results from the analysis of LUCAS images confirm the findings regarding landscape heterogeneity across Member States. Based on the areas sampled in this investigation, it appears that LUCAS data sets yielded additional information regarding the internal heterogeneity of CLC classes and the particularities of landscape character and form. Figures 5 shows the landscape information provided by LUCAS data in relation to CORINE.
878

Figure 5. Landscape information provided by LUCAS and CORINE in a sample for Hungary
4. Discussion
Results show the extreme variation in landscape heterogeneity across the EU-27 Member States, the explanation for which can be grounded, amongst other things, in the natural settings of the different regions, human pressure, agricultural policy and methods utilised for this research.
Regarding the topography, more homogeneous regions are characterised by vast expanses of flat land (e.g. Netherlands, southeast Hungary). Aside from the regions explored above, this theory can be extrapolated to other states exhibiting low heterogeneity, namely Denmark – the least heterogeneous of all EU Member States, where the average height above sea level is only 31 metres – and eastern areas of the United Kingdom. Such uninterrupted topography lends itself ideally to large-scale farming practices. Land is easily accessed by all manner of machinery, making all types of arable and pastoral agriculture possible. Field (patch) sizes are large, and consequently a high proportion of land area is devoted to a single land cover. This low degree of fragmentation translates to a relatively homogeneous landscape in terms of the metrics utilised above. By contrast, regions of higher landscape
879
heterogeneity possess a more fragmented land use pattern and in many cases a more rolling topography. However, it can be seen that the most mountainous regions of the EU actually exhibit relatively low landscape heterogeneity (see for example the Italian Alps, and the Slovenian Alps and Dinarides). At these higher altitudes heterogeneity decreases due to climatic and topographical constraints on land use (for example, gradient in the Alps peaks at 51%, significantly reducing its utility for agricultural and other human uses). Similarly, Belgium and the Baltic states, which were found to possess some of the most heterogeneous landscapes of the EU, exhibit a relatively flat terrain.
Other possible factors overriding topographical considerations can be inferred from the case of Belgium – a relatively flat country (mean slope angle for the country as a whole is 2.96%) exhibiting high landscape heterogeneity. The reasons for this fragmentation are likely to emanate from the traditions of farming practice, and from the environmental characteristics of the land. Production conditions in Belgium vary greatly from one region to the next, influenced both by the physical environment (including topography, geology, latitude) and the area of land used by farms. In fact, the varying production conditions, combined with the small average farm size, explain the high heterogeneity of agricultural land covers in Belgium. This scenario is compounded by a high population density (342/km2, placing it 29th
most densely-populated country in the world) which places demands on the landscape for competing interests, including residential and amenity land cover types (see part iv. below). These factors combine to produce a highly heterogeneous landscape, irrespective of topographical influences. It seems likely that such environmental factors have similar influence on landscape heterogeneity in other Member States, although this requires further scrutiny using ground truth data. For example in the Baltic, where heterogeneity was also found to be high, crop production is limited by a short growing season and limited cultivable land area. This restricted crop area must be divided between the primary crops – cereals, feed crops, potatoes, vegetables and sugar beet (Latvia and Lithuania only). There are thus numerous competing land uses on a relatively small area of land, leading to high fragmentation. Livestock production is the basis of the agricultural economy across a broader area. More generally, the low-lying Baltic States are characterised by numerous lakes (Estonia boasts more than 1400 and Latvia over 3000), wetlands, and peat bogs. In addition, they are some of the most densely-forested states of the EU. These factors, combined with a growing urban area, contribute further to the heterogeneous land covers highlighted by the landscape pattern metrics.
The degree of humanisation of a country or region has a great impact on the apparent heterogeneity of the landscape. In northern Belgium and western Germany, the high population density contributes urban elements to the landscape, which increase the overall heterogeneity detected by the CORINE survey. The relatively low population density of south-east Hungary and eastern Scotland may likewise be considered a contributory factor to the homogeneity of those landscapes – there are fewer artificial surfaces in the landscape and therefore a lower diversity of land cover types. But, on the other hand, the homogeneous landscapes of the Netherlands and parts of northern Italy have a relatively high population density. This could be related to the thematic aggregation of land cover classes, as all different classes related to urban areas were aggregated to one single class. Similarly, some of the most heterogeneous regions, including Latvia, Lithuania, western France and Northern Portugal, have very sparse populations. It is possible that the environmental factors and agricultural activities in these regions have a greater influence on the landscape than the degree of humanisation. More over, the extent of urbanisation might be relatively small and dispersed compared with other regions, and therefore not detected by the CORINE survey. Urbanisation effects should be researched further with the aid of higher resolution data.
880

Agricultural policies undoubtedly also impact landscape heterogeneity across the European Union. The most crucial element of this is the Common Agricultural Policy, which has been in operation in the six founding Member States since 1962, and in all accessing states thereafter. Until its reform in the 1990s, the emphasis of the policy was on encouraging better productivity in the food chain to ensure consumers a stable supply of food, whilst also developing a viable agricultural sector. The CAP offered subsidies and guaranteed prices to farmers, providing incentives for them to produce. By promoting such expansion in agricultural production, the CAP induced farmers to increase their production area and intensify cultivation. Throughout the 1970s and '80s field sizes in the old Member States increased as hedgerows were removed, woodlands deforested and wetlands and peat bogs drained to make way for agriculture. Such homogeneous landscapes of large field sizes and low landscape fragmentation are now predominant in many agricultural areas of western Europe, notably in eastern England where landscape heterogeneity has been found to be particularly low. Since the late-1980s the productivity ethic of the CAP has been gradually reformed and environmental concerns introduced by the 1992 McSharry reforms, Agenda 2000, and the CAP reforms of 2003/4. The latest reforms have re-oriented the CAP as a policy based on two pillars: market policy and rural development policy, with a financial shift towards the second pillar. This "greener" CAP is the policy which the EU-N12 have adopted on accession to the Union. This is a policy which subsidises farmers not for production, but for maintenance of land, creation of environmental assets and, indirectly, for diversification of farming practices. It is therefore a policy which would nurture a more heterogeneous rural landscape.
Regarding the method, there are a number of limitations in the use of CORINE and LUCAS data. The thematic aggregation of land cover classes within the CORINE Land Cover survey could lead to methodological artifacts. In choosing to quantify the landscape using only 22 of the 44 classes available in the survey, indices of heterogeneity do not reflect the full complement of possible landscape features. Not only is the diversity of artificial surfaces overlooked, but also of forest types, open spaces, wetlands and waters. A more exhaustive categorisation of land cover types would yield very different results from those produced here, where agricultural land types have been weighted more heavily than others. On the other hand, it would also be more difficult to interpret whether the observed landscape heterogeneity would be in terms of urban or agricultural character (see Bailey et al., 2006). In addition, the specific nature of the land cover classes in CORINE is significant. It is possible that a land parcel may fall under more than one type of land cover class, for example 2.4.3 ("Land principally occupied by agriculture with significant areas of natural vegetation") as well as 2.2.2 ("Fruit trees and berry plantations"), which describes more accurately the type of agriculture. It should be considered however, that for determining the spatial configuration of landscape, not every agricultural category must be defined. For example, the difference between "non-irrigated arable land" (CLC 2.1.1) and "permanently irrigated land" (CLC 2.1.2) contributes little to the overall landscape heterogeneity. It has also been suggested that broad categories such as 2.4.2 – "complex cultivation patterns" – comprise a plethora of different land types which, if separated out, could prove vital contributors to landscape heterogeneity. These issues are worthy of consideration when deciding future thematic aggregations. Schmit et al. (2006) find that the CORINE data strongly over-estimate arable land use and cannot correctly represent minor land use classes (i.e. land covers measuring less than 25ha in area or linear features less than 100m in width), a conclusion supported by the internal heterogeneity shown by the LUCAS images to exist within CORINE classes. Whilst globally the thematic accuracy of CLC is found to be 85%, this can vary from country to country. Future work might seek to fine tune the results with a correction factor based on LUCAS or Farm Structure Survey data regarding parcel size, in order to reflect this heterogeneity within classes. In particular, more weight could be allocated to heterogeneous
881

classes, such as "Land principally occupied by agriculture with significant areas of natural vegetation" (CLC 2.4.3).
The analysis of landscape characteristics with LUCAS was difficult in landscape with extreme characteristics in terms of openness. In fact the depth of view available from ground-level photography is extremely limited in enclosed landscapes with steeply sloping topography while in very open landscapes is difficult to identify the land covers for analysis. The restrictions in the perspective inhibit the identification of patches, and especially of which patches are linked to one another. The latter difficulty might be surmounted to some extent by using panoramic photographs, which would show more clearly the continuity of the landscape. Aerial photography or satellite data can also assist in this respect. In any case, the detail available from landscape images is likely not to be quantitative, but of a more qualitative nature. A further limitation to the photographs is their unknown scale. It is impossible to define the size of the area covered by individual land cover types, or by the landscape images as a whole. Only through association with satellite imagery or ortho-photography can the visible area be approximated.
5. Conclusions
This work has explored the heterogeneity of the European landscape, using both CORINE Land Cover 2000 and LUCAS area frame data. The CORINE survey demonstrates a marked difference between landscape heterogeneity in the countries of northern Europe and those of central and southern Europe. In general, the available LUCAS images appear to confirm these findings. Based on the areas sampled in this investigation, it appears that the CORINE and LUCAS data sets are mutually reinforcing. Ground-level LUCAS data proves a valuable counterpart to the lower resolution satellite data derived from CORINE, yielding additional information regarding the internal heterogeneity of CLC classes and the particularities of landscape character and form. Through LUCAS it has been possible to posit some possible explanations for the landscape patterns revealed by CORINE. The most salient of these have been the impact of topographical and environmental attributes, socio-economic activities and agricultural policy on the rural landscape. Likewise however, an accurate understanding of the complex landscapes in the LUCAS images depends on aerial information regarding landscape configuration.
The limitations of this exploratory study should not be overlooked. It is hoped that this research will open the door for future investigations to improve the reliability of these findings and increase their value in the policy process.
References
Antrop, M., and Van Eetvelde, V. (2000) “Holistic aspects of suburban landscapes: visual image interpretation and landscape metrics”. Landscape Urban Planning, Vol. 50, pp: 43-58.
Bailey, D., Herzog, F., Augenstein, I., Aviron, S., Billeter, R., Szerencsits, E., and Baudry, J. (2006).”Thematic resolution matters: Indicators of landscape pattern for European agro-ecosystems”. Ecological Indicators. In Press, Corrected Proof.
Bender, D.J., Tischendorf, L., Fahrig, L. (2003) Using patch isolation metrics to predict animal movement in binary landscapes. Landscape Ecology Vol.18, pp:17-39.
Bürgi, M., Hersperger, A.M., Schneeberger, N. (2004) Driving forces of landscape change – current and new – directions. Landscape Ecology Vol. 19, pp: 857-868.
882
Calvo-Iglesias, M.S., Fra-Paleo, U., Crecente-Maseda, R., and Diaz-Varela, R.A. (2006) “Directions of change in land cover and landscape patterns from 1957 to 2000 in agricultural landscapes in NW Spain”. Environmental Management Vol. 38, pp: 921-933.
Council of Europe (2000) “European Landscape Convention”. Council of Europe Publishing Division, Strasbourg.
EEA (2005). “Agriculture and Environment in EU-15 – the IRENA indicator report”. EuropeanEnvironment Agency, Copenhagen.
Griffith, J.A, Stehman, S.V. and Loveland, T.R. (2003) “Landscape trends in Mid Atlantic and Southeastern United States ecoregions”. Environmental Management Vol 32, pp: 572-588.
Gustafson, E.J.and Parker, G.R. (1994). “Using an index of habitat patch proximity for landscape design”. Landscape Urban Planning Vol. 29, pp:117-130.
Jessel, B. (2006). “Elements, characteristics and character – information functions of landscapes in terms of indicators”. Ecological Indicators Vol. 6, pp: 153-167.
Lausch, A. and Herzog, F. (2002). “Applicability of landscape metrics for the monitoring of landscape change: issues of scale, resolution and interpretability”. Ecological Indicators Vol. 2, pp: 3-15.
McGarigal, K. and Marks, B. (1994). “Fragstats - spatial pattern analysis program for quantifying landscape structure”. Forest Science Department, Oregon State University,Corvallis.
Mertens, B. and Lambin., E.F. (2000). “Land cover change trajectories in Southern Cameroon”. Annals of the Association of American Geographers, Vol. 90, pp: 467-494.
Nüsser, M. (2001). “Understanding cultural landscape transformation: a re-photographic survey in Chitral, eastern Hindukush, Pakistan”. Landscape and Urban Planning, Vol. 57, pp: 241-255.
O'Neill, R.V., Hunsaker, C.T., Jones, K.B., Riitters, K.H., Wickham, J.D., Schwartz, P.M., Goodman, I.A., Jackson, B.L. and Baillargeon, W.S. (1997). “Monitoring environmental quality at the landscape scale. Using landscape indicators to assess biotic diversity, watershed integrity, and landscape stability”. Bioscience Vol. 47, pp: 513-519.
O'Neill, R.V., Johnson, A.R. and King, A.W. (1989) “A hierarchical framework for the analysis of scale”. Landscape Ecology, Vol. 3, pp: 193–205.
Saura, S. and Carballal, P. (2004). “Discrimination of native and exotic forest patterns through shape irregularity indices: an analysis in the landscapes of Galicia, Spain”. Landscape Ecology Vol. 19, pp: 647-662.
Stanners, D. and Bourdeau, P. eds. (1995). “Landscapes – Chapter 8”. In Europe's Environment – The Dobris Assessment. European Environment Agency, Copenhagen.
Correspondence
Eric WILLEMS Commission européenne - European Commission Direction générale de l'Agriculture - Agriculture-Directorate General Analyses quantitatives, prévisions and statistiques AGRI-G2 Quantitative analyses, forecasts and statistics AGRI-G2 Office LOI130-5/25 Rue de la Loi, 130 B-1049 Bruxelles e-mail: [email protected]
883