An Assessment of “HOPE-Style” Merit Scholarships Christopher M. Cornwell and David B. Mustard...
29
An Assessment of “HOPE-Style” Merit Scholarships Christopher M. Cornwell and David B. Mustard University of Georgia
-
Upload
isabell-gilbert -
Category
Documents
-
view
217 -
download
1
Transcript of An Assessment of “HOPE-Style” Merit Scholarships Christopher M. Cornwell and David B. Mustard...

An Assessment of “HOPE-Style” Merit Scholarships
Christopher M. Cornwell and David B. MustardUniversity of Georgia

Background Growth of large-scale, state merit aid Georgia’s HOPE Scholarship as the model Common features
Entitlement--based on high-school GPA (and sometimes test scores)
No limit on # of award winners Scholars are eligible for multiple years
Common justifications: Increase enrollments in state universities Keep the best and brightest in state Promote academic achievement

Large-scale State Merit Programs Arkansas Academic Challenge (1991) Georgia’s HOPE (1993) Florida Bright Futures (1997) New Mexico Success (1997) Louisiana Tops (1998) South Carolina Life (1998) Kentucky Ed. Excellence Sch. (1999) U. of Alaska Scholars Program (1999) Washington Promise (1999) Maryland HOPE (2000) Nevada Millennium (2000) West Virginia Promise (2002) Tennessee HOPE (2004) Massachusetts Adams Scholarship (2005)

Georgia’s HOPE Program HOPE – Helping Outstanding Pupils
Educationally Introduced in 1993 and funded by a state
lottery Almost $3.6 billion disbursed to over
900,000 students Two types of aid:
Scholarship – merit-based; for degree-seeking students
Grant – not based on merit; for certificate and diploma seekers

Georgia’s HOPE Program
Scholarship awards Public schools – full tuition and fees +
$300 book allowance Private schools – $3,000 voucher
Eligibility and retention ‘B’ average in HS core courses 3.0 in college, checked at systematic
intervals

Georgia’s HOPE Program

Georgia’s HOPE Program
Significant program changes Income cap relaxed in 1994 and
eliminated in 1995 Expanded to include non-traditional
students (1996), home-schoolers (1998) “Add-on” scholarships (late 1990s) Removal of Pell offset (2001)
Growing concern that expenditures will outstrip lottery revenue

Georgia’s HOPE Program

Georgia’s HOPE Program

Assessing HOPE Financing Merit Aid Enrollments
Effect on Georgia institutions Effect on “brain drain”
College stratification Academic achievement
College GPA Course loads Course and major selection
But do they stay?

Financing Merit Aid
Methods of financing Lottery (Georgia, Florida, Kentucky, New
Mexico, South Carolina, Tennessee) General revenue (Arkansas, Louisiana,
Washington) Tobacco settlement (Michigan) Video gambling (West Virginia) Interest on land leases and sales (Alaska)
Financing Merit Aid
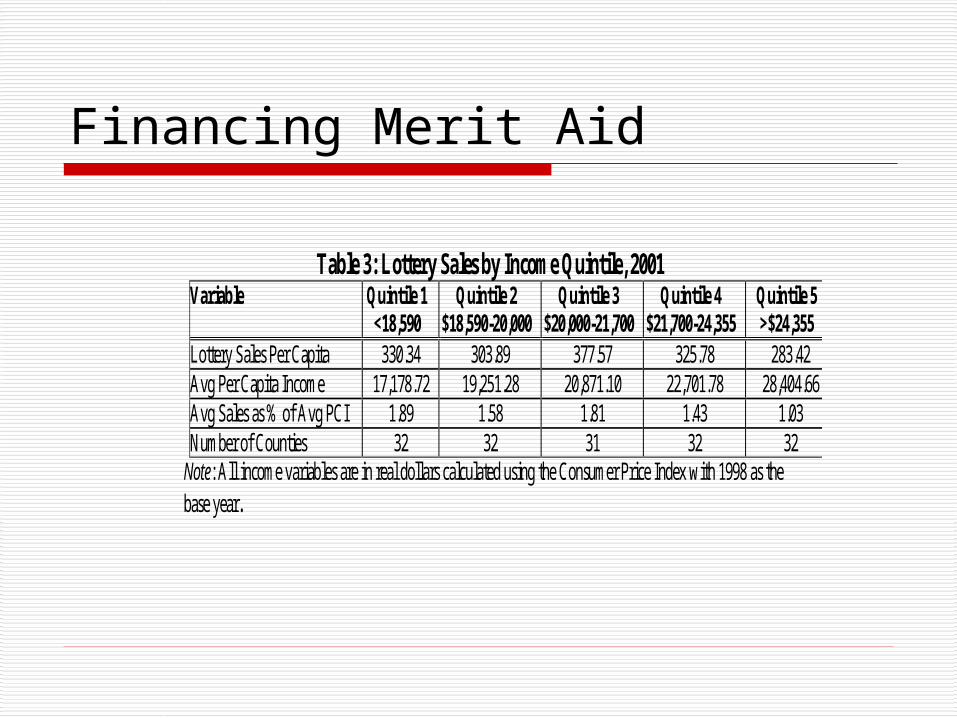
Table 3: Lottery Sales by Income Quintile, 2001 Variable Quintile 1
<18,590 Quintile 2
$18,590-20,000 Quintile 3
$20,000-21,700 Quintile 4
$21,700-24,355 Quintile 5 >$24,355
Lottery Sales Per Capita 330.34 303.89 377.57 325.78 283.42 Avg Per Capita Income 17,178.72 19,251.28 20,871.10 22,701.78 28,404.66 Avg Sales as % of Avg PCI 1.89 1.58 1.81 1.43 1.03 Number of Counties 32 32 31 32 32 Note: All income variables are in real dollars calculated using the Consumer Price Index with 1998 as the base year.

Financing Merit Aid
Lottery Sales by Black Population Quintile, 2001 Variable Quintile 1
< 10.8% Quintile 2
10.8-23.4% Quintile 3
23.4-31.0% Quintile 4
31.0-43.715% Quintile 5 >43.715%
Lottery Sales Per Capita 265.15 251.12 298.51 346.20 457.55 Avg Per Capita Income 22,418.97 23,115.69 20,728.42 20,574.47 21,565.53 Avg Sales as % of Avg PCI 1.20 1.14 1.44 1.70 2.24 Number of Counties 32 32 31 32 32

Financing Merit Aid

Financing Merit Aid

Financing Merit Aid

Enrollments
Group Overall4-Year Publics
4-Year Privates
2-Year Publics
2-Year Publics + Techs
All 5.9 9.0 13.0 ns ns
Whites 3.6 4.4 9.2 ns ns
Blacks 15.8 26.0 16.8 ns 11.6
Percentage Increases in Freshmen EnrollmentsAttributable to HOPE
By Institution Type and Race, 1988-97

Enrollments
Students in State
Residents in College Stayers
Out-of-Staters Leavers
Number 1216 280 840 376 -560
t-ratio 1.44 0.41 1.39 1.28 3.09
Out-of-State effect = Students in State – Stayers
Leavers effect = Residents in College – Stayers
HOPE Effects on Student MigrationNumbers of Recent Freshmen in 4-Year SchoolsBy Residency and Destination, 1988, 92, 94, 96

College Stratification

College Stratification

College Stratification
Quality Measure All University Comprehensive 4-Year
Mean SATM 6.2 9.4 ns ns
MeanSATV 4.9 14.3 6.9 ns
SATM sd ns -2.2 ns ns
SATV sd ns -3.5 ns 1.8
Top 10% ns 7.6 1.7 ns
Effects of HOPE on SAT Scores and Class RankBy Institution Type, 1989-2001

College Stratification
Quality Measure All University Comprehensive 4-Year
Acceptance Rate -7.5 -8.4 -3.6 -9.9
Yield Rate ns 4.1 ns 3.5
Effects of HOPE on Acceptance and Yield RatesBy Institution Type, 1989-2001

Academic AchievementCumulative UGA Freshmen GPA Distributions
Residents vs Non-Residents

Academic AchievementUGA Freshmen, by Residency and HOPE Status

Academic AchievementPercentage of Freshmen Completing a Full Load
Resident vs Non-Residents
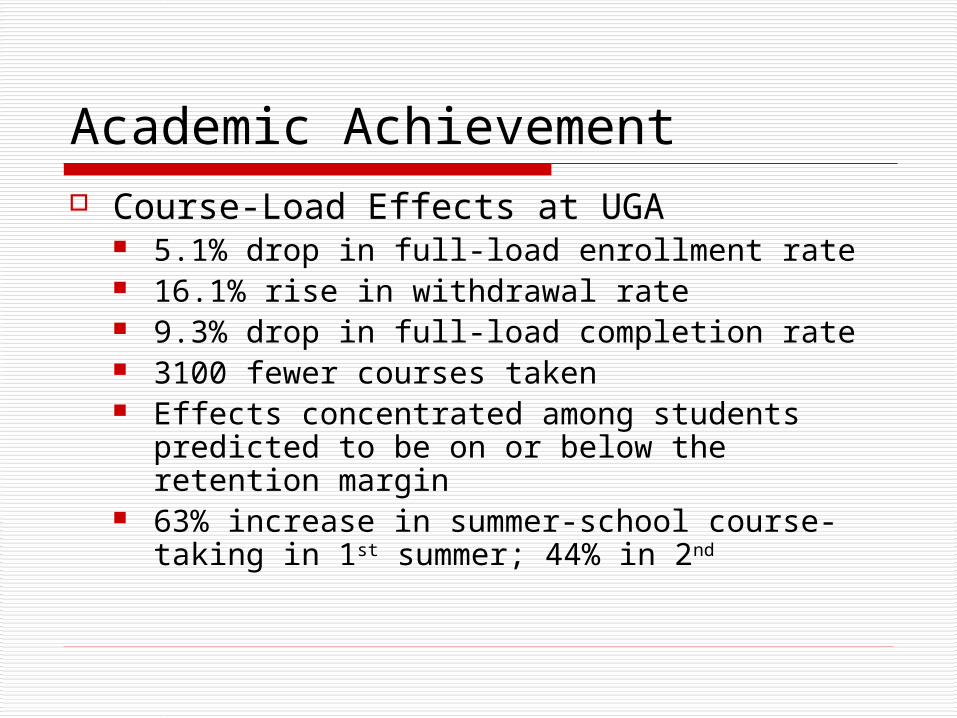
Academic Achievement Course-Load Effects at UGA
5.1% drop in full-load enrollment rate 16.1% rise in withdrawal rate 9.3% drop in full-load completion rate 3100 fewer courses taken Effects concentrated among students
predicted to be on or below the retention margin
63% increase in summer-school course-taking in 1st summer; 44% in 2nd
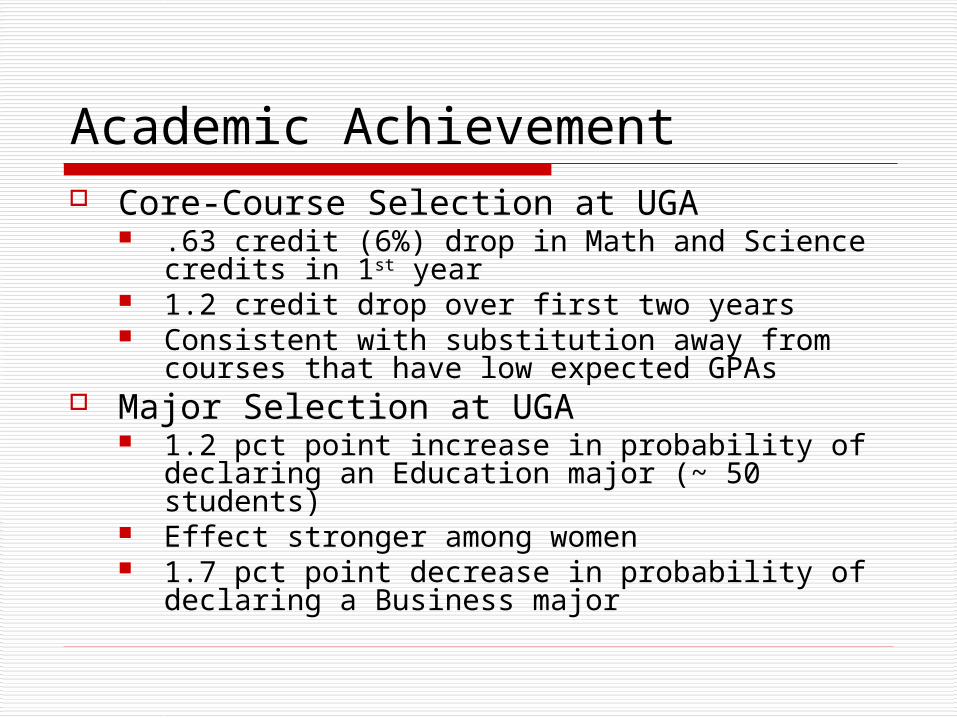
Academic Achievement Core-Course Selection at UGA
.63 credit (6%) drop in Math and Science credits in 1st year
1.2 credit drop over first two years Consistent with substitution away from courses
that have low expected GPAs Major Selection at UGA
1.2 pct point increase in probability of declaring an Education major (~ 50 students)
Effect stronger among women 1.7 pct point decrease in probability of declaring
a Business major
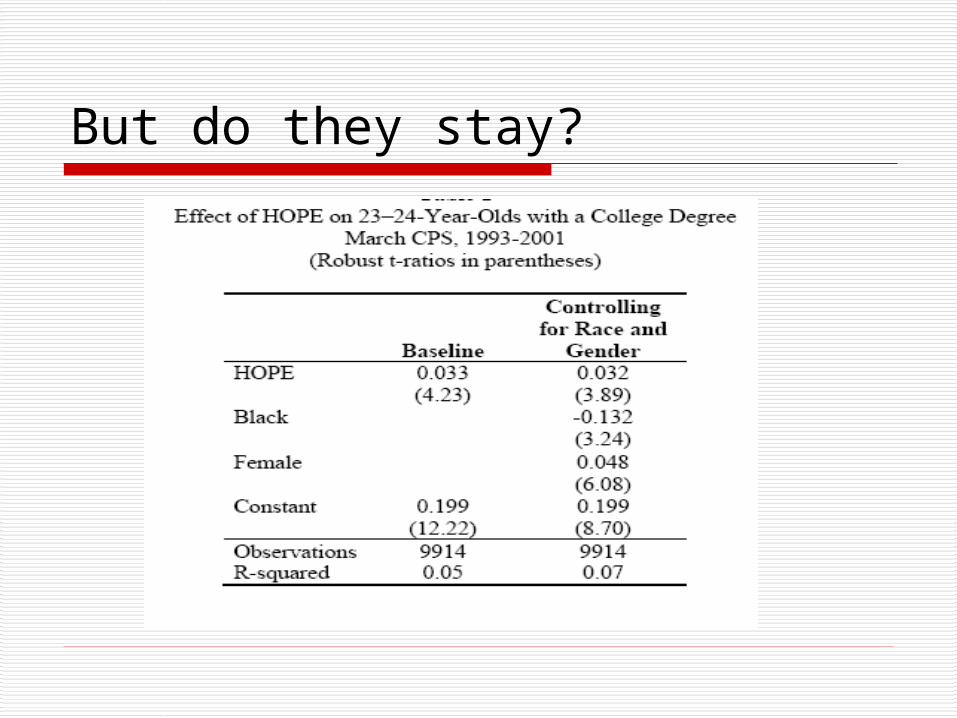
But do they stay?

More on HOPE
http://www.terry.uga.edu/hope/