Technology and Economic Assessment Panel. 2018 Assessment ...
Du Toit & Cloete PRRES PAPER 2003
APPRAISAL OF THE FISCHER-DIPASQUALE-WHEATON (FDW) REAL ESTATE MODEL AND DEVELOPMENT OF AN INTEGRATED PROPERTY AND ASSET MARKET MODEL
Authors: H du Toit
C E Cloete Affiliation: Department of Construction Economics
University of Pretoria Contact details:
Tel: 27-12 420-4545 Fax: 27-12 420-3598 E-mail [email protected]
Paper to be delivered at the
Pacific Rim Real Estate Society Ninth Annual Conference
19-22 January 2003 Brisbane Australia
Abstract. This study presents an Integrated Property and Asset Market Model (IPAMM) for South African property markets. IPAMM simulates the interrelationships between property and asset markets in a diagrammatic quadrant model configuration. The Fischer-DiPasquale-Wheaton (FDW) real estate model is presently the best documented and arguably the most advanced diagrammatic quadrant real estate model available. An appraisal of the FDW real estate model therefore served as basis for the development of IPAMM. IPAMM is essentially a regression model based on a system of stochastic equations. As such, it is not merely a diagrammatic exposition, but also a quantified mechanism that captures the interrelationships between property and asset markets. The model advances beyond mere conceptualisation of these relationships to a quantified interpretation and application of the theoretical premises of modern-day economics that represent the micro-foundations of economic behaviour in property and asset markets. This paper provides a concise overview of research findings that culminated in the development of an integrated property and asset market model for South African property markets, utilising the City of Pretoria office market as case study.
INTRODUCTION Viezer (1999, p.503) aptly states that, “(i)n the past, academics and investment managers have had difficulty in linking information from the markets for leasable space and asset ownership claims. The former is often referred to as the ‘space market’ and the latter as the ‘capital market.’ For almost fifteen years, academics have attempted to analytically integrate these two markets”.
1

Du Toit & Cloete PRRES PAPER 2003
The above statement more than typifies the scenario in the South African market, where there is an absolute void in research and analysis concerning the interplay between property and asset markets. The development of theIPAMM therefore provides pioneering research in this particular field of model development. In the context of the above, this paper provides a concise overview of research findings in terms of the following headings: ! Literature review ! Reconstruction of the FDW Model ! Development of an Integrated Property and Asset Market Model (IPAMM) for South African property markets ! Appraisal of the integrated property and asset market concept ! Application possibilities ! Possible improvements and opportunities for further research. BACKGROUND TO THE FDW MODEL Hendershott and Ling (1984) co-authored the first article that attempted to integrate real estate space and capital markets. This model evaluated investment value responses to tax code alterations in a dynamic programming algorithm that used a traditional discounted cash flow equation with assumed parameters. In 1987, Corcoran graphically illustrated the two interdependent markets and distinguished between short- and long-run supply of space. The next set of refinements comprised an “… elegant diagrammatic exposition in three similar articles: Fisher (1992), DiPasquale and Wheaton (1992) and Fisher, Hudson-Wilson and Wurtzebach (1993)” (Viezer, 1999, p.504). Viezer collectively refers to these models as the diagrammatic model. The most recent, formally published development in the field of diagrammatic integrated property and asset market models, is a quantitative version of the DiPasquale Wheaton model (1992) that was published on the Curtin Business School website in 1999 (www.cbs.curtin.edu.au). An accompanying article, co-authored by Fischer, DiPasquale and Wheaton (hence the term FDW Model) described this model briefly. The FDW model conceptualises the interrelationships between the following four markets: ! Market for space ! Asset valuation ! Construction sector ! Stock adjustment. The research on which this paper is based focused on an assessment of the FDW model, with the aim to determine its relevance in general and, more specifically, its applicability to the South African market. Implicit to achieving this aim, is an in-depth analysis of the theoretical premises and fundamental assumptions on which the FDW model is based. A firm grasp of these aspects is a prerequisite for a thorough evaluation of the model and the subsequent development of an integrated property and asset market model applicable to the South African economic environment, based on a system of stochastic equations. Hence, the research commenced with an assessment of the FDW model.
2

Du Toit & Cloete PRRES PAPER 2003
RECONSTRUCTION OF THE FDW MODEL DEFINING THE MODEL The FDW Model is a static, quadrant model that traces the relationships between real estate market and asset market variables, as well as the adjustments that take place to establish equilibrium in the supply of and demand for real estate (refer to Figure 1). The model is founded on the principles of demand and supply modeling: therefore, the demand to own real estate assets must equal its supply (DiPasquale and Wheaton, 1996 p.6). Hence, the primary objective of the model is to determine market equilibrium: i.e. the amount of floor space demanded and offered at a given price level or rent. In equilibrium, the supply of real estate space should be equal to demand at a specific price level (Quadrant 1). The price paid for real estate assets by an investor is a function of real or imputed rent (Achour–Fischer, 1999, p.34). Rent is translated into property values when, in the capital market, rentals are capitalised at an appropriate capitalisation rate (Quadrant 2). The difference between property values and replacement cost per unit triggers the supply of new development (Quadrant 3). Even in strictly static conditions, a certain level of construction is required to maintain stock at the required equilibrium: a portion of stock is always subject to demolition, withdrawal or deterioration (Quadrant 4). Adjusted stock, i.e. new construction less losses, is converted into a long-run stock of real estate space (back to Quadrant 1). Figure 1: The Quadrant FDW Model
Asset valuation P = R/i
Rent2
Price ($)
1
Stock (sq ft)
Market for space D(R, Economy) = S
Construction sector
P = f(C)
3 Construction (sq ft)
4
Stock adjustment S = C/d
Source: DiPasquale and Wheaton, 1996 RECONSTRUCTION OF THE FDW MODEL From the outset, reconstruction of the FDW Model proved to be challenging due to a number of factors. Most notably, the particular website on which the model was originally published, and more specifically the FDW Excel Model, could not be accessed. This meant that the FDW model had to be reconstructed.
3

Du Toit & Cloete PRRES PAPER 2003
Published literature on the FDW Model, in particular the textbook, is quite laconic on the system of spreadsheet equations and data sets that were utilised in the Perth office market example. Furthermore, literature sources are, in some instances, inconsistent and confusing. (Achour-Fischer, for example, ambiguously quotes the total demand for space in one instance as a square meter value and in another as a square feet value (1999, p. 40). The same page quotes the total stock demand as “1 600 000 millions square meters”, whereas the actual value is 1.6 million square meters). Complete data sets are not shown in the literature. This problem is complicated by the fact that formulae quoted in the literature are shown in processed format. Hence, figures and parameters could not be derived directly from these formulae. Efforts that were made to address data constraints included, inter alia, communication with original designers and authors of relevant publications on the FDW Model via e-mail. and communication with tertiary educational institutions at which the above mentioned authors are affiliated, with no success. The data problem was subsequently addressed as follows. Information was gleaned from a combination of sources, including the textbook and relevant articles. Data applicable to Quadrant 1 was obtained from the article by Achour-Fischer (1999, pp. 40 – 41). In Quadrant 2, an assumption had to be made concerning the market capitalisation rate. The second data limitation was encountered in Quadrant 3, where an assumption had to be made concerning the minimum rate required to initiate new construction. The depreciation rate (Quadrant 4) that had been applied to determine the total long term stock supply was obtained from the text book (DiPasquale and Wheaton, 1996, p.10). In most instances, the output from one quadrant provided input to the next. Due to the fact that a relatively complete data set was available for Quadrant 1, the model could be reconstructed quadrant for quadrant. In so doing, workable data sets were generated. MODEL RESULTS Table 1 summarises and compares the results obtained by means of the reconstructed FDW Model and data quoted in published literature. In terms of the literature, the Perth office market is in equilibrium at a rental rate of $201.78/m²/annum. At this rate, there is a total demand for 1.64 million square meters of office floor space. Based on reconstructed data, market equilibrium was modeled at a rental rate of $199.69/m²/annum, which translates into a total demand for 1.65 million square meters of office floor space. Table 1: Comparison of Reconstruction results and Data quoted in published literature
Variable Literature FDW1 Reconstructed FDW2 Variance (%) Total long run stock (m²) 1 644 444 1 650 295 0.35 Annual rent per unit ($/m²) 201.78 199.69 1.05 Price of construction ($/m²) Not shown 1 815.32 n/a Annual new construction (m²) 16 444 16 503 0.35
Average - - 0.6
Source: 1 Achour-Fischer, 1999, pp. 40 – 41
2 Reconstructed FDW Model, April 2002
4

Du Toit & Cloete PRRES PAPER 2003
Model results that were obtained by means of the above mentioned exercise revealed a statistical variance of 0.6% from the findings of the original Perth office market example. Based on these results, the proforma spreadsheets were deemed to be sufficiently accurate to apply as basis for the development of an Integrated Property and Asset Market Model for the City of Pretoria. NATURE OF APPLICATIONS DiPasquale and Wheaton state that the FDW Model can “… trace the various impacts of the broader economy on the real estate market. The economy can grow or contract. Long-term interest rates or other factors can shift the demand for real estate assets. Change in short-term credit availability or local regulations can alter the cost of supplying new space. Each has different repercussions, and these are easily determined by examining alternative solutions within the quadrant diagram. In each case, one can identify which quadrant is initially affected, trace the impacts through the other quadrants, and arrive at a new long-run equilibrium. This comparison of long-run solutions (market equilibrium) in a model is called “comparative static” analysis” (1996, p.11). According to Dernburg (1985, p.21), “… such analysis does not attempt to ask how the variable behaves during the transition from one equilibrium to another, how long it will take to get to the new equilibrium, or whether it will in fact get there or possibly depart in another direction; these issues are matters of “dynamic” analysis. A dynamic model is one that explicitly makes assumptions about how variables behave when they are not of equilibrium.” It is important to note that the FDW Model is designed for comparative static analysis. Tracing the effects of single variate or multi-variate manipulations through the various quadrants of the model can simulate market conditions. It was, however, pointed out under the preceding paragraph that the model does not account for time lags that invariably occur in the process of re-adjusting to market equilibrium. These dynamic aspects fall outside the ambit of the FDW Model. Subsequent paragraphs provide insight into each quadrant of the model and the effect(s) of endogenous and exogenous variances on each of the four markets. CONCLUDING REMARKS ON THE FDW MODEL In summary, the following can be concluded with respect to the FDW Model: 1. The model provides a framework that illustrates the relationship between real estate use and real estate
assets. This framework illustrates, inter alia, the inverse relationship between short term real interest rates and property values.
2. Single variate shifts seldom occur and it is more likely the case that economic events cause several
shifts to occur simultaneously. For example, if the economy contracts, employment creation slows down and short term interest rates tend to rise. It is therefore more likely that multivariate shifts will occur in the model. Although this results in a more complex analysis, the net result is still a combination of the impacts of each individual shift.
3. The model presents a framework that illustrates the effect of exogenous changes on new equilibria.
5

Du Toit & Cloete PRRES PAPER 2003
However, the model does not give an accurate account of the intermediate stages of market adjustment. Hence, time lags that commonly occur are not accounted for.
DEVELOPMENT OF AN INTEGRATED PROPERTY AND ASSET MARKET MODEL FOR SOUTH AFRICAN MARKETS The next phase of the research initiative applied the reconstructed FDW Model framework to develop an Integrated Property and Asset Market Model for the City of Pretoria. Historic office market data was utilised for a specific time period (1997). The use of historic data facilitated comparison between model results and factual data, i.e. results of a modeling exercise based on market data could be compared to actual market conditions that were known to have prevailed at that particular point in time. Hence, availability of secondary data facilitated model calibration. For the purposes of this analysis, the Pretoria office market was selected as case study. Map 1 contextualises the City of Pretoria in relation to the Tshwane metropolitan area. The study focuses on formal office space, including all grades of office floor space in the CBD and decentralised locations. The study excludes office space in the form of dwelling house offices, as well as office space ancillary and subservient to retail and industrial land uses. This section describes the IPAMM development process and subsequent findings in terms of the following aspects: ! Model assumptions ! Data specifications and modeling ! Nature of applications ! Introducing impacts to the model ! Scenario modeling ! Interpretation of results and validity of findings. GENERAL ASSUMPTIONS AND ECONOMIC FUNDAMENTALS Neither the textbook by DiPasquale and Wheaton, nor the articles published on the FDW Model describe or identify the assumptions, limitations and parameters on which the model is based. Hence, these assumptions were determined by means of deductive logic. The textbook does, however, indicate that the reader needs to be reacquainted with the principles of “… simple supply and demand analysis” (DiPasquale and Wheaton, 1992, p.2). This suggests that the assumptions on which the model is based can be traced to the roots of the economic laws of demand, supply, equilibrium and market competition. These laws are briefly outlined below and serve as basis for the identification of further assumptions on which the FDW Model is based. The law of demand states that if the price of a product decreases while all other factors remain constant, the quantity of that product demanded in the market will increase, and vice-versa (see e.g. Lombard, Du Pisanie and Steyn, 1986, p.23 and Samuelson, 1980, pp.53-55). The position of the market demand curve is also determined by other factors, such as: ! Consumer tastes
6

Du Toit & Cloete PRRES PAPER 2003
! Consumer incomes ! The price level of other commodities (Mansfield, 1988, pp.22-23). Map 1: City of Pretoria
7
Du Toit & Cloete PRRES PAPER 2003
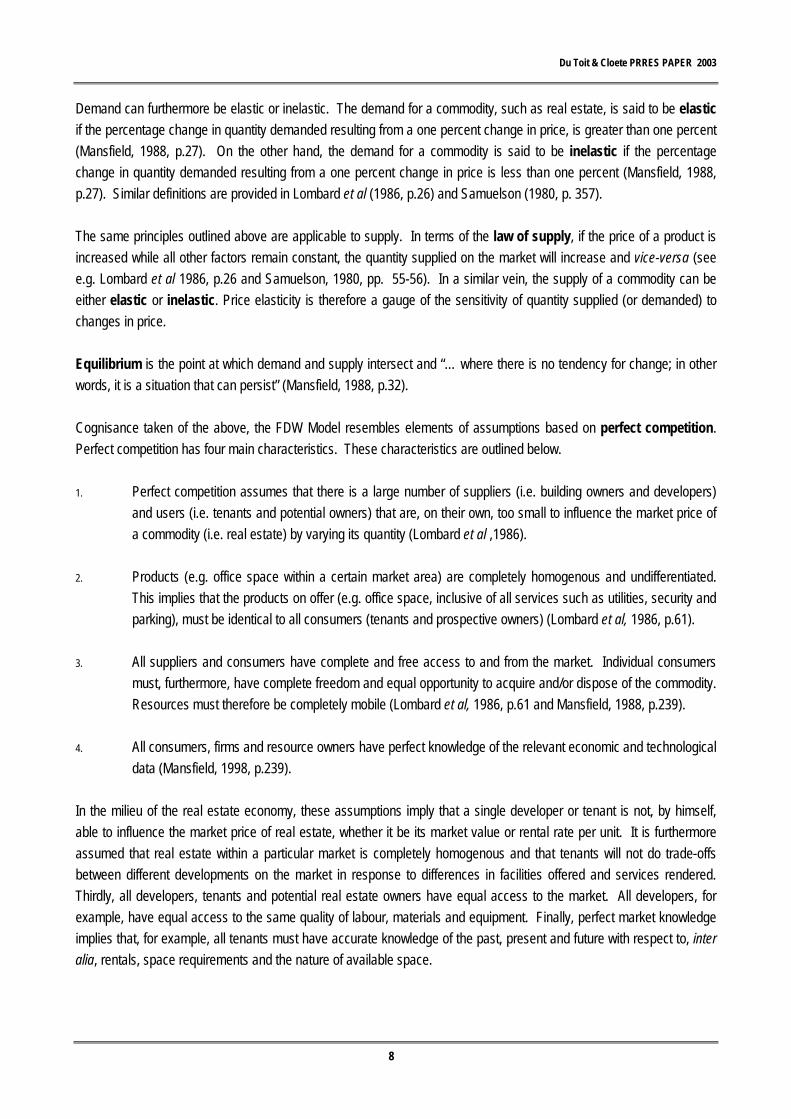
Demand can furthermore be elastic or inelastic. The demand for a commodity, such as real estate, is said to be elastic if the percentage change in quantity demanded resulting from a one percent change in price, is greater than one percent (Mansfield, 1988, p.27). On the other hand, the demand for a commodity is said to be inelastic if the percentage change in quantity demanded resulting from a one percent change in price is less than one percent (Mansfield, 1988, p.27). Similar definitions are provided in Lombard et al (1986, p.26) and Samuelson (1980, p. 357). The same principles outlined above are applicable to supply. In terms of the law of supply, if the price of a product is increased while all other factors remain constant, the quantity supplied on the market will increase and vice-versa (see e.g. Lombard et al 1986, p.26 and Samuelson, 1980, pp. 55-56). In a similar vein, the supply of a commodity can be either elastic or inelastic. Price elasticity is therefore a gauge of the sensitivity of quantity supplied (or demanded) to changes in price. Equilibrium is the point at which demand and supply intersect and “… where there is no tendency for change; in other words, it is a situation that can persist” (Mansfield, 1988, p.32). Cognisance taken of the above, the FDW Model resembles elements of assumptions based on perfect competition. Perfect competition has four main characteristics. These characteristics are outlined below. 1. Perfect competition assumes that there is a large number of suppliers (i.e. building owners and developers)
and users (i.e. tenants and potential owners) that are, on their own, too small to influence the market price of a commodity (i.e. real estate) by varying its quantity (Lombard et al ,1986).
2. Products (e.g. office space within a certain market area) are completely homogenous and undifferentiated.
This implies that the products on offer (e.g. office space, inclusive of all services such as utilities, security and parking), must be identical to all consumers (tenants and prospective owners) (Lombard et al, 1986, p.61).
3. All suppliers and consumers have complete and free access to and from the market. Individual consumers
must, furthermore, have complete freedom and equal opportunity to acquire and/or dispose of the commodity. Resources must therefore be completely mobile (Lombard et al, 1986, p.61 and Mansfield, 1988, p.239).
4. All consumers, firms and resource owners have perfect knowledge of the relevant economic and technological
data (Mansfield, 1998, p.239). In the milieu of the real estate economy, these assumptions imply that a single developer or tenant is not, by himself, able to influence the market price of real estate, whether it be its market value or rental rate per unit. It is furthermore assumed that real estate within a particular market is completely homogenous and that tenants will not do trade-offs between different developments on the market in response to differences in facilities offered and services rendered. Thirdly, all developers, tenants and potential real estate owners have equal access to the market. All developers, for example, have equal access to the same quality of labour, materials and equipment. Finally, perfect market knowledge implies that, for example, all tenants must have accurate knowledge of the past, present and future with respect to, inter alia, rentals, space requirements and the nature of available space.
8

Du Toit & Cloete PRRES PAPER 2003
In addition to the above mentioned economic laws of supply and demand, diagrammatic quadrant models such as the FDW model and IPAMM are generally based on the following assumptions that are more specific to the real estate environment: 1. The capitalisation technique provides a basic and acceptable mechanism to model the inverse relationship
between interest rates and property values. 2. There is a definitive minimum rate, expressed as construction cost per unit (e.g. R/m2) that will trigger new
development. 3. Even in strictly static conditions, a certain minimum level of construction is required to maintain equilibrium in
the supply of space. This can be ascribed to the fact that a portion of stock is always subject to demolition, withdrawal or deterioration. The model assumes that these losses can be measured and expressed in terms of a depreciation rate, which is a constant percentage of the existing stock in a static model (Achour–Fischer, 1999, p.37).
4. The model assumes a straight-line simplication of the relationship between relevant variables in each
quadrant. 5. In effect, the model is insensitive to the nature and structure of the construction industry and its local
idiosyncrasies. 6. It is assumed that there is a determinable ratio of labour to floor space utilisation rate in each real estate
market. For example, in the offices sector, the average office worker occupies 20m2. Independent studies, for example Hakfoort and Lie (1996, pp.183-196), have verified that there is a distinct utilisation rate for each real estate market (e.g. offices and retail) and, furthermore, that these ratios differ for each geographic market area.
7. The model assumes that development is mainly private sector driven. The effects of land grants and other
types of government incentives that impact on real estate markets are not factored into the model. It may, however, be argued that such grants and incentives influence local economic activity in a certain geographic area and that the indirect effects thereof are factored into the model via Quadrant 1.
8. Due to the interactive way in which the quadrants are linked, the model may create the impression that there
are no time lags involved in the process of re-adjusting to equilibrium. 9. As far as the relevance and applicability of the model is concerned in a market dominated by owner-occupied
real estate, it is assumed that the decisions of owner-occupiers and tenants are influenced by the same economic and capital market conditions; that these owner-occupiers have the same investment motives as tenants; and that the model therefore behaves identical in both types of markets (DiPasquale and Wheaton, 1996, pp. 10-11).
9
Du Toit & Cloete PRRES PAPER 2003
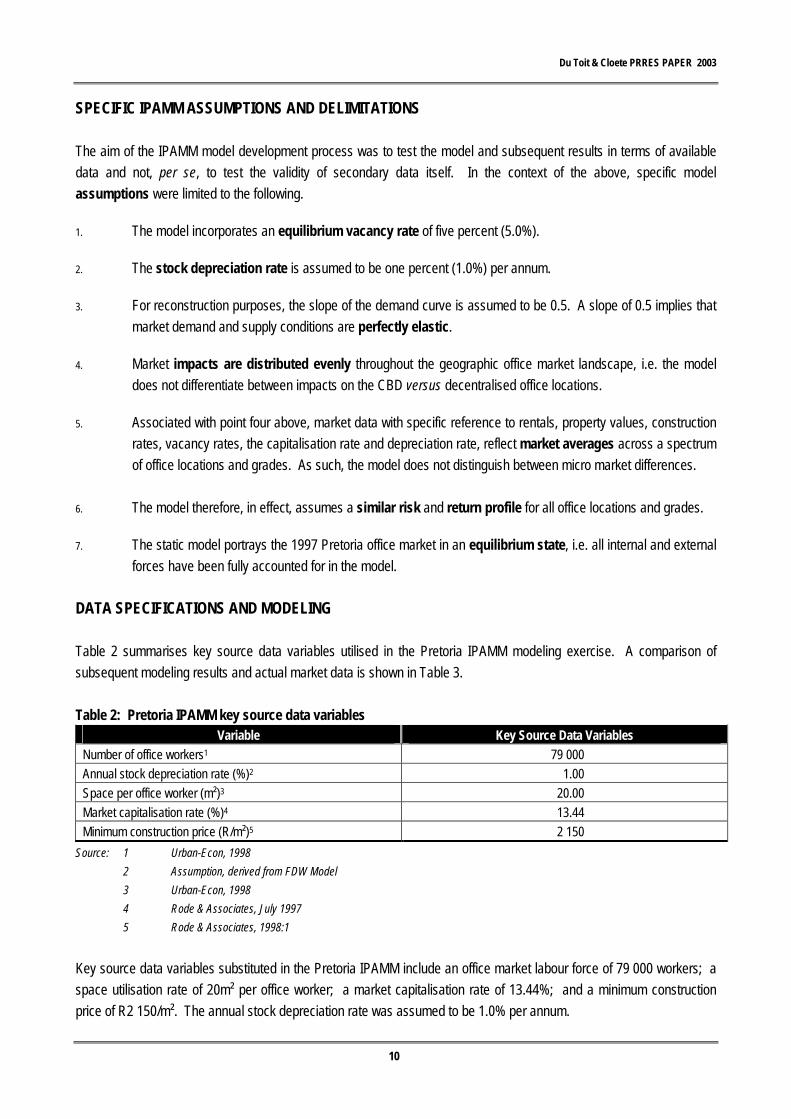
SPECIFIC IPAMM ASSUMPTIONS AND DELIMITATIONS The aim of the IPAMM model development process was to test the model and subsequent results in terms of available data and not, per se, to test the validity of secondary data itself. In the context of the above, specific model assumptions were limited to the following. 1. The model incorporates an equilibrium vacancy rate of five percent (5.0%). 2. The stock depreciation rate is assumed to be one percent (1.0%) per annum. 3. For reconstruction purposes, the slope of the demand curve is assumed to be 0.5. A slope of 0.5 implies that
market demand and supply conditions are perfectly elastic. 4. Market impacts are distributed evenly throughout the geographic office market landscape, i.e. the model
does not differentiate between impacts on the CBD versus decentralised office locations. 5. Associated with point four above, market data with specific reference to rentals, property values, construction
rates, vacancy rates, the capitalisation rate and depreciation rate, reflect market averages across a spectrum of office locations and grades. As such, the model does not distinguish between micro market differences.
6. The model therefore, in effect, assumes a similar risk and return profile for all office locations and grades. 7. The static model portrays the 1997 Pretoria office market in an equilibrium state, i.e. all internal and external
forces have been fully accounted for in the model. DATA SPECIFICATIONS AND MODELING Table 2 summarises key source data variables utilised in the Pretoria IPAMM modeling exercise. A comparison of subsequent modeling results and actual market data is shown in Table 3. Table 2: Pretoria IPAMM key source data variables
Variable Key Source Data Variables
Number of office workers1 79 000 Annual stock depreciation rate (%)2 1.00 Space per office worker (m²)3 20.00 Market capitalisation rate (%)4 13.44 Minimum construction price (R/m²)5 2 150
Source: 1 Urban-Econ, 1998 2 Assumption, derived from FDW Model 3 Urban-Econ, 1998 4 Rode & Associates, July 1997 5 Rode & Associates, 1998:1
Key source data variables substituted in the Pretoria IPAMM include an office market labour force of 79 000 workers; a space utilisation rate of 20m² per office worker; a market capitalisation rate of 13.44%; and a minimum construction price of R2 150/m². The annual stock depreciation rate was assumed to be 1.0% per annum.
10

Du Toit & Cloete PRRES PAPER 2003
Main findings of the modeling exercise that were generated by substituting these variables in the Pretoria IPAMM are shown in Table 3. Prevailing market conditions (1997) include a total long run stock of 1 599 600m² at an average rental rate of R30.00/m². These market conditions compare favourably to Pretoria IPAMM results of 1 599 248m² at an average rental rate of R30.69/m² (refer to Annexure). Table 3: Comparison of Market data and Pretoria IPAMM results
Variable Market data Pretoria IPAMM Statistical Variance Rent per unit (R/m²) 30.00 30.69 2.30 Annual new construction (m²) 22 491 15 993 Not relevant Total long run stock (m²) 1 599 600 1 599 248 0.02
Average - - 1.2
Pretoria IPAMM modeling results are within a 0.02% to 2.30% statistical variance of actual market data. Taking cognisance of the macro level at which the Pretoria IPAMM simulation occurs, the variance between model results and prevailing market data is deemed to be negligible. Concerning the estimated level of annual new construction, it should be noted that the estimated level of annual new construction (15 993m²) in terms of the Pretoria IPAMM will not necessarily equate to actual new construction that occurred in the office market during 1997 (22 491m²). This can be ascribed to a number of factors including, inter alia, the following: ! Pretoria IPAMM, as is the case with the FDW Model, assumes a straight-line simplification of the
construction function. In practice, the construction sector reveals cyclical tendencies that do not adhere to simplified, puristic and constant supply assumptions.
! Pretoria IPAMM simulates an equilibrium level of annual new construction that is required to satisfy
equilibrium demand. The equilibrium vacancy rate of 5.0% does not reflect construction induced vacancy. Furthermore, the construction sector is typified by phases of overbuilding as a consequence of, inter alia, speculative development. Subsequent phases are characterised by reduced levels of building activity during which the take-up rate of available space increases. Actual construction levels are therefore influenced by a number of factors to which the model is insensitive, including construction levels that are artificially inflated or deflated by subjective, end-user decision-making processes; and excess, construction-induced stock capacity in the market.
! The FDW Model, and hence the Pretoria IPAMM, is not sensitive to the nature and structure of the
construction industry and its local idiosyncrasies. The model does therefore not necessarily reflect the uniqueness of localised micro market conditions.
In the context of the above, it follows that a direct comparison of estimated annual new construction and actual construction in the market should acknowledge the nature and structure of the construction industry.
11

Du Toit & Cloete PRRES PAPER 2003
INTRODUCING IMPACTS TO IPAMM AND SCENARIO MODELING The objective of this section is to illustrate the combined effect of impacts that typically occur in, respectively, property and asset markets. These impacts occur as the result of a complex sequence of processes, linkages and decisions in the market. Roulac (1996, pp. 323-346) provides a strategic real estate framework that aims to identify and describe these processes, linkages and decisions. The property and asset markets reflect a series of strategy interactions between users and suppliers of space, resulting in real estate transactions (Roulac, 1996, p.337). Roulac maintains that market participant transaction decisions “… starts with the decisions by developers and deal makers considering the critical sell-or-buy, build-new-or-buy-existing deal initiative, set off against the space users’ decision to rent or buy, and if buy, to purchase existing property or build a new structure” (1996, p. 337). Roulac furthermore argues that the “… confluence of the initiatives and decisions of those who utilise space with those who are involved in creating and controlling it are filtered through a series of transaction interaction forces, including: ! Property market conditions ! Space user strategies, resources and priorities ! Competing investment performance ! Service provider and developer/deal-maker initiatives ! Capital market conditions ! Economic activity ! Business consumer confidence ! Public sector policies, priorities and programmes” (1996, pp. 337, 345). The net effect of these interacting forces can be traced to financial input-output relationships in the property and asset market. It is these aspects that the FDW model aims to illustrate. The above mentioned study by Roulac identifies important factors that affect property and asset market equilibrium. Fisher (1992, pp. 161-180) developed a framework that identifies and categorises a number of macro factors that influence this equilibrium state. The framework within which these macro changes occur, and its relation to user and capital market equilibrium is illustrated in Diagram 1. In this diagram, Fisher (1992, pp. 163-166) identifies spatial and non-spatial macroeconomic impacts that influence the supply of and demand for real estate space and real estate assets. Diagram 1 illustrates that these impacts on the model are influenced by, inter alia, aspects such as international oil prices, the level of industrial production, defense spending, export earnings, inflation, exchange rates, interest rates and tax law changes. In addition to these macro aspects, the model is also influenced by local market real estate dynamics, including current rents, expected rents, vacancy, absorption rate, risk, return and investors’ portfolios (Fisher, 1992, p.164).
12

Du Toit & Cloete PRRES PAPER 2003
Diagram 1: Factors affecting Space and Capital Market Equilibrium
Macro Factors Spatial Non-Spatial Oil Prices
Industrial production Defense spending Farm income Net exports
Unexpected inflation Change in term structure Market risk structure Exchange rates Tax law changes
Spatial distribution Employment, income,
population
Demand for capital assets (with different risk characteristics)
Demand for space Services by users
Land & improvements Franchise agreements
Leases with other tenants, etc
Capital Market Equilibrium
Existing supply of all capital assets (covariance of return with factors)
Stock in corporations that own real estate Direct investment in real estate equity (leases and residuals) Mortgages and hybrid mortgages Various types of real estate securities All other capital assets (bonds, government securities, etc in the US and rest of universe) Investors hold optimal portfolios
Risk premium for relevant factors
Space Market Equilibrium
Expected return (discount rates and capitalisation rate) for real estate
Existing supply (type location) Current vacancy
Equilibrium rental rate Expected rents Expected vacancy Expected absorption Riskiness of rent (covariance of rent with factors)
Construction or replacement cost (including land)
Fee simple value of property (Unencumbered by leases)
(Market financing) Value of existing
leases Value of residual (lease renewals and reversion)
Value of special financing
Source: Fisher, 1992, p.164
Expected new space
Equal in long-run equilibrium
13
Du Toit & Cloete PRRES PAPER 2003
According to DiPasquale and Wheaton (1992, pp. 190-197 and 1996, pp. 10-18), these aspects culminate in three broad impacts on the FDW Model. These impacts are: ! Economic growth and the demand for real estate use ! Long term interest rates and the demand for real estate assets ! Short term credit availability, construction costs and the supply of new space. Fluctuations in these variables can result in either a proportionate shift, a disproportionate shift or a unilateral shift in a specific quadrant of the model (also refer to AIREA, 1987, pp. 34-39). Each impact has different repercussions on the model. In each case, the quadrant that is initially affected should be identified. These impacts can then be traced through each of the other three quadrants. This comparison of different long-run solutions, also referred to as market equilibrium, in a model in called comparative static analysis (DiPasquale and Wheaton, 1996, p.11). The impact of these external impacts on the model is subsequently discussed. Economic growth and the demand for real estate use Economic growth, in terms of the FDW Model, translates into increased production, employment, household income or the number of households (DiPasquale and Wheaton, 1992, pp.190-193 and 1996, pp.11-13). Depending on which of these variables define the parameters for the demand curve (Quadrant 1), the curve will respond by means of a unilateral movement outwards. The term unilateral indicates that only the demand curve will shift. Initially, only Quadrant 1 is affected. An economic expansion of this nature will have the effect that more space is demanded at current rents. Supply is relatively static over the short term. In terms of the laws of supply and demand, increased demand against fixed supply will therefore force rental upward. Higher rentals translate into greater asset prices (Quadrant 2) that, in turn, encourages new construction (Quadrant 3). Over time, new construction increases available stock (Quadrant 4) and the market tends toward a new equilibrium state. The shift in equilibrium brought about by an economic expansion need not necessarily be a proportional shift: the nature of the shift that occurs is a function of the elasticity and hence, slopes of the various curves. An economic expansion therefore increases all equilibrium variables in real estate markets. In general, a recession is characterised by higher vacancy and lower levels of construction, whilst during an economic recovery, vacancy is lower and construction activity increases (DiPasquale and Wheaton, 1996, p.13). Caution should be taken not to generalise this statement. Independent research (Pyhrr et al., 1989, pp. 485-489) indicates that a period of overbuilding in the real estate cycle, which typically follows an economic expansion, is initially accompanied by higher than normal vacancy rates. Thereafter, as take-up increases, vacancy decreases. This state is maintained into the initial phases of an economic recession, when construction activity declines and space utilisation increases. These findings therefore suggest exactly the opposite: during an economic expansion, new construction leads to higher vacancy and vice versa. It should, however, be noted that prolonged periods of economic recession, accompanied by a general decline in business growth, will eventually lead to higher vacancy.
14
Du Toit & Cloete PRRES PAPER 2003
The FDW Model does, however, not give an accurate account of these intermediate stages of market adjustment. Hence, as duly noted, models designed for the purpose of comparative static analysis do not describe the behaviour of variables during the transition from one equilibrium to another. This shortcoming needs to be borne in mind when interpreting and applying the FDW Model. Long Term Interest Rates and the Demand for Real Estate Assets The demand for real estate assets is determined by real estate yields in relation to the after tax yield of fixed income securities and other investments. Aspects such as long term interest rates, growth in rentals, risk and taxation influence real estate yields. These aspects are reflected in the capitalisation rate. These parameters influence the slope of the curve in Quadrant 2. If interest rates in the economy rise, the capitalisation rate rises and investors demand a higher return from real estate. Higher returns can not be realised from current rents and the yield from real estate becomes low relative to other investment options. Investors will therefore shift their funds from real estate to other investments in their portfolios. Under these conditions, the capitalisation rate rises and the curve in Quadrant 2 rotates in a clockwise direction, lowering real estate asset prices. Greater perceived risk and adverse tax changes have a similar effect on the curve in Quadrant 2. The converse may also occur, causing asset prices to rise. Due to lower asset prices, construction activity contracts (Quadrant 3) and this decreases the annual supply of new construction. In the long run, less stock comes onto the market (Quadrant 4), forcing rentals upward (Quadrant 1). Higher rent levels bring the market into equilibrium. The text book assumes that capital market efficiency adjusts the prices of particular assets and that each investment therefore earns a common, risk-adjusted after-tax total rate of return (DiPasquale and Wheaton, 1996, p.14). Short Term Credit Availability, Construction Costs and the Supply of New Space Short term credit availability and construction costs influence the supply schedule for new construction (Quadrant 3). Construction costs may rise due to a number of factors. These factors include, inter alia, higher short term interest rates, scarcity of construction financing, and stricter zoning and planning regulations. If any of these factors deteriorate, construction costs rise and profitability declines, resulting in a unilateral outward shift of the construction function (refer to Figure 2.9). Therefore, the minimum value (R/m2) required to justify some level of new development increases. At current asset prices, construction activity will decrease, the annual level of new construction will decrease (Quadrant 3); the long term supply of stock will be relatively lower (Quadrant 4); rents will rise (Quadrant 1); and asset prices will rise (Quadrant 2), thereby bringing the market to a new equilibrium state.
15

Du Toit & Cloete PRRES PAPER 2003
IPAMM SCENARIO MODELING Preceding paragraphs predominantly focused on the simulation of an equilibrium state in property and asset markets. In practice, this equilibrium state is influenced by one or a combination of factors. Three scenarios were subsequently generated by means of the Pretoria IPAMM to illustrate the effect of typical market fluctuations on an equilibrium state. The following scenarios were generated: ! Scenario 1: Demand shift ! Scenario 2: Shift in capitalisation rate ! Scenario 3: Shift in construction costs. Each of these scenarios is subsequently discussed and conceptually illustrated. Pretoria IPAMM Scenario 1: Demand Shift The impact of a demand shift on the model is a function of the mathematical definition of the demand curve. An increase in demand may be ascribed to, inter alia, economic growth; natural population growth and subsequent growth in the number of qualified service sector employees; in migration of service sector employees to an economically prosperous region. In the Pretoria IPAMM, the demand curve is defined in terms of, inter alia, the number of office workers in the Pretoria economy. A demand shift was subsequently by means of an increase in the number of office workers. All other factors being equal, an increase in demand for office space causes the demand curve to shift in an easterly direction, from D1 to D2. The net effect of this demand shift is illustrated in Figure 2. The impact on market equilibrium can be summarised as follows: ! Due to an increase in the number of office workers, the demand for office space increases (Quadrant 1) ! At fixed short term stock supply levels, higher rentals can be demanded (Quadrant 1) ! Higher rentals result in an appreciation of asset values and prices (Quadrant 2) ! Higher asset values stimulate activity in the construction sector (Quadrant 3) ! New construction activity increases the long run supply of stock (Quadrant 4) ! Increased long run stock restores market equilibrium.
16

Du Toit & Cloete PRRES PAPER 2003
Figure 2: Demand shift in terms of the Pretoria Integrated Property and Asset Market Model
Asset valuation
P = R/i
Rent (R)
2
Value (R)
1
D1
Stock (m²)
Market for space
D(R, Economy) = S
D2
Construction sector
P = f(C)
3 Construction (m²)
4
Stock adjustment
S = C/d
Pretoria IPAMM Scenario 2: Shift in Capitalisation Rate In the second scenario, an increase in perceived investment risk in the market is factored into the Pretoria IPAMM by means of an increase in the market capitalisation rate. Higher capitalisation rates may be the consequence of higher real interest rates, or an increase in perceived investment risk in a specific area due to spatial and/or a-spatial factors. Figure 3: Shift in capitalisation rate in terms of the Pretoria Integrated Property and Asset Market Model
Asset valuation
P = R/i
V2 Rent (R)
V1 2
Value (R)
1
Stock (m²)
Market for space
D(R, Economy) = S
Construction sector
P = f(C)
3 Construction (m²)
4
Stock adjustment
S = C/d
17
Du Toit & Cloete PRRES PAPER 2003
An increase in the capitalisation rate rotates the asset valuation curve in a clockwise direction, from V1 to V2. The net effect of an increase in market risk on each of the Pretoria IPAMM quadrants is illustrated in Figure 3. The Pretoria IPAMM illustrates the net effect of this shift in the market capitalisation rate on property and asset market equilibrium as follows: ! Higher investment risk translates into a higher market capitalisation rate (Quadrant 2) ! In the short term, asset prices depreciate as other types of investments present more secure and lucrative
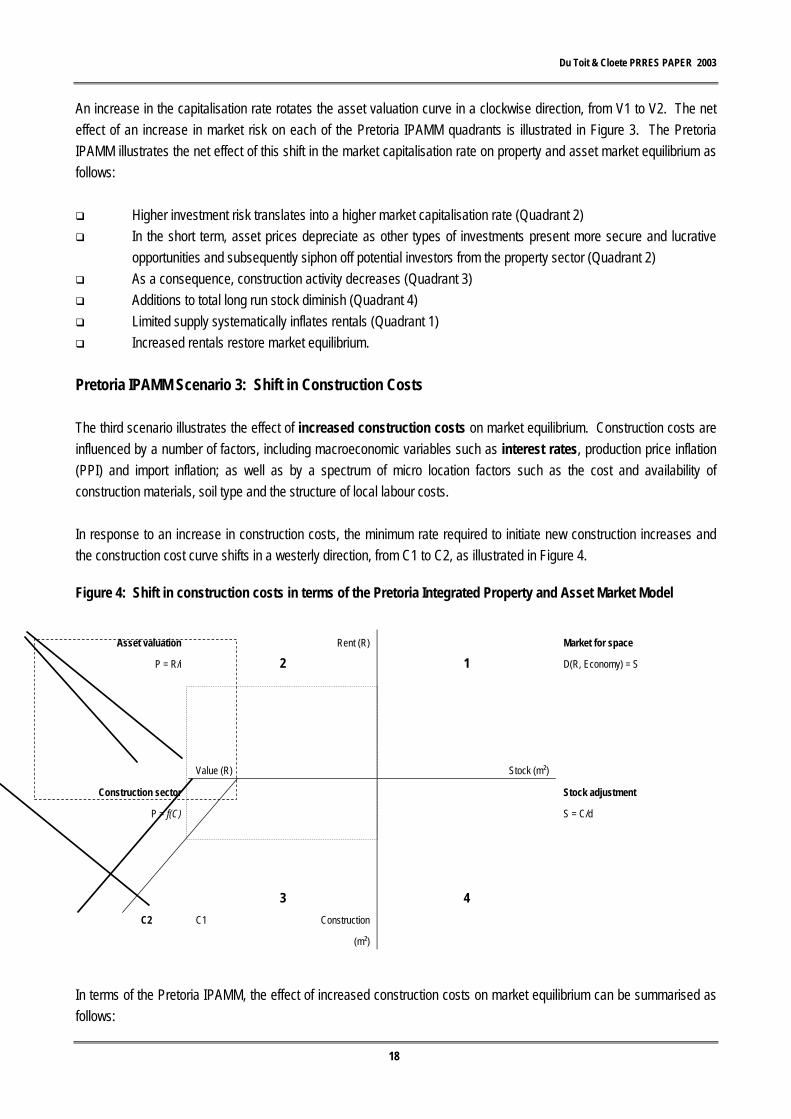
opportunities and subsequently siphon off potential investors from the property sector (Quadrant 2) ! As a consequence, construction activity decreases (Quadrant 3) ! Additions to total long run stock diminish (Quadrant 4) ! Limited supply systematically inflates rentals (Quadrant 1) ! Increased rentals restore market equilibrium. Pretoria IPAMM Scenario 3: Shift in Construction Costs The third scenario illustrates the effect of increased construction costs on market equilibrium. Construction costs are influenced by a number of factors, including macroeconomic variables such as interest rates, production price inflation (PPI) and import inflation; as well as by a spectrum of micro location factors such as the cost and availability of construction materials, soil type and the structure of local labour costs. In response to an increase in construction costs, the minimum rate required to initiate new construction increases and the construction cost curve shifts in a westerly direction, from C1 to C2, as illustrated in Figure 4. Figure 4: Shift in construction costs in terms of the Pretoria Integrated Property and Asset Market Model
Asset valuation
P = R/i
Rent (R)
2
Value (R)
1
Stock (m²)
Market for space
D(R, Economy) = S
Construction sector
P = f(C)
C2
3 C1 Construction
(m²)
4
Stock adjustment
S = C/d
18
In terms of the Pretoria IPAMM, the effect of increased construction costs on market equilibrium can be summarised as follows:

Du Toit & Cloete PRRES PAPER 2003
! Initially, the increase in construction costs stun construction activity (Quadrant 3) ! Additions to total long run stock diminish (Quadrant 4) ! Due to relatively fixed supply, market rentals escalate over time (Quadrant 1) ! A combination of reduced supply and increased rentals, inflate existing asset values and prices (Quadrant 2) ! Inflated asset values justify new construction at the higher construction cost rate, thereby restoring market
equilibrium. INTERPRETATION OF RESULTS AND VALIDITY OF FINDINGS The Pretoria IPAMM simulation results outlined above indicate that the model successfully simulated an equilibrium state in the Pretoria office market. In the course of developing and adjusting the Pretoria IPAMM to simulate local property and asset market equilibrium, a number of factors were observed that merits comment. In this respect, interpretation of the above mentioned Pretoria IPAMM results should take due cognisance of the following: 1. The Pretoria IPAMM proved to be extremely sensitive to changes in certain key variables, in particular the
minimum construction price, parameter ‘a’ and parameter ‘b’. These are calibration parameters that determine the demand curve slope in Quadrant 1. The latter parameters therefore influence demand elasticity. This level of sensitivity suggests that the model is more suitable for macro analyses, for example a city-wide office market analysis, than micro analyses, for example a neighbourhood or precinct analysis.
2. Similar to the FDW Model, Pretoria IPAMM assumes perfect demand elasticity. Prevailing market
conditions are not necessarily perfectly elastic. This implies that users of the model have to be particularly mindful of the assumptions on which the model is based.
3. In practice, supply is relatively inelastic due to the fact that real estate is a fixed, non-liquid asset. Assume,
for instance, that the Pretoria IPAMM is manipulated by means of an increase in the market capitalisation rate. The net result suggests that total long run stock demand (Quadrant 4) will decline from its previous level. In this particular instance, model results point to a relative decline in demand for stock, rather than an absolute decline in available stock levels.
4. Pretoria IPAMM is a static model that provides a snapshot of the market at a given point in time. As such,
the model does not explicitly recognise and reflect the cyclical, and therefore dynamic nature of property and asset markets. Interpretation of Pretoria IPAMM results should not loose sight of the cyclical nature of market demand and supply.
5. Finally, in terms of the theory on which the FDW Model and hence, the Pretoria IPAMM is based, static
models do not attempt to explain the behaviour of variables during the transition from one equilibrium to another. The Pretoria IPAMM therefore does not recognise time lags that invariably occur in the market adjustment process.
CONCLUDING REMARKS ON THE IPAMM
19
The following can be concluded with regard to the IPAMM model development and application process:

Du Toit & Cloete PRRES PAPER 2003
! Results and findings of the Pretoria IPAMM modeling exercise indicate that the model has specific strengths
and weakness that dictate its application possibilities. ! Due to the great number of variables that influence market equilibrium and the intricate relationships between
these variables, application of the model requires in-depth knowledge of the stochastic equations and interrelationships on which the Pretoria IPAMM is based. An understanding of the internal dynamics of the model is essential to ensure judicious data modeling.
! The objective of the modeling exercise was to empirically test the relevance of the principles on which the
model is based and not, per se, to evaluate the accuracy of secondary data sources. Hence, it should be noted that, prior to application of Pretoria IPAMM in practice, calibration parameters of the model need to be further refined, in particular parameters ‘a’ and ‘b’ of the construction function (Quadrant 1) that portray demand elasticity.
APPRAISAL OF THE INTEGRATED PROPERTY AND ASSET MARKET MODEL CONCEPT This paragraph synthesises the generic integrated property and asset market model concept. The discussion commences with an overview of the fundamental assumptions and premises on which this genus integration models are based, followed by a concise evaluation of the benefits and limitations associated with this generic type of model. In the process of reconstructing and analysing the FDW model, generally acknowledged principles and concepts underpinning the dynamics of real estate and asset markets were affirmed. These findings revolve around a simple set of demand and supply relationships that reflect the theories of modern-day mainstream economics. In accordance with these theories, it was concluded that the demand for real estate could be illustrated in terms of a conventional negative or downward sloping demand curve. Stock, on the other hand, is fixed over the short term and supply is therefore perfectly inelastic. The vertical short-term supply curve reflects the stickiness in supply of real estate. The model development and calibration process furthermore explored a dimension of diagrammatic integrated property and asset market models that is not revealed in any of the quoted literature sources. This process unraveled not only complexities of the market, but especially of the internal dynamics and intricacies of the model and the set of simultaneous stochastic equations it is based on. The above mentioned findings are a product of the fundamental assumptions on which the stochastic equations of the FDW model and IPAMM, as examples of integrated property and asset market models, are based. The aim of this section is to synthesise the gist of these fundamental assumptions with the view to identify the repercussions thereof on the application possibilities of IPAMM. Albeit that similar models have been developed, these models are based on the same set of principles and premises and therefore belong to the same genus of integration models as the FDW model and, for that matter, Pretoria IPAMM. A critical assessment of these models, and specifically IPAMM, reveal the following important traits and premises of integrated property and asset market models.
20

Du Toit & Cloete PRRES PAPER 2003
Recursive device IPAMM is a short-run, period-by-period adjustment model based on regression principles that facilitates, by means of comparative static analysis, predictions of user market supply and demand relationships in the long run. As such, the model is a recursive device, based on an iterative process. Due to these characteristics, the model tends to oversimplify dynamic market adjustment and subsequent lags that occur in the equilibration process. Stock and flow characteristics The model portrays stock and flow characteristics. Stock refers to existing space utilised for office (or other as defined) purposes, whereas flow relates to the provision of new space. In accordance with the scale and longevity of the stock of commercial buildings, new supply accounts only for a small proportion of total stock. It is this uneven flow characteristic, dictated by market forces, that introduces the cyclical dimension into the market. IPAMM is ideally suited to simulate the stock scenario due to its static nature. Modeling of flow scenarios is only possible by means of an iterative process of comparative static analysis, i.e. modeling a sequence of static stock scenarios. This requires user skill and judicious decision-making on sensible assumption scenarios. The number of variables combined into the model, coupled with the intricate relationship between variables suggest that even the most skilled property practitioner will find this task challenging. Perfect market competition The integrated property and asset market model concept postulates perfect market competition. Perfect market competition implies that all agents involved in the property market must base their investment decisions on perfect and complete market knowledge concerning market indicators such as rentals, asset values, returns on investment, availability of space by type and location, proposed new developments that will come on stream in the short term and, importantly, the cyclical nature of the building industry. The cyclical nature of the building industry introduces the concept of developer and investor expectations. Such expectations can either be naïve or rational. Naïve expectations imply a line of thinking that the future would be the same as the present. Rational expectations, on the other hand, imply that developers use their knowledge of the property market, the wider economy and the best available theories of how the two function and interrelate. This dimension of the model places the responsibility squarely on the user of IPAMM to accurately express variables, such as capitalisation rates, in expectational terms. Ball, Liziere and MacGregor support this notion (1998, pp 36-39). Property values, Market prices and Replacement costs The price determinant technique applied to estimate property values, uses rent as space market proxy for the capital market value of real estate assets (Quadrant 2). In this instance, IPAMM assumes that property values and market prices are synonymous, i.e. that valuations accurately reflect prevailing market prices. It should be noted that there are circumstances in which this assumption does not necessarily hold true. Apart from minor discrepancies that may occur as a consequence of interplay between macroeconomic and building cycles, market prices may vary significantly from property values in precincts where environmental decay has a detrimental effect on achievable market prices.
21
Du Toit & Cloete PRRES PAPER 2003
A case in point, albeit arguably extreme, is the Carlton Centre in Johannesburg CBD. This retail-cum-office building was sold in 1999 for R34 million. In stark contrast, the replacement cost of the building was estimated at R800 million. This issue is clouded even more, considering that the net operating income generated by the building was negative and that, in terms of the income valuation approach, the market value of the building was therefore negative (Brink, 2002). The dilemma outlined above is by no means unique to the Carlton Centre or, for that matter, the Johannesburg CBD. This dynamic is clearly a separate debate that falls outside the ambit of this study. Suffice to say that the significance of this matter stems from the fact that, in modern cities, potentially up to half the amount of available commercial floor space is located in inner cities. Environmental factors beyond the control of individual building owners may therefore cause large proportions of office space in inner cities to fall prey to economic obsolescence and hence, the phenomenon that property values and market prices are not necessarily synonymous. Applications of the model should heed to the potential pitfalls associated with modeling exercises involving highly centralised spatial urban markets. Coupled with this aspect, is the occurrence of economic obsolescence and the translation of these environmental qualities into sensible modeling parameters. To conclude the general remarks on property values, the reader should recall that, in terms of the IPAMM, new construction will take place at the point where property values equal replacement costs (Quadrant 3). Replacement costs therefore serve as precursor to new development. In this respect, integrated property and asset market models define replacement costs comprehensively in order to include not only direct construction costs, but also other on-costs related to site clearance, financing and land costs. Separate property development industry IPAMM assumes that there is a separate property development industry that conceives schemes, assembles sites and constructs new buildings. Completed projects are then sold to investors. In reality, however, many developers are also investors who retain certain properties after the initial investment has occurred. In itself, this assumption does not have a direct influence on the model. The indirect effect, however, occurs when there is a marked increase in the occurrence of owner occupied buildings, as opposed to leasing, in the market area as a whole. In reality, this introduces complexities pertaining to market rentals versus bond installments, escalation rates and a distinction between direct vacancy, sub-lease vacancy and total vacancy. However, integrated property and asset market models assume that: ! the decisions of owner-occupiers and tenants are influenced by the same economic and capital market
conditions; ! owner-occupiers essentially have the same investment motives as tenants; and
! annual rent per square meter is but one mechanism that can be utilised to express the utility value of real
estate.
22

Du Toit & Cloete PRRES PAPER 2003
Owner-occupied commercial property has costs of use that implicitly constitute rent. This is often referred to as imputed rent (Ball, Liziere and MacGregor, 1998, p.19). In essence, it can therefore be concluded that integrated property and asset market models behave identical in owner-occupier and rental markets. Indirect effect of government intervention in the property market In terms of South African public law, government sector is not permitted to speculate in the property market or, for that matter, to engage in activities aimed at attaining financial gain. Government intervention in the property market, however, extends beyond direct intervention. Indirect government intervention in the property market includes taxation measures and special development programmes that influence spatial property markets. The first mechanism at government’s disposal is taxation. Capital Gains Tax (CGT) came into effect in South Africa on 1 April 2002. In this respect, there appears to be general consensus among property practitioners that the impact of CGT on the property market will mainly be confined to an ‘add-on’ to property prices, as opposed to serving as deterrent to property investment. Concerning the after tax rate of return, IPAMM assumes that capital market efficiency adjusts the prices of particular assets and that each investment therefore earns a common, risk-adjusted after-tax total rate of return. These adjustments are accounted for in Quadrant 2 of the model, the Market for Asset Valuation. Another sphere of government influence in the property market, involves spatial development programmes. In certain geographic locations, these special programmes affect thousands of hectares of developable land and are therefore of such magnitude that it may distort the property market in terms of, inter alia, spatial settlement patterns, property prices and rentals. Two examples in this regard include the concept of Industrial Development Zones (IDZs) and large scale government sector office developments. These programmes may induce large scale building activity at distorted market prices due to, inter alia, incentivised development and the fact that government does not necessarily adhere to the free market capitalistic premises on which integrated property and asset market models are based. Application of the IPAMM in a market characterised by such extraordinary conditions may yield distorted results. Benefits of Integrated Property and Asset Market Models As stated in the introduction, academics and investment managers have had difficulty in linking information from the markets for space and capital markets where real estate assets are valued. In other words, the distinction between use decisions and investment decisions, and the links that were conceptually known to exist between these markets proved to be problematic in as far as its quantification was concerned. The FDW Model that was initially conceived in 1992 provided, not only a diagrammatic exposition, but also one of the first quantified mechanisms that captured the basic interrelationships between property and asset markets. As such, it advanced beyond mere conceptualisation of these relationships to a quantified interpretation and application of the theoretical premises of modern-day economics that represent the micro-foundations of economic behaviour in property markets. Diagrammatic integrated property and asset market models, such as IPAMM and FDW, illustrate the potential effect of numerous market fluctuations on general equilibrium. Albeit that it does not explicitly account for time lags and dynamic
23

Du Toit & Cloete PRRES PAPER 2003
adjustments that occur in the market equilibrium adjustment process, these models integrate a spectrum of endogenous and exogenous economic and property market variables into a comprehensible framework. The relatively simple layout of these diagrammatic quadrant models provides a powerful conceptual instrument which, coupled with its comprehensible schemata of stochastic equations, renders it an innovative heuristic device with, inter alia, pedagogical value. Limitations of Integrated Property and Asset Market Models Due to its inherent nature and composition, integrated property and asset market models have inescapable limitations. General limitations of these models relate to its static nature and the subsequent inability to illustrate the dynamic process of adjustment to market equilibrium. In addition to these general limitations, Viezer (1999, p.503) advances three criticisms against diagrammatic integrated property and asset market models. First, these models assume the capitalisation rate is exogenously determined. Instead, it is contended that a multi-factor asset pricing model should be used to determine the appropriate discount rate that, in turn, would determine both the market value and capitalisation rate. Secondly, these models suggest that equilibrium is a natural state and that all values are determined simultaneously. However, as duly noted, in reality time lags do occur in market adjustment. Thirdly, Viezer (1999, p.503) contends that diagrammatic models can forecast general levels and changes in direction for real estate markets, but “… it can not be used to compare one market to another. To be useful to the practitioner, the diagrammatic model needs to be statistically estimated in individual markets.” The latter criticism offers, in itself, a relatively simple solution: to ensure optimum accuracy, the model needs to be statistically estimated for each individual market. A concluding remark, rather than a point of criticism, relates to the use of a depreciation factor to ‘capitalise’ annual flow of construction into a long-run total supply of stock (Quadrant 4). Once again, the quantitative result should ideally be interpreted as a static outcome based on prevalent market conditions, rather than a mean value of cyclical time series data. This aspect, once again, relates to the static nature of integrated property and asset market models and the imminent fact that a predictive time series can only be attained by means of an iterative process in which key variables are manipulated sensibly and knowledgably. APPLICATION POSSIBILITIES The assumptions, benefits and limitations associated with integrated property and asset market models, such as IPAMM, dictates its application possibilities. IPAMM provides a spectrum of application possibilities to a number of users and sectors. Table 4 summarizes these application possibilities and potential user markets in matrix format. The IPAMM Matrix of Application Possibilities identifies a number of use options and potential user markets for each application of the model. IPAMM provides useful application possibilities to each of the three core disciplines within the property sector, namely property development, property management and property valuation, as well as sectors that provide strategic services to property practitioners, namely banking and finance, and tertiary education.
24

Du Toit & Cloete PRRES PAPER 2003
Table 4: IPAMM Matrix of Application Possibilities USER / SECTOR
Property
development
Property
management
Banking and
finance
Investment
management
Tertiary
education
Demand estimation Definite Probable Definite Probable Limited
Geographic market analysis Definite Limited Definite Probable Limited
Property type market analysis Definite Limited Probable Probable Limited
Space utilisation analysis Definite Definite Limited Probable Limited
Take-up and vacancy estimation Definite Definite Probable Definite Limited
Market cycle simulation Definite Definite Definite Definite Limited
Asset valuation movement Probable Limited Definite Definite Limited
Rent reviews (escalations) Limited Definite Limited Probable Limited
Risk management Probable Limited Definite Definite Limited
Speculation and price movements Definite Limited Probable Probable Limited
A
P
P
L
I
C
A
T
I
O
N Pedagogical instrument Probable Probable Probable Probable Definite
Notes: Definite High degree of correlation between IPAMM capabilities and the core business of this sector.
Probable IPAMM capabilities do not necessarily correlate with the core business of this sector but may, in certain instances,
provide useful / insightful applications.
Limited No definite correlation between IPAMM capabilities and the core business of this sector.
In each of the above mentioned sectors, strategic planning and decision making actions are based on two factors, namely: ! historic market data; and ! subjective expectations on future market behaviour. IPAMM, as analytical instrument, incorporates a broad spectrum of endogenous and exogenous variables in the most influential markets that impact on the property business, namely the market for space, asset valuation and the construction sector. As such, it provides an intelligible framework that adds structure to data. Hence, IPAMM is ideally suited to aid strategic decision making processes in the sectors identified in Table 4. In the property development discipline, the value of IPAMM stems from its capacity to simulate market scenarios for a number of variables in respect of the market for space, asset valuation, construction sector and stock adjustment. Typical applications include estimation of demand for space; market analysis by geographic area; market analysis by property type; space utilisation analysis (i.e. movements in the floor space (m²) : worker ratio); estimation of take-up and vacancy rates; simulation and assessment of market cycles. In each of these applications, key variables can be manipulated to generate market scenarios that will inform decision making processes. In general, IPAMM could simulate the national office market as a whole or a spatially disaggregated entity, such as a region, metropolitan area, city or town. It could be argued that the more localised the analysis, the greater the severity of local idiosyncrasies and its potential impact on calibration of the model. The magnitude of the data pool in relation to the statistical requirements of the model suggests that there is a minimum market size required to achieve optimum
25
Du Toit & Cloete PRRES PAPER 2003
modeling results. Modeling results suggest that IPAMM is appropriate for simulations on a city wide level, rather than local precinct or neighbourhood simulations. Alternatively it could focus on functional divisions by building type. For example, the model could be utilised to compare the performance of the office market, retail market and industrial market within a predetermined geographic area. Property managers may utilise the IPAMM to analyse scenarios pertaining to space utilisation, vacancy estimation and market cycle expectations in order to inform the nature of lease contracts and rent review processes. Expectations concerning risk may, for example, be informative in deciding on the ideal duration of a lease contract. The same principle applies to rent reviews and portfolio management, i.e. investment decisions based on expectations concerning the behaviour of specific geographic markets and property types. These aspects are equally important to risk managers. The banking and financial sector has a two-pronged impact on the property market. The first impact stems from the dominant role of financial institutions as property investors and owners. The second, and even more profound impact, stems from the core business of banking institutions, namely property financing. Leveraging, i.e. mobilising an optimum ratio of equity to loan capital, is common practice in the property sector. In the banking and financing sector, loan financing decisions concerning the type of investment financed, risks involved and the ideal financing rate are, in essence, market decisions. In other words, these decisions are informed by a thorough analysis of prevailing market conditions and future expectations concerning market indicators that will influence the risk and return of a particular project. The analytical and simulation properties of IPAMM distinguish the model as a meaningful decision support mechanism to the banking and financing sector. An advantage of diagrammatic quadrant models is that these models provide a powerful conceptual instrument that, combined with a system of stochastic equations, render this genus of integration models an innovative, heuristic device. This characteristic of the IPAMM, which enables the user to improve his understanding of various facets of the market by interacting with the model, suggests that the model could be applied fruitfully in specialised learnership courses. These learnership courses could include property related undergraduate and postgraduate courses at tertiary educational institutions, as well as short courses presented to students and an array of property practitioners including investors, researchers, financiers, risk managers and portfolio managers. In this regard, the conceptual and econometric properties of IPAMM can be exploited to develop study modules with varying degrees of sophistication. The list of IPAMM application possibilities and user markets is by no means exhaustive. It merely serves to illustrate the multifaceted nature of IPAMM and its subsequent relevance to a spectrum of property practitioners. An emphasis on the inclusive, integrated nature of IPAMM, rather than its limitations, should serve as catalyst for exploring creative application possibilities. POSSIBLE IMPROVEMENTS AND OPPORTUNITIES FOR FURTHER RESEARCH An appraisal of IPAMM, with due cognisance taken of its fundamental assumptions, benefits and limitations, suggests that the model accurately captures important interrelationships between key property and asset market variables. As
26

Du Toit & Cloete PRRES PAPER 2003
such, IPAMM is a useful multidimensional analytical and simulation instrument with diverse application possibilities. The following aspects have been identified as focus areas for future research: 1. Demand elasticity and hence, the slope of the demand curve in Quadrant 1. In this regard, calibration
parameters ‘a’ and ‘b’ should be researched and refined. 2. The definition of minimum construction cost needs to be refined, specifically the significance and
quantification of additional costs pertaining to site clearance, financing and land costs. 3. The depreciation factor utilised in Quadrant 4 requires empirical testing. 4. IPAMM is essentially a regression model based on a system of stochastic equations. A brief introduction to
these econometric concepts, prior to further research and development on the model, may improve judicious manipulation of variables.
5. A comprehensive data pool should be created from which IPAMM can be calibrated and empirically tested
in various geographic markets and for various property types. 6. On a more fundamental level, the use of artificial intelligence techniques such as neural networks and
fuzzy expert systems seems to hold considerable promise for the development of improved real estate market models (see, e.g., Engelbrecht, 2002 and Negnevitsky, 2001).
Cynics and critics maintain that “… in economics, everything depends on everything else, and in more than one way” (author unknown). This school of thought denies the human inclination to rationalise complex systems into comprehensible and predictive theories, hypotheses and frameworks. It is concluded that IPAMM, within the parameters specified in its relatively simplistic system of equations, establishes such a comprehensible framework and that this framework could evolve into a powerful decision support mechanism for property practitioners in various sectors of the economy. REFERENCES Achour-Fischer D. 1999. “An Integrated Property Market Model: A Pedagogical Tool”, Journal of Real Estate Practice and Education, Vol. 2, No. 1, pp. 33-43. AIREA. 1987. The Appraisal of Real Estate, American Institute of Real Estate Appraisers. Ballinger Publishing Company: Cambridge. Alcock D. 1999. “Capitalisation rates. How relevant are they?”, SAPOA News, December 1999, pp. 3-6,8. Ball M, Liziere C and Bryan D MacGregor. 1998. The Economics of Commercial Property Markets. Routledge: New York.
27

Du Toit & Cloete PRRES PAPER 2003
Brink, B. 2002. Personal communication, May 2002 by Basil Brink, Transnet Manager: Property Development Facilitation for Southern Gauteng, Free State, Northern Cape and North West Province. Corcoran PJ. 1987. “Explaining the Commercial Real Estate Market”, Journal of Portfolio Management, Vol. 13, pp.15-21. Dernburg TF. 1985. Macroeconomics: Concepts, Theories and Policies. Seventh Edition. McGraw Hill Book Company: New York. DiPasquale D & Wheaton WC. 1992. “The Markets for Real Estate Assets and Space: A Conceptual Framework”, Journal of American Real Estate and Urban Economics Association, Vol. 20.1, pp. 181-197. DiPasquale D and Wheaton WC. 1996. Urban Economics and Real Estate Markets. Prentice-Hall Incorporated: New Jersey. Engelbrecht, AP. 2002. Computational Intelligence. An Introduction. Wiley : New York. Fisher JD. 1992. “Integrating Research on markets for Space and Capital”, Journal of American Real Estate and Urban Economics Association, Vol. 20.1, pp. 161-180. Fisher JD, Hudson-Wilson S, and Wurtzebach CH. 1993. “Equilibrium in Commercial Real Estate Markets: Linking Space and Capital Markets”, Journal of Portfolio Management, Vol. 19, pp. 101-107. Hakfoort J and Lie R. 1996. “Office space per Worker: Evidence from Four European Markets”, The Journal of Real Estate Research, Vol. II, No. 2, pp. 183-196. Hendershott PH and Ling DC. 1984. “Prospective Changes in Tax Law and the Value of Depreciable Real Estate”, Journal of the American Real Estate and Urban Economics Association, Vol. 12, pp. 297-317. Lombard JA, Du Pisani JA, and Steyn FG. 1986. Teoretiese Grondslae van die Politieke Ekonomie. Southern Boekuitgewers: Bergvlei. (In Afrikaans). Maisel SJ & Roulac SE. 1976. Real Estate Investment and Finance. McGraw–Hill: New York. Mansfield E. 1988. Micro-Economies: Theory and Applications. (6th ed.). WW Norton and Company: New York. Negnevitsky, M. 2001. Artificial Intelligence. A Guide to Intelligent Systems. Addison-Wesley: Harlow, England. Penny P. 1999 “Choosing Real Estate Hurdle Rates”, The SAPOA Property Review, December 1999, pp.13-16. Pyhrr SA, Cooper JR, Wofford LE, Kapplin SD and Lapides PD. 1989. Real Estate Investment. Strategy, Analysis, Decisions. (2nd ed.). Wiley: New York.
28
Du Toit & Cloete PRRES PAPER 2003
29
Rode & Associates. 1997. Rode’s SA Property Trends, July 1997. Rode & Associates. 1998. Rode’s Report on the SA Property Market, 1998:1. Rode & Associates. 2000. Rode’s Report on the SA Property Market, 2000:1. Roulac SE. 1996. “The Strategic Real Estate Framework: Processes, Linkages, Decisions”, The Journal of Real Estate Research, Vol. 12, No. 3, pp. 323-346. Samuelson PA. 1980. Economics. (11th ed.). McGraw-Hill International Book Company: Auckland. Urban-Econ1998. Pretoria Inner City Integrated Economic Development Policy, December 1998. Urban-Econ: Development Economists, Pretoria. Viezer TW. 1999. “Economic Integration of Real Estate’s Space and Capital Markets”, Journal of Real Estate Research, Vol. 18, No. 3, pp. 503-519. Viruly F. 2000. “Determining property, values through the discounted cash flow approach (DCF)”, The SAPOA Property Review, June 2000, pp. 42-45. Ken Nortje: Johannesburg. Wurtzebach CH & Miles ME. 1996. Modern Real Estate. (5th ed.) . Wiley: New York. www.cbs.curtin.edu.au