An assessment of departmental store service … · between departmental stores customers’...
17
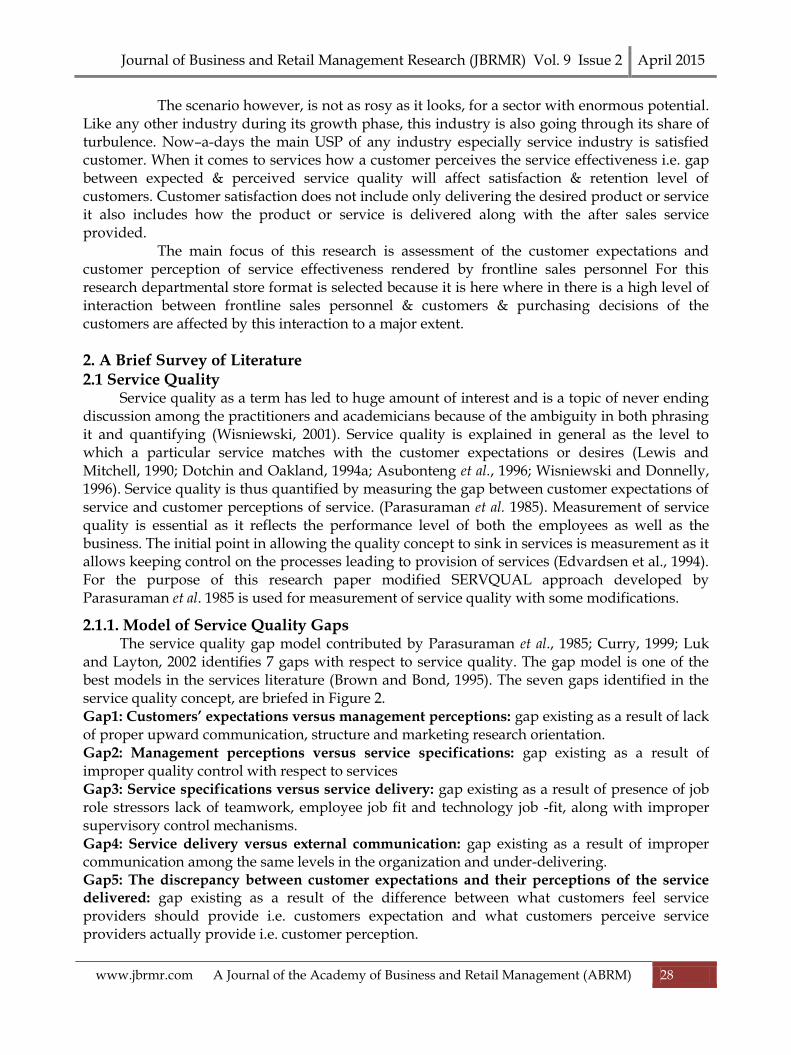
Journal of Business and Retail Management Research (JBRMR) Vol. 9 Issue 2 April 2015 www.jbrmr.com A Journal of the Academy of Business and Retail Management (ABRM) 27 An assessment of departmental store service effectiveness using a modified SERVQUAL approach Kasturi Naik DES’s NMITD, University of Mumbai India Srini R. Srinivasan VESIMSR, Mumbai University, India Keywords Customer perception, customer expectation, service effectiveness, frontline, retail, store loyalty Abstract Retail Industry is likely to be the next big thing for services in this decade. The industry is very diverse, with several sub-segments, each displaying its own unique characteristics. The retail players need to be excellent in every facet of operations as the market is highly competitive at every level and re- defining itself every day. It is mainly a service oriented industry so employee’s especially frontline sales people who do have a major role in customers purchasing decision are the key people to its success. Now – a- days the main USP of any industry especially service industry is satisfied customer. The main focus of this research is to determine the department store service effectiveness. This is achieved by means of assessment of the customer expectation and customer perception of the service effectiveness rendered by frontline sales personnel. For the purpose of the conduction of the study both primary and secondary data was used. The questionnaire used for primary data collection was based on a modified fifteen-item, seven –point scale that measures customer expectations and customer perception of service effectiveness developed by Parasuraman et.al. (1988). The secondary data was collected using various published and unpublished paper and electronic sources. For analysis and interpretation of data univariate, bivariate and multivariate statistical techniques like factor analysis and reliability analysis were used .The interpretation of the results showed that customer expectations scores are higher than customer perceptions scores, which indicate low level of service effectiveness. The study also identified factors important with respect to customer perceptions and customer expectations. The findings of the study provide an insight into the customer expectations and customers perception of service effectiveness delivered by the frontline sales personnel along with the gap that exist between the two. This would provide a future scope of research with respect to the reasons for existence of the gap and the means that can be implemented by the management to bridge the gap depending on the reasons for the existence of the gap. 1. Introduction Experts point out that continued high growth in an industry can be an issue because it strains systems and governance processes that needs time to mature and to be institutionalized. The Retail Industry constitutes the fastest growing industry in India and is facing the above mentioned problem. Retail Industry is likely to be the next big thing for services in this decade. The industry is very diverse, with several sub-segments, each displaying its own unique characteristics. The retail players need to be excellent in every facet of operations as the market is highly competitive at every level and re-defining itself every day. It is mainly service oriented industry so employees especially frontline sales people who do have influence on customers purchasing decision are the key people to its success.
Transcript of An assessment of departmental store service … · between departmental stores customers’...
Journal of Business and Retail Management Research (JBRMR) Vol. 9 Issue 2 April 2015
www.jbrmr.com A Journal of the Academy of Business and Retail Management (ABRM) 27
An assessment of departmental store service effectiveness using a modified SERVQUAL approach
Kasturi Naik DES’s NMITD, University of Mumbai India
Srini R. Srinivasan VESIMSR, Mumbai University, India
Keywords Customer perception, customer expectation, service effectiveness, frontline, retail, store loyalty
Abstract Retail Industry is likely to be the next big thing for services in this decade. The industry is very
diverse, with several sub-segments, each displaying its own unique characteristics. The retail players need to be excellent in every facet of operations as the market is highly competitive at every level and re-defining itself every day. It is mainly a service oriented industry so employee’s especially frontline sales people who do have a major role in customers purchasing decision are the key people to its success. Now –a- days the main USP of any industry especially service industry is satisfied customer. The main focus of this research is to determine the department store service effectiveness. This is achieved by means of assessment of the customer expectation and customer perception of the service effectiveness rendered by frontline sales personnel.
For the purpose of the conduction of the study both primary and secondary data was used. The questionnaire used for primary data collection was based on a modified fifteen-item, seven –point scale that measures customer expectations and customer perception of service effectiveness developed by Parasuraman et.al. (1988). The secondary data was collected using various published and unpublished paper and electronic sources.
For analysis and interpretation of data univariate, bivariate and multivariate statistical techniques like factor analysis and reliability analysis were used .The interpretation of the results showed that customer expectations scores are higher than customer perceptions scores, which indicate low level of service effectiveness. The study also identified factors important with respect to customer perceptions and customer expectations.
The findings of the study provide an insight into the customer expectations and customers perception of service effectiveness delivered by the frontline sales personnel along with the gap that exist between the two. This would provide a future scope of research with respect to the reasons for existence of the gap and the means that can be implemented by the management to bridge the gap depending on the reasons for the existence of the gap.
1. Introduction Experts point out that continued high growth in an industry can be an issue because
it strains systems and governance processes that needs time to mature and to be institutionalized. The Retail Industry constitutes the fastest growing industry in India and is facing the above mentioned problem.
Retail Industry is likely to be the next big thing for services in this decade. The industry is very diverse, with several sub-segments, each displaying its own unique characteristics. The retail players need to be excellent in every facet of operations as the market is highly competitive at every level and re-defining itself every day. It is mainly service oriented industry so employees especially frontline sales people who do have influence on customers purchasing decision are the key people to its success.
Journal of Business and Retail Management Research (JBRMR) Vol. 9 Issue 2 April 2015
www.jbrmr.com A Journal of the Academy of Business and Retail Management (ABRM) 28
The scenario however, is not as rosy as it looks, for a sector with enormous potential. Like any other industry during its growth phase, this industry is also going through its share of turbulence. Now–a-days the main USP of any industry especially service industry is satisfied customer. When it comes to services how a customer perceives the service effectiveness i.e. gap between expected & perceived service quality will affect satisfaction & retention level of customers. Customer satisfaction does not include only delivering the desired product or service it also includes how the product or service is delivered along with the after sales service provided.
The main focus of this research is assessment of the customer expectations and customer perception of service effectiveness rendered by frontline sales personnel For this research departmental store format is selected because it is here where in there is a high level of interaction between frontline sales personnel & customers & purchasing decisions of the customers are affected by this interaction to a major extent.
2. A Brief Survey of Literature 2.1 Service Quality Service quality as a term has led to huge amount of interest and is a topic of never ending discussion among the practitioners and academicians because of the ambiguity in both phrasing it and quantifying (Wisniewski, 2001). Service quality is explained in general as the level to which a particular service matches with the customer expectations or desires (Lewis and Mitchell, 1990; Dotchin and Oakland, 1994a; Asubonteng et al., 1996; Wisniewski and Donnelly, 1996). Service quality is thus quantified by measuring the gap between customer expectations of service and customer perceptions of service. (Parasuraman et al. 1985). Measurement of service quality is essential as it reflects the performance level of both the employees as well as the business. The initial point in allowing the quality concept to sink in services is measurement as it allows keeping control on the processes leading to provision of services (Edvardsen et al., 1994). For the purpose of this research paper modified SERVQUAL approach developed by Parasuraman et al. 1985 is used for measurement of service quality with some modifications.
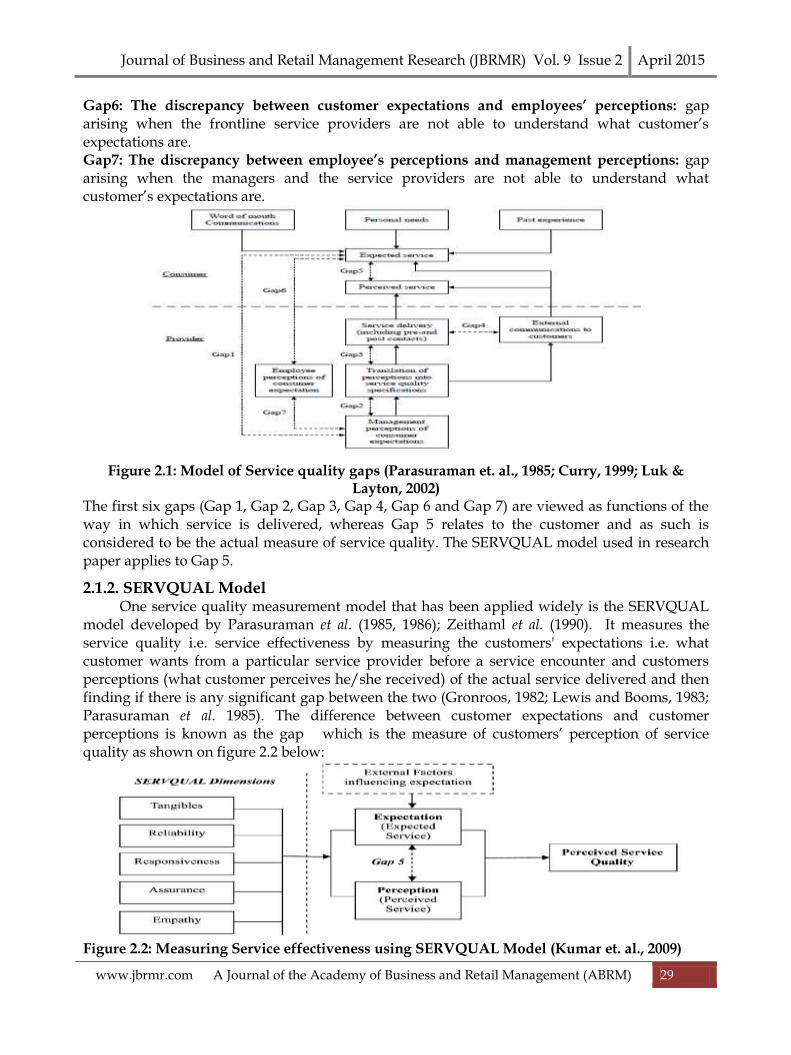
2.1.1. Model of Service Quality Gaps The service quality gap model contributed by Parasuraman et al., 1985; Curry, 1999; Luk and Layton, 2002 identifies 7 gaps with respect to service quality. The gap model is one of the best models in the services literature (Brown and Bond, 1995). The seven gaps identified in the service quality concept, are briefed in Figure 2. Gap1: Customers’ expectations versus management perceptions: gap existing as a result of lack of proper upward communication, structure and marketing research orientation. Gap2: Management perceptions versus service specifications: gap existing as a result of improper quality control with respect to services Gap3: Service specifications versus service delivery: gap existing as a result of presence of job role stressors lack of teamwork, employee job fit and technology job -fit, along with improper supervisory control mechanisms. Gap4: Service delivery versus external communication: gap existing as a result of improper communication among the same levels in the organization and under-delivering. Gap5: The discrepancy between customer expectations and their perceptions of the service delivered: gap existing as a result of the difference between what customers feel service providers should provide i.e. customers expectation and what customers perceive service providers actually provide i.e. customer perception.
Journal of Business and Retail Management Research (JBRMR) Vol. 9 Issue 2 April 2015
www.jbrmr.com A Journal of the Academy of Business and Retail Management (ABRM) 29
Gap6: The discrepancy between customer expectations and employees’ perceptions: gap arising when the frontline service providers are not able to understand what customer’s expectations are. Gap7: The discrepancy between employee’s perceptions and management perceptions: gap arising when the managers and the service providers are not able to understand what customer’s expectations are.
Figure 2.1: Model of Service quality gaps (Parasuraman et. al., 1985; Curry, 1999; Luk &
Layton, 2002) The first six gaps (Gap 1, Gap 2, Gap 3, Gap 4, Gap 6 and Gap 7) are viewed as functions of the way in which service is delivered, whereas Gap 5 relates to the customer and as such is considered to be the actual measure of service quality. The SERVQUAL model used in research paper applies to Gap 5.
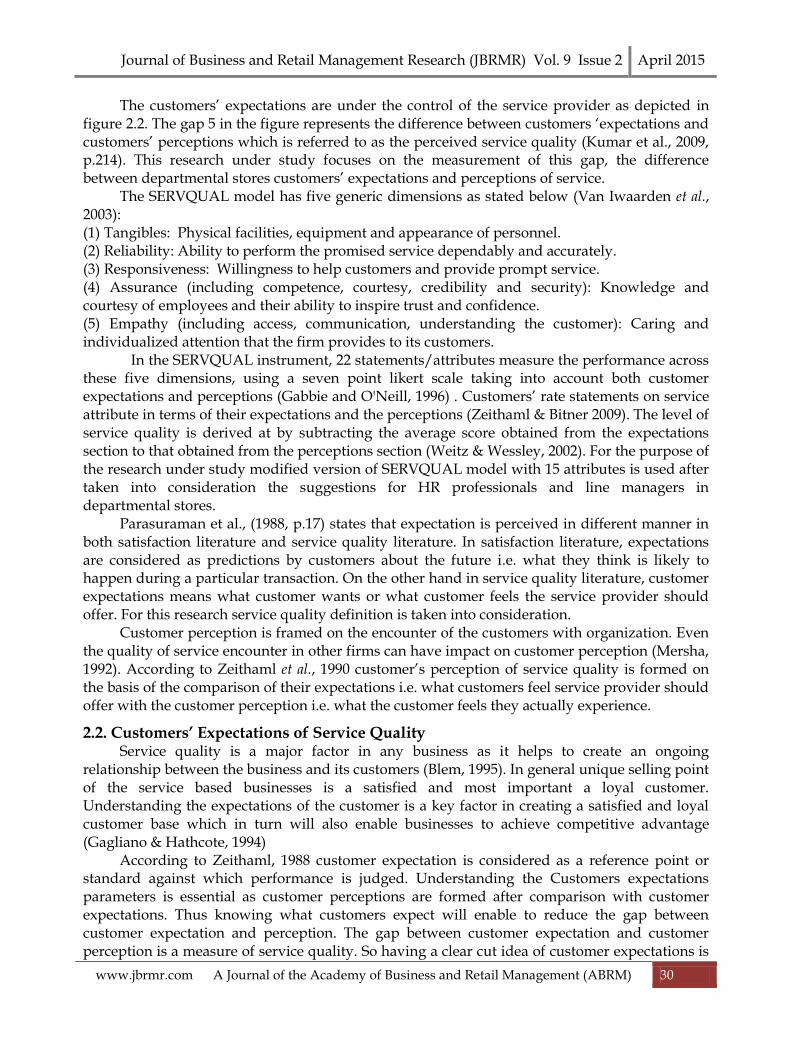
2.1.2. SERVQUAL Model One service quality measurement model that has been applied widely is the SERVQUAL model developed by Parasuraman et al. (1985, 1986); Zeithaml et al. (1990). It measures the service quality i.e. service effectiveness by measuring the customers' expectations i.e. what customer wants from a particular service provider before a service encounter and customers perceptions (what customer perceives he/she received) of the actual service delivered and then finding if there is any significant gap between the two (Gronroos, 1982; Lewis and Booms, 1983; Parasuraman et al. 1985). The difference between customer expectations and customer perceptions is known as the gap which is the measure of customers’ perception of service quality as shown on figure 2.2 below:
Figure 2.2: Measuring Service effectiveness using SERVQUAL Model (Kumar et. al., 2009)
Journal of Business and Retail Management Research (JBRMR) Vol. 9 Issue 2 April 2015
www.jbrmr.com A Journal of the Academy of Business and Retail Management (ABRM) 30
The customers’ expectations are under the control of the service provider as depicted in figure 2.2. The gap 5 in the figure represents the difference between customers ‘expectations and customers’ perceptions which is referred to as the perceived service quality (Kumar et al., 2009, p.214). This research under study focuses on the measurement of this gap, the difference between departmental stores customers’ expectations and perceptions of service. The SERVQUAL model has five generic dimensions as stated below (Van Iwaarden et al., 2003): (1) Tangibles: Physical facilities, equipment and appearance of personnel. (2) Reliability: Ability to perform the promised service dependably and accurately. (3) Responsiveness: Willingness to help customers and provide prompt service. (4) Assurance (including competence, courtesy, credibility and security): Knowledge and courtesy of employees and their ability to inspire trust and confidence. (5) Empathy (including access, communication, understanding the customer): Caring and individualized attention that the firm provides to its customers.
In the SERVQUAL instrument, 22 statements/attributes measure the performance across these five dimensions, using a seven point likert scale taking into account both customer expectations and perceptions (Gabbie and O'Neill, 1996) . Customers’ rate statements on service attribute in terms of their expectations and the perceptions (Zeithaml & Bitner 2009). The level of service quality is derived at by subtracting the average score obtained from the expectations section to that obtained from the perceptions section (Weitz & Wessley, 2002). For the purpose of the research under study modified version of SERVQUAL model with 15 attributes is used after taken into consideration the suggestions for HR professionals and line managers in departmental stores. Parasuraman et al., (1988, p.17) states that expectation is perceived in different manner in both satisfaction literature and service quality literature. In satisfaction literature, expectations are considered as predictions by customers about the future i.e. what they think is likely to happen during a particular transaction. On the other hand in service quality literature, customer expectations means what customer wants or what customer feels the service provider should offer. For this research service quality definition is taken into consideration. Customer perception is framed on the encounter of the customers with organization. Even the quality of service encounter in other firms can have impact on customer perception (Mersha, 1992). According to Zeithaml et al., 1990 customer’s perception of service quality is formed on the basis of the comparison of their expectations i.e. what customers feel service provider should offer with the customer perception i.e. what the customer feels they actually experience.
2.2. Customers’ Expectations of Service Quality Service quality is a major factor in any business as it helps to create an ongoing relationship between the business and its customers (Blem, 1995). In general unique selling point of the service based businesses is a satisfied and most important a loyal customer. Understanding the expectations of the customer is a key factor in creating a satisfied and loyal customer base which in turn will also enable businesses to achieve competitive advantage (Gagliano & Hathcote, 1994) According to Zeithaml, 1988 customer expectation is considered as a reference point or standard against which performance is judged. Understanding the Customers expectations parameters is essential as customer perceptions are formed after comparison with customer expectations. Thus knowing what customers expect will enable to reduce the gap between customer expectation and perception. The gap between customer expectation and customer perception is a measure of service quality. So having a clear cut idea of customer expectations is
Journal of Business and Retail Management Research (JBRMR) Vol. 9 Issue 2 April 2015
www.jbrmr.com A Journal of the Academy of Business and Retail Management (ABRM) 31
critical in satisfying customer, a satisfied customer in turn enables the firm in gaining competitive advantage (Zeithaml and Bitner, 2003). Customer expectations can also be called desires or wants from a particular service prior to the actual experience (Oliver & Winer 1987). For the purpose of the research under study, customer expectations is defined as desires or wants of customers i.e. what customer actually wants from the particular service provider because this allows the service provider to identify what service providers offer (Douglas & Connor, 2003, p.167). Customer expectations are based on past experience and information received (Douglas & Connor, 2003, p.167). According to the literature it is believed that customers have different types of expectations of service performance depending on the type of retail service rendered (Zeithaml & Bitner, 2003) for e.g. with respect to supermarkets where the focus is self service approach the customer expectations are different from that in departmental stores where the focus is customer service delivered by frontline sales personnel. The expectations reflect what customers actually want from a particular service and thus failure to meet the expectations may lead to dissatisfying the customer with resultant loss in business (Zeithaml, Bitner and Gremler, 2009, Negi 2009). Customer expectations if not met leads to three states followed sometimes by customer complaint which is the post-purchase behavior. These three states are delight, satisfaction and dissatisfaction. The customer who believes that all the expectations are met is satisfied and appreciates the service (Leventhal, 2006). On the other hand if the service encounter is below the expectations customer is not satisfied leading to his/her disappointment and complaint about the quality of service (Santos & Boote, 2003).
2.3. Customer perceptions of service quality Customer perception can be stated as customer’s viewpoint with respect to the relative inadequacy or dominance of an organization and its services (Bitner & Hubbert, 1994). Customer perceptions are based with reference to customer expectations i.e. the desires or wants of the customer from the particular service provider (Zeithaml, 2009). According to Zeithaml and Bitner, 2003 customer perceptions is a dynamic concept as it is being quantified on the basis of customer expectations which changes with changing lifestyle, availability of choices etc.. Hence it is essential to have a provision for continuous evaluation of customer perceptions. Customer perceptions are framed through customers’ evaluation of the quality of service provided by a service provider (frontline sales personnel in case of the research under study) and whether they are contented with the level of service provision (Zeithaml and Bitner, 2003, p.84). Prior to conducting the process of evaluation of customer perceptions it is essential to understand that many tangible as well as intangible factors like employees performance, facilities, price of products , quality of service offered etc. do have an impact on it (Gagliano & Hathcote, 1994, Naylor & Frank, 2000; Sheinin & Wagner, 2003;Shaw & Haynes, 2004)). The research under study focuses on service quality perception. Numerous factors contribute to service quality perception. According to Berman and Evans, 2005 overall service quality perception is influenced by customer service, employee performance, stress levels of the employees, store location, merchandise attributes, pricing, firm’s positioning, target market, attributes of physical facilities, shopping experience etc. Further, Berman and Evans, 2005 note that service quality perception depends heavily on the special appeal a customer feels in the process of service encounter, the main participant in the said process being the frontline sales personnel. For the purpose of the research under study customer perception is defined as perception of the customer with respect to what they feel they actually receive from the service encounter

Journal of Business and Retail Management Research (JBRMR) Vol. 9 Issue 2 April 2015
www.jbrmr.com A Journal of the Academy of Business and Retail Management (ABRM) 32
which is measured with reference to customer expectations (Douglas & Connor, 2003, p.167). The research under study is mainly based on this discrepancy of or gap between expected service and perceived service from the customer’s perspective (Figure 2.2). This is in order to obtain a better understanding of how customers perceive service quality delivered in selected departmental stores. For the measurement of gap between customer expectation and customer perception of service quality delivered by frontline employees SERVQUAL model proposed by Kumar et.al. 2009 (Figure 2.2) is used.
3. Data & Research Methodology 3.1 Research Design The research design used is explanatory Sr.No
Research Questions
Research Objective
Hypotheses Questionnaire Tools Used
1. Do gap exist between customer expectations and customer perception of service effectiveness delivered by frontline employees?
To examine if gap exist between customer expectations and customer perception of service effectiveness delivered by frontline employees
Hypothesis 1 H0: There is no gap between customer expectation and customer perception of service effectiveness
A fifteen-item , seven –point scale that measures customer expectations & customer perception of service quality
Paired t-test
2. Which factors have significant impact on customer expectations of service effectiveness?
To investigate the factors that are prominent to describe customer expectations of service effectiveness
Hypothesis 2 H0 : There is no internal consistency and reliability among the variables selected in the study for conducting factor analysis focusing on customer expectation/customer perception of service effectiveness.
A fifteen-item , seven –point scale that measures customer perception/ customer perception of service quality
Cronbach’s Alpha ( α ) and factor analysis Kaiser-Meyer-Olkin
Measure of Sampling
Adequacy., Bartlett's Test of Sphericity
3. Which factors have significant impact on customer perception of service effectiveness?
To investigate the factors that are prominent to describe customer perception of service effectiveness
Hypothesis 3 H0 : There is no internal consistency and reliability among the variables selected in the study for conducting factor analysis focusing on customer perception of service effectiveness.
A fifteen-item , seven –point scale that measures customer perception of service quality
Cronbach’s Alpha ( α ) and factor analysis Kaiser-Meyer-Olkin
Measure of Sampling
Adequacy., Bartlett's Test of Sphericity
Table 3.1: Research Methodology Flow

Journal of Business and Retail Management Research (JBRMR) Vol. 9 Issue 2 April 2015
www.jbrmr.com A Journal of the Academy of Business and Retail Management (ABRM) 33
3.2. Sampling design The basic purpose of sampling is the extrapolation from the part to the whole—from “the sample” to “the population.” (The population is also referred to as “the universe.”) There is an immediate corollary: the sample must be chosen to fairly represent the population. Methods for choosing samples are called “designs.” There are 2 studies involved in this research Study 1: Gap between customer expectation & customer perception of service effectiveness Study 2: Factors those are prominent to describe customer expectations /customer perception of service effectiveness For Study 1 and Study 2 following sampling design strategy is used: A total of 1000 survey were received from the respondents who visit targeted departmental stores frequently located in central, harbor and western suburbs with a response rate of 80%, with an average of 20 customers per store. The following equation is used to calculate the sample size (S): S = z2 p(1-p) /e2
p = out of 100 respondents at least 40 will respond = (1.96)(1.96) (0.4)(0.4)/(0.5)(0/5) = 369 Now if it is taken into consideration that out of 40% respondents responding only 50 % have 1yr and more shopping experience with the present retailer than Sample Size = 369*2 = 738 Now it can be seen from the pilot study conducted that the response rate of the sample selected is 80%, thus the final sample size will be calculated as follows: Sample Size= 369*2*1.25 = 923 Thus for study 1 and study 2 the number of respondents should be at least 932. In this study the number of respondents is 1000 The individuals having shopping experience of 1 year or more in the departmental stores located in central, harbor and western suburbs of Mumbai were selected as sample for the field study with respect to study 1 and study 2. The method of sample selection includes convenience sampling.
4. Data analysis and Interpretation The tabulated data has been analyzed by using SPSS 17.0 consisting of the following statistical techniques:
Bivariate Analysis – It has involved only two variables and the methods related to this analysis include Paired t-test.
Multivariate Analysis – It has involved more than two variables at a time. It has explained the associations among more than two variables simultaneously. Factor Analysis is used.
Hypothetical Analysis – The hypothesis which is formulated has been tested by using paired t-test and Factor Analysis by using KMO and Bartlett’s Test of hypothesis.
H1 : There is no gap between customer expectation and customer perception of service effectiveness
H0: There is no gap between customer expectation and customer perception of service effectiveness

Journal of Business and Retail Management Research (JBRMR) Vol. 9 Issue 2 April 2015
www.jbrmr.com A Journal of the Academy of Business and Retail Management (ABRM) 34
4.1 Descriptive and bivariate analysis The findings of descriptive and bivariate analyses are presented next. Table 5.76 shows the results for the respondents’ expectations and perceptions of service effectiveness factors delivered by frontline sales personnel and also the service quality gap.
Attributes Expectations Perception Gap t-value p-value
Mean SD Mean SD
Physical Ambience 4.62 2.08 3.74 2.08 -0.88 9.58 7.18E-21
Employee Appearance 4.65 2.11 3.93 2.04 -0.72 7.73 2.55E-14
Timeliness 4.50 1.96 3.71 1.91 -0.79 9.21 1.91E-19
Problem Solving Attitude 4.44 1.93 3.82 2.06 -0.62 7.09 2.47E-12
Extra-Assistance 4.67 2.07 3.82 2.13 -0.85 8.89 2.91E-18
Prompt Service 4.51 1.98 4.40 1.92 -0.11 1.27 0.204133
Instills To Confidence & Safety 4.62 2.03 4.10 2.04 -0.52 5.84 7.10E-09
Accuracy Of Service 4.43 1.89 3.73 1.88 -0.70 7.99 3.61E-15
Knowledge Of Products 4.75 1.96 4.47 2.04 -0.28 3.17 0.001544
Politeness 4.66 1.99 4.66 1.99 0.00 -0.03 0.9724
Willingness To Help Customers 4.36 1.80 3.80 2.05 -0.56 6.46 1.58E-10
Multitasking Attitude 4.35 1.90 3.45 2.02 -0.90 10.25 1.58E-23
Ease Of Service 4.40 1.84 3.67 2.14 -0.73 8.14 1.2E-15
Consistent Service 4.58 2.03 3.31 2.03 -1.37 14.66 3.39E-44
Availability Of Staff 4.66 2.04 3.63 2.03 -1.03 11.32 4.87E-28
Overall mean for 15 attributes 4.55 3.88 -0.67
Table 4.1: Gap Analysis between Customer expectations and perception using paired t-test
Two tailed t-test p<0.0001 A comparison of customers’ perceptions of service effectiveness with their expectations is done using the paired samples t-test. Customers’ expectations and perceptions are measured on a 15 item, seven point Likert-type scale, where the higher the score, the greater the expectation (perception) of service effectiveness delivered by the frontline employees. The mean scores of customers’ expectations ranged from 4.43 to 4.75. The highest expectations were regarding the “the knowledge of products and services” rendered, followed by extra assistance provided to the customers by the frontline sales personnel. Thus it can be seen that customers expect the frontline sales personnel to be knowledgeable with respect to products and services rendered, which requires total clarity about the product and services on the part of the employees. Extra assistance attribute requires the frontline sales personnel to have the willingness to help and empowerment to take decisions in case of critical situations. Thus these two attributes demands absence of role ambiguity and role conflict. The overall mean score for service quality expectation items was 4.55. This score indicates rather high expectations of department store customers regarding the service effectiveness. The mean scores of customers’ perceptions ranged from 3.31 to 4.66. The lowest perception item is “consistent service” with a mean of 3.31, on the other hand the customer expectation of

Journal of Business and Retail Management Research (JBRMR) Vol. 9 Issue 2 April 2015
www.jbrmr.com A Journal of the Academy of Business and Retail Management (ABRM) 35
this item have mean of 4.58. On the other hand, customers’ highest perception item is politeness with a mean of 4.66. The overall mean score for service effectiveness perceptions items is 3.88. With respect to prompt service and politeness the p values are not statistically significant. The gap between mean values of expectation and perception of prompt service and politeness is -1.11 and 0.00 respectively. Thus there is very little gap in mean value of prompt service and no gap in mean value of politeness. According to the results in Table 4.1, department store customers’ expectations are higher than their perceptions of delivered service effectiveness. Thus, the SERVEFF gap is negative for all service effectiveness attributes expect for politeness which is zero. The next narrowest gap is for the attribute “prompt service”. These low negative gap scores imply that there is a small difference between perceived and expected service. Thus, these restaurant attributes are close to the expected service effectiveness. However, the widest gap is for the item “consistent service“, indicating that customers expected more consistency in service than they received. Finally, the overall SERVEFF gap is -0.67. These results imply that department store service effectiveness delivered by the frontline sales personnel should be improved, because all service effectiveness attributes were assessed below customers’ expectations expect politeness.
Scale of Reliability or Reliability Analysis (Customer Expectations of Service-Effectiveness) Before conducting a Factor analysis, the scale of reliability is used to find out the internal consistency of the variables to be used in Factor analysis. Reliability is synonymous with repeatability. It is a measurement that yields consistent results over time is said to be reliable. When a measurement is prone to random error, it lacks reliability. The reliability of an instrument places an upper limit on its validity. A measurement that lacks reliability will also lack validity. If the scale of reliability is close to 1, then it can be concluded that the variables are suitable for conducting factor analysis. Reliability analysis is a popular and SPSS method is used for measuring the internal consistency of the variables.
Cronbach Alpha(α) is designed as a measure of internal consistency. Alpha is measured on the same scale as a Pearson (r) correlation coefficient which varies between 0 and 1. The closer the α to 1, the greater the internal consistency of items in the instrument being assessed.
Table 4.2: Reliability Statistics for Alpha Value Inference : It can be observed from the Table 4.2, the value of Alpha (α ) is 0.811. We can conclude that the variables are having high internal consistency and hence these variables are considered to be suitable for conducting factor analysis
4.2 Factor Analysis (Customer Expectations of Service-Effectiveness) The following hypothesis is tested by using Barlett’s test of sphericity to determine the internal consistency and reliability among the variables used in the study
Hypothesis 2 H0 : There is no internal consistency and reliability among the variables selected in the study for conducting factor analysis focusing on customer expectations of service effectiveness. H2: There is an internal consistency and reliability among the variables selected in the study for conducting factor analysis focusing on customer expectations of service effectiveness.
Cronbach’s Alpha ( α ) N of Items
.811 15

Journal of Business and Retail Management Research (JBRMR) Vol. 9 Issue 2 April 2015
www.jbrmr.com A Journal of the Academy of Business and Retail Management (ABRM) 36
Kaiser-Meyer-Olkin Measure of Sampling Adequacy.
.926
Bartlett's Test of Sphericity
Approx. Chi-Square 25473.243
Df 105
Sig. .000
Table 4.3: KMO and Bartlett’s Test of hypothesis (for factor analysis) Df – degrees of freedom Sig: Significance Level Inference : It can be seen from the table 4.3 that the significance (0.00) is less than the assumed value (0.05). So we reject H0. This means that factor analysis is valid. The value of KMO coefficient should be always more than 0.5. The table value shows that it is 0.926. So this implies that factor analysis for data reduction is very effective
Factors Initial Extraction
Physical Ambience 1.000 .963
Employee Appearance 1.000 .957
Timeliness 1.000 .934
Problem Solving Attitude 1.000 .514
Extra-Assistance 1.000 .708
Prompt Service 1.000 .669
Instills To Confidence & Safety 1.000 .542
Accuracy Of Service 1.000 .299
Knowledge Of Products 1.000 .969
Politeness 1.000 .947
Willingness To Help Customers 1.000 .492
Multitasking Attitude 1.000 .953
Ease Of Service 1.000 .958
Consistent Service 1.000 .973
Availability Of Staff 1.000 .960
Table 4.4: Communalities for Customer expectations Based on the table 4.4, the following graph which is called as Scree Plot is plotted to
know the number of factors which is available in the analysis can be determined
Graph 4.1 Scree plot for customer expectations
From the above graph of Scree plot 4.1, it can be concluded that the factors having the Eigenvalues more than 1 have to be considered. This study determines 4 factors.

Journal of Business and Retail Management Research (JBRMR) Vol. 9 Issue 2 April 2015
www.jbrmr.com A Journal of the Academy of Business and Retail Management (ABRM) 37
Table 4.5: Rotated Component Matrix (for deciding the number of factors)
From the Table 4.5 of Rotated Component Matrix, it can be seen that the four factors can be classified as follows: Factor 1: Factor 2: Factor 3: Factor 4: Physical Ambience Willingness to help Confidence & Safety Extra-assistance Employee Appearance Availability of staff Prompt service Politeness Timeliness Knowledge of Products Multitasking Attitude Ease of Service Consistent Service The factors are renamed as follows: Factor 1 – Appearance & Service Factors Factor 2 – Customer Factors Factor 3 – Behavioral Factors Factor 4 – Assistance Factors From the Factor analysis it states that Appearance & Service Factors, Customer Factors, Behavioral Factors & Assistance Factors are highly significant in building the customer expectations.These factors are further called as service effectiveness factors and used to examine the dependency of service effectiveness factors and frontline employee role performance towards the customers in the further study using non parametric chi square test to test the dependency.
Scale of Reliability or Reliability Analysis (Customer Perceptions of Service-Effectiveness) Before conducting Factor analysis, the scale of reliability is used to find out the internal consistency of the variables to be used in Factor analysis. Reliability is synonymous with repeatability. It is a measurement that yields consistent results over time is said to be reliable. When a measurement is prone to random error, it lacks reliability. It must be remembered that the reliability of an instrument places an upper limit on its validity. A measurement that lacks
Variables Component
1 2 3 4
Physical Ambience .978 .078 -.010 .013
Employee Appearance .975 .073 -.018 .018
Timeliness .964 .064 -.005 .012
Problem Solving Attitude .083 .498 -.166 .482
Extra-Assistance .015 -.119 .065 .830
Prompt Service -.021 -.163 .769 .226
Instills To Confidence & Safety -.021 .242 .646 -.256
Accuracy Of Service -.182 -.497 -.097 .097
Knowledge Of Products .982 .067 -.004 .019
Politeness .018 .076 -.017 .970
Willingness To Help Customers -.026 .701 -.017 -.017
Multitasking Attitude .973 .076 -.020 .018
Ease Of Service .975 .074 -.021 .022
Consistent Service .983 .077 -.012 .014
Availability Of Staff .064 .978 .002 .017
Journal of Business and Retail Management Research (JBRMR) Vol. 9 Issue 2 April 2015
www.jbrmr.com A Journal of the Academy of Business and Retail Management (ABRM) 38
reliability will also lack validity. If the scale of reliability is close to 1, then it can be concluded that the variables are suitable for conducting factor analysis. Reliability analysis is a popular and frequently used SPSS method of measuring the internal consistency of the variables.
Cronbach Alpha(α) is designed as a measure of internal consistency. Alpha is measured on the same scale as a Pearson (r) correlation coefficient which varies between 0 and 1. The closer the α to 1, the greater the internal consistency of items in the instrument being assessed.
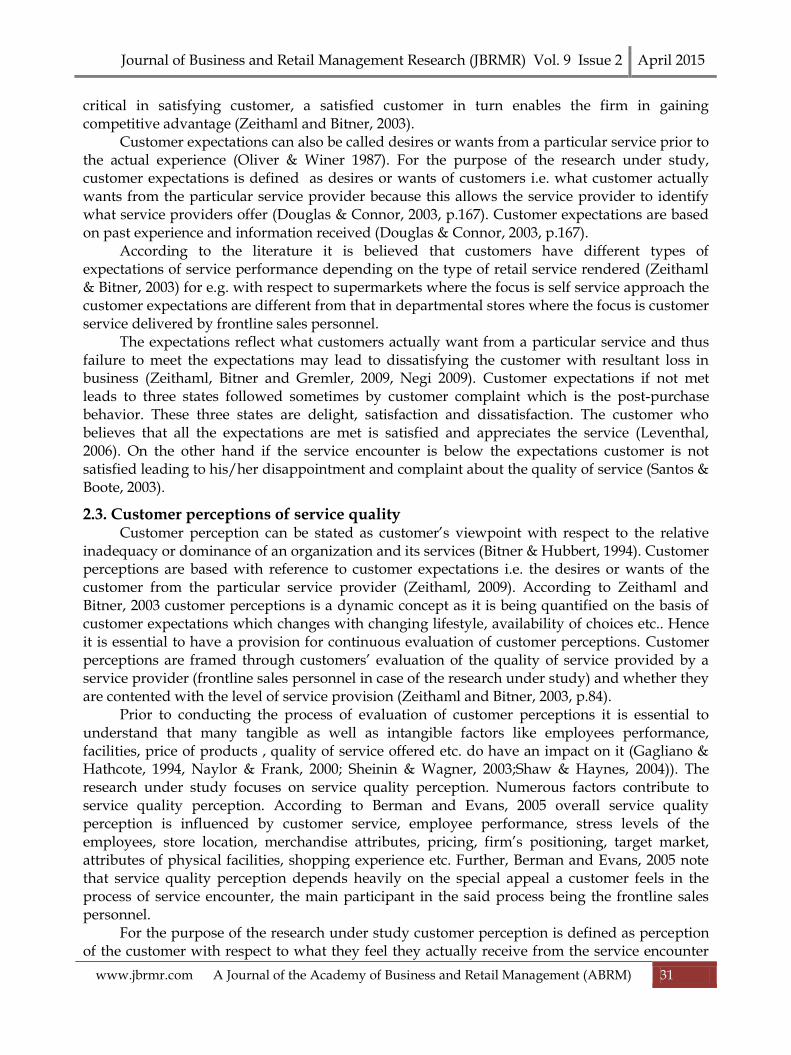
Table 4.6: Reliability Statistics for Alpha Value Inference : It can be observed from the Table 4.6, the value of Alpha (α ) is 0.780. We can conclude that the variables are having high internal consistency and hence these variables are considered to be suitable for conducting factor analysis.
4.3 Factor Analysis (Customer Perceptions of Service-Effectiveness) The following hypothesis is tested by using Barlett’s test of sphericity to determine the internal consistency and reliability among the variables used in the study
Hypothesis 3 H0: There is no internal consistency and reliability among the variables selected in the study for conducting factor analysis. H3: There is an internal consistency and reliability among the variables selected in the study for conducting factor analysis
Kaiser-Meyer-Olkin Measure of Sampling Adequacy.
.946
Bartlett's Test of Sphericity
Approx. Chi-Square 19489.224
Df 105
Sig. .000
Table 4.7: KMO and Bartlett’s Test of hypothesis (for factor analysis) Df – degrees of freedom Sig: Significance Level Inference: It can be seen from the table 5.80 that the significance (0.00) is less than the assumed value (0.05). So we reject H0. This means that factor analysis is valid. The value of KMO coefficient should be always more than 0.5. The table value shows that it is 0.946. So this implies that factor analysis for data reduction is very effective.
Factors Initial Extraction
Physical Ambience 1.000 .396
Employee Appearance 1.000 .277
Timeliness 1.000 .937
Problem Solving Attitude 1.000 .941
Extra-Assistance 1.000 .948
Prompt Service 1.000 .289
Instills To Confidence & Safety 1.000 .162
Accuracy Of Service 1.000 .532
Knowledge Of Products 1.000 .195
Politeness 1.000 .942
Willingness To Help Customers 1.000 .505
Cronbach’s Alpha ( α ) N of Items
.780 15

Journal of Business and Retail Management Research (JBRMR) Vol. 9 Issue 2 April 2015
www.jbrmr.com A Journal of the Academy of Business and Retail Management (ABRM) 39
Multitasking Attitude 1.000 .959
Ease Of Service 1.000 .968
Consistent Service 1.000 .955
Availability Of Staff 1.000 .953
Table 4.8: Communalities for Customer perceptions Based on the table 4.8, the following graph which is called as Scree Plot is plotted to know the number of factors which is available in the analysis can be determined
Graph 4.2: Scree plot for customer perceptions
From the above graph of Scree plot 4.2, it can be concluded that the factors having the Eigenvalues more than 1 have to be considered. This study determines 3 factors.
Table 4.9: Rotated Component Matrix (for deciding the number of factors) From the Table 4.9 of Rotated Component Matrix, it can be seen that the three factors can be classified as follows: Factor 1: Factor 2: Factor 3:
Timeliness Problem solving attitude Physical ambience Extra-assistance Multitasking attitude Availability of staff
Variables Component
1 2 3
Physical Ambience .113 .047 .617
Employee Appearance -.303 .410 .130
Timeliness .965 .025 -.065
Problem Solving Attitude .005 .969 -.049
Extra-Assistance .973 .015 -.042
Prompt Service .100 .141 -.509
Instills To Confidence & Safety .153 .012 -.372
Accuracy Of Service .133 .562 .445
Knowledge Of Products .161 .404 -.076
Politeness .966 -.026 -.086
Willingness To Help Customers .094 -.655 .258
Multitasking Attitude .026 .978 -.045
Ease Of Service .982 .020 -.057
Consistent Service .975 .034 -.052
Availability Of Staff .049 .026 .976

Journal of Business and Retail Management Research (JBRMR) Vol. 9 Issue 2 April 2015
www.jbrmr.com A Journal of the Academy of Business and Retail Management (ABRM) 40
Politeness Ease of Service Consistent Service The factors are renamed as follows: Factor 1 Service Factors Factor 2 – Attitude Factors Factor 3 – Ambience Factors From the Factor analysis it states that Service Factors, Attitude & Ambience Factors are highly significant in understanding the customer perceptions
4.4 Demographic data of customers Out of the 1000 respondents surveyed, 36.2% were male and 63.8% were female. Thus it can be inferred that number of females shopping in departmental stores is more than number of males. This data can be useful to design the marketing & promotion strategies of product & services marketing to have an impact on the target audience. In terms of the age factor, out of 1000 respondents surveyed, 73.7 % of the shoppers are in the age group of 31 yrs & above. This data can be useful to design the marketing & promotion strategies of product & services marketing to have an impact on the target audience. On the educational front, out of 1000 respondents surveyed 12.3%SSC, 44.9% are HSC, 28.1% are Graduates & 14.7% are Masters. Out of 1000 respondents surveyed, 32.2% are single and 67.8% are married .Thus it can be inferred that number of married customers is more than the number of single customers. This data can be useful to design the marketing & promotion strategies of product & services marketing to have an impact on the target audience for e.g. family discount coupons etc. Out of 1000 respondents surveyed, 24.5% are students, 27.1 % are self employed, 25.9 % are employed with some or the other organization, 13.1 % are homemaker & 9.4% are retired. Thus it can be inferred that 53% of the respondents are either employed or self employed. This data can be useful to design the marketing & promotion strategies of product & services marketing to have an impact on the target audience for e.g. family discount coupons etc. Out of 1000 respondents surveyed, 62.9% have annual income 2, 00,000 Rs. and above. Out of 1000 respondents surveyed, 75.8% has monthly spending in the range of 5001 Rs. and 15,000 Rs. Out of 1000 respondents surveyed, 67.3% visit the departmental stores at weekend afternoon & weekend evening .Thus it can be inferred that frequency of visit is more during weekend afternoon & weekend evening, proper measures should be incorporated to cater to the same. Out of 1000 respondents surveyed, only 25.9% have association with the given departmental stores for 3 yrs & more .Thus it can be inferred that measures have to be taken to increase the customer satisfaction & loyalty as 41.6 % customers are switching departmental stores every 1-2 yrs.
5. Discussion & Summary The department stores should manage customer expectations. The findings of the study have revealed that there is gap between customers’ expectation and perception of service effectiveness in department stores. Thus there is need bridge the gap for improved customer satisfaction which will lead to customer retention and customer loyalty. According to the analysis customers had very high expectation on the knowledge of products and services, extra assistance, politeness, availability of staff and employee appearance. The highest expectations were regarding the “the knowledge of products and services” rendered, followed by extra assistance provided to the customers by the frontline sales personnel. Thus it can be seen that customers expect the frontline sales personnel to be knowledgeable with respect to products and
Journal of Business and Retail Management Research (JBRMR) Vol. 9 Issue 2 April 2015
www.jbrmr.com A Journal of the Academy of Business and Retail Management (ABRM) 41
services rendered, which requires total clarity about the product and services on the part of the employees. Extra assistance attribute requires the frontline sales personnel to have the willingness to help and empowerment to take decisions in case of critical situations. Thus these two attributes demands absence of role ambiguity and role conflict. Thus this provided an understanding that retailers training programs should focus on these major dimensions. Employees should always be knowledgeable about products and services and willing to assist customers and stay polite in all their service performances (Bateson et.al., 1985). The highest gap between customer expectation and customer perception is with respect to consistent service and multitasking attitude. Thus identifying factors that contribute to the gap would help retailers in proper planning of hr policies with respect to recruitment and selection, induction & training etc.
6. Limitation of empirical study This dissertation provides insight into both theoretical and managerial implications. However, as is true with any study, the findings of this dissertation should be viewed with caution due to the following limitations. The current study is limited by the use of a single format of organized retail, homogenous sampling organizations, length of the survey instrument, social desirability, and confidentiality with respect to names of departmental stores from which data is obtained from customers as the topic of service effectiveness is sensitive.
7. Direction for Future research The findings of the study provide an insight into the customer expectations and customers perception of service effectiveness delivered by the frontline sales personnel along with the gap that exist between the two. This would provide a future scope of research with respect to the reasons for existence of the gap and the means that can be implemented by the management to bridge the gap depending on the reasons for the existence of the gap.
References Blem, N (1995) Service Please South Africa, South Africa: Creda Press (PTY) LTD. Brown, S.W. and Bond, E.U. III (1995).The internal/external framework and service quality:
Toward theory in services marketing. Journal of Marketing Management, February, pp. 25-39.
Curry, A. (1999). Innovation in public service management. Managing Service Quality, Vol.9, No.3, pp. 180-190.
Dotchin, J.A. and Oakland, J.S. (1994a).Total quality management in services: Part 2 Service quality. International Journal of Quality & Reliability Management, Vol. 11, No. 3, pp. 27-42.
Douglas, L. & Connor, R. (2003). Attitudes to service quality- the expectation gap, Nutrition & Food Science, Vol. 33 Number 4, pp.165-172.
Edvardsen, B., Tomasson, B. and Ovretveit, J. (1994).Quality of Service: Making it Really Work. McGraw-Hill, New York, NY.
Gabbie, O. and O'Neill, M.A. (1996).SERVQUAL and the northern Ireland hotel sector: A comparative analysis – Part 1, Managing Service Quality, Vol.6, No.6, pp. 25-32.
Gagliano, K.B. &Hathcote, J (1994). Customer Expectations and Perceptions of Service Quality in Retail Apparel Speciality Stores. Journal of Services Marketing, Volume.8, Issue No 1, p. 60-69.
Gronroos, C. (1982). A service quality model and its marketing implications, European Journal of Marketing, Vol.18, Number 4, p.36-44.
Journal of Business and Retail Management Research (JBRMR) Vol. 9 Issue 2 April 2015
www.jbrmr.com A Journal of the Academy of Business and Retail Management (ABRM) 42
Kumar, M., Kee, F. T. & Manshor, A. T. (2009). Determining the relative importance of critical factors in delivering service quality of banks; An application of dominance analysis in SERVQUAL model, Managing Service Quality, Vol. 19, Number 2, p. 211-228
Leventhal, R. C. 2006. Customer Loyalty, Retention, and Customer Relationship Management.Bradford, GBR: Emerald Group Publishing Ltd.
Lewis, B.R. and Mitchell, V.W. (1990). Defining and measuring the quality of customer service. Marketing Intelligence & Planning, Vol. 8, No. 6, pp. 11-17.
Lewis, R.C. and Booms, B.H. (1983). The marketing aspects of service quality", in Berry, L., Shostack, G. and Upah, G. (Eds), Emerging Perspectives on Services Marketing , American Marketing Association, Chicago, IL, pp. 99-107.
Luk, Sh.T.K. and Layton, R. (2002). Perception Gaps in customer expectations: Managers versus service providers and customers. The Service Industries Journal, Vol.22, No.2, April, pp. 109-128.
Mersha T, Adlakha V, (1992). Attributes of SQ: The Consumers’ Perspective. International Journal of Service Industry Management, Vol.3 (3), pp. 55-70.
Naylor, G.. & Frank, K. E. (2000). The impact of retail sales force responsiveness on consumers’ perception of Value. Journal of Service Marketing. Vol 14. No. 4. pp. 310-322. http://dx.doi.org/10.1108/08876040010334529
Negi, R. (2009). Determining customer satisfaction through perceived service quality: A study of Ethiopian mobile users, International Journal of Mobile Marketing; Vol.4, Number 1; p.31-38.
Oliver.R.L. & Winer, R. S. (1987). A framework for the formation and structure of consumer expectations: review and propositions. Journal of economic psychology, Vol. 8, No. 4, pp.469-499.
Parasuraman, A., Zeithaml, V. A., & Berry, L. L. (1988). SERVQUAL: A multiple-item scale for measuring consumer perceptions of service quality, Journal of Retailing, Vol. 64, Number 1, p.17.
Parasuraman, A., Zeithaml, V.A. and Berry, L.L. (1985). A conceptual model of service quality and its implication. Journal of Marketing, Vol. 49, Fall, pp. 41-50.
Parasuraman, A., Zeithaml, V.A. and Berry, L.L. (1986). SERVQUAL: a multiple-item scale for measuring customer perceptions of service quality. Report No. 86-108, Marketing Science Institute,Cambridge, MA.
Santos, J. and J. Boote (2003). A theoretical exploration and model of consumer expectations, post purchase affective states and affective behaviour. Journal of Consumer Behaviour, Volume 3, Number 2, p.142-156.
Shahin, A. (2005). SERVQUAL and Model of Service Quailty Gaps: A framework for determining and prioritizing critical factors in delivering quality services, Department of Management, University of Isfahan, Iran, p.1-10. Available On http://www.proserv.nu/Docs/Servqual.
Shaw, D., & Haynes, B. (2004). An Evaluation of consumer perception of FM service delivery. Journal of Facilities. Vol.22. No. 7/8. pp.170-177.
http://dx.doi.org/10.1108/02632770410547534. Sheinin, D. A., & Wagner, J. (2003). Pricing store brands across categories and retailers. Journal of
product and brand management. Vol. 12. No. 4. pp. 210-219. http://dx.doi.org/10.1108/10610420310485023. Van Iwaarden, J., van der Wiele, T., Ball, L., and Millen, R. (2003). Applying SERVQUAL to
websites: An exploratory study. International Journal of Quality & Reliability Management, Vol.20, No.8.
Journal of Business and Retail Management Research (JBRMR) Vol. 9 Issue 2 April 2015
www.jbrmr.com A Journal of the Academy of Business and Retail Management (ABRM) 43
Weitz, B &Wensley, R (2002). Handbook of Marketing, London: Sage Publications Wisniewski, M. (2001). Using SERVQUAL to assess customer satisfaction with public sector
services. Managing Service Quality, Vol.11, No.6, pp. 380-388. Wisniewski, M. and Donnelly, M. (1996). Measuring service quality in the public sector: the
potential for SERVQUAL. Total Quality Management, Vol. 7, No. 4, pp. 357-365. Zeithaml, V, A. & Bitner, M, J. (2003) Service Marketing: Integrating Customer Focus Across the
Firm, New York: McGraw-Hill Higher Education. Zeithaml, V, A. & Bitner, M, J. (2009) Service Marketing: Integrating Customer Focus Across the
Firm, New York: McGraw-Hill Higher Education Zeithaml, V. (1988). Consumer perceptions of price, quality and value: A means-end model and
synthesis of evidence. Journal of Marketing, Vol. 52 No. 3, pp. 2 – 22. Zeithaml, V.A., Parasuraman, A. and Berry, L.L. (1990), Delivering quality service; Balancing
customer perceptions and expectations, The Free Press, New York, NY.