An approach to measuring influence and cognitive similarity in computer-mediated communication
12
An approach to measuring influence and cognitive similarity in computer-mediated communication Paul Dwyer ⇑ Atkinson Graduate School of Management, Willamette University, 900 State Street, Salem, OR 97301, United States article info Article history: Available online 21 November 2011 Keywords: Influence Cognitive similarity Discourse analysis Language similarity abstract While many explanations of influence have been proposed there is still debate over which is correct even though most are supported by empirical evidence. This uncertainty has been attributed to there being too little evidence of real-world influence networks, and an inability to separate influence from cognitive similarity, that is, a pre-existing like-mindedness, attitude or way of thinking shared among participants. This paper proposes theme resonance, a new metric for measuring both influence and cognitive similarity between and among participants in the same online conversation. Theme resonance is derived from two textual content analysis systems: Centering Resonance Analysis and qualitative thematic modeling. The use of theme resonance is demonstrated by constructing influence networks using online conversations in ten weblogs, allowing the propagation of new conversational themes to be traced from initiator though subsequent propagators. A method of separating influence from like-mindedness is also demonstrated. Depending on the metric chosen influence and its susceptibility were found both to be opposite ends of the same spectrum, and distinct attributes. In either case the majority of blog participants are close to the low end of each characteristic. However, those at the higher ends are shown to be easily and dis- tinctly identified. Ó 2011 Elsevier Ltd. All rights reserved. Who influences the thoughts of their times, influences all the times that follow. –Hypatia of Alexandria 1. Introduction A blog, a shortened form of weblog, is a website where an author, or discrete set of authors, displays articles, called posts or entries. Most blogs permit readers to add comments to posts and thereby are a vehicle for conversation and collective intelligence, tapping the knowledge of a group. The provision for commenting makes blog conversations an example of user-generated content (UGC). A blog differs from a forum, newsgroup, or general online community in that an author initiates the discussion; there is an explicit desire to influence a community to discuss a particular to- pic. Latane’s (1981) Social Impact Theory leads us to expect that official status makes a blog author high in strength, one of three factors that confer influence. However, Balasubramanian and Mahajan (2001) noted that people are drawn into virtual community participation by the promise of three sources of value: (1) focus-related, where the community as a whole benefits from everyone’s contribution, (2) consumption, the benefit individuals receive personally, and (3) approval, the satisfaction from seeing others approve of one’s contributions. Following the blog author’s lead may result in receiving approval. But what if the community sees some other topic of conversation as being more valuable? Will seeking the other sources of value cause leaders to emerge from the membership, gaining influence through attention to what they say? It is no longer easy to identify those with influence, nor is it sufficient to focus on those with official status. It is also important to distinguish being the first to utter a thought, attitude or way of thinking shared by others (hereafter called cognitive similarity), from influencing others to adopt one’s thinking. The purpose of this paper is to propose and compare ways of estimating interpersonal influence and cognitive similarity in online venues that assesses the impact of everyone in the network of participants. Networks are a way of modeling ‘‘relationships among social entities’’ (Wasserman & Faust, 1994, p. 3). Regularities in the pat- terns of these relationships are used to infer influence. Four com- mon inferred influence metrics are degree centrality, closeness centrality, betweenness centrality and eigenvector centrality. Degree centrality measures the extent to which an actor has direct contact with others (Wasserman & Faust, 1994, p. 179). These actors are assumed to be widely-connected because they have been recog- nized by others as providing extraordinary value. Closeness cen- trality measures the ease with which an actor can interact with everyone in a network. Those with high closeness centrality de- pend less on others to relay information, their influence is thus less 0747-5632/$ - see front matter Ó 2011 Elsevier Ltd. All rights reserved. doi:10.1016/j.chb.2011.10.026 ⇑ Tel.: +1 503 370 6229; fax: +1 503 370 3011. E-mail address: [email protected] Computers in Human Behavior 28 (2012) 540–551 Contents lists available at SciVerse ScienceDirect Computers in Human Behavior journal homepage: www.elsevier.com/locate/comphumbeh
-
Upload
paul-dwyer -
Category
Documents
-
view
215 -
download
0
Transcript of An approach to measuring influence and cognitive similarity in computer-mediated communication

Computers in Human Behavior 28 (2012) 540–551
Contents lists available at SciVerse ScienceDirect
Computers in Human Behavior
journal homepage: www.elsevier .com/locate /comphumbeh
An approach to measuring influence and cognitive similarityin computer-mediated communication
Paul Dwyer ⇑Atkinson Graduate School of Management, Willamette University, 900 State Street, Salem, OR 97301, United States
a r t i c l e i n f o a b s t r a c t
Article history:Available online 21 November 2011
Keywords:InfluenceCognitive similarityDiscourse analysisLanguage similarity
0747-5632/$ - see front matter � 2011 Elsevier Ltd. Adoi:10.1016/j.chb.2011.10.026
⇑ Tel.: +1 503 370 6229; fax: +1 503 370 3011.E-mail address: [email protected]
While many explanations of influence have been proposed there is still debate over which is correct eventhough most are supported by empirical evidence. This uncertainty has been attributed to there being toolittle evidence of real-world influence networks, and an inability to separate influence from cognitivesimilarity, that is, a pre-existing like-mindedness, attitude or way of thinking shared among participants.This paper proposes theme resonance, a new metric for measuring both influence and cognitive similaritybetween and among participants in the same online conversation. Theme resonance is derived from twotextual content analysis systems: Centering Resonance Analysis and qualitative thematic modeling. The useof theme resonance is demonstrated by constructing influence networks using online conversations inten weblogs, allowing the propagation of new conversational themes to be traced from initiator thoughsubsequent propagators. A method of separating influence from like-mindedness is also demonstrated.Depending on the metric chosen influence and its susceptibility were found both to be opposite endsof the same spectrum, and distinct attributes. In either case the majority of blog participants are closeto the low end of each characteristic. However, those at the higher ends are shown to be easily and dis-tinctly identified.
� 2011 Elsevier Ltd. All rights reserved.
Who influences the thoughts of their times, influences all the times
that follow.–Hypatia of Alexandria
1. Introduction
A blog, a shortened form of weblog, is a website where anauthor, or discrete set of authors, displays articles, called posts orentries. Most blogs permit readers to add comments to posts andthereby are a vehicle for conversation and collective intelligence,tapping the knowledge of a group. The provision for commentingmakes blog conversations an example of user-generated content(UGC). A blog differs from a forum, newsgroup, or general onlinecommunity in that an author initiates the discussion; there is anexplicit desire to influence a community to discuss a particular to-pic. Latane’s (1981) Social Impact Theory leads us to expect thatofficial status makes a blog author high in strength, one of threefactors that confer influence. However, Balasubramanian andMahajan (2001) noted that people are drawn into virtualcommunity participation by the promise of three sources of value:(1) focus-related, where the community as a whole benefits fromeveryone’s contribution, (2) consumption, the benefit individuals
ll rights reserved.
receive personally, and (3) approval, the satisfaction from seeingothers approve of one’s contributions. Following the blog author’slead may result in receiving approval. But what if the communitysees some other topic of conversation as being more valuable? Willseeking the other sources of value cause leaders to emerge fromthe membership, gaining influence through attention to what theysay? It is no longer easy to identify those with influence, nor is itsufficient to focus on those with official status. It is also importantto distinguish being the first to utter a thought, attitude or way ofthinking shared by others (hereafter called cognitive similarity),from influencing others to adopt one’s thinking. The purpose of thispaper is to propose and compare ways of estimating interpersonalinfluence and cognitive similarity in online venues that assessesthe impact of everyone in the network of participants.
Networks are a way of modeling ‘‘relationships among socialentities’’ (Wasserman & Faust, 1994, p. 3). Regularities in the pat-terns of these relationships are used to infer influence. Four com-mon inferred influence metrics are degree centrality, closenesscentrality, betweenness centrality and eigenvector centrality. Degreecentrality measures the extent to which an actor has direct contactwith others (Wasserman & Faust, 1994, p. 179). These actors areassumed to be widely-connected because they have been recog-nized by others as providing extraordinary value. Closeness cen-trality measures the ease with which an actor can interact witheveryone in a network. Those with high closeness centrality de-pend less on others to relay information, their influence is thus less

P. Dwyer / Computers in Human Behavior 28 (2012) 540–551 541
diluted with noise (i.e., random error) introduced when informa-tion must pass through others. Betweenness centrality measuresthe extent to which ‘‘a particular actor might be able to controlinteractions between pairs of other actors in the network’’ (Wass-erman & Faust, 1994, p. 188). Highly central actors are often calledhubs (e.g., Goldenberg, Han, Lehmann, & Hong, 2009). Betweennesscan be an attribute of both individuals and the ties that connectthem, the latter often denoted edge betweenness (Girvan & New-man, 2002). Eigenvector centrality recognizes that individuals areinfluential, not only due to their own centrality, but also becauseof the centrality of those to whom they are connected (i.e., power-ful friends). The limitation of these metrics is that they measure apotential for influence in controlling the flow of ideas, rather thanany actual social or interpersonal influence that affected thethoughts of others. However, they are widely used as proxies forinterpersonal influence (Mason, Conrey, & Smith, 2007).
This paper proposes a very different means of estimating inter-personal influence and cognitive similarity between online word-of-mouth (WOM) participants and subsequent participants in thesame conversation. This methodology is a novel union of two tex-tual content analysis systems: Centering Resonance Analysis(CRA) and qualitative thematic modeling, described in greater detailin Sections 2.4.1 and 2.4.2. CRA turns a body of text into a network ofnouns and adjectives, those parts of speech that most indicate sub-ject (Corman, Kuhn, McPhee, & Dooley, 2002). The words that havethe most effect in giving text its coherence are found by identifyingthe words with the highest betweenness centrality, that is, wordsthat have importance because they connect other words together.Two bodies of text can be compared on the basis of commonalitiesin the betweenness of the same words used. CRA calls the quantita-tive measure of this similarity resonance. Qualitative thematic mod-eling augments CRA by allowing a body of text to be converted to anetwork of themes by looking the words up in a dictionary of wordsthat were manually assigned to general thematic categories, thusenabling the calculation of theme resonance. Themes are later ex-plained to be a more realistic way of tracking a conversation overtime because it is rare that people monotonously reuse the samewords as they converse. As explained in the sections to follow, thecentral premise of this study is that resonance quantifies the degreeto which the thoughts expressed by online WOM participants wereeither influenced by, or reflected a pre-existing cognitive similaritybetween those that preceded them in the same conversation.
The remainder of the paper is organized as follows. First, recentresearch into similar phenomena are compared and contrastedwith this study. Second, CRA is described in greater detail, alongwith the considerations that motivated modifying its use. Third,the manner in which it was modified is discussed by describinghow it was integrated with qualitative thematic modeling. Fourth,the use of this hybrid methodology is demonstrated on the ar-chives of ten diverse weblogs. Finally, some insights gained fromits use are discussed.
2. Review of recent related research
This study draws from two literature streams: the study ofinfluence, and the study and measurement of conversational lan-guage similarity over time. The following sections summarizehow each is applicable.
2.1. Influence
Five basic perspectives underlie influence research:
(1) Susceptibility, where the focus is on individuals for whomsome ideas are attractive, thus causing the ideas to be
embraced and repeated (e.g., Watts & Dodds, 2007; Weng,2010; Wilson & Lu, 2008). These individuals occupy a spec-trum in the number of ideas to which they are susceptible.
(2) Ideas as contagion, hereafter called the memetics perspectiveafter the meme, an idea that easily spreads from person toperson. Here the focus is on ideas that seem universallyattractive and therefore are easily spread (e.g., Adar & Ada-mic, 2005; Leskovec et al., 2007, 2009).
(3) Influence, where the focus is on individuals who seem ableto consistently attract others to their ideas (e.g., the opinionleaders of Song et al. (2007), Van den Bulte and Joshi (2007)).They might be characterized as consistent meme creators,putting the focus on the meme (e.g., Cassell, Huffaker, Tver-sky, & Ferriman, 2006). However, such a scenario is indistin-guishable from focusing on the creator as influential. Thisperspective also applies to those who analyze networkstructure to infer influence based on an ability to controlthe flow of ideas (e.g., Goldenberg et al., 2009; Katz & Lazars-feld, 1955). The focus on influencers seems to be the mostprevalent research perspective, having wide variety in theapproaches taken. In addition to those already cited somenotable examples that highlight this diversity are: Millerand Brunner (2008), who asked online course participantsto nominate those of their peers with the most social impact,and identified four interpersonal factors predicting suchimpact. Chen (2008) studied the effect of star-ratings andsales volume on future product sales. Similarly, Ye, Law,Gu, and Chen (2011) assessed the impact of valance (i.e.,positive or negative content) and variance among customerreviews on subsequent sales within the travel industry.
(4) Homophily, the love of those who are the same as you. Herethe focus is on some pre-existing attitude, like-mindednessor way of thinking (i.e., cognitive similarity) (Runkel, 1956)that brought people together. They tend to respond in kindto each other’s thoughts, not because any influence hasoccurred but because they are inherently attracted to thesame ideas. Shalizi and Thomas (2011) note the difficultyin separating the effects of homophily and influence whenexamining observable actions.
(5) Contextual imperative, where the focus is on a context thatresults in similar response from all affected by it. Neiderhof-fer and Pennebaker (2002) noted that people make conver-sation more efficient by gradually adopting the sameterminology in a process they call linguistic style matching.Shalizi and Thomas (2011) used the example of two peoplejumping from a bridge to avoid an oncoming train.
Some studies seem to straddle these perspectives by observinga system of influence and susceptibility: such as Van den Bulte andJoshi’s (2007) study of product innovators and their imitators, andWeng, Lim, Jiang and He’s (2010) study of Twitter users’ influenceover their followers. However, such studies can generally be re-duced to one of the base perspectives: if someone is consistentlyimitated then the focus should be on their influence (e.g., Vanden Bulte & Joshi, 2007), if they are occasionally widely imitatedthen the focus should be on the memes they created, or if imitatorspick and choose among innovations then the focus should be on asusceptibility that current imitators share (e.g., Weng et al., 2010).
One study that succeeded in bridging two perspectives, those ofinfluence and memetics, was Gomez-Rodriguez, Leskovec andKrause (2010) who modeled cascading news items on a globalscale through blogs and news websites and thereby inferred thehidden media network through which information diffused. Theirwork tracked the spread of links and short phrases in order to infera network of influencers. While they seemed to focus on theirmethodological contribution that made tractable the problem of

Fig. 1. Sentence word chain. Figure shows part of the word network composedfrom a comment posted to The Unofficial Apple Weblog (TUAW). It is readilyapparent that the word mac has high betweenness because it connects many otherwords together.
542 P. Dwyer / Computers in Human Behavior 28 (2012) 540–551
tracing the myriad of network paths an idea could traverse, theymade an important theoretical contribution by recognizing thatinfluence networks are ‘‘unknown and unobserved,’’ (p. 1) leavingresearchers more easily able to discern the idea contagion than thepath through which it traveled. That was an important insight be-cause many prior studies (two examples described below) as-sumed the presence of a network of connections between peoplebefore tracing influence effects within it. This study builds on thatinsight, but applies it on a much smaller scale: the diffusion ofideas between people within weblog conversations. Gomez-Rodri-guez et al. also support this study’s use of theme over word reso-nance in their recognition that word phrases often morph intodifferent but equivalent forms as they diffuse through a networkof people, they clustered these equivalent phrases and trackedthe diffusion of the cluster instead of each phrase.
2.2. Language similarity over time
The last section ended by noting that this study parallelsGomez-Rodriguez et al. in recognizing that even though conversa-tion maintains a continuity of themes, the words used to expressthose themes change as conversation evolves and ideas are propa-gated. Nevertheless, thematic continuity demands some degree oflanguage similarity.
Huffaker, Jorgenson, Iacobelli, Tepper and Cassell (2006) com-pared the results of using three methodologies to measure lan-guage similarity over time in online community discussions; oneof those methods Latent Semantic Analysis (LSA), a singular valuedecomposition-based technique that takes into account word re-use frequencies and any latent themes that seem to be indicated,is further described in a later section. They found the three meth-ods to be largely concurrent in their results, finding that languagesimilarity started off high and generally decreased over time asconversation evolved.
It is not unusual for studies that begin with a focus on analyzinglanguage similarity to conclude that influence was involved in thephenomenon. For example, Neiderhoffer and Pennebaker (2002)studied linguistic style matching in social interaction. They foundthat the terminology (i.e., technical or special words) used betweenparties in a conversation was largely identical; and, that the use of atheme (distinct from word use) in conversation by one participant,increased the probability that another participant would pick upthat theme as the conversation developed. Part of Neiderhofferand Pennebaker’s study analyzed the conversations between Nixonand his aides as documented by the Watergate transcripts. Nixon isdescribed as having ‘‘led the conversations’’ (p. 353). It followstherefore that the ability to lead the direction of a conversation isa valid indicator of interpersonal influence. Neiderhoffer andPennebaker recognized that the Watergate transcripts describedan extreme situation where there was an unusually large differencein social status between the participants. They noted that, in con-trast, most interactions exhibit participants taking turns leading aconversation. Nevertheless, their findings prompt the assumptionthat when a new theme is introduced, comments made thereafterthat resonate with that theme were influenced by whoever intro-duced it; and correlation in the use of the same words and thematicword categories (what they call Linguistic Markers of Synchrony(Neiderhoffer & Pennebaker, 2002, p. 344)) is evidence of influence.These conclusions seem supported by Huffaker (2010) who usedthe number of words repeated by conversation participants as ameasure of the extent to which they were influenced.
2.3. This study’s contribution
This study makes incremental contributions to the literature inthree ways:
(1) It modifies an existing language similarity metric to make itsuitable for tracking and measuring influence, and cognitivesimilarity.
(2) Watts and Dodds’ noted that ‘‘empirical evidence regardingreal world influence networks is limited.’’ (Watts & Dodds,2007, p. 443) This study adds such evidence with two distin-guishing attributes: (a) many of the studies mentionedabove share a focus on influence in binary decisions (e.g.,whether or not to repeat a news item (Leskovec, Backstrom,& Kleinberg, 2009) or buy a specific product (Van den Bulte& Joshi, 2007). This study differs from the norm by observingindividuals choose among multiple options, in this caseword choice (11,788 words in 182 thematic categories);and (b) studies that investigate influence among a networkof people often assume the presence of a network structurebefore any effects of influence are examined (e.g., Golden-berg et al., 2009; Watts & Dodds, 2007). In this study, theproposed resonance-based estimator is independent of net-work structure, indeed network structure is only consideredto exist where resonance was found to be present.
(3) It seems to be the first study to use the methodological rec-ommendations of the most recent study (Shalizi & Thomas,2011) in this research stream for reducing the confoundinginfluence of homophily.
This section has outlined the study of influence and how lan-guage similarity has been used as an indication of interpersonalinfluence. The next section introduces the primary technical con-cepts this study builds upon and the considerations that promptedbring them together.
2.4. Underlying technical concepts
2.4.1. Centering Resonance AnalysisCentering Resonance Analysis (CRA), a method of content anal-
ysis proposed by Corman, Kuhn, McPhee and Dooley (2002), turnsa body of text into a network of nouns and adjectives because theseparts of speech reveal the subject. The words that have the mosteffect in giving the text coherence are then found by finding thewords with the highest betweenness centrality, or simply between-ness. These are words that are important because they connectother words together. Fig. 1 shows part of the word network com-posed from a comment posted to The Unofficial Apple Weblog(TUAW). It is readily apparent that the word mac has highbetweenness because it connects many other words together. Cor-man et al. postulated that these word networks provided insightsinto the way knowledge was structured in the mind of the writer.The words with high betweenness represented the most salientcognitive associations. Corman et al. called the quantitative mea-

P. Dwyer / Computers in Human Behavior 28 (2012) 540–551 543
sure of a word’s betweenness its influence. Two separate bodies oftext can be compared on the basis of commonalities in the influ-ence of the same words used. Corman et al. called the quantitativemeasure of this similarity resonance; this paper refers to it as wordresonance.
As already noted, using word resonance to measure the extentto which one person influences another is consistent with the prin-ciple of linguistic style matching as Neiderhoffer and Pennebakernote:
In two studies from Internet chat rooms, individuals getting toknow one another in dyads exhibited linguistic style matching onboth the conversational level as well as on a turn-by-turn level.This coordinated use of language occurs at a remarkably basic leveland appears to hold up across the perceived quality. . . length. . .
[and context] of an interaction (p. 356 Neiderhoffer & Pennebak-er, 2002).
However, also consistent with other studies already described,it was reasoned that people conversing on a theme would monot-onously reuse the same words only to the extent they were refer-ring to specific entities, such as persons, or using technical terms(i.e., terminology). In the next section, another content analysismethodology is described that groups common words into the-matic categories. It was reasoned that it would be more effectiveto compare bodies of text on the basis of commonalities in thebetweenness of thematic categories, rather than focusing narrowlyon the reuse of words. By using such theme resonance, the assump-tion underlying word resonance (i.e., the broad reuse of exactwords) can be relaxed to merely assuming that the themes usedbetween parties in a conversation tend to be consistent.
2.4.2. Qualitative thematic modelingQualitative thematic modeling transforms a body of text into a
thematic histogram using one or more predefined tag dictionaries.A tag dictionary is a collection of words that have been manuallyassigned to one or more thematic categories. This study employedthe most commonly used tag dictionary, Harvard–Lasswell IV(HL4), which categorized 11,788 of the most-used words in theEnglish language into 182 thematic categories (Stone, 2011). Qual-itative thematic modeling uncovers latent themes in a body of textby ‘‘classifying [the] words into a smaller number of thematic cat-egories. . .the relative occurrence of the different categories indi-cate the underlying thematic content’’ (Genovese, 2002). While itis possible to construct a tag dictionary specifically for a researchproject, the major benefit of using a standard dictionary like HL4is that the classification of words is standardized and the probabil-ity of finding comparable results from another study is higher (We-ber, 1990). This way of inferring the themes present in a documentfrom manually assembled classification systems is generally con-sidered to be antiquated in comparison to probabilistic techniquessuch as that described in the next paragraph. However, the wide-spread and random use of synonyms in human communicationsoften confounds such probabilistic systems. Nevertheless, as thenext paragraph describes, a probabilistic methodology is used asa point of comparison.
2.4.3. Latent Semantic AnalysisLatent Semantic Analysis (LSA) is a probabilistic technique for
inferring the topics present in a set of documents by using singularvalue decomposition to reduce a term-document matrix (the rowsare terms used in the documents, each column represents a docu-ment and each cell contains an indication of the number of timesthe term was used in each document) to a lower dimensionality(i.e., fewer columns that now represent topics shared across thedocuments) where similarities between the words in the rows are
generally maintained. When one has a term-topic matrix, one canuse it with the original term-document matrix to calculate a docu-ment-topic matrix. Since each topic can be thought of as a principalcomponent or dimension defining a topical space, each documentcan be located within that space using the contents of the cells ofthe document-topic matrix as coordinates. Euclidean distance or,more appropriately because resonance is a similarity metric, cosinesimilarity between documents can then be calculated and used as acomparable metric to theme resonance, similar to the way LSA wascompared to other metrics by Huffaker et al. (2006).
2.4.4. HomophilyAral, Muchnik, and Sundararajan (2009) seems to be the first
study to anticipate that the inherent similarities between peoplethat have correlated behaviors impose an upward bias or con-founding effect on any estimates of influence between them. Theytried to compensate for that confounding effect by removing fromtheir study pairs of subjects whose propensity to adopt the samebehavior was estimated to be greater than two standard deviationsfrom the mean. Shalizi and Thomas (2011) expressed dissatisfac-tion with this approach because it assumes: (1) a central tendency(normal distribution around a group mean) to homophily’s effectwhen the homophily construct has neither been identified nor itsvalues estimated; and (2) that the effects of homophily operateprecisely in parallel (i.e., in the same line of action) with the effectsof influence. Shalizi and Thomas recommended that one way ofreducing (but not eliminating) the confounding effect is to is touse a community discovery methodology such as that developedby Girvan and Newman (2002) to divide a network into clustersthat are densely connected internally, but sparsely connected be-tween clusters. Supposed influence effects between members ofthe same cluster would be attributed to homophily and discarded,while those that cross clusters would be kept. This is the approachtaken in this study.
The concepts applicable to measuring influence and cognitivesimilarity have been described; the next section discusses the spe-cific details of implementation.
3. Data and methodology
3.1. Selecting and gathering the data
As already described, a blog differs from a forum, newsgroup, orgeneral online community in that an author initiates the discus-sion. Since there is an explicit desire to influence a community todiscuss a particular topic, a blog is an ideal context in which tostudy influence. The methodology described in this study is dem-onstrated on the posting and community response data from tendiverse blogs that cover a wide spectrum of conversational topics(see Table 1), selected in accordance with the netnography method-ology proposed by Kozinets (2002). Kozinets introduced netnogra-phy as a methodology in which the principles of ethnography, orunobtrusive observation, are applied to study virtual communities.He specified a selection criterion for subject communities that dif-fered from the practice of standard ethnography: select communi-ties that are focused on a research question–relevant topic, receiveabove-average posting traffic, have a large number of contributingmembers, contain descriptively rich content, and enjoy a high levelof member-to-member interaction. This criterion was adopted forthe selection of blogs used in this study, as evidenced by the num-bers of posts, comments and commenters summarized in Table 1.The data associated with each blog was analyzed separately.
The entire archive of posts and associated comments for eachblog was collected using a web scraping (the collection of datafrom output intended for the human reader of a website, the HTML
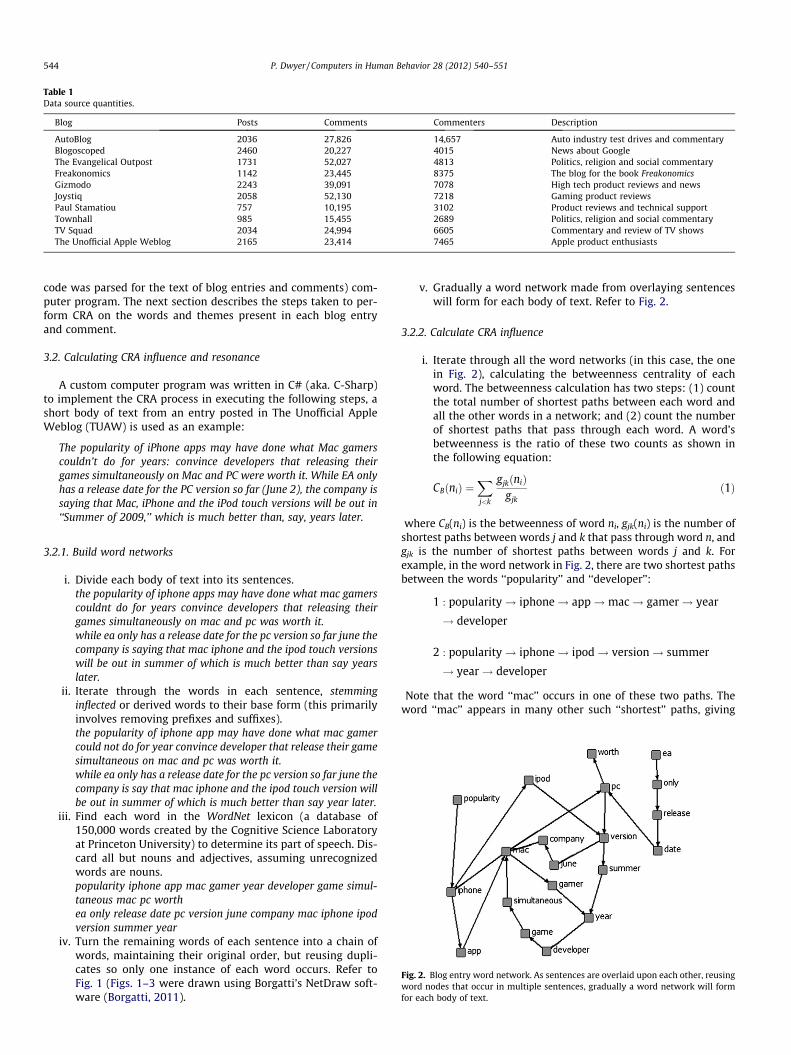
Table 1Data source quantities.
Blog Posts Comments Commenters Description
AutoBlog 2036 27,826 14,657 Auto industry test drives and commentaryBlogoscoped 2460 20,227 4015 News about GoogleThe Evangelical Outpost 1731 52,027 4813 Politics, religion and social commentaryFreakonomics 1142 23,445 8375 The blog for the book FreakonomicsGizmodo 2243 39,091 7078 High tech product reviews and newsJoystiq 2058 52,130 7218 Gaming product reviewsPaul Stamatiou 757 10,195 3102 Product reviews and technical supportTownhall 985 15,455 2689 Politics, religion and social commentaryTV Squad 2034 24,994 6605 Commentary and review of TV showsThe Unofficial Apple Weblog 2165 23,414 7465 Apple product enthusiasts
544 P. Dwyer / Computers in Human Behavior 28 (2012) 540–551
code was parsed for the text of blog entries and comments) com-puter program. The next section describes the steps taken to per-form CRA on the words and themes present in each blog entryand comment.
3.2. Calculating CRA influence and resonance
A custom computer program was written in C# (aka. C-Sharp)to implement the CRA process in executing the following steps, ashort body of text from an entry posted in The Unofficial AppleWeblog (TUAW) is used as an example:
The popularity of iPhone apps may have done what Mac gamerscouldn’t do for years: convince developers that releasing theirgames simultaneously on Mac and PC were worth it. While EA onlyhas a release date for the PC version so far (June 2), the company issaying that Mac, iPhone and the iPod touch versions will be out in‘‘Summer of 2009,’’ which is much better than, say, years later.
3.2.1. Build word networks
i. Divide each body of text into its sentences.
the popularity of iphone apps may have done what mac gamerscouldnt do for years convince developers that releasing theirgames simultaneously on mac and pc was worth it.while ea only has a release date for the pc version so far june thecompany is saying that mac iphone and the ipod touch versionswill be out in summer of which is much better than say yearslater.ii. Iterate through the words in each sentence, stemminginflected or derived words to their base form (this primarilyinvolves removing prefixes and suffixes).
the popularity of iphone app may have done what mac gamercould not do for year convince developer that release their gamesimultaneous on mac and pc was worth it.while ea only has a release date for the pc version so far june thecompany is say that mac iphone and the ipod touch version willbe out in summer of which is much better than say year later.iii. Find each word in the WordNet lexicon (a database of150,000 words created by the Cognitive Science Laboratoryat Princeton University) to determine its part of speech. Dis-card all but nouns and adjectives, assuming unrecognizedwords are nouns.
Fig. 2. Blog entry word network. As sentences are overlaid upon each other, reusingword nodes that occur in multiple sentences, gradually a word network will formfor each body of text.
popularity iphone app mac gamer year developer game simul-taneous mac pc worthea only release date pc version june company mac iphone ipodversion summer year
iv. Turn the remaining words of each sentence into a chain ofwords, maintaining their original order, but reusing dupli-cates so only one instance of each word occurs. Refer toFig. 1 (Figs. 1–3 were drawn using Borgatti’s NetDraw soft-ware (Borgatti, 2011).
v. Gradually a word network made from overlaying sentenceswill form for each body of text. Refer to Fig. 2.
3.2.2. Calculate CRA influence
i. Iterate through all the word networks (in this case, the onein Fig. 2), calculating the betweenness centrality of eachword. The betweenness calculation has two steps: (1) countthe total number of shortest paths between each word andall the other words in a network; and (2) count the numberof shortest paths that pass through each word. A word’sbetweenness is the ratio of these two counts as shown inthe following equation:
CBðniÞ ¼X
j<k
gjkðniÞgjk
ð1Þ
where CB(ni) is the betweenness of word ni, gjk(ni) is the number ofshortest paths between words j and k that pass through word n, andgjk is the number of shortest paths between words j and k. Forexample, in the word network in Fig. 2, there are two shortest pathsbetween the words ‘‘popularity’’ and ‘‘developer’’:
1 : popularity! iphone! app!mac! gamer! year
! developer
2 : popularity! iphone! ipod! version! summer
! year! developer
Note that the word ‘‘mac’’ occurs in one of these two paths. Theword ‘‘mac’’ appears in many other such ‘‘shortest’’ paths, giving

Fig. 3. Comment word network.
P. Dwyer / Computers in Human Behavior 28 (2012) 540–551 545
it a betweenness of 143. This measure is standardized by dividing itby the number of word pairs not including ‘‘mac,’’ that is:
C 0BðniÞ ¼CBðniÞ
ðw� 1Þðw� 2Þ=2¼ 143
171¼ 0:836 ð2Þ
where w is the number of words in the network.
3.2.3. Calculate word resonance
i. The following comment was added to the blog entry con-taining the text used to construct the word network ofFig. 2, the process described above was used to create itsword network in Fig. 3:
The Sims 3 will actually be released on the same day as its PCcounterpart—both versions are going to be on the same disc!It was confirmed by an EA staff member in their Sims commu-nity boards. This is great news, and it’s the first time a Simsgame will be released for Mac and PC at the same time.ii. These word networks overlap on five words, with between-nesses as shown in Table 2A. Multiply the betweenness cen-tralities of these overlapping words and add them up tocalculate the resonance between the two word networks.
3.2.4. Build theme networksFollow the same procedure as in step 1, but after finding a word
in WordNet search for the word in the HL4 tag dictionary and notethe categories associated with the word.
3.2.5. Calculate theme resonanceFollow the same procedure as in step 3, but in addition to look-
ing for commonalities in words used, look for commonalities inHL4 categories. Table 2B shows how the original word resonanceswere augmented with category resonances, raising the resonancebetween the two word networks from 0.801 to 1.275.
Step 1 of this procedure split all the bodies of text into thenouns and adjectives that most reflect their subject. This was alsothe first step in preparing to use Latent Semantic Analysis (LSA) toget results that could be compared with those of CRA. The next sec-tion describes the steps taken.
3.3. Latent Semantic Analysis
It has already been described how LSA uses singular valuedecomposition to reduce a term-document matrix to adocument-topic matrix. Since a blog is naturally segmented intoseparate conversations each beginning with a blog entry and aug-mented by following comments, it seemed logical to consider eachblog entry and its associated comments as a corpus of documents
that would reference the same topics. Therefore a matrix was con-structed for each corpus having a row for each word that was men-tioned by more than one document, and a column for the blogentry and each associated comment. Each matrix cell containedthe term frequency-inverse document frequency (tf-idf), a statisticalmeasure of the importance of a word to a document in the contextof a corpus as calculated by equation 3.
tf � idf ðt;dÞ ¼ tf ðt;dÞ � logðjDj=jd : t 2 djÞ ð3Þ
where tf(t,d) is the number of times a word t appears in documentd; |D| is the cardinality of D, the number of documents in the corpus;|d:t 2 d| the number of documents were word t appears; and log isthe natural logarithm.
Singular value decomposition was performed on each term-document matrix using Bluebit Software’s .NET Matrix Library(2011) to obtain a document-topic matrix. As already described,these topics are principal component dimensions within a topicalspace, and the contents of the document-topic matrix are docu-ment coordinates within that space. The study implemented a rank2 approximation (i.e., two dimensional) of each topical space byonly retaining the first two columns of each document-topic ma-trix. Finally, the cosine similarity between each document withineach corpus was calculated from the rank 2 approximationcoordinates.
At this stage, the study had two independent assessments ofdocument thematic similarity: one based on CRA, and another onLSA. Since the focus of this study was on measuring interpersonaleffects, in the next section document similarity is averaged amongand between pairs of blog participants to quantify the similaritybetween individuals on the basis of what they wrote.
3.4. From content similarity to ties between participants
Both resonance and cosine similarity between a blog entry andits comments, and between a blog entry’s comments are direc-tional, since content is introduced to the community’s conversationover time. Recall that this study assumed that when a new themewas introduced by either the blog entry or comments, then com-ments posted thereafter that resonated with that theme were eitherinfluenced by whoever introduced it, or represented a pre-existingcognitive similarity between the writers. Therefore the many com-munications among blog participants were summarized into direc-tional ties between pairs of individuals weighted by the meanresonance and cosine similarity between blog entries and theircomments, and among comments written by the two. Up until thispoint similarity in blog content has been attributed to influence,susceptibility or cognitive similarity. In the next section a descrip-tion is given of how the estimated effects of cognitive similarity,the essence of online homophily, were removed from the study.
3.5. Correcting for homophily
The last paragraph ends by describing how similarities betweenthe content created by individuals were summarized into mea-sures of similarity between individuals themselves. These similar-ities were modeled as directional ties that link blog participantstogether into a social network. Many of these ties were observedto be reciprocal, where individuals were found to express similarthoughts regardless of the order in which those thoughts were ex-pressed. These reciprocal ties were exported to the yEd Graph Edi-tor (2011), a free software program that implements Girvan andNewman’s (2002) algorithm for identifying communities within anetwork. As already described, Shalizi and Thomas (2011) recom-mended this algorithm for identifying clusters of participantswho seem like-minded to the extent of indicating probable hom-ophily. Reciprocal ties that connect participants within the same

Table 2Resonance calculated from betweenness.
Word Fig. 2 Betweenness Fig. 3 Betweenness Resonance (col. 2 times col. 3)
A. Word resonanceea 0.0000 0.3137 0.0000game 0.3509 0.2549 0.0894mac 0.8363 0.2549 0.2132pc 0.6199 0.5817 0.3606version 0.6374 0.2157 0.1375
Total 0.8007
Fig. 2Word
Fig. 3 Word General InquirerCategory
Fig. 2Betweenness
Fig. 3Betweenness
Resonance
B. Theme resonanceea ea 0.0000 0.3137 0.0000game game 0.3509 0.2549 0.0894mac mac 0.8363 0.2549 0.2132pc pc 0.6199 0.5817 0.3606version version 0.6374 0.2157 0.1375year time Time 0.3977 0.8889 0.3535company community Collective 0.2982 0.4052 0.1208
Total 1.2750
Note: The word networks in Figs. 2 and 3 overlap on five words, with betweennesses as shown inTable 2A. Multiply the betweenness centralities of these overlapping words and add them up tocalculate the resonance between the two word networks. In Table 2B the same procedure wasrepeated but the HL4 tag dictionary was searched, the associated categories noted and two moreword-pairs matched raising the resonance observed.
546 P. Dwyer / Computers in Human Behavior 28 (2012) 540–551
cluster were removed from further use by this study. This step wasfollowed independently for ties created by resonance and cosinesimilarity. In the next section the remaining ties are summarizedinto estimates of individual participant influence and susceptibil-ity, that is, the extent to which an individual initiates conversa-tional themes that get picked up by others, and the extent towhich individuals tend to propagate themes initiated by othersrespectively.
3.6. Identifying influencers and susceptibles
At this point of the study’s procedure there were directional tiesbetween participants that were weighted by the mean resonanceand cosine similarity of their content creation history. It was there-fore possible to calculate, from both resonance and cosine similar-ity, a mean source resonance and cosine similarity (MSR/MSCS) forboth blog authors and commenters, and a mean target resonanceand cosine similarity (MTR/MTCS) for commenters only. MSR/MSCS is the mean resonance and mean cosine similarity of thecomments following every blog entry or comment written by anindividual. MSR/MSCS is thus a candidate measure of cognitiveinfluence, the extent to which an individual influences the thinkingof others. MTR/MTCS is the mean resonance and mean cosine sim-ilarity of the comments and blog entries that came before everycomment written by an individual. MTR/MTCS is thus a candidatemeasure of the extent to which an individual’s thoughts wereinfluenced by others, that is, susceptibility. These metrics were aug-mented by exporting the homophily-corrected social network toNetworkX, an open-source network analysis software package(NetworkX, 2011), and calculating betweenness centrality, eigen-vector centrality and degree centrality for each participant. Thevarious candidate influence metrics were compared with correla-tion and exploratory factor analysis (EFA) for each blog. Table 3shows example results from TUAW, these results were consistentwith the results observed from the other blogs. You can see thatthe three conventional influence metrics (i.e., betweenness, degreeand eigenvector centrality) were highly correlated and were in-deed associated by EFA with one latent factor denoted informa-tion-flow influence. Source and target theme resonance from CRA
were also highly correlated but with negative polarity. That also re-sulted in EFA associating them with the same latent factor denotedinfluence-susceptibility spectrum, albeit with opposite polarity.Source and target cosine similarity from LSA were uncorrelatedand thus were deemed by EFA to indicate separate latent factorsdenoted LSA susceptibility and LSA influence respectively. Note thatthe conventional metrics were uncorrelated with the CRA and LSAmetrics, and the CRA and LSA metrics were uncorrelated with eachother.
When it was observed from results like those presented in Table3 that there was empirical regularity in the various metrics used bythis study and that blog participants could be differentiated bythem, graphs were plotted using resonance and cosine similarity.Fig. 4 shows how TUAW participants were located in a space de-fined by mean source resonance and mean target resonance axes.Similar plots were observed for the other blogs in the dataset.When it was observed that participants clustered decisively alongthe higher values of each axis, those clusters were tentatively des-ignated Influencers and Susceptibles. The most populous clusternear the origin was distinguished by being neither influential norable to be influenced. Table 3 shows the two resonance metricsare oppositely correlated indicators of a common factor. As a resulta histogram of how participants are distributed across that factor isincluded as an inset to Fig. 4. The resonance metric indicates thatinfluence and susceptibility are extreme aspects of the sameconstruct.
A similar graph was plotted using source and target cosine sim-ilarity and presented as Fig. 5. Even though Table 3 indicates thatsource and target cosine similarity reflect distinct constructs, thepattern depicted by Fig. 5 is similar to that in Fig. 4.
Now that blog interactions have been explored from influence,susceptibility and homophily perspectives, the next section closesthe investigation by looking at blog content from the memeticsperspective.
3.7. Do persons exert influence or are themes viral?
Dawkins noted that some ideas seem to be highly contagiousand quickly spread through a population, research into this phe-

Table 3TUAW participant influence metric correlation and exploratory factor analysis.
Eigenvector centrality Betweenness Degree centrality Theme resonance Cosine similarity
Target Source Target Source
Betweenness 0.799 1.000Degree centrality 0.965 0.780 1.000Theme MTR �0.056 �0.055 0.037 1.000Theme MSR 0.072 0.018 0.094 �0.117 1.000Cosine similarity (target) ns ns ns 0.107 �0.053 1.000Cosine similarity (source) ns ns ns �0.061 �0.087 ns 1.000
Information-flow influence 0.976 0.920 0.979 �0.138 �0.138 �0.004 �0.015Infl.�susc. spectrum 0.013 �0.023 0.003 0.808 �0.757 0.065 0.036LSA susceptibility 0.008 �0.010 0.015 �0.179 �0.259 0.965 0.010LSA influence �0.009 0.010 �0.014 0.070 �0.009 0.010 0.997% of variance 40.0 18.8 14.5 10.2Eigenvalues 2.80 1.31 1.01 0.93
All numerical correlations significant to q < .01 (ns are non-significant correlations).Notes: Table 3 shows a correlation matrix (top part) and an exploratory factor analysis (EFA) with varimax rotation of the five participant influence metrics. Note that thethree information-flow metrics are sufficiently correlated that EFA associates them together as indicating a common factor denoted information-flow influence. The target andsource versions of theme resonance were also associated together with opposite correlation into a factor denoted influence-susceptibility spectrum. The source and targetversions of cosine similarity were sufficiently distinct to be associated with separate factors denoted LSA influence and LSA susceptibility respectively.
Fig. 4. Resonance participant clusters. Figure shows how TUAW participants were located in a space defined by MSR and MTR axes, labeled influence and susceptibilityrespectively. Note that high levels of these two constructs do not characterize any participant.
P. Dwyer / Computers in Human Behavior 28 (2012) 540–551 547
nomenon is what this study has been calling the memetics per-spective, the study of mind viruses (Dawkins, 1976). In the last sec-tion, mean source resonance and cosine similarity, and mean target
resonance and cosine similarity were collated for each person byaveraging the social network tie weight for each time a personwas the initiator of a theme propagated by others, and each time

Fig. 5. LSA participant clusters. Figure shows how TUAW participants were located in a space defined by mean source and target cosine similarity axes, labeled LSA influenceand LSA susceptibility respectively. Note that the basic pattern of Fig. 4 is seen here, albeit with sparser representation of participants.
548 P. Dwyer / Computers in Human Behavior 28 (2012) 540–551
they propagated a theme introduced by others respectively.Similarly, the HL4 theme can be used as the unit of analysis byaveraging the resonance and cosine similarity achieved by every-one who introduced the theme into the blog, and everyone whopropagated the theme after it was introduced. Table 4 shows acomparison between mean source and target resonance and cosinesimilarity collated on the basis of persons and HL4 themes respec-tively. Note that when using resonance-based metrics (i.e., MSRand MTR), the variation in resonance between persons is signifi-cantly higher (three and fourteen times higher respectively,q < .001) than the variation between these measures applied tothemes. Thus themes are observed to have little difference be-tween them in their ability to virally propagate or be propagated.Persons, on the other hand, differ considerably in their ability for,and susceptibility to, theme propagation. Furthermore, note thatcosine similarity does not indicate a similar difference betweenthemes and people.
4. Discussion
At the beginning of this paper, three common measures of influ-ence (degree, betweenness and eigenvector centrality) were de-scribed as indicators of influence over information flow, ratherthan as true measures of interpersonal influence. It was arguedthat similarities in the content of successive additions to a conver-
sation reveal true influence comingled with cognitive similaritybecause what people say reveals their thoughts. A theme-trackingmodification of Centering Resonance Analysis (CRA) was comparedwith Latent Semantic Analysis (LSA), one of the latest probabilistictechniques for measuring language similarity. Table 3 shows a cor-relation matrix and an exploratory factor analysis (EFA) of the fiveparticipant influence metrics (degree, betweenness, eigenvectorcentrality, CRA resonance, and LSA cosine similarity). Note thatEFA associated the three information-flow metrics together as indi-cating a common factor denoted information-flow influence consis-tent with their use in research such as Goldenberg et al. (2009) andtextbook theory (Wasserman & Faust, 1994). The primacy of thisfactor, explaining 40% of variance, may explain why the influ-ence-flow metrics have dominated the literature and bears testi-mony to their continued value.
The finding that the three centrality metrics were so correlatedthat they indicated a single latent factor is worthy of note. Correla-tion between these centrality measures has been observed beforeand was the focus of much research. One study (Valente, Coronges,Lakon, & Costenbader, 2008) that performed a meta-analysis of thefindings of many research papers concluded that centrality mea-sures calculated on networks with reciprocal connections exhib-ited less correlation. That finding matches and explains theresults observed here because the networks here were pruned ofmost reciprocal connections to remove the effects of homophily

Table 4Commenter and theme variation in resonance and cosine similarity comparison.
Blog Commenter HL4 themes
MSR MTR MSR MTR
Mean Stdev Mean Stdev Mean Stdev Mean Stdev
A. Resonance (R)AutoBlog 0.489 0.276 0.562 0.368 0.643 0.088 0.497 0.027Blogoscoped 0.490 0.280 0.536 0.340 0.651 0.103 0.481 0.043Outpost 0.683 0.400 0.699 0.420 0.868 0.143 0.578 0.061Freakonomics 0.579 0.274 0.590 0.290 0.723 0.106 0.546 0.046Gizmodo 0.442 0.251 0.477 0.292 0.558 0.101 0.417 0.059Joystiq 0.426 0.242 0.483 0.337 0.553 0.090 0.423 0.047Stamatiou 0.495 0.274 0.551 0.372 0.619 0.135 0.477 0.077Townhall 0.604 0.323 0.633 0.366 0.757 0.119 0.566 0.040TV Squad 0.532 0.263 0.555 0.314 0.659 0.099 0.498 0.044TUAW 0.479 0.265 0.539 0.355 0.620 0.059 0.488 0.024Mean 0.285 0.345 0.104 0.047
MSCS MTCS MSCS MTCSB. Cosine similarity (CS)AutoBlog 0.012 0.053 0.006 0.023 0.009 0.043 0.005 0.025Blogoscoped 0.015 0.059 0.008 0.029 0.011 0.053 0.005 0.025OutpostFreakonomics 0.003 0.022 0.002 0.017 0.002 0.020 0.002 0.015Gizmodo 0.011 0.058 0.004 0.017 0.007 0.044 0.003 0.017Joystiq 0.011 0.051 0.005 0.023 0.008 0.040 0.005 0.024Stamatiou 0.011 0.057 0.003 0.022 0.011 0.061 0.003 0.023Townhall 0.004 0.025 0.002 0.010 0.003 0.021 0.001 0.012TV Squad 0.008 0.046 0.003 0.017 0.006 0.042 0.002 0.017TUAW 0.013 0.063 0.005 0.025 0.009 0.051 0.004 0.026Mean 0.046 0.018 0.037 0.019
Notes: Table shows a comparison between mean source and target resonance (MSR, MTR) and cosine similarity (MSCS, MTCS) collated by persons and HL4 themesrespectively. Note that for both MSR and MTR, the variation in resonance between persons is significantly higher (three and fourteen times higher respectively, q < .001) thanthe variation between themes. Cosine similarity shows no such difference.
P. Dwyer / Computers in Human Behavior 28 (2012) 540–551 549
from the study. However, it seems more difficult to find studiesthat have performed a factor analysis of the same centrality mea-sures used here. The only study found (Estrada & Bodin, 2008) thatperformed such analysis observed only betweenness centrality tobe associated with its own latent factor. This observation wasmade in a study that preserved and focused on the most denselyinterconnected parts of its networks, where this study excisedthose areas to remove homophily. It seems then that this study’sobservations of highly correlated and somewhat redundant cen-trality measures are consistent with prior research.
The source and target versions of resonance were also associ-ated together into a common factor with opposite correlation,leading to the conclusion that influence and susceptibility areopposite extremes on a spectrum observed in Fig. 4 to be normallydistributed. This finding supports a perspective used by Watts andDodds that ‘‘differences in influence are more appropriatelydescribed in a continuum than dichotomously’’ (Watts & Dodds,2007, p. 444). While this is a long-standing perspective incommunication theory (Lin, 1973), the dichotomous perspective,that influence and susceptibility are distinct constructs, is alsoempirically supported and widely used (e.g., Van den Bulte & Joshi,2007). This study’s findings also support the dichotomousperspective since the source and target versions of LSA cosine sim-ilarity were associated with distinct factors denoted LSA Influenceand LSA Susceptibility respectively. The logical conclusion seemsto be that influence has different aspects that are sometimes diffi-cult to separate and fully characterize. It is easy to understand anddistinguish the aspect of influence as control over informationflow. However, the aspect of influence as continuum, and the as-pect of influence and susceptibility as separate constructs seemconfounded much in the same way that Shalizi and Thomas(2011) argued that influence and homophily are widelyconfounded.
Since the literature debates whether people or themes are thetrue source of influence, the study summarized its language simi-larity metrics from both perspectives. Table 4 shows indicationsthat people are the probable source of influence in this study, asthe themes seem to differ little in the extent to which they arepropagated. This observation can be just as persuasively explainedby the HL4 themes being so generic that they do not have the qual-itative properties of a true meme, as by assertions that only peoplehave influence. It seems then that Leskovec et al.’s (2009) approachof tracking distinctive short phrases as they are slightly changed byinaccurate quoting and are combined with other such phrasesattributed to the same originator is a better way of defining memesfor subsequent measure of their influence.
5. Conclusions
This study was primarily motivated by Watts and Dodds’ obser-vation that ‘‘empirical evidence regarding real world influence net-works is limited’’ (Watts & Dodds, 2007, p. 443), and Shalizi andThomas concerns about influence and homophily being con-founded in prior influence studies. Additional evidence for real-world influence networks has been contributed; an evidence thatremained, even after applying Shalizi and Thomas’ suggestion forreducing the effects of homophily. Watts and Dodds’ (2007) spec-ulations that susceptibility is more important than influence in thepropagation of information (called here the susceptibility perspec-tive) achieved wide notice as the first credible challenge to thenear-universally held influence perspective. Since then computer-mediated communication has fueled explosive growth in influenceresearch, of which this study is one example. The certainty thatreigned during the dominance of the influence perspective hasbeen replaced by evidence supporting all five of the influence per-spectives listed in Section 2.1. As Section 4 described, this study
550 P. Dwyer / Computers in Human Behavior 28 (2012) 540–551
found support for both the influence and susceptibility perspec-tives operating with the same system. That suggests that influencedynamics are the result of a complex system where the operationsof simpler processes, the five influence perspectives, interact toproduce empirical phenomena.
It was noted that the literature’s debate over whether people orthemes are the true source of influence caused this study to sum-marize its language similarity metrics from both perspectives.However, this study does little to resolve that debate as there isuncertainty over whether themes really have little influence orHL4 themes are too generic to be true memes. It is interesting thatLSA cosine similarity did not show any difference between peopleand themes. That may be explained by LSA being less accurate atmeasuring language similarity because it does not incorporatethe order of word use in its algorithm. Plainly there are many ques-tions yet to be answered; the next section recommends additionalavenues of research in this literature stream.
6. Opportunities for further research
In spite of decades of research into influence, the diverse find-ings of the studies discussed as a backdrop to this study, as wellas the sometimes puzzling findings of this study emphasize howtentative our knowledge still is. It was noted that recent literaturein this stream focused on confounding influence with homophily. Itmay be that contextual imperative, the requirement in any conver-sation for some degree of theme continuity to maintain coherence,is just as significant a confounding factor when using languagesimilarity to estimate influence. Perhaps a similar approach to Aralet al.’s (2009) filtering of homophily would remove the effect ofcontextual imperative. Recall that they removed pairs of subjectswhose propensity to adopt the same behavior was estimated tobe greater than two standard deviations from the mean. In thiscase contextual imperative is a background level of language sim-ilarity. Significant signs of influence and cognitive similarity wouldneed to assert themselves above this background level of contex-tual imperative to be detected; so a possible solution would beto discard levels of language similarity below some threshold.However, Section 4 noted a puzzling observation that warrants fur-ther investigation: the seeming presence of two confounded as-pects of influence, one a continuum, and the other manifested intwo orthogonal factors. Recall from Table 3 that the two LSA factorsexplained the least variance in the data (14.5% and 10.2%). MightLSA be revealing the effects of contextual imperative? Perhaps fur-ther research can resolve what this study cannot.
A recent trend in blog participation is for readers to increaseexposure to a blog post by reposting it on their own blogs or shar-ing it with their friends on social networking sites like Facebookand Twitter. Blog authors also cross-post their work to their ownblog, Facebook and Twitter when they introduce new content.These practices increase the virality of ideas beyond the confinesof a blog’s readership, one of the constraints of this study. It is un-known whether expanding the scope of viral propagation, and in-deed enabling such expansion, changes the dynamics of influence.It would be more difficult to track an initiating influence and itssubsequent effects across different contexts; however it may re-veal fresh insights into the nature of influence and should be at-tempted in future research.
This study has taken an incremental step beyond the manyresearchers who have used computer-mediated communicationto expand our understanding of influence; there are still many gapsin our understanding and further work within the area should re-sult in many new insights and a long continuance of this literaturestream.
References
Adar, E., & Adamic, L. A. (2005). Tracking information epidemics in blogspace. WebIntelligence, 207–214.
Aral, S., Muchnik, L., & Sundararajan, A. (2009). Distinguishing influence-basedcontagion from homophily-driven diffusion in dynamic networks. Proceedingsof the National Academy of Science, 106(51), 21544–21549.
Balasubramanian, S., & Mahajan, V. (2001). The economic leverage of thevirtual community. International Journal of Electronic Commerce, 5(3),103–138. Spring.
Bluebit Software, .NET Matrix Library 6.0. http://www.bluebit.gr/NET/download.aspx Retrieved 20.08.11.
Borgatti, S. P., NetDraw: Graph visualization Software. http://www.analytictech.com/downloadnd.htm Retrieved 20.08.11.
Cassell, J., Huffaker, D., Tversky, D., & Ferriman, K. (2006). The language of onlineleadership: Gender and youth engagement on the Internet. DevelopmentalPsychology, 42(3), 436–449.
Chen, Y.-F. (2008). Herd behavior in purchasing books online. Computers in HumanBehavior, 24, 1977–1992.
Corman, S., Kuhn, T., McPhee, R. D., & Dooley, K. J. (2002). Studying complexdiscursive systems centering resonance analysis of communication. HumanCommunication Research, 28(2), 157–206.
Dawkins, R. (1976). The selfish gene. Oxford: Oxford University Press.Estrada, E., & Bodin, O. (2008). Using network centrality measures to manage
landscape connectivity. Ecological Applications, 18(7), 1810–1825.Genovese, J. E. (2002). Cognitive skills valued by educators: Historical content
analysis of testing in Ohio. Journal of Educational Research, 96(2), 101–115.Girvan, M., & Newman, M. E. J. (2002). Community structure in social and biological
networks. Proceedings of the National Academy of Science, 99, 7821–7826.Goldenberg, J., Han, S., Lehmann, D. R., & Hong, J. W. (2009). The role of hubs in the
adoption process. Journal of Marketing, 73(March), 1–13.Gomez-Rodriguez, M., Leskovec, J., & Krause, A. (2010). Inferring networks of
diffusion and influence. In: ACM SIGKDD international conference onknowledge discovery and data mining (KDD).
Huffaker, D. (2010). Dimensions of leadership and social influence in onlinecommunities. Human Communication Research, 36, 593–617.
Huffaker, D., Jorgensen, J., Iacobelli, F., Tepper, P., & Cassell, J. (2006). Computationalmeasures for language similarity across time in online communities. In: Proc. ofthe HLT-NAACL 2006 workshop on analyzing conversations in text and speech(ACTS ‘09) (pp. 15–22).
Katz, E., & Lazarsfeld, P. F. (1955). Personal influence. Glencoe, IL: Free Press.Kozinets, R. V. (2002). The field behind the screen: Using netnography for marketing
research in online communities. Journal of Marketing Research, 39(February),61–72.
Latane, B. (1981). The psychology of social impact. American Psychologist, 36(4),343–356.
Leskovec, J., McGlohon, M., Faloutsos, C., Glance, N., & Hurst, M. (2007). Cascadingbehavior in large blog graphs patterns and a model. In: SIAM internationalconference on data mining (SDM).
Leskovec, J., Backstrom, L., & Kleinberg, J. (2009). Meme-tracking and the dynamicsof the news cycle. In: Proc. of the ACM SIGKDD international conference onknowledge discovery and data mining (KDD).
Lin, N. (1973). The study of human communication. Indianapolis: Bobbs-Merrill.Mason, W. A., Conrey, F. R., & Smith, E. R. (2007). Situating social influence
processes: Dynamic, multidirectional flows of influence within social networks.Personality and Social Psychology Review, 11(3), 279–300.
Miller, M. D., & Brunner, C. C. (2008). Social impact in technologically-mediatedcommunication: An examination of online influence. Computers in HumanBehavior, 24, 2972–2991.
Neiderhoffer, K. G., & Pennebaker, J. W. (2002). Linguistic style matching in socialinteraction. Journal of Language and Social Psychology, 21(4), 337–360.
NetworkX. A Python package for the creation, manipulation, and study of thestructure, dynamics, and functions of complex networks. http://networkx.lanl.gov Retrieved 20.08.11.
Runkel, P. J. (1956). Cognitive similarity in facilitating communication. Sociometry,19(3), 178–191.
Shalizi, C. R., & Thomas, A. C. (2011). Homophily and contagion are genericallyconfounded in observational social network studies. Sociological Methods andResearch, 40, 211–239.
Song, X., Chi, Y., Hino, K., & Tseng, B. (2007). Identifying opinion leaders in theblogosphere. In: Proc. of the sixteenth ACM conference on information andknowledge management (CIKM ‘07).
Stone, P. The general inquirer merged Harvard-IV-4 and Lasswell dictionaries.http://www.wjh.harvard.edu/~inquirer/homecat.htm Retrieved 20.08.11.
Valente, T. W., Coronges, K., Lakon, C., & Costenbader, E. (2008). How correlated arenetwork centrality measures? Connect (Tor), 28(1), 16–26.
Van den Bulte, C., & Joshi, Y. V. (2007). New product diffusion with influentials andimitators. Marketing Science, 26(3), 400–421.
Wasserman, S., & Faust, K. (1994). Social network analysis: Methods and applications.Cambridge, UK: Cambridge University Press.
Watts, D. J., & Dodds, P. S. (2007). Influentials, networks, and public opinionformation. Journal of Consumer Research, 34, 441–458.
Weber, R. P. (1990). Basic content analysis. Newbury Park, CA: Sage.Weng, J., Lim, E. -P., Jiang, J., & He, Q. (2010). TwitterRank: Finding
topic-sensitive influential Twitterers. In: Proc. of the third ACM

P. Dwyer / Computers in Human Behavior 28 (2012) 540–551 551
international conference on web search and data mining (WSDM’10)(pp. 261–270).
Wilson, E. V., & Lu, Y. (2008). Communication goals and onlinepersuasion: An empirical examination. Computers in Human Behavior,24, 2554–2577.
Ye, Q., Law, R., Gu, B., & Chen, W. (2011). The influence of user-generated content ontraveler behavior: An empirical investigation on the effects of e-word-of-mouthto hotel online bookings. Computers in Human Behavior, 27, 634–639.
yWorks GmbH, yEd Graph Editor. http://www.yworks.com/en/products_yed_about.html Retrieved 20.08.11.


![User profile correlation-based similarity (UPCSim) algorithm ......collaborative ltering similarity [29], the Triangle Multiplying Jaccard (TMJ) similarity [30], and the similarity](https://static.fdocuments.us/doc/165x107/6147013af4263007b1358a2c/user-profile-correlation-based-similarity-upcsim-algorithm-collaborative.jpg)