An Approach to Establish Correlation of Courses to POs ...
12
IOSR Journal of Research & Method in Education (IOSR-JRME) e- ISSN: 2320–7388,p-ISSN: 2320–737X Volume 8, Issue 5 Ver. II. (Sep. – Oct. 2018), PP 60-71 www.iosrjournals.org DOI: 10.9790/7388-0805026071 www.iosrjournals.org 60 | Page An Approach to Establish Correlation of Courses to POs & PSOs and Attainment of COs, POs & PSOs H. Jayasree 1 , G. Kanaka Durga 2 1 Assoc. Prof., Dept. of CSE, MVSR Engineering College, Hyderabad, India, 2 Professor, Dept. of ECE, MVSR Engineering College, Hyderabad, India, Corresponding Author: H. Jayasree Abstract: Outcome based education (OBE) is student-centered instruction model that focuses on measuring student performance through outcomes. Outcomes include knowledge, skills and attitudes. An important component of OBE is the attainment of Course Outcomes (COs), Program Outcomes (POs) and Program Specific Outcomes (PSOs).Criterion 3 of Self-Assessment Report (SAR) emphasize on attainment of COs, POs and PSOs.The correlation between CO-PO describes the level at which a particular PO is addressed through a CO. The correlation is justified based on number of sessions mapping. Direct and Indirect assessment tools are applied for measuring attainment of COs, POs and PSOs. The paper presents a simple yet robust approach followed for establishing correlation between CO-PO/PSOs; and for measurement of attainment of COs, POs and PSOs as per the guidelines of SAR. Keywords: Outcome Based Education, Course Outcomes, Program Outcomes, Program Specific Outcomes -------------------------------------------------------------------------------------------------------------------------------------- Date of Submission: 01-10-2018 Date of acceptance: 16-10-2018 --------------------------------------------------------------------------------------------------------------------------------------- I. Introduction Course Outcomes are the resultant knowledge skills the student acquires at the end of a course. Program Outcomes as stated by NBA represent the knowledge, skills and attitudes the students should have at the end of a four year engineering program. Program Specific Outcomes (PSOs) are statements that describe what graduates of a specific engineering program should be able to do. COs and PSOs need to be formulated by the respective programs. COs are defined for each course. Each CO may lead to attainment of one or more POs or PSOs.The various courses offered, as per the design of curriculum for the program, are expected to address all the POs to a significant extent. The PSOs are expected to be addressed by the curriculum directly or through specialized instructional methods and practices, particular to the department or program in the institution. The process of attainment of COs, POs and PSOs starts from writing course outcomes for each course of the four year program followed by establishing a correlation between the COs and POs/PSOs as per the templates [1] and guidelines [2] of SAR. II. Correlation of Course to POs & PSOs Course outcomes are stated for every course using the action verbs of learning levels of Blooms Taxonomy [3] . A course addresses a set of POs/ PSOs. To establish the correlation between CO - POs&PSOs, number of sessions devoted for POs &PSOs through each course outcome in the class room instruction is identified. The correlation level of 1, 2 or 3 defined as 1: slight (low) 2: Moderate (medium)3: substantial (high) -: no correlation is decided based on %ge of class room sessions. - If > 40% of classroom sessions addressing a particular PO, it is considered that PO is addressed at Level 3 - If 25 to 40% of classroom sessions addressing a particular PO, it is considered that PO is addressed at Level 2 - If 5 to 25% of classroom sessions addressing a particular PO, it is considered that PO is addressed at Level 1 - If < 5% of classroom sessions addressing a particular PO, it is considered that PO is considered not- addressed Course outcome to POs & PSOs correlation level is obtained using the equation 1. CO – POs &PSOs level: Total number of sessions devoted to a particular PO for a given CO Total number of periods devoted for a given CO % -----1 For example: in a courseif 15 sessions are utilized to address PO1 through CO1 out of 20 sessions then the %ge of class room sessions devoted to PO1 through CO1 is 75% and hence it is mapped to Level 3.
Transcript of An Approach to Establish Correlation of Courses to POs ...

IOSR Journal of Research & Method in Education (IOSR-JRME)
e- ISSN: 2320–7388,p-ISSN: 2320–737X Volume 8, Issue 5 Ver. II. (Sep. – Oct. 2018), PP 60-71
www.iosrjournals.org
DOI: 10.9790/7388-0805026071 www.iosrjournals.org 60 | Page
An Approach to Establish Correlation of Courses to POs & PSOs
and Attainment of COs, POs & PSOs
H. Jayasree1, G. Kanaka Durga
2
1Assoc. Prof., Dept. of CSE, MVSR Engineering College, Hyderabad, India, 2 Professor, Dept. of ECE, MVSR Engineering College, Hyderabad, India,
Corresponding Author: H. Jayasree
Abstract: Outcome based education (OBE) is student-centered instruction model that focuses on
measuring student performance through outcomes. Outcomes include knowledge, skills and attitudes. An
important component of OBE is the attainment of Course Outcomes (COs), Program Outcomes (POs) and
Program Specific Outcomes (PSOs).Criterion 3 of Self-Assessment Report (SAR) emphasize on attainment of
COs, POs and PSOs.The correlation between CO-PO describes the level at which a particular PO is addressed
through a CO. The correlation is justified based on number of sessions mapping. Direct and Indirect assessment
tools are applied for measuring attainment of COs, POs and PSOs. The paper presents a simple yet robust
approach followed for establishing correlation between CO-PO/PSOs; and for measurement of attainment of
COs, POs and PSOs as per the guidelines of SAR.
Keywords: Outcome Based Education, Course Outcomes, Program Outcomes, Program Specific Outcomes
----------------------------------------------------------------------------------------------------------------------------- ---------
Date of Submission: 01-10-2018 Date of acceptance: 16-10-2018
----------------------------------------------------------------------------------------------------------------------------- ----------
I. Introduction Course Outcomes are the resultant knowledge skills the student acquires at the end of a course.
Program Outcomes as stated by NBA represent the knowledge, skills and attitudes the students should have at
the end of a four year engineering program. Program Specific Outcomes (PSOs) are statements that describe
what graduates of a specific engineering program should be able to do. COs and PSOs need to be formulated by
the respective programs. COs are defined for each course. Each CO may lead to attainment of one or more POs
or PSOs.The various courses offered, as per the design of curriculum for the program, are expected to address
all the POs to a significant extent. The PSOs are expected to be addressed by the curriculum directly or through
specialized instructional methods and practices, particular to the department or program in the institution. The
process of attainment of COs, POs and PSOs starts from writing course outcomes for each course of the four
year program followed by establishing a correlation between the COs and POs/PSOs as per the templates[1]
and
guidelines[2]
of SAR.
II. Correlation of Course to POs & PSOs Course outcomes are stated for every course using the action verbs of learning levels of Blooms
Taxonomy [3]
. A course addresses a set of POs/ PSOs. To establish the correlation between CO - POs&PSOs,
number of sessions devoted for POs &PSOs through each course outcome in the class room instruction is
identified. The correlation level of 1, 2 or 3 defined as 1: slight (low) 2: Moderate (medium)3: substantial (high)
-: no correlation is decided based on %ge of class room sessions.
- If >40% of classroom sessions addressing a particular PO, it is considered that PO is addressed at Level 3
- If 25 to 40% of classroom sessions addressing a particular PO, it is considered that PO is addressed at Level
2
- If 5 to 25% of classroom sessions addressing a particular PO, it is considered that PO is addressed at Level
1
- If < 5% of classroom sessions addressing a particular PO, it is considered that PO is considered not-
addressed
Course outcome to POs & PSOs correlation level is obtained using the equation 1.
CO – POs &PSOs level: Total number of sessions devoted to a particular PO for a given CO
Total number of periods devoted for a given CO % -----1
For example: in a courseif 15 sessions are utilized to address PO1 through CO1 out of 20 sessions then the %ge
of class room sessions devoted to PO1 through CO1 is 75% and hence it is mapped to Level 3.

An Approach to Establish Correlation of Courses to POs & PSOs and Attainment of COs, POs & SOs
DOI: 10.9790/7388-0805026071 www.iosrjournals.org 61 | Page
Course to POs & PSOs correlation level is obtained using the equation 2.
Course – PO/PSO level: Total number of sessions devoted to a particular PO across all COs
Total number of periods devoted for the Course % ----- 2
For example: in a courseif 35 sessions out of 55 are devoted for PO1 then the %ge of class room
sessions devoted to PO1 through the course is 64% and hence it is mapped to level 3. Those with insignificant
and nil correlation are represented by „- „.The above procedure is followed for obtaining the CO-POs &PSOs
matrices and Course –POs &PSOscorrelation for all courses. A sample is shown in Table 2.1.
Table 2.1: Course – POs &PSOs matrix
Course-POs &PSOs MATRIX CAY : 2016-17
S
N
O
Cou
rse
Cod
e Course Name
P
O
1
P
O
2
P
O
3
P
O
4
P
O
5
P
O
6
P
O
7
P
O
8
P
O
9
P
O
1
0
P
O
1
1
P
O
1
2
P
S
O
1
P
S
O
2
1 CS 101
Engineering Mathematics I 3 2 1 - - - - 1 - 2 - 1 2 -
2
CS
102
Engineering
Physics I 3 1 - 1 - - - 1 - 1 - 3 - -
--
-
2
4
CS
201
Mathematics
III 3 2 - 1 - - - 1 - 2 - 1 1 -
2
5
CS
202
Data Structures
using C++ 1 2 2 1
- 1 1 1
-
1 - 1 2 1
-
--
40
CS 301
Database
Management Systems 1 3 3 1 1 - - - - - - 1 3 -
4
1
CS
302
Operating
Systems 3 2 2 2 - - - - - - - 2 2 -
--
-
70
CS 413 Seminar - 3 - - 1 - - 1 2 1 - 2 - -
7
1
CS
414 Project 3 3 3 2 2 2 1 2 1 1 1 1 3 2
III. Attainment of COs Course Outcomes are the basic units of Outcome based evaluation system. Assessment refers to a wide
variety of methods or tools used to evaluate, measure, and document the academic preparedness, learning
progress, skill acquisition, or educational needs of students. Attainment of COs can be measured directly and
indirectly. Direct attainment of COs can be determined from the performance of students by all the relevant
assessment tools. Indirect attainment of COs is obtained from the course exit surveys. Computation of indirect
attainment of COs may turn out to be complex; the percentage weightage to indirect attainment is kept at a low
percentage to 20%. Fig 3.1 represents the assessment tools used for attainment of COs
Fig 3.1: Assessment tools for attainment of COs

An Approach to Establish Correlation of Courses to POs & PSOs and Attainment of COs, POs & SOs
DOI: 10.9790/7388-0805026071 www.iosrjournals.org 62 | Page
3.1 Assessment process used for evaluation of attainment of COs
Assessment of course outcomes is based upon the performance in each course through
(a) Course Internal Evaluation (CIE)
(b) Semester End Examination conducted by the University (SEE)
Marks division:
a) The division of marks prescribed by University (Osmania University), and weightages in arriving at the
attainment of CO are given in Table 3.1.The attainment level is determined as given in Table 3.2 as per the
% of students scoring more than 50% for theory courses and 60% for other than theorycourses in CIE or
SEE.
Table 3.1: Weightage of Marks for CIE: SEE Type of Course Internal
Marks (CIE)
External
Marks
(SEE)
Total
marks
Net CO attainment level as per weight age
Theory 25 75 100 0.25*CIE Level + 0.75* SEE Level
Laboratory 25 50 0.25 *CIE Level + 0.75*SEE Level( 50 marks scaled to 75)
Seminars & Mini Projects
25 - 25 CIE Level
Project 50 Grade - 0.25* CIE Level + 0.75 *SEE Level (CIE- 50 marks scaled to 25)(Grade converted to 100 marks and scaled to 75)
Table 3.2: Range – Level Table % of students scoring Level
<40% 0 Low
40% to 44% 1 Low
45% to 49% 1.25 Low
50% to 54% 1.5 Low
55% to 59% 1.75 Low
60% to 64% 2 Moderate
65% to 69% 2.25 Moderate
70% to 74% 2.5 Moderate
75% to 79% 2.75 Moderate
> = 80% 3 High
b)As per the new Choice Based Credit System (CBCS), introduced by the affiliating University, from
the academic year 2016-17, starting with I year students admitted in 2016-17, a grading system is in place, in
which the University awards a grade depending on the total of Internal and External exams. As per CBCS
scheme, internal evaluation weightage is 30% and External is 70%.
This change affects only the assessments made for I year of 2016-17. In the case of I year of 2016-17, the
effective CO attainment is based upon External Exam alone. The CO attainment based on internal evaluation is
also analyzed for feedback and improvement.
The assessment tool used for each category of course is depicted in Fig 3.2.
Fig 3.2: Assessment tools for different category of courses for attainment of COs

An Approach to Establish Correlation of Courses to POs & PSOs and Attainment of COs, POs & SOs
DOI: 10.9790/7388-0805026071 www.iosrjournals.org 63 | Page
3.1.1 Assessment of COs for Theory courses
Attainment of CO in internal evaluation is decided by two internal examinations and two assignments.
A. Internal Tests
Two internal tests are conducted per semester each of 20 marks. As per University norms, the question paper
consists of Part A consisting of 3 questions each of 2 marks and Part B consisting of 3 questions each of 7
marks, giving a choice of answering 2 of 3 questions. Thus the question paper is set for 27 marks while
evaluated for only 20 marks in view of the choice.
i. In Internal examination I, each question is linked to a particular CO and allotted marks are indicated.
ii. Total marks allotted for each CO addressed is noted.
iii. A table is prepared indicating the marks scored by each student of the class against each question and also
against each CO addressed by the test.
iv. A similar table is prepared for internal examination II.
B. Assignments:
Two assignments are given to students in each semester. Each assignment is for 5 marks. The questions
are so tailored that all COs are addressed between the two assignments. The assignments may include short or
long answer questions.
i. Questions given for Assignment I are each marked against a corresponding CO and marks are allotted for
the CO.
ii. A table is prepared indicating the marks scored by all students of the class against each CO addressed by
the assignment.
iii. A similar table is prepared for Assignment II.
C. Consolidation of marks scored in tests and assignments:
i. The four tables prepared for the two internal examinations and assignments are merged into a single table.
In this table, for each student, the total marks scored in examinations and assignments, against each of the
COs is calculated as shown in sample table 3.3.
Table 3.3: Attainment of CO through CIE
MID – I MID – II
Assignment
- I
Assignment –
II
CO marks reduced for total
internal marks of 25
CO
Addre
ssed
C
O
1
C
O
2
C
O
6
C
O
2
C
O
3
C
O
4
C
O
6
C
O
1
C
O
2
C
O
6
C
O
3
C
O
4
C
O
5
C
O
6
CO
1
CO
2
CO
3
CO
4
CO
5
C
O6
CO
Mark
s
1
3 8 6 3
12
.5
3.
5 8 2 1 2 2 1 1 1 7.5 6
7.2
5
2.2
5 0.5 8.5
S
l.
N
o
.
Roll
No.
1
2451-
14-733-
061 0 0 0 0 0 0 0 2 1 2 2 1 1 1 1 0.5 1 0.5 0.5 1.5
2
2451-
14-733-
062
2
.2
5 3
0
.2
5 3 3 0 3 1 1 1 1
0.
5
0.
5 1
1.6
25 3.5 2
0.2
5
0.2
5
2.6
25
3
2451-14-
733-
063
6
.
5 5
6
.
5 3
10
.5 0 3 2 1 2 2 1 1 1
4.2
5 4.5
6.2
5 0.5 0.5
6.2
5
…..
6
7
2451-
14-733-
324 3 2 1 2
1.
5
0.
5
3.
5 2 1
1.
5
1.
5 1 1 1 2.5 2.5 1.5
0.7
5 0.5 3.5
CIE - Max Marks 5.86
4.69
5.66
1.76
0.39
6.64
CIE - 50% of max marks
2.9
3
2.3
4
2.8
3
0.8
8
0.2
0
3.3
2
No. of students >= 50 % of Max marks 49 53 46 18 67 57
CIE - % Attainment --- % of students >= 50 % of Max marks
73.
13
79.
10
68.
66
26.
87
100
.00
85.
07

An Approach to Establish Correlation of Courses to POs & PSOs and Attainment of COs, POs & SOs
DOI: 10.9790/7388-0805026071 www.iosrjournals.org 64 | Page
CIE - Attainment level 2.5
2.7
5
2.2
5 0 3 3
D. Assessment of Course Outcomes:
i. For each CO, 50% (theory) / 60% (other than theory) value of the maximum marks allotted is determined.
ii. For each CO, the number of students who scored more than 50% (theory) / 60% (other than theory) of the
maximum marks for the CO is found.
iii. Ratio of students who scored more than 50% to the total number of students in the section is expressed as
%, and treated as % attainment for each CO.
iv. Above percentages are converted to a corresponding level of attainment as per Table3.2 for each CO.
v. When a class has more than one section, average of the sections represents the percentage attainment, and
converted into CO attainment level. .
Semester End University Examination Evaluation (SEE)
i. Semester end final examination for 75 marks is conducted by the university.
ii. Final marks obtained by each student in the semester end examination is made available by University.
Attainment is taken as uniform for all COs of the course.
iii. Percentage of students who score more than 50% (theory) / 60% (other than theory) of the SEE is used to
decide the CO level. For more than one section, the CO level is taken as the average of the CO levels in
SEE of all sections.
Targets are set based on the targets attained in the previous academic year. Targets for CIE are set for
each course outcome. After the analysis if targets are not met an action plan is incorporated to meet the target in
the overall CO attainment. Targets for SEE are set the same for every course outcome. After the analysis if
targets are not met an action plan is suggested which needs to be followed to improve performance of a
particular course in the subsequent academic year. Targets – in terms of attainment level are set using the
formula; 0.25*CIE+ 0.75*SEE in the overall CO attainment. After the analysis if targets are not met an action
plan is suggested which need to be followed to improve performance of the particular course in the subsequent
academic year. It is necessary to set higher target for next year, if the set target is attained (for CIE and SEE
separately). If current targets are not met for some COs, consecutive target is unchanged.
Overall CO attainment
i. The average CO level in CIE and the average CO level in SEE are combined as 0.25*CIE Level + 0.75*
SEE Level. A sample is shown in table 3.4.
ii. The average value of the CO levels for the course are then used for mapping the PO attainments, using the
array of target PO values for the course.
iii. The direct CO attainment and indirect CO attainment collected through course exit survey designed as a
web app - mvsr.epizy.com are combined as 0.8*Direct Level+ 0.2*Indirect. A sample is shown in table 3.5.
Table 3.4: Attainment of CO through CIE and SEE CO1 CO2 CO3 CO4 CO5 CO6
CIE % Attainment 73.13 79.10 68.66 26.87 100 85.07
CIE Attainment Level 2.5 2.75 2.25 0 3 3
SEE % Attainment 70.15 70.15 70.15 70.15 70.15 70.15
SEE Attainment Level 2.5 2.5 2.5 2.5 2.5 2.5
CIE +SEE Attainment % --
0.25*CIE + 0.75*SEE 70.90 72.39 69.78 59.33 77.61 73.88 avg level
CIE +SEE Attainment level --
0.25*CIE + 0.75*SEE 2.5 2.56 2.44 1.88 2.63 2.63 2.44
Table 3.5: Attainment of CO through Direct and Indirect assessment
MVSR, Department of CSE Attainment of COs through Direct and Indirect assessment
Academic year: 2016-17 Course Code: CS303 Course Name: Automata Languages and Computation
Year : III Semester: I Section: I, II & III
Attainment Level
Level Attained CO1 CO2 CO3 CO4 CO5 CO6
Target Level 2.60 2.55 2.60 2.60 2.55 2.60
Direct 2.56 2.54 2.48 1.96 2.63 2.56
Indirect 2.8 2.7 2.9 2.6 2.6 2.8
Overall 0.8* direct + 0.2 * indirect 2.61 2.57 2.56 2.09 2.62 2.61
Status of Attainment ( M: Met ; NM –
Not Met) M M M NM M M

An Approach to Establish Correlation of Courses to POs & PSOs and Attainment of COs, POs & SOs
DOI: 10.9790/7388-0805026071 www.iosrjournals.org 65 | Page
3.1.2Assessment of COs for courses other than Theory
The other types of courses in the program are Laboratory, Mini project, Project seminar, General seminar and
Project.
a) Laboratory:
The internal evaluation is based on session wise performance of experiment and viva voce, record and
internal examination and viva voce. CO level for CIE attainment is decided upon the percentage of students who
score more than 60% of the maximum internal marks, i.e., 15 out of 25. Marks are distributed proportionately
for each course outcome. SEE Lab exam is conducted by the University at the institution level and the
evaluation is done by an external examiner appointed by the University.SEE Lab exam is evaluated for 50
marks. Marks are scaled to 75 to maintain CIE: SEE ratio of 25:75. SEE % of students who score over 60% of
the maximum marks, i.e. 45 out of 75 marks, is used to decide the CO attainment level and is uniform for all
COs.
The overall CO attainment is considered with the weightages as per allotted marks as:
CO level = 0.25* CIE level + 0.75* SEE level.
The average value of the CO levels for the course are then used for mapping the PO attainments, using the array
of target PO values for the course.
b) Mini Project:
For mini project in III yr- I semester and II semester the assessment is based only on internal
evaluation. The marks obtained are used to decide the % of students who scored more than 60%, i.e. 15 out of
25, and the corresponding CO attainment level.
c) General seminar and Project seminar:
For seminars, the assessment is based only on internal evaluation. The marks obtained in seminar are
used to decide the % of students who scored more than 60%, ie 15 out of 25, and the corresponding CO
attainment level.
d) Final year Project:
The internal marks for project (50) are the total of marks allotted in Project review, final presentation,
and by project guide. The external evaluation is done by an external examiner appointed by the University by
award of Grade (Excellent/Very Good/Good / Satisfactory /Poor), which are converted into 100 marks.
Internal marks are scaled to 25 and external marks are scaled to 75 to maintain CIE: SEE ratio of 25:75. CO
attainment levels in both internal and external evaluation are decided upon % of students who scored more than
60% of the maximum, for CIE and SEE.
The overall level is obtained as
CO level = 0.25* CIE level + 0.75 * SEE Level.
The average value of the CO levels for the course are then used for mapping the PO attainments, using the array
of target PO values for the course.
Attainments of all courses from first year to fourth year are tabulated for the set target levels to record
the attainment. If targets are met higher targets are set for the subsequent years. The process adapted for
measuring direct attainment of CO and PO& PSO is depicted in Fig 3.3.

An Approach to Establish Correlation of Courses to POs & PSOs and Attainment of COs, POs & SOs
DOI: 10.9790/7388-0805026071 www.iosrjournals.org 66 | Page
Fig 3.3 : Process adopted for measuring direct attainment of CO – PO & PSO
IV. Attainment of POs and PSOs
June 2015 SAR format includes POs[1]
that are common to all programs. However, NBA suggests
program to include 2 to 4 POs specific to an engineering program referred as “Program Specific Outcomes”. It
is required to compute attainment levels of PSOs in addition to computing attainment of POs.Attainment of POs
& PSOs can be measured directly and indirectly. Direct attainment of POs & PSOs can be determined from the
performance of students by all the relevant assessment tools. Indirect attainment of POs & PSOs is obtained
from the Surveys and Rubricsin combination of certain ratios. Computation of indirect attainment of COs may
turn out to be complex; the percentage weightage to indirect attainment is kept at a low percentage.
4.1 Assessment process used for measuring the attainment of POs and PSOs
Direct attainment of POs & PSOs can be determined from the performance of students by all the
relevant assessment tools (CIE & SEE).
4.1.1 Direct Assessment Direct assessment of POs for a course is obtained by mapping the average value of Course Outcome
attainment with the mapping of the target or expected POs for the particular course.
For example, the CO value arrived at from CIE and SEE for the course CS 303 is 2.44 – for a particular section
The target POs for CS303 are given below
PO PO1 PO2 PO3 PO4 PO5 PO6 PO7 PO8 PO9 PO10 PO11 PO12 PSO1 PSO2
CS
303 3 3 2 1 - - - - - - - 2 2 -
The target value for PO1 is 3. Then the attainment value is 2.44*3/3 = 2.44. Other POs are mapped similarly.
The complete PO attainment for the course code CS303 is shown in table given below.
PO PO1 PO2
PO3 PO4 PO5 PO6 PO7
PO8
PO9
PO10 PO11
PO12
PSO1
P
SO
2
Target PO level 3 3 2 1 - - - - - - - 2 2 -

An Approach to Establish Correlation of Courses to POs & PSOs and Attainment of COs, POs & SOs
DOI: 10.9790/7388-0805026071 www.iosrjournals.org 67 | Page
PO Level
Attained 2.44 2.44 1.63 1 0 0 0 0 0 0 0 1.63 1.63 0
Note: PO level >0.5 and<1 is rounded off to 1.
he PO &PSO attainment values so obtained are their direct components for the course. The direct
components for all the courses are obtained similarly and tabulated. The average for PO&PSO gives the values
attained directly.
4.1.2 Indirect Assessment
The indirect components of PO contribution are obtained from surveys, rubrics and through the
additional co-curricular activities.
(i) Surveys: Surveys of (a) Graduate exit (b) Course Exit (c) Alumni (d) Professional bodies (e) Employer (f)
Expert member are considered for measuring attainment for PO/PSO.
Parent survey and Alumni Parent survey is also collected but is not considered for measuring attainment of
PO/PSO.
(ii) Rubrics: A rubric is a tool that helps to make subjective measurements as objective, clear and consistent as
much as possible, by defining criteriaon which performance is judged.Rubrics are used to determine the
attainment of POs that are either not adequately addressed in the curriculum, or when it is found that COs of
many subjects do not address these aspects, or related COs cannot be justifiably quantified. Rubrics are framed
for PO6 to PO12; PSO1 and PSO2. Rubrics for projects are designed that address all POs.
(iii) Contribution due to Co-curricular Activities: Co-curricular activities are mainly aimed at making up for
the curricular gaps observed as per the target PO values of all courses that is obtained in table 3.1.3 of SAR.The
activities address aspects covered beyond the curriculum to update the students on the latest technology trends,
innovative teaching methodologies adapted for improving teaching learning process and curricular and co-
curricular activity participations of the students.Contributions due to these activities are taken to represent 25%
of the PO attainments towards fulfilling the PO gap.
In the case of PO1 to PO5, the courses over the 4 years of the program contribute significantly, and
hence 80% weightage is given to direct attainment for these POs, 5% for indirect attainment through rubrics and
15% for indirect attainment through surveys. As PO6, PO7, PO8, PO9, PO10, PO11 and PO12; PSO1 and
PSO2; are not well addressed directly in the curriculum, direct assessment weightage is limited to 50%. Surveys
are given a weightage of 20% and Rubrics are given a weightage of 30%. The rubrics aim to assess PO/PSOs by
performance of the students in seminars, projects and other co-curricular activities.
Table 4.1 gives the distribution of weightages directly from courses, and those indirectly obtained from
rubrics and surveys.
Table 4.1: Distribution of weightage% of Courses, Rubrics and Surveys in the indirect attainment of
PO/PSOs.
Contributions due to various activities are also added to the PO values obtained.
4.1.2a Assessment from Rubrics
The proportion of weightages of rubrics for PO1 to PO12; PSO1 and PSO2 for different components
through which PO/PSO is assessed is shown in Table 4.2. Average value of attainment of POs from each
component with respect to its weightage is obtained. Net contribution to PO is obtained as PO average of all
components.
Project addresses all PO/PSOs. Rubric numbering chosen for Projects / Mini Projects are prefixed by P.
For example P-R2- represents project rubric used for assessing PO3. For other components general notation of R
with a number is used. For example R1- represents rubric used for assessing PO9 – Team Work. Rubric
notation used for Projects / Mini Projects is shown in Table 4.2a and the Rubric notation used for evaluating
PO6 to PO12; PSO1 and PSO2 is shown in Table 4.2b.
PO1 PO2 PO3 PO4 PO5 PO6 PO7 PO8 PO9 PO10 PO11 PO12 PSO1 PSO2
Courses 80 80 80 80 80 50 50 50 50 50 50 50 50 50
Rubrics 5 5 5 5 5 30 30 30 30 30 30 30 30 30
Surveys 15 15 15 15 15 20 20 20 20 20 20 20 20 20

An Approach to Establish Correlation of Courses to POs & PSOs and Attainment of COs, POs & SOs
DOI: 10.9790/7388-0805026071 www.iosrjournals.org 68 | Page
Table 4.2: Distribution of Weightages of Rubrics
Rubrics
PO /PSO
No. PO
1
PO
2
PO
3
PO
4
PO
5
PO
6
PO
7
PO
8
PO
9
PO
10
ora
l
PO
10
wri
tten
PO
11
PO
12
PS
O1
PS
O2
PO /PSO Eng
g.
Kn
wl
Pro
b.
An
ay
Dsg
n.
sol
com
p.
pro
b
Too
l.
usa
ge
Eng
g.
So
c
En
iv.
Su
s
Eth
ics
Tea
m
Wo
rk
Co
m
m.
Co
m
m.
Pro
j.
Mngt
&F
in
L.L
.L
Eff
.
Cod
in
g
S/W
.
Dep
l.
Rubrics from
P-R1
P-R1
P-R2
P-
R3,P-R4
P-
R3,P-R4
P-R1
P-R1
P-R5
P-R6
P-R7
P-R7
P-R8
P-R9
P-
R3,P-R4
P-R4
Rubrics
from R6 R7 R4 R1
R3-
O
R3-
W R5 R2 R8 R9
Projects 3 3 3 3 3 10 5 10 10 10 10 10 13 6 10
Mini
projects-I 1 1 1 1 1 5 3 4 3 2 2 5 2 4 5
Mini projects-II 1 1 1 1 1 5 3 4 3 2 2 5 2 4 5
Project
seminar - - - - - 2 3 3 3 4 4 2 2 - -
General
seminar - - - - - 2 3 3 2 4 4 2 2 - -
Industrial visit - - - - - 2 3 2 - - - - 2 2 6
Student
activity - - - - - 2 5 2 2 2 2 3 2 3 2
Professional
Society
Activity - - - - - 2 5 2 2 1 1 3 2 3 2
Lab courses - - - - - - - - 5 5 - - 3 8 -
Theory
courses - - - - - - - -
5 - - - -
weightage 5 5 5 5 5 30 30 30 30 30 30 30 30 30 30
Table 4.2a: Rubrics Notation for Projects / Mini Projects Rubrics Applied for Project/ Mini Projects
Rubric No. Description
P-R1 Rubric for PO1, PO2,PO6 and PO7
P-R2 Rubric for PO3
P-R3 Rubric for PO4,PO5 and PSO1
P-R4 Rubric for PO4,PO5; PSO1 and PSO2
P-R5 Rubric for PO8
P-R6 Rubric for PO9
P-R7 Rubric for PO10
P-R8 Rubric for PO11
P-R9 Rubric for PO12
Table 4.2b: Rubrics Notation for PO6 to PO12; PSO1 and PSO2 Rubrics Applied for PO6 to PO12 ; PSO1 and POs2
Rubric No. Description
R1 Rubric for PO9
R2 Rubric for PO12
R3
Rubric for PO10 R3-O for Oral R3-W for
Written
R4 Rubric for PO8
R5 Rubric for PO11
R6 Rubric for PO6
R7 Rubric for PO7
R8 Rubric for PSO1
R9 Rubric for PSO2
Rubric Evaluation: Maximum score possible for a student (for 4 criteria) = 16
Score obtained from rubric = (Total score obtained)/(Max score of all students) * 3 (max level)

An Approach to Establish Correlation of Courses to POs & PSOs and Attainment of COs, POs & SOs
DOI: 10.9790/7388-0805026071 www.iosrjournals.org 69 | Page
Assume total rubric score obtained =741, and no. of students 62 then max score = 62*16
= 3 * 741/ (62*16) = 2.24
For multiple sections, the average is calculated.
Thus, the PO attainment contribution from rubrics is 0.747 (for 3 sections), out of a maximum value of 30%
allotted to rubrics for the PO, ie 3 * 0.3 = 0.90.
4.1.2b Assessment from Surveys
Proportions of weightages of PO/PSO attainment through surveys are shown in the Table 4.3. Average
values of attainment of POs from each survey with respect to its weightage are obtained. Net contribution to PO
is obtained as PO averages of surveys. From PO1 to PO5 – Survey weightage is 15% and from PO6 to PO12;
PSO1 and PSO2; the survey weightage is 20%.
Table 4.3: Distribution of Weightages of Surveys
Surveys
PO No. PO
1
PO
2
PO
3
PO
4
PO
5
PO
6
PO
7
PO
8
PO
9
PO
10
PO
11
PO
12
PS
O1
PS
O2
Graduate
Exit Survey 3 3 3 3 3 5 5 5 5 5 5 5 5 5
Alumni
Survey 3 3 3 3 3 5 5 5 5 5 5 5 5 5
Employer Survey 4 4 4 4 4 5 5 5 5 5 5 5 5 5
Course
Exit Survey 3 3 3 3 3 3 3 3 3 3 3 3 3 3
Professiona
l body Survey 1 1 1 1 1 1 1 1 1 1 1 1 1 1
Expert
Member
Survey 1 1 1 1 1 1 1 1 1 1 1 1 1 1
weightage
1
5
1
5
1
5
1
5
1
5
2
0
2
0
2
0
2
0
2
0
2
0
2
0
2
0
2
0
Average value of attainment of POs from each survey is obtained as per the proportion in overall
weightage of that PO. The averages form each survey obtained is tabulated to obtain the overall survey average
for each PO/ PSO.
4.1.2c Assessment from Activities
The co-curricular and extra-curricular activities aim at making up the shortfall of the curriculum based
PO from the maximum value of 3. Contributions of all the activities towards attainment of each PO are taken
from all activities that address content beyond curriculum towards attainment of PO;student activities; the
innovative teaching methodologies applied by faculty. Only 10% of the %covered through innovative teaching
learning is taken into consideration. The % addressed from each activity from each Criterion is tabulated and the
average is obtained for each PO that represents the gap in terms of % for a given PO. The contribution is taken
as 25% of the x% of the gap.
For example – fulfillment of the gap estimated for PO9 for 2016-17 is 25.91%. The contribution is
taken as 25% of 25.91% of the gap. The gap being 1.14 (3-1.86); the contribution due to activities is calculated
as = 0.25 * (25.91 /100) * 1.14 = 0.07.
4.2 Overall PO Attainment Level
PO/PSO target levels are set as follows, for PO1 to PO5 – 80% of level 3 is chosen and for PO6 to PO12; PSO1
and PSO2 – 60% of level 3 is chosen for CAYm2 – 2014-15. If targets are met higher targets are set for
subsequent academic year. PO PO1 PO2 PO3 PO4 PO5 PO6 PO7 PO8 PO9 PO10 PO11 PO12 PSO1 PSO2
PO
target
level
2.4 2.4 2.4 2.4 2.4 1.8 1.8 1.8 1.8 1.8 1.8 1.8 1.8 1.8
The overall attainment level for each PO is computed using following formula;
PO Level = x% value from direct attainment + y% value from rubrics + z% value from surveys + contribution of
co-curricular activities& extracurricular activities; where x, y and z represents the weightage of the respective
PO/ PSO as shown in Table 4.1.

An Approach to Establish Correlation of Courses to POs & PSOs and Attainment of COs, POs & SOs
DOI: 10.9790/7388-0805026071 www.iosrjournals.org 70 | Page
The direct attainment value in the formula is obtained by taking the average of PO attainments of all
courses using the procedure explained in 4.1.1 direct component.
For example:
Let the value of PO9, obtained from Direct Attainment = 0.8
Overall value or level of attainment of PO9
= 50% of Direct Attainment + 30 % value from Rubrics + 20% value from Surveys + contribution of co-
curricular & extracurricular activities
= 0.8 + 0.49+ 0.41+0.07 = 1.77
The overall PO Attainment values are obtained similarly for all other POs/PSOs.
A sample PO/PSO attainment obtained for one year is shown in the Table 4.4.
Table 4.4 : Overall PO attainment for AY: 2014-15 M.V. S. R. Engineering College, Department of CSE
Attainment of POs & PSOs
CAYm2 : 2014-15
PO
1
PO
2
PO
3
PO
4
PO
5
PO
6
PO
7
PO
8
PO
9
PO
10
PO
11
PO
12
PS
O1
PS
O2
PO Target set for
2014-15 2.4 2.4 2.4 2.4 2.4 1.8 1.8 1.8 1.8 1.8 1.8 1.8 1.8 1.8
PO- Level -Curriculum
2.35 2.25 2.25 1.63 2.16 1.54
1.36
1.28 1.88
1.84 1.30
1.68 2.34 1.65
PO Gap 0.65 0.75 0.75 1.38 0.84
1.4
6
1.6
4 1.72
1.1
2 1.16
1.7
0 1.32 0.66 1.35
% Gap Fulfilled 12.08
13.76
12.62
26.56
19.35
4.24
7.71
10.38
3.75
11.76
7.60
14.19
20.94
11.56
PO Attn Direct
100% 1.93 1.88 1.90 1.36 1.83
1.1
8
0.9
9 1.05
1.7
0 1.56
1.0
4 1.42 2.01 1.31
% Direct contribution
80 80 80 80 80 50 50 50 50 50 50 50 50 50
PO Direct Attn 1.54 1.50 1.52 1.08 1.47
0.5
9
0.5
0 0.52
0.8
5 0.78
0.5
2 0.71 1.00 0.65
PO Rubrics Attn 0.13 0.13 0.14 0.14 0.14
0.7
5
0.5
9 0.59
0.5
0 0.44
0.6
7 0.47 0.52 0.67
PO Surveys Attn 0.42 0.41 0.41 0.38 0.37
0.3
8
0.3
6 0.38
0.3
9 0.38
0.3
7 0.40 0.40 0.38
25% of PO activities Attn 0.02 0.03 0.02 0.09 0.04
0.02
0.03 0.04
0.01 0.03
0.03 0.05 0.03 0.04
PO Attainment 2.10 2.06 2.10 1.70 2.02
1.7
4
1.4
8 1.54
1.7
4 1.64
1.6
0 1.63 1.95 1.74
PO Target for 2015-
16 2.4 2.4 2.4 2.4 2.4 1.8 1.8 1.8 1.8 1.8 1.8 1.8 1.95 1.8
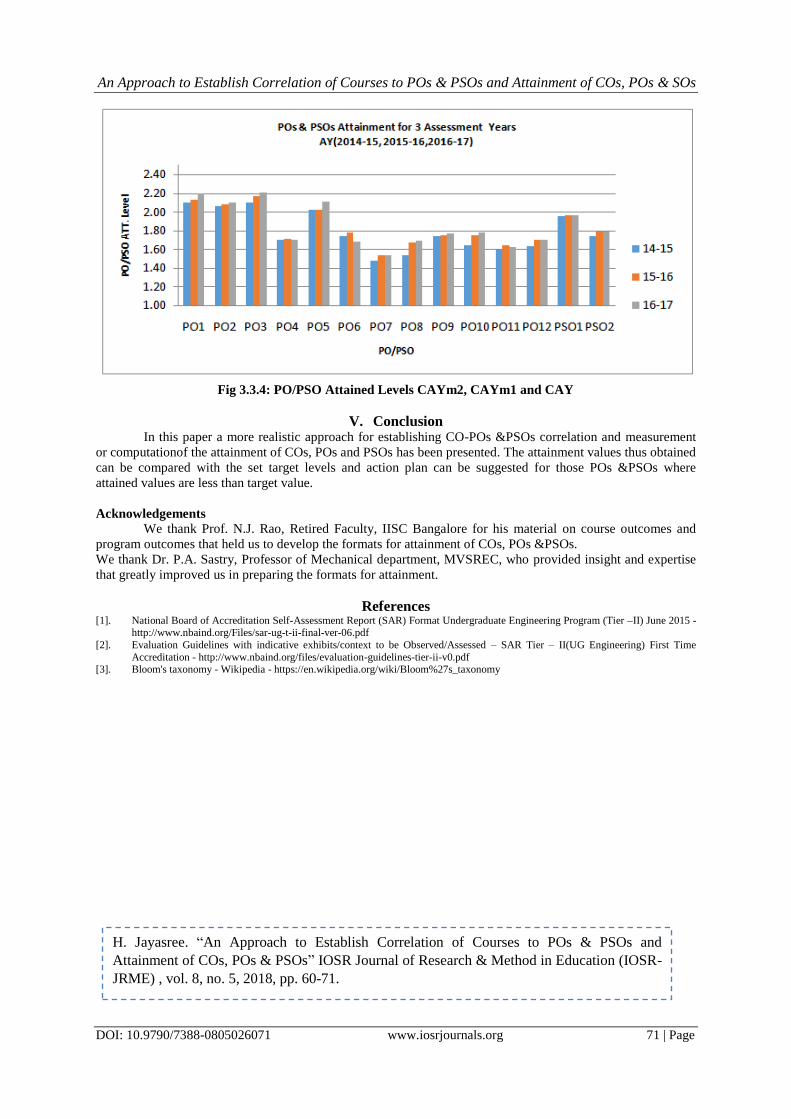
Summary of PO/PSO attained Levels for CAY -2016-17, CAYm1-2015-16and CAYm2-2014-15 is shown in
table 4.5 and the same is depicted in graph shown in Fig 1.
Table 4.5: POs &PSOs Attained Levels CAY, CAYm1 and CAYm2 POs &PSOsAttained Levels for 3 Assessment Years
A.Y PO1 PO2 PO3 PO4 PO5 PO6 PO7 PO8 PO9 PO10 PO11 PO12 PSO1 PSO2
CAYm2:
14-15 2.10 2.06 2.10 1.70 2.02 1.74 1.48 1.54 1.74 1.64 1.60 1.63 1.95 1.74
CATm1:
15-16 2.13 2.08 2.17 1.71 2.03 1.78 1.54 1.67 1.75 1.75 1.64 1.70 1.96 1.79
CAY:
16-17 2.20 2.10 2.21 1.70 2.11 1.68 1.54 1.69 1.77 1.78 1.62 1.71 1.96 1.79
An Approach to Establish Correlation of Courses to POs & PSOs and Attainment of COs, POs & SOs
DOI: 10.9790/7388-0805026071 www.iosrjournals.org 71 | Page
Fig 3.3.4: PO/PSO Attained Levels CAYm2, CAYm1 and CAY
V. Conclusion In this paper a more realistic approach for establishing CO-POs &PSOs correlation and measurement
or computationof the attainment of COs, POs and PSOs has been presented. The attainment values thus obtained
can be compared with the set target levels and action plan can be suggested for those POs &PSOs where
attained values are less than target value.
Acknowledgements
We thank Prof. N.J. Rao, Retired Faculty, IISC Bangalore for his material on course outcomes and
program outcomes that held us to develop the formats for attainment of COs, POs &PSOs.
We thank Dr. P.A. Sastry, Professor of Mechanical department, MVSREC, who provided insight and expertise
that greatly improved us in preparing the formats for attainment.
References [1]. National Board of Accreditation Self-Assessment Report (SAR) Format Undergraduate Engineering Program (Tier –II) June 2015 -
http://www.nbaind.org/Files/sar-ug-t-ii-final-ver-06.pdf
[2]. Evaluation Guidelines with indicative exhibits/context to be Observed/Assessed – SAR Tier – II(UG Engineering) First Time
Accreditation - http://www.nbaind.org/files/evaluation-guidelines-tier-ii-v0.pdf [3]. Bloom's taxonomy - Wikipedia - https://en.wikipedia.org/wiki/Bloom%27s_taxonomy
H. Jayasree. “An Approach to Establish Correlation of Courses to POs & PSOs and
Attainment of COs, POs & PSOs” IOSR Journal of Research & Method in Education (IOSR-
JRME) , vol. 8, no. 5, 2018, pp. 60-71.