An Application of the Healthy Development Measurement Tool ...
31
Bernal Heights Preschool HDMT Report Page 1 COMMUNITY HEALTH ASSESSMENT: BERNAL HEIGHTS PRESCHOOL An Application of the Healthy Development Measurement Tool (HDMT) Draft for Public Review San Francisco Department of Public Health January 2008 For more information, please contact : Megan Gaydos, Environmental and Occupational Health, SFDPH 415.252.3919 or [email protected] This Report and the HDMT are available online at: www.theHDMT.org .
Transcript of An Application of the Healthy Development Measurement Tool ...

Bernal Heights Preschool HDMT Report Page 1
COMMUNITY HEALTH ASSESSMENT: BERNAL HEIGHTS PRESCHOOL
An Application of the Healthy Development Measurement Tool (HDMT)
Draft for Public Review
San Francisco Department of Public Health
January 2008
For more information, please contact: Megan Gaydos, Environmental and Occupational Health, SFDPH 415.252.3919 or [email protected] This Report and the HDMT are available online at: www.theHDMT.org.

Bernal Heights Preschool HDMT Report Page 2
REPORT OUTLINE Acknowledgements List of Maps and Figures Summary Background Process and Methodology Areas of Analysis
Childcare Housing Education Parks, Recreation and Open Space Transportation Environmental Conditions (Air Quality/Noise) Demographics and Racial/Ethnic Diversity
Conclusion Appendices
Appendix 1: Maps of Bernal Heights at Planning Neighborhood, Zipcode & Supervisor District Levels Appendix 2: Maps of Former, Current and Potential Future Bernal Preschool Locations Appendix 3: Background on the Healthy Development Measurement Tool Appendix 4: Demographics from SF Prospector Appendix 5: Citations/Bibliography
ACKNOWLEDGEMENTS San Francisco Department of Public Health Staff involved in report analysis and editing:
Rajiv Bhatia, MD, MPH, Director of Environmental Health Megan Gaydos, MPH, Epidemiologist Matthew Nester, MPH, Research Associate June Weintraub, PhD, Senior Epidemiologist
The following members of the Bernal Heights Preschool Committee contributed to the development and review of the Bernal Heights Preschool HDMT Report. Their contributions and time are greatly appreciated:
Bob Hernandez Mauricio Vela
Bernal Heights Preschool HDMT Report Page 3
SUMMARY This report is a community health assessment of the Bernal Heights neighborhood written by staff from the San Francisco Department of Public Health at the request of the Bernal Heights Preschool Committee. This community health assessment was conducted using secondary data and research from the Healthy Development Measurement Tool (HDMT) to provide a brief overview of the various social and environmental factors impacting community health in Bernal Heights. The Bernal Heights Preschool Committee requested this community health assessment to be used to inform decision making processes related to the choice among three potential future locations of the Bernal Heights Preschool. The preschool was formerly located at the Bernal Heights Library and in June 2007, was temporarily relocated to the Paul Revere Elementary School due to renovations at the library site. Although the majority of data available in the HDMT is not geographically specific enough to differentiate between the three potential permanent locations under consideration, the research and data point to a strong need for childcare, investment in schools and parks, valuing of community and social interactions, and retention of racially and socioeconomically diverse communities in the Bernal Heights neighborhood. SFDPH encourages further research into parental, social, and environmental factors affecting selection of childcare and school locations. BACKGROUND The Bernal Heights Preschool is one of the City College of San Francisco’s Child Development and Family Studies Department state preschools. Since its inception over 25 years ago, the program has been housed in the Bernal Public Library (See Appendix 2 for Maps). The program was housed in the lower level of the Library in approximately 1,300 square feet of space and the facilities included a fully functioning kitchen, both adult and child bathrooms and storage space, thus meeting state requirements for childcare centers. While at the library, the preschool utilized the neighboring public playground which recently received a new play structure and renovated gynamsium. According to the Bernal Heights Preschool Feasibility study, “the program was welcomed into the library building at a time when social justice issues were at the forefront and community activists sought to provide a preschool opportunity for low-income minority families.” Throughout its history, the preschool has predominantly served low income families of Latino, Filipino, Middle Eastern, African American and Asian descent. Located in the center of the Cortland Avenue neighborhood commercial corridor or “community hub”, the Bernal Heights Preschool was a convenient location for low income families with limited transportation and limited financial means to bring their children to other preschool locations. More broadly, the Preschool was a convenient location for all families because of its proximity to a neighborhood center, a gymnasium, and neighborhood serving services and retail stores on Cortland Avenue. According to members of the Preschool Committee, an additional benefit of the preschool’s presence near the Cortland Avenue community hub was that it helped diversify the playground community and reinforce the historic diversity of the Bernal Heights neighborhood community. In November 2000, San Francisco voters passed Proposition A, which funded the Branch Library Improvement Program. According to the Bernal Heights Preschool Feasibility Study, “Neither during the campaign nor in the bond description did the Library inform the community that the 25+ year old Bernal Heights Preschool would be displaced.” In August 2004, the Library Commission gave notice of the renovation of the Bernal Branch Library to the Community and initiated a search for a temporary and potentially permanent new site for the preschool. After finding that none of the available sites on Cortland Avenue held sufficient open space to meet state childcare requirements and that placement of the preschool in the second floor of the existing neighborhood center would be too “cluttered”, the Library Commission identified the Paul Revere Elementary School as the only feasible relocation site for the preschool during renovations in summer 2005 (See Appendix 2 for Map of Past, Current and Proposed Location). A Bernal Heights Preschool Committee was formed to resist the relocation and promote returning the preschool to the community hub after the branch renovation. Over the following years, the preschool committee organized members of the Bernal and broader San Francisco community to rally opposition against relocation and enlisted the support of
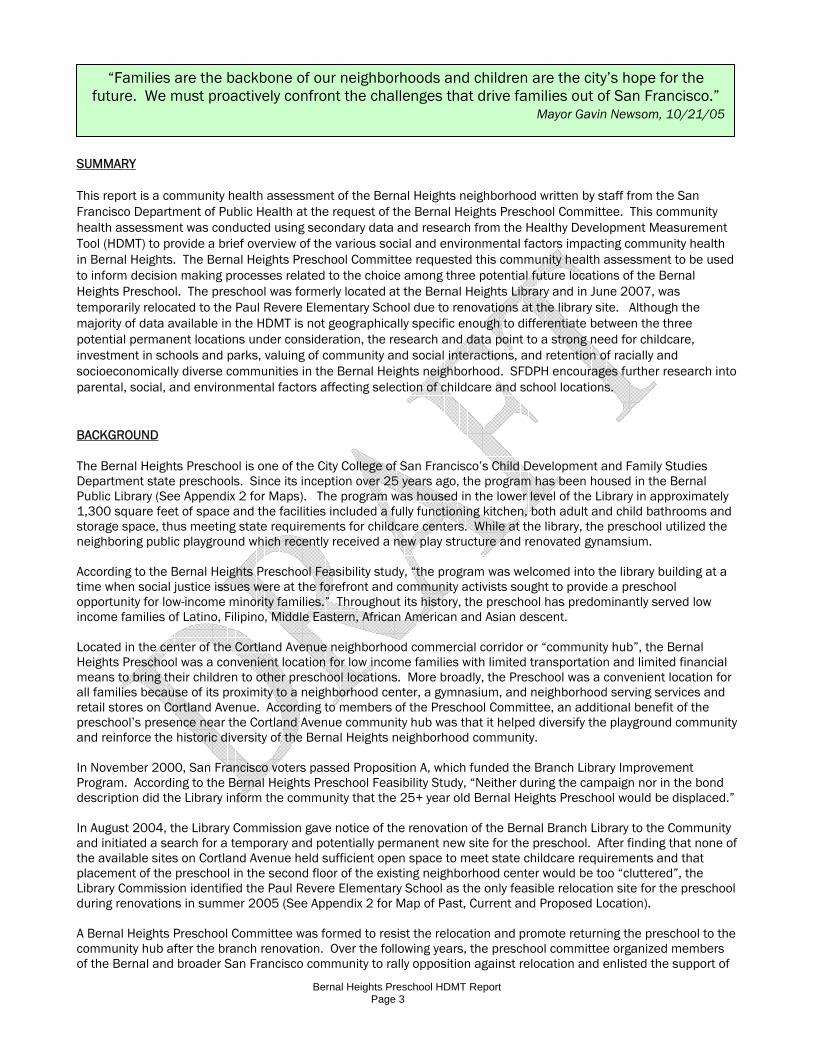
“Families are the backbone of our neighborhoods and children are the city’s hope for the future. We must proactively confront the challenges that drive families out of San Francisco.”
Mayor Gavin Newsom, 10/21/05

Bernal Heights Preschool HDMT Report Page 4
numerous individuals and organizations including Supervisor Tom Ammiano, the Department of Children, Youth and Their Families, the Bernal Heights Neighborhood Center, Parents’ Voices and the San Francisco Children’s Council. In March 2006, the San Francisco Public Library commissioned a two-year feasibility study which looked at the feasibility of relocating the preschool within the library (known as Option A). The Bernal Heights Preschool Committee advocated for two other potential options to be considered in the feasibility assessment: Option B -in the upper playground area near the play structure, and Option C - on the lower flat-top area of the playground. After the Preschool Committee helped secure additional funding for consideration of the other options, the assessment did consider all three options. The study found that Option A (keeping the preschool in the renovated library) was a viable option but that it did not allow for the expansion of the preschool to accommodate more children. Option B led to loss of playground space and excessive foot traffic congestion, and would not allow for expansion of number of children served. Option C was selected in the Feasibility Study as the best option because it allowed for a doubling of the number of children served, in an area that is still close to Cortland Avenue but underutilized by the neighboring recreation center. In June 2007, renovations for the library began and the preschool was relocated to Paul Revere Elementary School at 555 Tompkins Avenue. Library renovations were scheduled to begin in November 2007. Preschool parents and other members of the community expressed concern that the preschool would remain at the Paul Revere site, away from the Cortland Avenue Community Hub, and that the preferred option identified in the feasibility study would not be implemented. PROCESS AND METHODOLOGY In August 2007, members of the Bernal Heights Preschool Committee approached the Program on Health, Equity, and Sustainability (PHES) in the San Francisco Department of Public Health to inquire whether it would be possible to apply the Healthy Development Measurement Tool to the Bernal Heights Preschool siting decision. The Healthy Development Measurement Tool (HDMT) is an evidence-based guide for decision-makers to consider health in land use planning. The HDMT encompasses a community-based vision for planning and uses public health to explicitly connect physical and environmental planning to a wider set of social interests. The HDMT provides land use planners, public agencies, and community stakeholders with a set of metrics to assess the extent to which urban development projects, plans and policies affect health. Where applied, the HDMT thus might help to achieve a higher quality social and physical environment that protects and promotes health. More information about the HDMT is available at www.theHDMT.org PHES staff met with Bob Hernandez and Mauricio Vela to hear their concerns and see how the HDMT might be of use in evaluating the health impacts of the preschool location. After reviewing the available documents and feasibility study, PHES staff determined that they could provide the Preschool Committee with the baseline community health conditions in Bernal Heights as defined by the HDMT, but that the project at its current stage did not have enough information available to apply the HDMT development target checklist. This assessment focuses on a subset of the health objectives and community health indicators in the HDMT. At the request of the Bernal Heights Preschool Committee, staff with the Program on Health, Equity, and Sustainability are providing brief evaluations/information of the following areas:
- Childcare - Housing - Education - Transportation - Parks, Recreation and Open Space
- Access to Goods and Services - Environmental Conditions (Air Quality/Noise) - Bernal Heights Demographics and
Racial/Ethnic Diversity
The following pages provide community health indicators data for the above focus areas along with interpretation of the data for the Bernal Heights Area. The majority of data provided is at the neighborhood, supervisorial district or zipcode level, thus does not provide specific enough information to differentiate between locating the preschool at the library, on the lower flat top, or at Paul Revere Elementary School. Where possible, SFDPH discusses the potential impact of locating the preschool at one location over another. For each of the areas listed above, quotes from the Bernal Heights Preschool Feasibility Study: An Action Plan For Building Community, May 23, 2007 Draft are placed in text boxes to acknowledge concerns/comments raised by members of the Preschool Committee.

Bernal Heights Preschool HDMT Report Page 5
From the Feasibility Study…. Bernal Heights [Preschool] has consistently had a waiting list although we do not advertise. The 2006-2007 waiting list had 35 families, a key point is the central location in the heart of the neighborhood on Cortland Avenue.
AREAS OF ANALYSIS Bernal Heights Access to Childcare Substantial research demonstrates that accessible high quality childcare positively affects childhood growth, physical development, and physical health, cognitive, behavioral and school outcomes.1 High childcare costs relative to income can either limit accessibility to childcare (potentially reducing family earnings) or limit access to high quality childcare providers.2
Facts from the HDMT: (Note: The map above was created using the 2002 Child Care Needs Assessment, the table below was created using the 2007 Child Care Needs Assessment. The map using 2007 data is forthcoming). Bernal Heights/ Mission
(zipcode 94110) San Francisco
Number of 0-13 year olds (from 2000 Census) Number of 0-13 year olds at or below 75% State Median Income (SMI) (2000 Census)
10,377 5,420 (52% of total)
87,909 36,785 (42% of total)
PI.1.a: Number of Licensed Childcare Slots (2007) (LCC = Licensed Childcare Centers, LFCH = Licensed Family Childcare Homes)
1,869 LCC slots 480 LFCH slots
18.117 LCC slots 6,386 LFCH slots
PI.1.b: Number of children eligible for childcare 1244 subsidies 17,821 subsidies

Bernal Heights Preschool HDMT Report Page 6
subsidies but not receiving them (2006) 5420 eligible children 36,909 eligible children PI.1.c: Average annual childcare costs as proportion of household income
15% 17%
Interpretation and Discussion According to the San Francisco Child Care Planning and Advisory Council's 2007 Child Care Needs Assessment, with 10,377 persons under the age of 13, the Bernal Heights and Mission neighborhoods (zipcode 94110) have the second largest number of youth in San Francisco, following Outer Mission/Excelsior/Ingleside (94112) with 12,131 youth under 13. With 1869 licensed childcare spots and 480 family childcare spots available in the Bernal Heights/Mission area, at the time of the study, there was roughly one childcare spot available for every four youth. Although there are many factors influencing childcare demand in a neighborhood, such as cost, parent preferences, transit availability, availability of relatives or alternative arrangements, and availability of afterschool programming, the Bernal Heights and Mission neighborhoods have higher potential need for childcare than most other SF neighborhoods because of the higher number of children and proportionally lower number of licensed childcare spots in Bernal Heights and the Mission. According to the Child Care Needs Assessment, the primary eligibility criteria for childcare subsidies is income of the family or household. Each subsidy program has its own eligibility criteria with enrollment priorities. California Department of Education (CDE), the largest subsidy provider, limits eligibility to 75 percent of the State Median Income (SMI). CalWORKs families, under the same statute, are also subjected to the 75 percent SMI income ceiling. Most subsidy programs, even when funded locally, use the SMI as an eligibility ceiling criteria. In Head Start, the income eligibility criteria is only an entrance requirement for the program. Although the 75 percent SMI ceiling is key for computing the numbers of eligible children, it is noted that this is an underreporting of the need for subsidies, since the 75 percent SMI ceiling inadequately accounts for the high cost of living in San Francisco. Using this 75% SMI threshold, 52% of children 0-13 years old in the Inner Mission and Bernal Heights (5420 of 10,377 children in zipcode 94110) were eligible for childcare subsidies, which is higher than the 43% of children eligible for childcare subsidies in the Outer Mission/Excelsior/Ingleside area. Residents in the southern half of Bernal Heights have lower median household and per capita incomes, more residents per household and more persons under age 18 than the northern half of Bernal Heights and the citywide averages, suggesting the need for more subsidized childcare in the areas south of Cortland Avenue.

Bernal Heights Preschool HDMT Report Page 7
From the Feasibility Study… Many of the families in the program have found the rising costs of the neighborhood and city too much of a burden and moved out of the city. Losing services available to these families makes for more difficulties; while some parents would be able to take their children to programs in other neighborhoods, many of the parents in the school are not able to do so. The neighborhood reflects the challenges in SF in general, as gentrification and displacement forces many families, particularly those with more than two children to seek less expensive housing and living conditions.
Bernal Heights Housing High housing costs relative to the income of an individual or household result in one or more outcomes with adverse health consequences: spending a high proportion of income on housing, sharing housing with other individuals or families, accepting lower cost substandard housing, moving to where housing costs are lower, or becoming homeless. Spending a high proportion of income on rent or a mortgage means fewer resources for food, heating, transportation, health care, and child care. Sharing housing can mean crowded conditions, with risks for infectious disease, noise, and fires. Lower cost housing is often substandard with exposure to waste and sewage, physical hazards, mold spores, poorly maintained paint, cockroach antigens, old carpeting, inadequate heating and ventilation, exposed heating sources and wiring, and broken windows. Moving away can result in the loss of job, difficult school transitions, and the loss of health protective social networks.3 Crowded housing conditions also contribute to poor child development and school performance, in part, because overcrowding limits the space and quiet necessary for children to do homework.4 5 One recent study found that crowding combined with noise significantly increases chronic stress hormones in low-income children.6
Bernal Heights Preschool HDMT Report Page 8
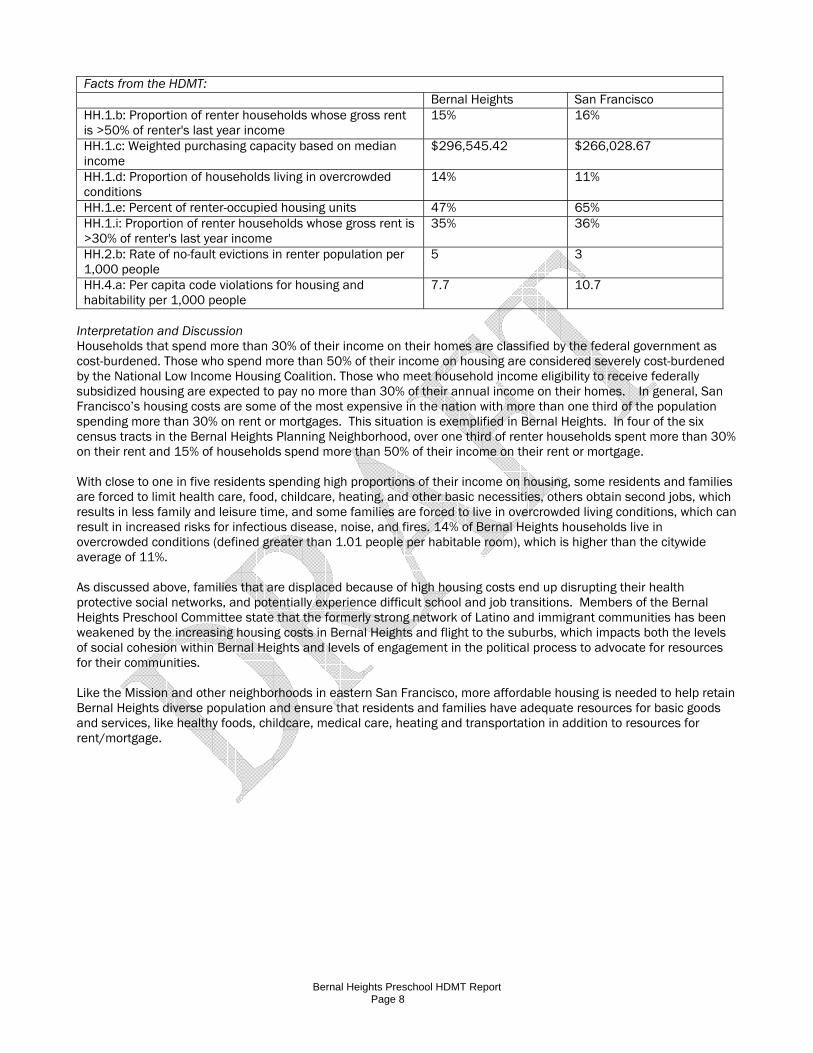
Facts from the HDMT: Bernal Heights San Francisco HH.1.b: Proportion of renter households whose gross rent is >50% of renter's last year income
15% 16%
HH.1.c: Weighted purchasing capacity based on median income
$296,545.42 $266,028.67
HH.1.d: Proportion of households living in overcrowded conditions
14% 11%
HH.1.e: Percent of renter-occupied housing units 47% 65% HH.1.i: Proportion of renter households whose gross rent is >30% of renter's last year income
35% 36%
HH.2.b: Rate of no-fault evictions in renter population per 1,000 people
5 3
HH.4.a: Per capita code violations for housing and habitability per 1,000 people
7.7 10.7
Interpretation and Discussion Households that spend more than 30% of their income on their homes are classified by the federal government as cost-burdened. Those who spend more than 50% of their income on housing are considered severely cost-burdened by the National Low Income Housing Coalition. Those who meet household income eligibility to receive federally subsidized housing are expected to pay no more than 30% of their annual income on their homes. In general, San Francisco’s housing costs are some of the most expensive in the nation with more than one third of the population spending more than 30% on rent or mortgages. This situation is exemplified in Bernal Heights. In four of the six census tracts in the Bernal Heights Planning Neighborhood, over one third of renter households spent more than 30% on their rent and 15% of households spend more than 50% of their income on their rent or mortgage. With close to one in five residents spending high proportions of their income on housing, some residents and families are forced to limit health care, food, childcare, heating, and other basic necessities, others obtain second jobs, which results in less family and leisure time, and some families are forced to live in overcrowded living conditions, which can result in increased risks for infectious disease, noise, and fires. 14% of Bernal Heights households live in overcrowded conditions (defined greater than 1.01 people per habitable room), which is higher than the citywide average of 11%. As discussed above, families that are displaced because of high housing costs end up disrupting their health protective social networks, and potentially experience difficult school and job transitions. Members of the Bernal Heights Preschool Committee state that the formerly strong network of Latino and immigrant communities has been weakened by the increasing housing costs in Bernal Heights and flight to the suburbs, which impacts both the levels of social cohesion within Bernal Heights and levels of engagement in the political process to advocate for resources for their communities. Like the Mission and other neighborhoods in eastern San Francisco, more affordable housing is needed to help retain Bernal Heights diverse population and ensure that residents and families have adequate resources for basic goods and services, like healthy foods, childcare, medical care, heating and transportation in addition to resources for rent/mortgage.

Bernal Heights Preschool HDMT Report Page 9
From the Feasibility Study…. In a time when family flight and educational achievement gaps are at the forefront of public policy discussions, we should embrace working and poor families and the communities which seek to support their most at risk.
Bernal Heights Education Higher education is positively associated with lifetime earnings, positive health behaviors, and prolonged life expectancy.7 Research on travel mode choice also shows that when schools are located closer to home, more children walk and/or bicycle to school and vehicle pollution emissions fall.8 Nationally, less than 15% of children aged 5 to 15 walk to school. According to the Centers for Disease Control and Prevention, long distances to school are a primary barrier to walking to school. Danger from traffic is the second most important barrier.9
Facts from the HDMT: Bernal Heights San Francisco PI.2.a: Proportion of households within 1/2 mile of a public elementary school
100% 88%
PI.2.c: Proportion of schools achieving an Academic Performance Index Base of 800 or more
0% 25%
Interpretation and Discussion Neighborhood schools have been found to serve as social and community hubs that promote interaction between neighbors and community members, and if planned as multi-use facilities can benefit the local community in a number of ways during afterschool hours. Not all neighborhoods have equal access to public schools, however Bernal Heights is fortunate to have 100% of households within ½ mile of a public elementary school, which is higher than the city average.

Bernal Heights Preschool HDMT Report Page 10
San Francisco has a unique school assignment policy. SFUSD allows any student to apply to any school in the city. However, there may be situations where there are more requests for spaces at a particular school than seats available. Whenever requests are greater than the number of seats available, the SFUSD uses a process called the Diversity Index Lottery to assign students to schools of their choice while at the same time maintaining economic and language diversity. In 2006-2007 academic year, 85% of kindergarten applicants received one of their choices.10
San Francisco’s effort to promote integrated schools reveals a tradeoff between having integrated, diverse schools, and having neighborhood schools. In theory, integrated schools help promote more equitable distribution of resources for all students; however, students commuting to schools outside their own neighborhood limits time available for afterschool activities and creates a barrier to parental involvement. Additionally, the push for integration is partially undermined by the fact that a number of students attend private schools. According to one recent study, roughly 25% of all K-12 students who reside in San Francisco attend private school, compared to 10% in California and 11% nationwide11. White children are underrepresented in the San Francisco Unified School District and Black, Asian, Pacific Islander and Filipino overrepresented. Given the disparities in academic performance and perceived quality of school across San Francisco, some families have decided to move out of San Francisco to ensure access to quality schools and not risk being placed at a poorer performing school. This can then reinforce existing socio-economic disparities within and between cities.
The Academic Performance Index is a measure used across the state of California involving standardized test scores to compare school academic achievement.12 None of the four schools in Bernal Heights achieved the statewide goal of ranking 800 or above on the 2005 Academic Performance Index. The Bernal Heights weighted academic performance index score of 655 was lower than the citywide average score of 719. Only 25% of schools in San Francisco achieve the statewide goal of 800 on the Academic Performance Index, and the majority of high performing schools are located in the western half of the City. The four public schools located in Bernal Heights are Junipero Serra Elementary School, Paul Revere Elementary School, Leonard R. Flynn Elementary School, and Metropolitan Arts and Technical High School. Since the compilation of the ranking scores, Metropolitan Arts and Technical High School moved out of Bernal Heights to Jackson Street, near Fillmore Street. Fairmont Elementary School is technically located in Noe Valley but a number of children on the West side of Bernal Heights attend the school just on the other side of border. Academic Performance is just one of many possible indicators to assess school environment and quality. Additional measures of quality could include: availability of books, supplies and other resources; physical and social structures of the school; actual and perceived safety at the schools; the residential stability of the student population; proximity to green space; training and experience of teachers and staff; involvement of parents in children’s education; opportunities for extracurricular activities; whether the school is used as a multi-use facility in the afternoons, evenings and weekends; and existence of afterschool programs. Preschool committee advocates have expressed concern that locating the preschool at Paul Revere Elementary School will lead to parents keeping their children at Paul Revere rather than exploring other alternative, higher performing elementary schools. It is not known whether increased educational outreach to parents whose children are attending the preschool at Paul Revere about their options and school performance records would change the parents’ ranking/preferences for school locations. More information is needed to assess the factors (such as transportation times, parents’ work locations, sibling locations, etc) involved in school preferences.
Bernal Heights Preschool HDMT Report Page 11
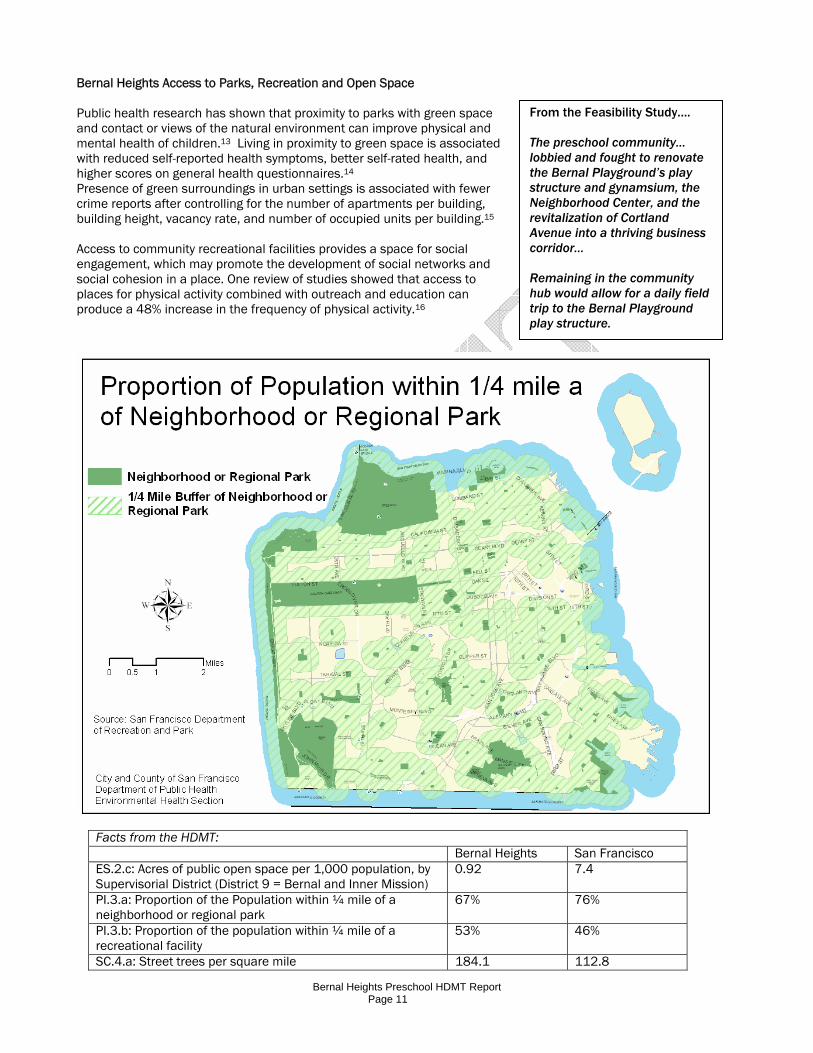
From the Feasibility Study…. The preschool community… lobbied and fought to renovate the Bernal Playground’s play structure and gynamsium, the Neighborhood Center, and the revitalization of Cortland Avenue into a thriving business corridor… Remaining in the community hub would allow for a daily field trip to the Bernal Playground play structure.
Bernal Heights Access to Parks, Recreation and Open Space Public health research has shown that proximity to parks with green space and contact or views of the natural environment can improve physical and mental health of children.13 Living in proximity to green space is associated with reduced self-reported health symptoms, better self-rated health, and higher scores on general health questionnaires.14 Presence of green surroundings in urban settings is associated with fewer crime reports after controlling for the number of apartments per building, building height, vacancy rate, and number of occupied units per building.15 Access to community recreational facilities provides a space for social engagement, which may promote the development of social networks and social cohesion in a place. One review of studies showed that access to places for physical activity combined with outreach and education can produce a 48% increase in the frequency of physical activity.16
Facts from the HDMT: Bernal Heights San Francisco ES.2.c: Acres of public open space per 1,000 population, by Supervisorial District (District 9 = Bernal and Inner Mission)
0.92
7.4
PI.3.a: Proportion of the Population within ¼ mile of a neighborhood or regional park
67% 76%
PI.3.b: Proportion of the population within ¼ mile of a recreational facility
53% 46%
SC.4.a: Street trees per square mile 184.1 112.8

Bernal Heights Preschool HDMT Report Page 12
Interpretation and Discussion In terms of proximity of residences to parks, Bernal Heights residents have slightly less proximity to parks and public open spaces than San Francisco city average. Bernal Heights residents have slightly more than the city average proximity to recreational facility and more street trees per square mile than the citywide average. In terms of aggregate park area, District 9 (which includes Bernal Heights and the Mission) has 0.92 acres of public open space per 1,000 population which is significantly less than the citywide average of 7.4 acres of public open space per 1,000 population. According to the National Recreation and Parks Association Guidelines, the national standard acreage of open space is 10 acres per 1,000 people. The Inner Mission has a population density 40% greater than the population density in Bernal Heights and at the same time has significantly less total acres of open space than Bernal Heights. This would suggest that the 0.92 acres of public open space per 1000 population for District 9 substantially underestimates open space per capita for Bernal residents and overestimates open space per capita for Mission residents. Currently, the Bernal Heights playground is co-located with the recreation center, thus reinforcing utilization of both open space and recreational facilities. Co-locating services such as the preschool to maximize contact with parks and natural spaces may be beneficial to both children and adults. Proximity is not the same as access. Many factors affect access to parks and recreational facilities including the presence of major roads, highways, buildings and gates, perceived and actual safety, hours of access, quality of grounds and facilities, transportation, cultural preferences, programming, etc. Thus actual accessibility of parks and recreational facilities may differ from the stated geographic proximity.

Bernal Heights Preschool HDMT Report Page 13
From the Feasibility Study…. Families and supporters have enjoyed the current location for almost 30 years. This has allowed them to benefit from the amenities that the community hub offers as well as allowed them to get to know their neighbors and become part of the fabric of the community. This interaction would not take place at the proposed Paul Revere location as the preschool would be isolated from the other preschoolers since there is a requirement of a separate play area from other Bernal preschools since this is a gated school facility.
Bernal Heights Access to Goods and Services Neighborhoods with diverse and mixed land uses can create proximity between residences, employment, and goods and services, reducing vehicle trips and miles traveled and increasing active transportation such as walking and biking.17 Research has found that the presence of a supermarket in a neighborhood predicts higher fruit and vegetable consumption and a reduced prevalence of overweight and obesity.18 19 Urban agricultural sites create opportunities for health education, for example, how to cook food that is grown and to improve knowledge of nutritional benefits of fruits and vegetables. These sites also create opportunities for social interaction, trust building, community building, and increased civic participation.20 Facts from the HDMT: Bernal Heights San Francisco PI.6.a: Proportion of households within a half mile of a full-service grocery store or supermarket
59% 64%
ES.3.b: Proportion of households within 1/2 mi. of a farmer's market 28% 25% ES.3.c: Proportion of households within a half mile of a community-shared agriculture drop off site
100% 39%
ES.3.d: Proportion of households within ¼ mile of a community garden 24% 31%
List of Community Efforts to Make Cortland Avenue a “Community Hub” (Provided by Bernal Heights Preschool Committee)
Expanded the Community Policing program from the Mission station to Ingleside station 1991/2. Worked alongside neighbors from the OMI to increase staffing at the Ingleside Police station Created zero tolerance for drinking and smoking in the Bernal Playground by adults. Demanded more hours and more supervision at the Bernal Playground Lobbied every Mayor from Feinstein to Jordon to keep the Bernal library open. Passed Prop. E in 1994 for
fifteen years of funding for branch hours and books. Prevented Bank of America from closing the Bernal Branch in our efforts to revitalized Cortland Ave.
(1992). Got 800 residents to transfer or open new accounts at the branch. Our goal was 1,000 in a deal with the B of A. The branch became a top branch in the district.
Encouraged Good Life Grocery to expand from Portero Hill to Cortland Ave to replace a run down grocery store site which lacked investment from the owner.
Fought for $500,000 from the Rec. & Park Open Space fund to renovate the Bernal Playground Gymnasium (1993?)
Fought for $500,000 from the Rec. & Park Open Space fund to renovate the Bernal Playground's playstructure (1995?)
Supported the passage of Prop A in 2000 which included the renovation of the Bernal Library. Started the Fiesta On The Hill in 1989 in the Bernal Playground to take back the park, and get folks using
the playground more. After the first five years the Fiesta was moved to Cortland Ave because it had out grown the playground and we wanted to attract folks to visit and shop on Cortland Ave to support the revitalization effort. The BHNC has refused to approach or accept alcoholic beverage and smoking sponsorships. No alcohol is allowed inside the boundaries of the event. Adults can go inside a restaurant or bar if they need to.
Renovated the Neighborhood Center located at 515 Cortland Ave in (1983?) and again in 2003. In 2003 the BH Neighborhood Center had an all time high of 1300+ dues paying members.

Bernal Heights Preschool HDMT Report Page 14
Bernal Heights Preschool HDMT Report Page 15
Interpretation and Discussion Cortland Avenue is the main commercial corridor in Bernal Heights and houses numerous retail services used by residents on a daily or weekly basis. As described above by Mauricio Vela, over the past decade, residents of Bernal Heights have successfully fought to retain retail and public services that considered leaving the neighborhood for financial concerns. Specifically, the active residents helped retain and revitalize a bank, the branch library, and the neighborhood recreation center, as well as initiate a grocery store, the Bernal Heights playstructure, and an annual neighborhood festival. The retention of these key services has helped maintain Cortland Avenue’s vitality as a commercial corridor. Streets with active uses and much pedestrian activity can increase social interaction and cohesion in a neighborhood as well as improving perceived safety of an area, further encouraging pedestrian and economic activity. According to members of the Bernal Heights Preschool Committee, the central location on Cortland Avenue created easy access for families with no or limited transportation. As the Map of Bernal Heights Key Retail and Services illustrates, the library and former site for the preschool at 500 Cortland Avenue is centrally located in a clustering of services and retail identified by SFDPH as key services benefiting the neighborhood. The Paul Revere Elementary School is two blocks away from Cortland Avenue and three and a half blocks away from the one side of the community hub. The proposed flattop location is just half a block away from Cortland Avenue and more centrally located on Cortland Avenue. Given that the distance is roughly 1/3 of a mile away, it is likely that increased commute times are not very significant. Additionally, if parents have an elementary aged child who attends Paul Revere school, dropping off the preschool and elementary aged children together will reduce commute time – whether walking, biking, driving or taking public transportation. However, moving the preschool further away from Cortland Avenue may reduce the likelihood of social interactions since there tends to be more pedestrian traffic along commercial corridors than residential streets. The Feasibility report stated that “Most families walk to school and enroll in the preschool specifically because it provides their children an opportunity to know their neighbors, feel safe in the neighborhood and become a part of community. For the most part, families learn about the program from friends, or they see children in the playground and approach staff for more information.” This statement emphasizes the importance of the preschoolers and their families being publicly seen and known in a neighborhood, a key component to increased social cohesion, perceived safety, and social capital of a neighborhood, as well as possible increased enrollment in the preschool. Public health research has shown that increased social capital reinforces civic participation, norms of reciprocity, and trust in others which facilitates cooperation for mutual benefit.1 In other words, community residents who feel connected to their neighbors and feel part of a community are more likely to be politically engaged and participate in collective efforts to improve their environmental and social conditions than those who are isolated, which can result in improved health outcomes. As described above, Bernal Heights residents have demonstrated considerable collective power in their efforts to retain and attract key services to Cortland Avenue over the past decade. Although preschool and school-age families are still likely to interact near the preschool facility wherever it is located, these families may have less social interaction with other residents if they are using a route other than Cortland Avenue to access the schools. Because it is not known from which direction families are arriving to bring their children to preschool, in which direction they head afterwards, their level of social interaction with other community residents, nor their means of transport, it is not known whether the relocation of the preschool from the Library to Paul Revere school increases or decreases parents’ commuting times or neighborhood relations in the community. To fully assess the impact of the changed preschool location, a survey could be conducted of preschool parents and nearby residents examining these various factors. Among the key services and retail is access to fresh, healthy foods which can be measured via access to supermarkets, produce stores, community shared agriculture and community gardens. On average, fewer Bernal households are within ½ mile of full-service grocery store or supermarket (59%) or within ¼ mile of a community garden (24%) than the citywide average (64% and 31% respectively). Roughly 28% of Bernal households are within ½ mile of a farmers’ market, which is slightly higher than the citywide average of 25%. 100% of households are within ½ mile of a community-shared agriculture drop off site, roughly three times the city average of 39%.
1 Putnam RD. "The prosperous community. Social Capital and economic growth."� American Prospect. Spring 1993;35-42; Kawachi I, Kennedy BP, Lochner K, Prothrow-Stith D. Social capital, income inequality, and mortality. Am J of Public Health. 1997;87:1491-8; Kreuter MW, Lezin N. Social Capital Theory: Implications for Community-Based Health Promotion. In Emerging Theories in Health Promotion Practice and Research. Eds. DiClemente RJ, Crosby RA, Kegler MC. Jossey-Bass: San Francisco, CA. 2002.

Bernal Heights Preschool HDMT Report Page 16
As noted throughout the report, geographic proximity does not equal access to services or facilities. Accessibility is defined by a number of quantitative and qualitative differences such as cost, hours of operation, access to transportation, availability of translation services if needed, cultural preferences, etc. For example, in a recent study comparing Oakland, Bayview and Mission, researchers found that while corner stores are not good food resources in every community, they provide sufficient access to fresh produce and other food in the Mission21. SFDPH is currently creating a retail food quality index for the Eastern Neighborhoods which may identify sites or areas needing local access to fresh foods. Topographical and transportation features, such as steep grades of hills or major highways or roads, and socio-cultural issues, such as violence and gang lines, may also inhibit pedestrian access to neighborhood retail and services. Pedestrian safety measures such as traffic calming and pedestrian friendly walkways can help increase safety of physical access to and from food and retail locations. At time of publication, SFDPH is developing a methodology to determine “neighborhood completeness” and quantify relative distance from complete areas or “commercial hubs.” SFDPH developed a tentative list of neighborhood serving retail and services that residents regularly access on a weekly basis. The tentative list includes: auto and bike repair, bank/credit union, community center and garden, barber/beauty salon, convenience store, grocery store/supermarket, hardware store, laundromat/dry cleaner, library, park/playground/open space, performance venue/cultural center, pharmacy/drug store, post office, childcare center, gym/fitness center, public art, public clinics/hospital, public school, recreation center, restaurant/café, and video rental/movie theater. While SFDPH develops a methodology for determining “neighborhood completeness”, SFDPH is exploring alternative means of assessing proximity of commercial and public services in a designated area. One method involves using walkscore.com to identify key retail locations near the Bernal Heights preschool to identify clustering of goods and services. The Retail and Services Map was created using the following steps:
1. To develop a Bernal Heights specific retail and services map, SFDPH first identified all of the retail and services to be included in the list (listed above).
2. Next, DPH entered “500 Cortland Avenue” into the WalkScore.com online geographical database. This search returned dozens of neighborhood services within one mile of our site of interest.
3. Additional neighborhood resources (WalkScore.com lists only retail services) were gleaned by searching the Google Maps “Find Businesses” feature, again using “500 Cortland Avenue” for our reference location.
4. Neighborhood services were verified to be viable entities (i.e. that they exist and are open for business) in two ways.
a. First, SFDPH visited Bernal Heights to confirm that the locations gathered from WalkScore.com and Google Maps exist and are open for business.
b. Secondary confirmation was accomplished through online city guide, Yelp.com, by reading the most up-to-date status of businesses
5. In order for neighborhood services to be coded onto a map, the addresses had to be formatted with ZIP codes. For each address, missing ZIP codes were obtained from Google Maps, then coded through GIS software onto a map of the San Francisco neighborhoods.
6. For additional details on SFDPH’s GIS mapping process, please visit: http://www.thehdmt.org/data_map_methods.php
Bernal Heights Preschool HDMT Report Page 17
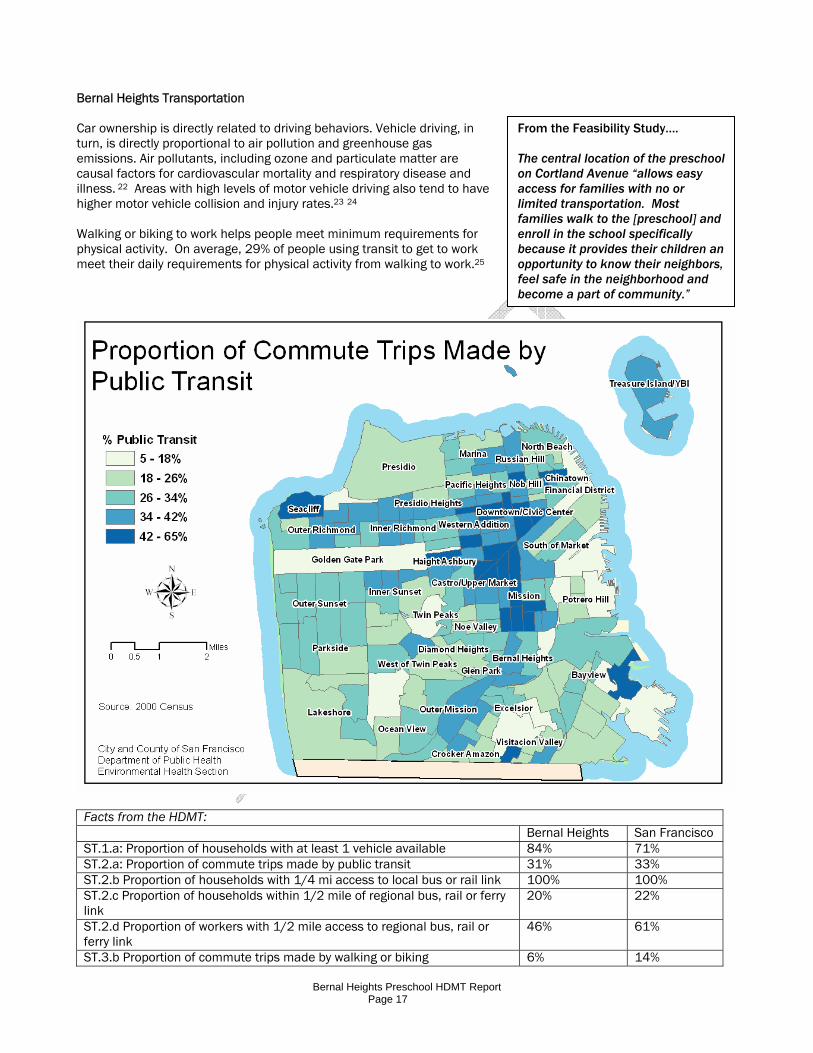
From the Feasibility Study…. The central location of the preschool on Cortland Avenue “allows easy access for families with no or limited transportation. Most families walk to the [preschool] and enroll in the school specifically because it provides their children an opportunity to know their neighbors, feel safe in the neighborhood and become a part of community.”
Bernal Heights Transportation Car ownership is directly related to driving behaviors. Vehicle driving, in turn, is directly proportional to air pollution and greenhouse gas emissions. Air pollutants, including ozone and particulate matter are causal factors for cardiovascular mortality and respiratory disease and illness. 22 Areas with high levels of motor vehicle driving also tend to have higher motor vehicle collision and injury rates.23 24 Walking or biking to work helps people meet minimum requirements for physical activity. On average, 29% of people using transit to get to work meet their daily requirements for physical activity from walking to work.25
Facts from the HDMT: Bernal Heights San Francisco ST.1.a: Proportion of households with at least 1 vehicle available 84% 71% ST.2.a: Proportion of commute trips made by public transit 31% 33% ST.2.b Proportion of households with 1/4 mi access to local bus or rail link 100% 100% ST.2.c Proportion of households within 1/2 mile of regional bus, rail or ferry link
20% 22%
ST.2.d Proportion of workers with 1/2 mile access to regional bus, rail or ferry link
46% 61%
ST.3.b Proportion of commute trips made by walking or biking 6% 14%

Bernal Heights Preschool HDMT Report Page 18
Interpretation and Discussion According to 2000 US Census data, 84% of households in Bernal Heights own at least one vehicle, which is higher than the citywide average of 71%. Despite 100% of the population being within 1/4 mile of a local transit stop and 46% of Bernal Heights workers being within a 1/2 mile of a regional transit stop, only 31% of Bernal Heights commute trips (or trips to work) are made using public transit (similar to the citywide average). Only 6% of commute trips are made by walking or biking (and other means not using vehicles or public transit), which is less than the city average of 14%. This suggests that over 60% of commute trips are done in private vehicles. As illustrated by the map above, the proportion of commute trips made by public transportation varies considerably from census tract to census tract within Bernal Heights. Specifically, the parts of Bernal Heights bordering Mission Street have much higher rates of public transit commutes than the other census tracts, which have decreasing utilization the closer one gets to Highway 101. At the same time, there are four buslines running along Mission Street on the western side of Bernal Heights, whereas there are just a couple lines servicing the rest of Bernal. Over the past twenty-five years, demographic and socio-economic shifts in the Bay Area have added to changing the transit needs of San Franciscans. Car ownership and commuting to other counties has increased among city residents at the same time that use of public transit to work has decreased. Increased residential and business development has added to city street congestion. Meanwhile, public transit revenues have not been able to keep pace with the rising costs of fuel, employee wages and benefits, and service start-up costs. In May 2006, the San Francisco Municipal Transit Agency (MTA) and the City’s Controller’s Office launched the Transit Effectiveness Project, an 18-month effort to comprehensively evaluate the existing Muni transit system and recommend ways to attract more riders and make service more effective and economical. Although all households in San Francisco are within ¼ mile of a local bus or rail stop, proximity does not necessarily equal accessibility. Lower income communities tend to rely more heavily on public transportation than higher income communities. Modes of transportation used to access work are dependent upon numerous variables. Among many others, these may include cost, time waiting for bus or transfer arrival, reliability of transport, distance, accessibility, perceived and actual safety, weather, pedestrian safety, traffic patterns, availability of bicycle lanes, hours of operation, availability of parking, and availability of travel stipends/incentives provided by work or to low income families. Additionally, accessibility of transportation is dependent upon the starting and end destinations. Individuals working in downtown San Francisco likely have an easier time using local or regional transit to get downtown than to other areas of the city, particularly the Western half of San Francisco given current transportation and transfer patterns. Aside from work commutes, individuals must use public or private transportation if they are living in an area where they cannot access their daily retail and service needs. As discussed above, co-location of key services and retail in a community hub can increase walking, decrease car dependency, and decrease the amount of time needed to access basic goods and services, thereby allowing more family and leisure time which is good for mental health and social cohesion.

Bernal Heights Preschool HDMT Report Page 19
From the Feasibility Study…. During the study process, preschool parents… suggested the incorporation of green materials for a healthy preschool learning environment. Green building integrates materials and methods that promote environmental quality, economic vitality, and social benefits through design, construction and operation of the built environment… Additional benefits may be improved health for children, opportunities for research on the impact of building construction materials as it relates to child health, and possibilities for ecological programs teaching stewardship beginning in the preschool years.
Bernal Heights Air Quality and Noise Conditions Extensive research demonstrates that living in proximity to busy roadways is linked to negative health outcomes. Adverse health outcomes associated with proximity include exacerbation of respiratory diseases, sleep disruption and cognitive disturbance, and unintentional (traffic) injuries. Epidemiologic studies have consistently found that proximity to high traffic density or flow is associated with reduced lung function and increased asthma hospitalizations, asthma symptoms, bronchitis symptoms, and medical visits.26
Noise can be detrimental to health with respect to hearing impairment, sleep disturbance, cardiovascular effects, psycho-physiologic effects, psychiatric symptoms, and fetal development.27 28 A chronic environmental stressor such as road traffic could impair cognitive development in children, such as reading comprehension, speech intelligibility, memory, motivation, attention, problem-solving, and performance on standardized tests.29
Facts from the HDMT: Bernal Heights San Francisco ES.5.a: Proportion of households living within 500 feet of busy roadways
58% 51%
ES.5.c: Proportion of households living within 500 feet of designated truck routes
26% 39%

Bernal Heights Preschool HDMT Report Page 20
ES.6.a: Average daytime and nighttime outdoor noise levels by decibel
59 62
Interpretation and Discussion The Bernal Heights neighborhood is adjacent to several busy roadways, and 58% of Bernal Heights households live within 500 feet of a busy roadway, regularly exposing those households to particulate matter and other pollutants from the roadway vehicles. Adverse health outcomes associated with close proximity (<500 feet) to busy roadways include: exacerbation of respiratory diseases like asthma, impairment of lung growth, sleep disruption and cognitive disturbance, and unintentional (traffic) injuries. In 2005, the California Air Resource Board (CARB) issued guidelines for siting of sensitive land uses with regards to their proximity to stationary and mobile sources of air pollution. The CARB Air Quality and Land Use Handbook: A Community Health Perspective included a recommendation to not site sensitive land uses including schools, park and playgrounds, day care centers, nursing homes, hospitals, and residential communities within 500 feet of a highway with more than 100,000 vehicles per day. Both the library and Paul Revere school are more than 500 feet away from a busy roadway (as defined by CARB). Paul Revere school is located closer to Highways 101 and 280 than the library, but the library location is located on Cortland Avenue, a major Bernal Heights thoroughfare but with relatively low traffic volume. According to one Bernal Heights resident, there is frequent congestion on the eastern section of Cortland Avenue as cars get onto Bayshore and the Highway. Despite the proximity to roadways, Bernal Heights has a slightly less than citywide daytime and nighttime average noise levels (59dB compared to citywide 62dB), with the exception of along the eastern and southern borders of Bernal Heights along Highways 101 and 280. Although neither proposed preschool location is in a location at which negative air quality or noise health impacts have been documented, the majority of residents do reside in areas that may put them at risk for the poor air-quality related health outcomes discussed above. To protect sensitive use populations, such as young children, seniors, and persons with respiratory diseases, educational outreach efforts could be conducted to promote structural interventions, such as installation of HVAC systems and sound proofing walls, preventative medical care, and traffic calming devices.
Bernal Heights Preschool HDMT Report Page 21
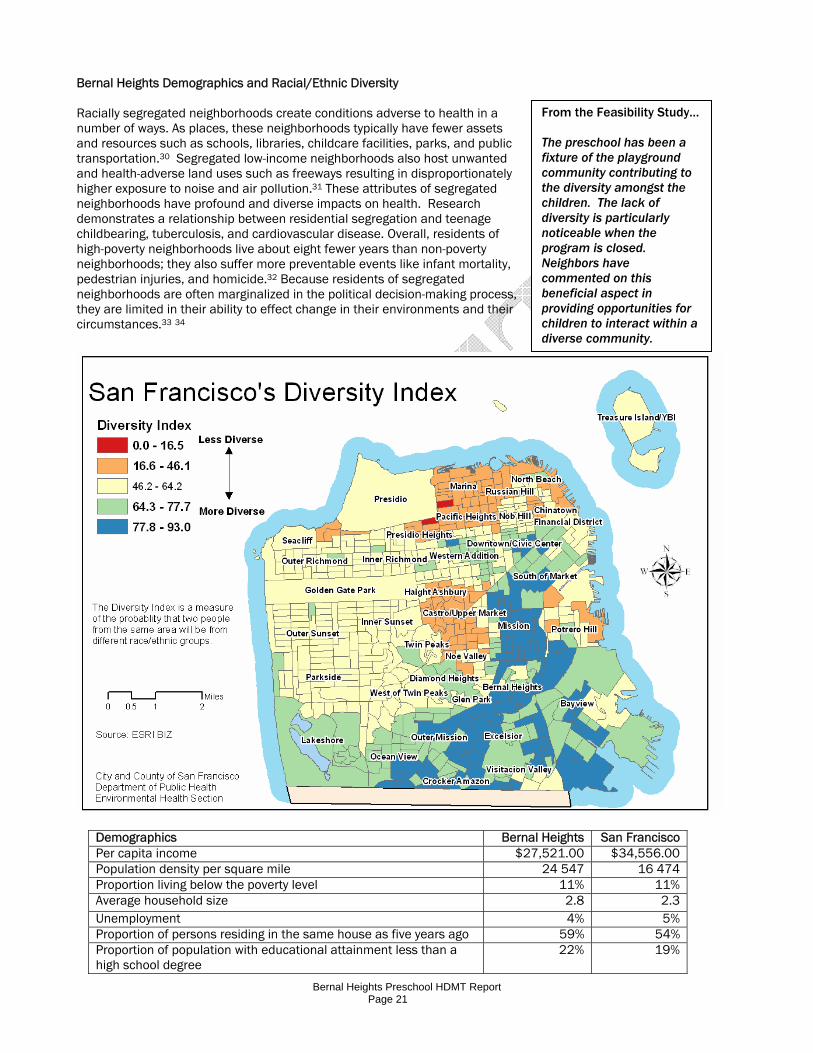
From the Feasibility Study… The preschool has been a fixture of the playground community contributing to the diversity amongst the children. The lack of diversity is particularly noticeable when the program is closed. Neighbors have commented on this beneficial aspect in providing opportunities for children to interact within a diverse community.
Bernal Heights Demographics and Racial/Ethnic Diversity Racially segregated neighborhoods create conditions adverse to health in a number of ways. As places, these neighborhoods typically have fewer assets and resources such as schools, libraries, childcare facilities, parks, and public transportation.30 Segregated low-income neighborhoods also host unwanted and health-adverse land uses such as freeways resulting in disproportionately higher exposure to noise and air pollution.31 These attributes of segregated neighborhoods have profound and diverse impacts on health. Research demonstrates a relationship between residential segregation and teenage childbearing, tuberculosis, and cardiovascular disease. Overall, residents of high-poverty neighborhoods live about eight fewer years than non-poverty neighborhoods; they also suffer more preventable events like infant mortality, pedestrian injuries, and homicide.32 Because residents of segregated neighborhoods are often marginalized in the political decision-making process, they are limited in their ability to effect change in their environments and their circumstances.33 34
Demographics Bernal Heights San Francisco Per capita income $27,521.00 $34,556.00 Population density per square mile 24 547 16 474 Proportion living below the poverty level 11% 11% Average household size 2.8 2.3 Unemployment 4% 5% Proportion of persons residing in the same house as five years ago 59% 54% Proportion of population with educational attainment less than a high school degree
22% 19%
Bernal Heights Preschool HDMT Report Page 22
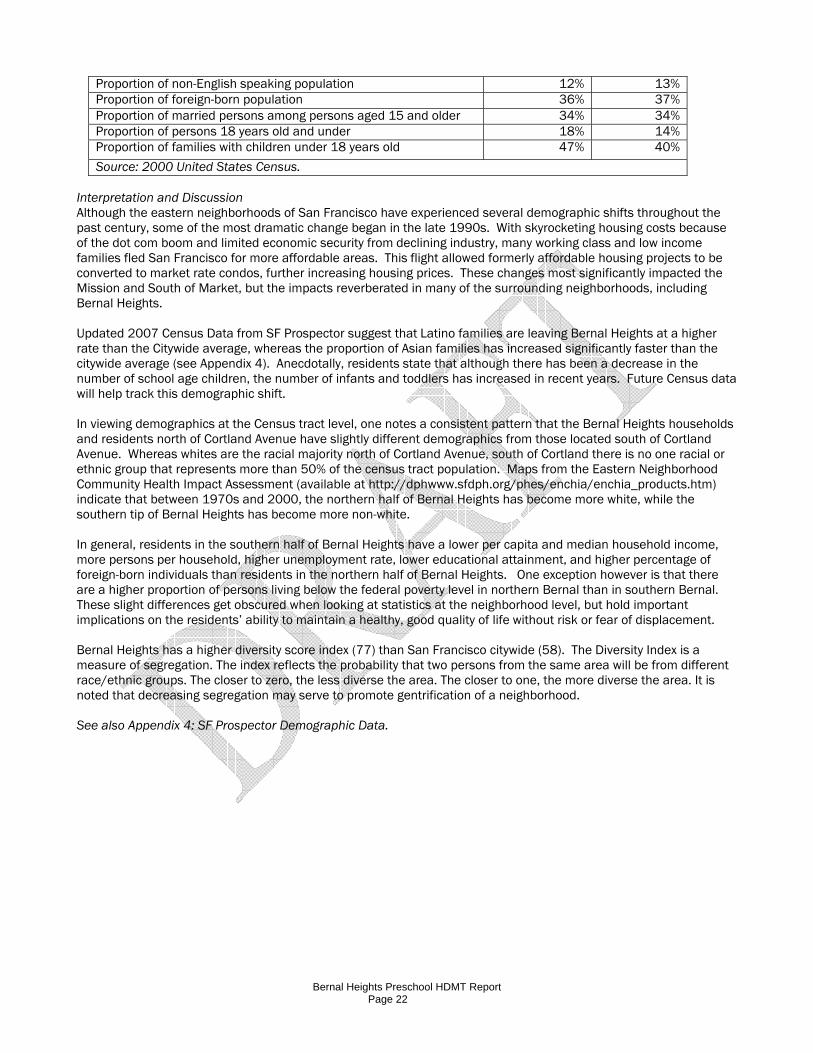
Proportion of non-English speaking population 12% 13% Proportion of foreign-born population 36% 37% Proportion of married persons among persons aged 15 and older 34% 34% Proportion of persons 18 years old and under 18% 14% Proportion of families with children under 18 years old 47% 40%
Source: 2000 United States Census. Interpretation and Discussion Although the eastern neighborhoods of San Francisco have experienced several demographic shifts throughout the past century, some of the most dramatic change began in the late 1990s. With skyrocketing housing costs because of the dot com boom and limited economic security from declining industry, many working class and low income families fled San Francisco for more affordable areas. This flight allowed formerly affordable housing projects to be converted to market rate condos, further increasing housing prices. These changes most significantly impacted the Mission and South of Market, but the impacts reverberated in many of the surrounding neighborhoods, including Bernal Heights. Updated 2007 Census Data from SF Prospector suggest that Latino families are leaving Bernal Heights at a higher rate than the Citywide average, whereas the proportion of Asian families has increased significantly faster than the citywide average (see Appendix 4). Anecdotally, residents state that although there has been a decrease in the number of school age children, the number of infants and toddlers has increased in recent years. Future Census data will help track this demographic shift. In viewing demographics at the Census tract level, one notes a consistent pattern that the Bernal Heights households and residents north of Cortland Avenue have slightly different demographics from those located south of Cortland Avenue. Whereas whites are the racial majority north of Cortland Avenue, south of Cortland there is no one racial or ethnic group that represents more than 50% of the census tract population. Maps from the Eastern Neighborhood Community Health Impact Assessment (available at http://dphwww.sfdph.org/phes/enchia/enchia_products.htm) indicate that between 1970s and 2000, the northern half of Bernal Heights has become more white, while the southern tip of Bernal Heights has become more non-white. In general, residents in the southern half of Bernal Heights have a lower per capita and median household income, more persons per household, higher unemployment rate, lower educational attainment, and higher percentage of foreign-born individuals than residents in the northern half of Bernal Heights. One exception however is that there are a higher proportion of persons living below the federal poverty level in northern Bernal than in southern Bernal. These slight differences get obscured when looking at statistics at the neighborhood level, but hold important implications on the residents’ ability to maintain a healthy, good quality of life without risk or fear of displacement. Bernal Heights has a higher diversity score index (77) than San Francisco citywide (58). The Diversity Index is a measure of segregation. The index reflects the probability that two persons from the same area will be from different race/ethnic groups. The closer to zero, the less diverse the area. The closer to one, the more diverse the area. It is noted that decreasing segregation may serve to promote gentrification of a neighborhood. See also Appendix 4: SF Prospector Demographic Data.

Bernal Heights Preschool HDMT Report Page 23
CONCLUSION Since 1960 when a quarter of the city’s population was under the age of 18, there has been a decline in the number of families with children in San Francisco. As of the 2000 Census, roughly 14% of the city’s population was under the age of 18. As stated by Mayor Gavin Newsom, “Families are the backbone of our neighborhoods and children are the city’s hope for the future. We must proactively confront the challenges that drive families out of San Francisco.”2 To help address this issue, Mayor Newsom released a report with the Mayor’s Policy Council on Children, Youth and Families in 2005 and launched a series of policy discussions about family retention. Bernal Heights is known by its residents as a relatively family friendly environment with fairly low rates of crime, close proximity to elementary schools, parks, the Mission, art/cultural activities, diverse cafes and restaurants, and relatively close proximity to Downtown. As stated by one of the Preschool Committee members, “Bernal Heights is currently a place where you see lots of stroller moms and nannies walking the street during the day.” As discussed earlier in this report, Bernal Heights residents have fought to make Cortland Avenue a place where people want to come with their families, to go to the recreation center and playground, and at the same time accomplish other activities such as banking and food shopping. Similar to the Mission, in recent years, gentrification has pressured low income families out of Bernal Heights replaced by middle and upper income white and Asian families. Data from SF Prospector suggest that Latino families are leaving Bernal Heights at a higher rate than the Citywide average, whereas the proportion of Asian families has increased significantly faster than the citywide average (see Appendix 4). Anecdotally, residents state that although there has been a decrease in the number of school age children, the number of infants and toddlers has increased in recent years. Future Census data will help track this demographic shift. The expansion of the Bernal Heights Preschool, which currently provides affordable and high quality childcare to low income families, mostly of color, would be one key way that the City of San Francisco can act on its commitment to retain families. According to the different plan proposals, the only location near Cortland Avenue where the Preschool could expand the number of children served would be Option C, the lower flattop portion of the Bernal Heights playground. According to Preschool staff, the Preschool has consistently had a waiting list of children wanting to participate in the school – up until the time that it was relocated to Paul Revere School. One interpretation of this could be that the Paul Revere School location does not meet families’ needs. Another interpretation could be that there is decreased demand for childcare among low income families. A third interpretation could be that there was not sufficient public notice of the relocation site for the preschool. Given the existing high demand for childcare, even with slight population shifts (i.e. a loss of 6% of Latino families in northern and southern Bernal), it is likely that there is still high demand for affordable childcare and therefore justification for expanding the preschool. As described throughout the report, retaining the preschool in a location near Cortland Avenue would help increase parents’ utilization of nearby retail and services such as the bank, recreation center, library and other shops/services, thus addressing potential concerns about location. Access to affordable and high quality childcare is one factor among various others that influence families’ decisions to move to, stay in, or move away from a particular neighborhood. To reach its commitment of retaining families, the City needs to invest more resources in affordable childcare and housing, school performance, public transportation, well-maintained and safe parks and streets, job opportunities at a variety of educational levels, and places for social interaction, arts and cultural activities. Expansion of the Bernal Heights Preschool and retention of its policies to provide affordable, quality childcare for populations below a certain income will in and of itself not be sufficient to keep lower income families of color in Bernal Heights. However, investment in preschool expansion and retention of its policies does provide a valuable political and economic commitment at the neighborhood and city level to keeping San Francisco ethnically and economically diverse, which may impact future economic investments as well. Research has found that investment in early childhood development, particularly among low-income children, has significant economic return, in addition to a number of educational and health benefits. For example, the nationally cited Perry Preschool Project in Ypsilanti, Michigan found that there was more than $16 economic return to society for every dollar invested in the preschool children.3 Given the long term educational and economic benefits of investing in early childhood development, investing in Bernal Heights’ poorer children today can help ensure a healthy, vibrant and diverse San Francisco in the future. 2 Mayor’s Office Press Release: Getting Behind the Headlines: Families Leaving SF. October 21, 2005. Accessed on December 10,2007: http://www.ci.sf.ca.us/site/mayor_page.asp?id=35459 3 As measured by faring better in the K-12 education system, graduating from high school, having higher earnings, lower welfare receipt, less teen pregnancy and lower conviction of a crime in comparison to the control group. For more information, see the Federal Reserve Bank of San Francisco’s Fall 2007 Publication of Community Investments. Or http://www.evidencebasedprograms.org/Default.aspx?tabid=32
Bernal Heights Preschool HDMT Report Page 24
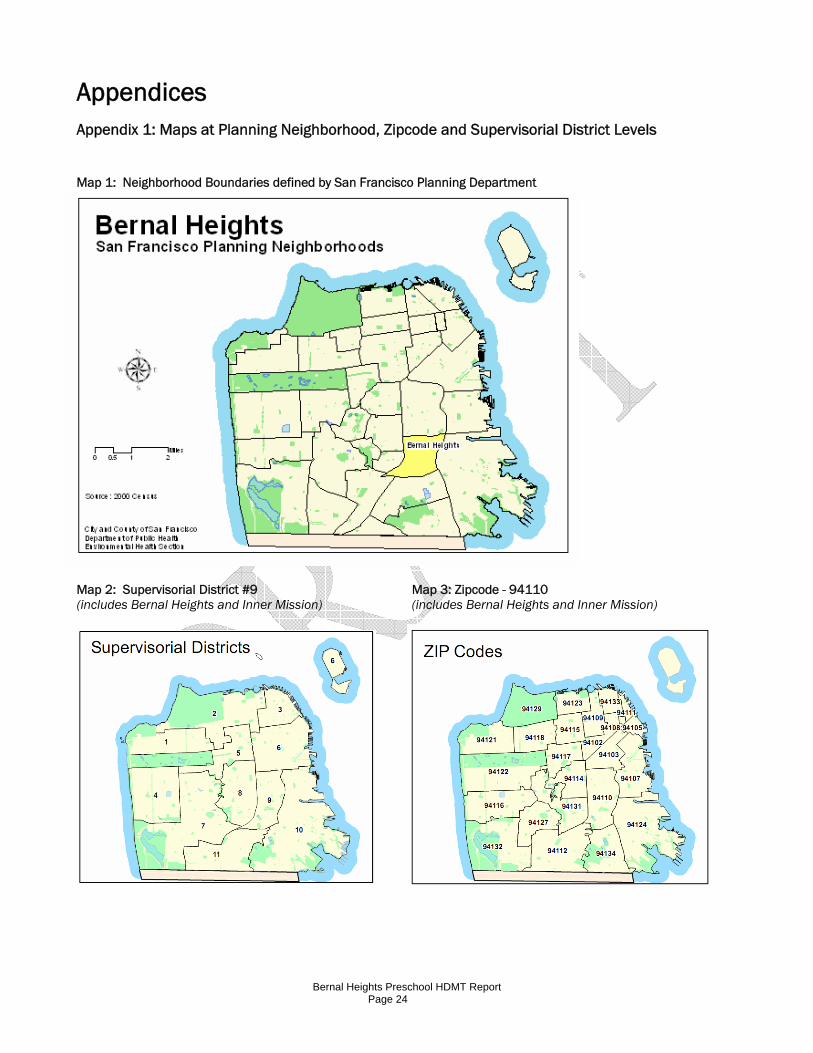
Appendices Appendix 1: Maps at Planning Neighborhood, Zipcode and Supervisorial District Levels
Map 1: Neighborhood Boundaries defined by San Francisco Planning Department
Map 2: Supervisorial District #9 Map 3: Zipcode - 94110 (includes Bernal Heights and Inner Mission) (includes Bernal Heights and Inner Mission)

Bernal Heights Preschool HDMT Report Page 25
Appendix 2: Maps of Former, Current and Potential Future Bernal Preschool Locations Blue Placeholder Bernal Heights Public Library 500 Cortland Avenue Former Location of the Bernal Hts Preschool Red Placeholder Lower Flattop Play Area Andover Street, between Cortland Ave. and Ellert St. Proposed Location of the Bernal Hts Preschool Green Placeholder & Green School Building Paul Revere Elem. School 555 Tompkins Avenue Current Location of the Bernal Heights Preschool
Bernal Heights Preschool HDMT Report Page 26
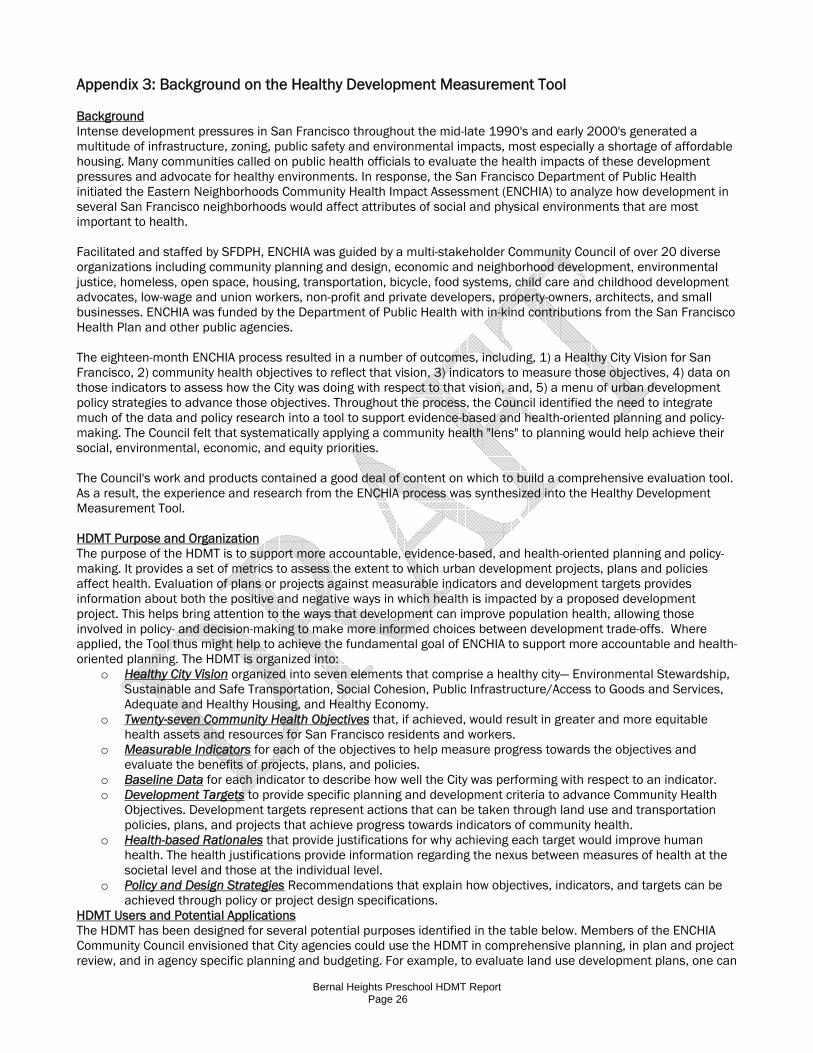
Appendix 3: Background on the Healthy Development Measurement Tool Background Intense development pressures in San Francisco throughout the mid-late 1990's and early 2000's generated a multitude of infrastructure, zoning, public safety and environmental impacts, most especially a shortage of affordable housing. Many communities called on public health officials to evaluate the health impacts of these development pressures and advocate for healthy environments. In response, the San Francisco Department of Public Health initiated the Eastern Neighborhoods Community Health Impact Assessment (ENCHIA) to analyze how development in several San Francisco neighborhoods would affect attributes of social and physical environments that are most important to health. Facilitated and staffed by SFDPH, ENCHIA was guided by a multi-stakeholder Community Council of over 20 diverse organizations including community planning and design, economic and neighborhood development, environmental justice, homeless, open space, housing, transportation, bicycle, food systems, child care and childhood development advocates, low-wage and union workers, non-profit and private developers, property-owners, architects, and small businesses. ENCHIA was funded by the Department of Public Health with in-kind contributions from the San Francisco Health Plan and other public agencies. The eighteen-month ENCHIA process resulted in a number of outcomes, including, 1) a Healthy City Vision for San Francisco, 2) community health objectives to reflect that vision, 3) indicators to measure those objectives, 4) data on those indicators to assess how the City was doing with respect to that vision, and, 5) a menu of urban development policy strategies to advance those objectives. Throughout the process, the Council identified the need to integrate much of the data and policy research into a tool to support evidence-based and health-oriented planning and policy-making. The Council felt that systematically applying a community health "lens" to planning would help achieve their social, environmental, economic, and equity priorities. The Council's work and products contained a good deal of content on which to build a comprehensive evaluation tool. As a result, the experience and research from the ENCHIA process was synthesized into the Healthy Development Measurement Tool. HDMT Purpose and Organization The purpose of the HDMT is to support more accountable, evidence-based, and health-oriented planning and policy-making. It provides a set of metrics to assess the extent to which urban development projects, plans and policies affect health. Evaluation of plans or projects against measurable indicators and development targets provides information about both the positive and negative ways in which health is impacted by a proposed development project. This helps bring attention to the ways that development can improve population health, allowing those involved in policy- and decision-making to make more informed choices between development trade-offs. Where applied, the Tool thus might help to achieve the fundamental goal of ENCHIA to support more accountable and health-oriented planning. The HDMT is organized into:
o Healthy City Vision organized into seven elements that comprise a healthy city— Environmental Stewardship, Sustainable and Safe Transportation, Social Cohesion, Public Infrastructure/Access to Goods and Services, Adequate and Healthy Housing, and Healthy Economy.
o Twenty-seven Community Health Objectives that, if achieved, would result in greater and more equitable health assets and resources for San Francisco residents and workers.
o Measurable Indicators for each of the objectives to help measure progress towards the objectives and evaluate the benefits of projects, plans, and policies.
o Baseline Data for each indicator to describe how well the City was performing with respect to an indicator. o Development Targets to provide specific planning and development criteria to advance Community Health
Objectives. Development targets represent actions that can be taken through land use and transportation policies, plans, and projects that achieve progress towards indicators of community health.
o Health-based Rationales that provide justifications for why achieving each target would improve human health. The health justifications provide information regarding the nexus between measures of health at the societal level and those at the individual level.
o Policy and Design Strategies Recommendations that explain how objectives, indicators, and targets can be achieved through policy or project design specifications.
HDMT Users and Potential Applications The HDMT has been designed for several potential purposes identified in the table below. Members of the ENCHIA Community Council envisioned that City agencies could use the HDMT in comprehensive planning, in plan and project review, and in agency specific planning and budgeting. For example, to evaluate land use development plans, one can

Bernal Heights Preschool HDMT Report Page 27
assess how the expected outcomes of development projects or policies affect the community health indicators, or whether a plan achieves development targets. The HDMT can be used by anyone who has data on the outcomes of a project, plan or policy, including planners, developers, government agencies, and community residents and organizations.
Users Applications City agencies (i.e., Planning, Public Health, Redevelopment, Recreation and Parks, Public Works, Transportation)
1. Provide a checklist or screening tool to evaluate projects, identify benefits and needs for improvement, and guide staff reports
2. Provide a measurable set of health objectives and indicators to guide planning goals and evaluate their impacts
3. Provide useful monitoring indicators for community health assessments and measuring the success and progress of societal level interventions
4. Guide infrastructure budgeting to priority
Neighborhood planning groups Help residents evaluate the merits and health impacts of development projects and plans
Resident-initated community planning processes
Provide a measurable set of health objectives and indicators to guide planning goals and evaluate impacts
Developers To inform design choices and to demonstrate benefits of projects All As a way to gain consensus and a unified position among interests
HDMT Caveats Voluntary not regulatory approach This Tool is not a new form of environmental regulation or a set of enforceable standards. The Tool does not mandate the achievement of specific development targets. Similar to tools like LEED-ND, this Tool is intended to encourage voluntary efforts to improve health-oriented development. Developed for urban contexts through a local participatory process The indicators and targets in this Tool reflect the ENCHIA Community Council objectives and needs identified in their Healthy City Vision for San Francisco. In urban areas, the Tool is appropriate for new developments in residential, commercial, mixed-use and industrial sites. A large part of this Tool may be relevant for evaluating land use development in other dense, socially and economically diverse cities. However, other locales may want to modify indicators and targets to reflect local needs. Conflicts between objectives are made explicit Good development will always represent an optimal balance between competing objectives. Therefore, a user of this Tool should expect that for any given project, the Tool will reveal particular advantages and disadvantages. The achievement of one or more targets alone does not signify good development and the non-achievement of one or more targets does not signal poor development. By providing information about both the positive and negative effects on health objectives, the Tool helps to reveal trade-offs and aids those involved to make more informed choices with full-recognition of those trade-offs. The Tool does not provide a means to weigh conflicting priorities and goals, nor does it advocate for or discourage any specific means of evaluating these trade-offs. The optimal use of this Tool will occur in an open and transparent decision-making process. While in some cases, a lack of data about a certain aspect of a project or plan will prohibit the evaluation of an indicator or target, the Tool is meant to be used comprehensively, by using all objectives and indicators. Several examples of the types of trade-offs one might expect in the evaluation of land use development projects are:
o Conflicts between established wetland buffers and local land use regulations. o Mixed-use developments and higher densities are associated with higher noise levels. o Abiding by LEED or Energy Star standards increases the cost of the housing production o Desegregating schools may conflict with promoting neighborhood-based education o Green space around schools may conflict with the ability of children to walk or bike to school if it necessitates
schools being in urban neighborhoods.

Bernal Heights Preschool HDMT Report Page 28
o Development targets that decrease segregation and promote racial and economic integration can facilitate gentrification.
o Development impact fees or community benefits agreements may raise development costs which reduces developer desire or ability to pay for things like affordable housing or green building design.
o Development plans or projects designed to attract stable jobs with career ladders may work at a disadvantage to small businesses, since they will favor large firms which tend to have a hierarchy of success and enough resources to invest in employee retention and development.
o Development of green roofs may compete with the use of roofs for solar energy. Limitations and recognized gaps This Tool does not provide indicators for all outcomes related to health. The focus of the Tool is on environmental, social and economic level factors that affect health at the population level. The Tool does not include traditional behavioral health indicators nor does the Tool assess factors modifiable at the household level such as environmental tobacco smoke exposure. Many concepts in the Tool present challenges to measurement. For example, while we use distance as a proxy for accessibility, distance does not represent aspects of accessibility such as time, cost, and quality. Limitations of demographic analyses and forecasts Demographic analyses and forecasts are frequently used to predict housing and job markets, school enrollments, consumer and transportation demands, etc which subsequently impacts resource allocation by public and private agencies and investors. It is important to note that demographic analyses and forecasts may be used to reinforce the status quo and therefore not address the needs of people who you may want to bring into a community or prevent from having to leave a community. Several examples help illustrate this point:
o A demographic and enrollment forecast of the San Francisco school district may show that a certain neighborhood is projected to have fewer and fewer children attending public schools over the next two decades. The school district may subsequently decide to phase out the school in that neighborhood and invest resources in other schools. By phasing out the school, future families with young children will be less likely to move to this neighborhood.
o An area cited for industrial use historically has low pedestrian and commercial activity. When the area is recited for residential or mixed use, all previous data would indicate that the area is not a pedestrian friendly environment. However, creative land use design may cultivate greater pedestrian access to commercial and residential spaces.
o Analyses indicating that 60% of customers currently use cars to access a store may be predicated on the fact that there are no safe pedestrian walkways to the store and/or there may be no public transportation stops near the store. Changing transportation and land use design in that region to promote pedestrian activity and access to public transportation, as well as disincentivize usage of private cars (i.e., by converting some parking spaces into green spaces), may therefore change the demographics of the store's clientele.
A learning document Developing this Tool has been a collective learning process. The Tool will continue to undergo peer review by national experts in the fields of public health, planning, environmental protection, and social indicators. New research findings and newly available technologies for measurement and assessment will be incorporated appropriately into the Tool. The time and costs of applying this Tool will be documented in its future development and as application occurs.
For more information and to view the HDMT, please visit: www.theHDMT.org
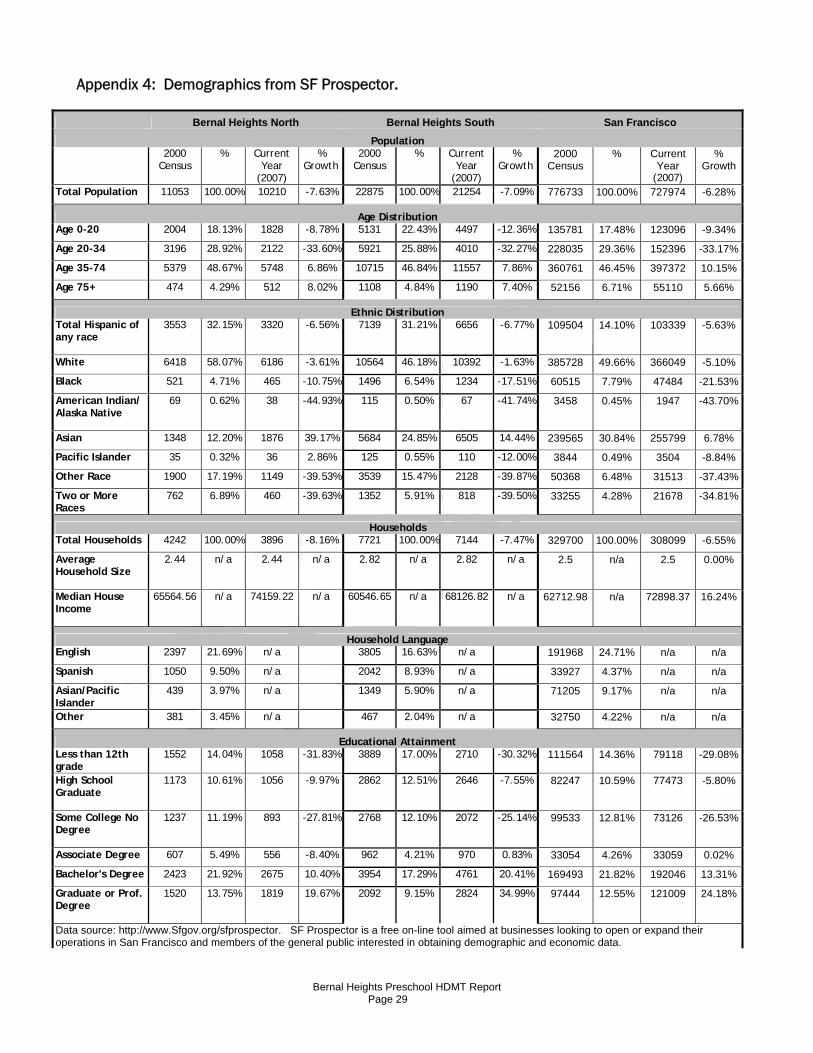
Bernal Heights Preschool HDMT Report Page 29
Appendix 4: Demographics from SF Prospector.
Bernal Heights North Bernal Heights South San Francisco
Population 2000
Census % Current
Year (2007)
% Growth
2000 Census
% Current Year
(2007)
% Growth
2000 Census
% Current Year
(2007)
% Growth
Total Population 11053 100.00% 10210 -7.63% 22875 100.00% 21254 -7.09% 776733 100.00% 727974 -6.28%
Age Distribution Age 0-20 2004 18.13% 1828 -8.78% 5131 22.43% 4497 -12.36% 135781 17.48% 123096 -9.34%
Age 20-34 3196 28.92% 2122 -33.60% 5921 25.88% 4010 -32.27% 228035 29.36% 152396 -33.17%
Age 35-74 5379 48.67% 5748 6.86% 10715 46.84% 11557 7.86% 360761 46.45% 397372 10.15%
Age 75+ 474 4.29% 512 8.02% 1108 4.84% 1190 7.40% 52156 6.71% 55110 5.66%
Ethnic Distribution Total Hispanic of any race
3553 32.15% 3320 -6.56% 7139 31.21% 6656 -6.77% 109504 14.10% 103339 -5.63%
White 6418 58.07% 6186 -3.61% 10564 46.18% 10392 -1.63% 385728 49.66% 366049 -5.10%
Black 521 4.71% 465 -10.75% 1496 6.54% 1234 -17.51% 60515 7.79% 47484 -21.53%
American Indian/ Alaska Native
69 0.62% 38 -44.93% 115 0.50% 67 -41.74% 3458 0.45% 1947 -43.70%
Asian 1348 12.20% 1876 39.17% 5684 24.85% 6505 14.44% 239565 30.84% 255799 6.78%
Pacific Islander 35 0.32% 36 2.86% 125 0.55% 110 -12.00% 3844 0.49% 3504 -8.84%
Other Race 1900 17.19% 1149 -39.53% 3539 15.47% 2128 -39.87% 50368 6.48% 31513 -37.43%
Two or More Races
762 6.89% 460 -39.63% 1352 5.91% 818 -39.50% 33255 4.28% 21678 -34.81%
Households Total Households 4242 100.00% 3896 -8.16% 7721 100.00% 7144 -7.47% 329700 100.00% 308099 -6.55%
Average Household Size
2.44 n/a 2.44 n/a 2.82 n/a 2.82 n/a 2.5 n/a 2.5 0.00%
Median House Income
65564.56 n/a 74159.22 n/a 60546.65 n/a 68126.82 n/a 62712.98 n/a 72898.37 16.24%
Household Language English 2397 21.69% n/a 3805 16.63% n/a 191968 24.71% n/a n/a
Spanish 1050 9.50% n/a 2042 8.93% n/a 33927 4.37% n/a n/a
Asian/Pacific Islander
439 3.97% n/a 1349 5.90% n/a 71205 9.17% n/a n/a
Other 381 3.45% n/a 467 2.04% n/a 32750 4.22% n/a n/a
Educational Attainment Less than 12th grade
1552 14.04% 1058 -31.83% 3889 17.00% 2710 -30.32% 111564 14.36% 79118 -29.08%
High School Graduate
1173 10.61% 1056 -9.97% 2862 12.51% 2646 -7.55% 82247 10.59% 77473 -5.80%
Some College No Degree
1237 11.19% 893 -27.81% 2768 12.10% 2072 -25.14% 99533 12.81% 73126 -26.53%
Associate Degree 607 5.49% 556 -8.40% 962 4.21% 970 0.83% 33054 4.26% 33059 0.02%
Bachelor's Degree 2423 21.92% 2675 10.40% 3954 17.29% 4761 20.41% 169493 21.82% 192046 13.31%
Graduate or Prof. Degree
1520 13.75% 1819 19.67% 2092 9.15% 2824 34.99% 97444 12.55% 121009 24.18%
Data source: http://www.Sfgov.org/sfprospector. SF Prospector is a free on-line tool aimed at businesses looking to open or expand their operations in San Francisco and members of the general public interested in obtaining demographic and economic data.

Bernal Heights Preschool HDMT Report Page 30
Appendix 5: Citations/Bibliography 1 Karoly LA. Early Childhood Interventions: Proven Results, Future Promise. RAND Corporation, 2005. 2 Schweinhart LJ. The High / Scope Perry Preschool Study Through Age 40. The High Scope Press, 2004. 3 San Francisco Department of Public Health, Program on Health, Equity, and Sustainability. The Case for Housing Impacts Assessment: The human health and social impacts of inadequate housing and their consideration in CEQA policy and practice. May, 2004. Available at: http://www.sfdph.org/phes/publications/PHES_publications.htm 4 Ross DP, Roberts P. Income and child well being: A new perspective on the policy debate. Canadian Council for Social Development. Ottawa. 1999. 5 Cooper, Merrill. Housing Affordability: A Children’s Issue. Canadian Policy Research Networks Discussion Paper. Ottawa. 2001 6 Evans G, Marcynyszyn LA. Environmental Justice, Cumulative Environmental Risk, and Health among Low- and Middle-Income Children in Upstate New York. American Journal of Public Health 2004;94: 1942-1944. 7 Backlund E, Sorlie PD, Johnson NJ. A comparison of the relationships of education and income with mortality: the National Longitudinal Mortality Study. Soc Sci Med. 1999;49(10):1373-84. 8 Ewing R, Forinash CV, Schroeer W. Neighborhood Schools and Sidewalk Connections. What are the impacts on travel mode choice and vehicle emissions. Transportation Research News. March-April 2005 pp 4-10. 9 Dellinger A, Staybtib C. Barriers to Children Walking and Bicycling to School. Morbidity and Mortality Weekly Report. 2002;51:701-704. 10 SFUSD Information from: http://portal.sfusd.edu/template/default.cfm?page=policy.placement.process 11 Demographic Analyses and Enrollment Forecasts: San Francisco Unified School District. July 2002. Report by: Lapkoff & Gobalet Demographic Research, Inc. on Behalf of SFUSD. Accessed on July 15, 2006: http://www.demographers.com/SANFRANEXECSUMLETTERHEAD.pdf 12 For an explanation of the API, please visit: http://www.thehdmt.org/indicator.php?indicator_id=86 13 Cohen DA, Ashwood JS, Scott MM, Overton A, Evenson KR, Staten LK, Porter D, McKenzie TL, Catellier D. Public parks and physical activity among adolescent girls. Pediatrics. 2006;118(5):e1381-1389. 14 Vries S, de Verheij RA, Groenewegen PP, Spreeuwenberg P. Natural environments - healthy environments? An exploratory analysis of the relationship between green space and health. Environment and Planning. 2003;35:1717-1731. 15 Kuo FE, Sullivan WC. Environment and crime in the inner city: does vegetation reduce crime? Environment and Behavior. 2001;33(3):343-367. 16 Kahn EB. The effectiveness of interventions to increase physical activity. American Journal of Preventative Medicine. 2002;22:87-88. 17 Ewing R, Frank L, Kreutzer R. Understanding the Relationship between Public Health and the Built Environment: A Report to the LEED-ND Core Committee. 2006. 18 Morland K, Diez Roux AV, Wing S. Supermarkets, other food stores, and obesity: the atherosclerosis risk in communities study. Am J Prev Med. 2006;30(4):333-9. 19 Inagami S, Cohen DA, Finch BK, Asch SM. You are where you shop: grocery store locations, weight, and neighborhoods. Am J Prev Med. 2006;31(1):10-7. 20 SF Food Systems. 2005 SF Collaborative Food System Assessment. Available at: http://www.sffoodsystems.org/index.html 21Short A, Guthman J, Raskin S. Food Deserts, Oases, or Mirages?: Small Markets and Community Food Security in the San Francisco Bay Area. Journal of Planning Education and Research. 2007: 26; 352. 22 American Heart Association. http://www.americanheart.org/presenter.jhtml?identifier=4419 23 Hadayeghi A, Shalaby AS, Persaud BN. Macrolevel accident prediction models for evaluating safety of urban transportation systems. Transportation Research Record. 2003 no. 1840:87-95. 24 Lovegrove GR, Sayed T. Macrolevel collision prediction models for evaluating neighborhood traffic safety. Canadian Journal of Civil Engineering. 2006;33(5):609-621. 25 Besser LM, Dannenberg AL. Walking to public transit: steps to help meet physical activity recommendations. Am J Prev Med. 2005;29(4):273-80. 26 Brauer M, Hoek G, Van Vliet P, et al. Air pollution from traffic and the development of respiratory infections and asthmatic and allergic symptoms in children. American Journal of Respiratory and Critical Care Medicine. 2002;166:1092-1098. 27 Historical Note about Recommended Lighting Levels. International Dark-Sky Association. Newsletter No. 22. October 1994. 28 Stansfeld S, Haines M, Brown B. Noise and health in the urban environment. Rev Environmental Health, 2000 Vol15(1-2): 43-82

Bernal Heights Preschool HDMT Report Page 31
29 Stansfeld SA, Berglund, B, Clark C, Lopez-Barrio I, Fischer P, Öhrström E, Haines MM, Head J, Hygge S, Kamp I, Berry BF, and RANCH study team. Aircraft and road traffic noise and children's cognition and health: a cross-national study. The Lancet, June 4-10, 2005, Vol. 365 (9475): 1942-49 30 Kawachi I, Berkman LF. Neighborhoods and Health. New York: Oxford University Press; 2003. 31 Maantay J. Zoning, equity, and public health. Am J of Pub Health. 2001;91:1033-1041. 32 Acevedo-Garcia D, Lochner KA, Osypuk TL, Subramanian SV. Future Directions in Residential Segregation and Health Research: A Multilevel Approach. Am J of Pub Health. 2003;93:215-221 33 Wilson WJ. The Truly Disadvantaged: The Inner City, the Underclass, and Public Policy. Chicago: University of Chicago Press; 1987. 34 Bullard RD. Dumping in Dixie: Race, class, and environmental quality. Boulder: Westview; 1990