AN APPLICATION OF PARTICLE SWARM … 1st...AN APPLICATION OF PARTICLE SWARM OPTIMIZATION TO CONTROL...
84
International conference on Science, Technology and Management ICSTM-2015 YMCA, New Delhi (India), 1 Feb 2015 www.conferenceworld.in 546 | Page AN APPLICATION OF PARTICLE SWARM OPTIMIZATION TO CONTROL INVERTED PENDULUM Kunal Kumar 1, Sumit Kumar Pandey 2 1. Department of Computer Science, St. Xavier’s College, Maharo Dumka (India) 2. Department of Electrical and Electronics Engineering, Jharkhand Rai University Ranchi (India) ABSTRACT One of the most important problems today is robotics and its control, due to the vast application of inverted pendulum in robots.In this paper, by using a combination of "PSO" Algorithms, we have tried to optimally control the inverted pendulum by nonlinear equations. Here particle swarm optimization algorithm is used to refining parameters of PID controller The results of this simulation has been mentioned in the conclusion. The simulation is done using MATLAB. I. INTRODUCTION The pendulum is one of the benchmark problems of control theory for illustration and comparison of different control methodologies. The inverted pendulum is composed of a cart and a free moving pendulum. The popularity of this problem comes from the motivation of development of missiles, rockets, robots and other transportation means.Fig. 1 shows the general model of the inverted pendulum. The pendulum is composed of a free movingpendulum with the mass m and length l attached to the cart with mass M, where a force f is applied tothis setup. The following expressions give the differential equations of the inverted pendulum = (1) = (2)
Transcript of AN APPLICATION OF PARTICLE SWARM … 1st...AN APPLICATION OF PARTICLE SWARM OPTIMIZATION TO CONTROL...

International conference on Science, Technology and Management ICSTM-2015
YMCA, New Delhi (India), 1 Feb 2015 www.conferenceworld.in
546 | P a g e
AN APPLICATION OF PARTICLE SWARM
OPTIMIZATION TO CONTROL INVERTED
PENDULUM
Kunal Kumar1, Sumit Kumar Pandey
2
1.Department of Computer Science, St. Xavier’s College, Maharo Dumka (India)
2.Department of Electrical and Electronics Engineering,
Jharkhand Rai University Ranchi (India)
ABSTRACT
One of the most important problems today is robotics and its control, due to the vast application of inverted
pendulum in robots.In this paper, by using a combination of "PSO" Algorithms, we have tried to optimally
control the inverted pendulum by nonlinear equations. Here particle swarm optimization algorithm is used to
refining parameters of PID controller The results of this simulation has been mentioned in the conclusion. The
simulation is done using MATLAB.
I. INTRODUCTION
The pendulum is one of the benchmark problems of control theory for illustration and comparison of different
control methodologies. The inverted pendulum is composed of a cart and a free moving pendulum. The
popularity of this problem comes from the motivation of development of missiles, rockets, robots and other
transportation means.Fig. 1 shows the general model of the inverted pendulum. The pendulum is composed of a
free movingpendulum with the mass m and length l attached to the cart with mass M, where a force f is applied
tothis setup. The following expressions give the differential equations of the inverted pendulum
= (1)
= (2)
International conference on Science, Technology and Management ICSTM-2015
YMCA, New Delhi (India), 1 Feb 2015 www.conferenceworld.in
547 | P a g e
Equation1 and 2 represent the nonlinear mathematical model of the inverted pendulum. The rod angle at the
model can be changed under the influence of the environment. Thus, the control structure is needed to correct
the pole angle with applied the force f to the cart. In order to solve this problem, various control methodologies
(such as optimal control, linear/nonlinear control, intelligent and adaptive control methods) were previously
applied. Some of these control methods use the linearized model of the system. Hence, for such methods, the
performance of the controller is only valid around the operation point.
The paper is organized as follows. Next section deals with the PID control scheme followed by PSO technique.
Section 4 deals with the results obtained and last section consists of conclusion.
II. PID CONTROL SCHEME
The controller output of conventional PID controller is given as in eqn.(12)
u(t) = e(t) + ∫e(t).dt + (3)
where,
= Proportional gain
= Integral gain
= Derivative gain
By taking the Laplace transform the transfer function of PID controller is as below
G(s) = + /s + .s (4)
Equation (4) can also be estimated as following
+ s) (5)
where, is the integral time and is the derivative time.Here, r(t) is the reference input, u(t) is the control
force and α(t) is the output.
Fig.1

International conference on Science, Technology and Management ICSTM-2015
YMCA, New Delhi (India), 1 Feb 2015 www.conferenceworld.in
548 | P a g e
III. PARTICLE SWARM OPTIMIZATION TECHNIQUE
Particle swarm optimization is a heuristic evolutionary global optimization algorithm discovered by Doctor
Kennedy and Eberhart in 1995. In the basic particle swarm optimization algorithm, the swarm consists of n
particles, and the position of each particle stands for the potential solution in D-dimensional space. PSO is based
on the swarm intelligence concept, which is the property of a system. Basic swarm Intelligence based on some
fundamental principles such as proximity principle, stability principle, quality principle [9, 10].In proximity
principle it is considered that the space and time computation done by the population should be simple. Quality
principle depict that the population should respond to change in quality factor of the environment. Stability
principle describe that population should not change its behavior for the change in environmental condition. In
particle swarm optimization the term particles refers to population members which are mass-less and volume-
less and they are characterized by velocities and accelerations which are used to get the best result.
In PSO A particle represents a potential solution to a problem. Each particle is represented in a d (1, 2, 3,…., D)
dimensional space. Supposed the scale of swarm is N, the position of particle i can be represented as Xi = (xi1,
xi2, …,xiD). The best previous position which shows the minimum fitness value of any particle is recorded and
represented as Pi = (pi1, pi2, …,piD), this is called pbest. The best position among all particles in the population is
represented by the symbol g and known as gbest. The velocity of particle is defined as the distance of particle
movement in each iteration, described as Vi = (vi1, vi2, …, viD). The particles are updated according to the
following equations
(6)
(7)
where N is the number of particles in the group, d is the dimension, is the velocity of particle i , and is
the acceleration constant, rand() is the random number between 0 and 1, is the current position of particle i
, is the best previous position of the ith particle, pgdis the best particle among all the particles in the
population and n represents iteration. Eq.6 is used to calculate particle’s new velocityaccording to its previous
velocity and the distances of itscurrent position from its own best experience (position) andthe group’s best
experience. Then the particle flies toward anew position according to Eq.7.
IV. SIMULATION RESULT
The angle of the rod is controlled via the PID.Controller where the aim is to hold the rod at the upright position.
The model of the inverted pendulumwas given in the introduction section, and is used in the simulation
environment PID controller with PSO algorithmis applied to the system. Fig. 3 gives the change of the rod
angle, the inverse error and the output of the inverted pendulum. From the result ,it is observed that the
controller parameters are adjusted in 50 ms.

International conference on Science, Technology and Management ICSTM-2015
YMCA, New Delhi (India), 1 Feb 2015 www.conferenceworld.in
549 | P a g e
V. CONCLUSION
In this study, the novel particle swarm optimization algorithm (PSO) is developed, and applied tothe popular
engineering problem called inverted pendulum. The PID controller is designed by applyingPSO to the nonlinear
system model. At each iteration, the PID parameters are found off line then; the optimized controller is applied
to the system. The results show that a smooth response can beobtained.
REFERENCES
[1] J. Kennedy, R. Eberhart, Particle swarm optimization, Proc. IEEE Int. Conf. on Neural Networks,1942-1948,
1995.
[2] Y. Shi, R. C. Eberhart, A modi_ed particle swarm optimizer, Proc. IEEE International Conference on
Evolutionary Computation, 69 - 73, 1998.
[3] Y. Shi, R. C. Eberhart, Empirical study of particle swarm optimization, Proc. Congress of Evolutionary
Computing, 1945 - 1950, 1999.
[4] L.S. Coelho, V.C. Mariani, A novel chaotic particle swarm optimization approach using Henon map and
implicit _ltering local search for economic load dispatch, Chaos, Solitons and Fractals, Vol. 39,510-518, 2009.
[5] T. Xiang, X.Liao, K.W. Wang, An Improved Particle Swarm Optimization Combiined with PiecewiseLinear
Chaotic Map, Applied Mathematics and Computation, 1637-1645, 2007.
[6] L.S. Coelho, A novel quantum particle swarm optimizer with chaotic mutation operator, Chaos, Solitons and
Fractals, Vol. 37, 1409-1418, 2008.
[7] Y. Song,Z. Chen,Z. Yuan, New chaotic PSO-based Neural Netwrok Predictive Control for Nonlinear
Process, IEEE Transaction on Neural Networks, Vol. 18, No. 2, 595-601, 2007.
[8] C. Jiejin, M. Xiaoqian, L. Lixiang, P. Haipeng, Chaotic particle swarm optimization for echonnomic
dispatch considering the generator constraints, Energy Conversion and Management, Vol. 48, 645- 653, 2007.
[9] X.Y. Gao, L.Q. Sun, D.S. Sun, An enhanced particle swarm optimization algorithm, Information
Technology Journal, vol. 8, 1263-1268, 2009.
[10] J.M.T. Thompson, H.B. Stewart, Nonlinear Synamics and Chaos, John Wiley Sons, 2nd Edition, 2002.
Fig. 3
International conference on Science, Technology and Management ICSTM-2015
YMCA, New Delhi (India), 1 Feb 2015 www.conferenceworld.in
550 | P a g e
SELECTION OF GOOD QUALITY ANTIVIRUS
SOFTWARE
Sudhakar Singh1, P.K. Khare
2, Prashant Mor
3
1 Research Scholar, Department of Physics and Electronics, RDVV, Jabalpur (M.P.), India and
Associate Professor Department of Physics and Comp. Science , Sardar Patel College of Technology,
Balaghat (M.P.), (India)
2 Professor, Department of Physics and Electronics, RDVV, Jabalpur (M.P.), (India)
3 Scientific Officer, Department of Physics and Electronics, RDVV, Jabalpur (M.P.), (India)
ABSTRACT
Antivirus software is the most commonly used technical control for malware threats mitigation, for operating
systems and applications that are frequently targeted by malware. Antivirus software has become a necessity for
preventing incidents. According to past experience with virus infection cases, most of them are related to
operational practices when handling email or other IT security management issues. Antivirus products, Firewall
products and other utility program are designed to protect computer system from Internet threats like hackers,
viruses and worms by filtering out any suspicious communications sent to user computer. Current antivirus
software also contains firewall and other utility program to protect computer system from malware related
threats. Now in market there are many antivirus software available, therefore it is very important to know some
tested result and parameter which help in selection of good quality antivirus software.
Keywords: Antivirus software, Antivirus engine, Antivirus parameter, Malware threats, Firewall
I. INTRODUCTION
Antivirus software often abbreviated as AV, sometimes known as anti-malware software, is computer
software used to prevent, detect and remove malicious software. Today enterprise networks are
distributed to different geographical locations and applications are more centrally located. Every company‟s
data is most valuable asset and must be treated as such. With the ever growing number of malicious threats such
as Viruses, Spyware and Hackers, it has become mandatory to protect yourself against them. In order to prevent
such data looses many organization came forward and designed network security tools and antivirus packages.
Antivirus packages are mainly used to prevent and remove the viruses, Trojans, worms etc, where as firewalls
are used to monitor incoming and outgoing connections. Computers are used extensively to process the data and
to provide information for decision making therefore it is necessary to control its use. Due to organizational cost
of data loss, cost of incorrect decision making, and value of computer software hardware organizations suffer a
major loss therefore the integrity of data and information must be maintained. Antivirus packages are mainly
used to safeguard. A specific component of the Antivirus and antimalware software commonly referred as the

International conference on Science, Technology and Management ICSTM-2015
YMCA, New Delhi (India), 1 Feb 2015 www.conferenceworld.in
551 | P a g e
on-access or real time scanner, hooks deep into the operating systems core or kernel functions in a manner
similar to how certain malware itself would attempt to operate, though with the user's informed permission for
protecting the system. Any time the operating system accesses a file, the on-access scanner checks if the file is a
legitimate file or not. If the file is considered a malware by the scanner, the access operation will be stopped, the
file will be dealt by the scanner in pre-defined way i.e. how the Anti-virus program was configured during post
installation and the user will be notified. This may considerably slow down the operating system depending on
how well the scanner was programmed. The goal is to stop any operations the malware may attempt on the
system before they occur, including activities which might exploit bugs or trigger unexpected operating system
behavior. Anti malware programs can combat malware in two ways[1-3].
(i) They can provide real time protection against the installation of malware software on a computer. This type
of malware protection works the same way as that of antivirus protection in that the anti-malware software scans
incoming network data for malware and blocks any threats it comes across.
(ii) Anti-malware software programs can be used solely for detection and removal of malware software that has
already been installed onto a computer. This type of anti-malware software scans the contents of the Windows
registry, operating system files, and installed programs on a computer and will provide a list of any threats
found, allowing the user to choose which files to delete or keep or to compare this list to a list of known
malware components, removing files that match.
There are number of venders providing antivirus packages which are differ in various features such as
installation time, size, memory utilized, boot time, user interface launch time and full system scan time etc. We
study in this paper to those parameter which are used to measure the performance of most commonly used
antivirus products.
II. VARIOUS ANTIVIRUS ENGINE’S
The systems at highest risk are those that have internet access attached to their local retail network. Most viruses
arrive through email attachments, but they can also arrive by downloading files, browsing the internet or simply
using a diskette from home. More recently though, viruses have targeted Apple, Linux, handheld PDA,
computers and cell phones. One of the few solid theoretical results in the study of computer viruses is Frederick
B. Cohen's 1987 demonstration that there is no algorithm that can perfectly detect all possible viruses. However,
using different layer of defense, a good detection rate may be achieved. There are several methods which
antivirus engine can use to identify malware[3-4].
(i)Signature-based detection
It is the most common method. To identify viruses and other malware, the antivirus engine compares the
contents of a file to its database of known malware signatures.

International conference on Science, Technology and Management ICSTM-2015
YMCA, New Delhi (India), 1 Feb 2015 www.conferenceworld.in
552 | P a g e
(ii)Heuristic-based detection:
It is generally used together with signature-based detection. It detects malware based on characteristics typically
used in known malware code.
(iii)Behavioural-based detection
It is similar to heuristic-based detection and used also in Intrusion Detection System. The main difference is
that, instead of characteristics hardcoded in the malware code itself, it is based on the behavioural fingerprint of
the malware at run-time. Clearly, this technique is able to detect (known or unknown) malware only after they
have starting doing their malicious actions.
(iv)Sandbox detection
It is a particular Behavioural-based detection techniques that, instead of detecting the behavioural fingerprint at
run time, it executes the programs in a virtual environment, logging what actions the program performs.
Depending on the actions logged, the antivirus engine can determine if the program is malicious or not. If not,
then, the program is executed in the real environment. Albeit this technique has shown to be quite effective,
given its heaviness and slowness, it is rarely used in end-user antivirus solutions.
(v)Datamining techniques
It is one of the latest approach applied in malware detection. Data mining and machine learning algorithms are
used to try to classify the behaviour of a file as either malicious or benign given a series of file features, that are
extracted from the file itself.
(vi)Digital Immune System
The digital immune system is a comprehensive approach to virus protection developed by IBM. The motivation
for this development has been the rising threat of Internet based virus propagation. Traditionally, the virus threat
was characterized by the relatively slow spread of new viruses and new mutations. Antivirus software was
typically updated on a monthly basis and this has been sufficient to control the problem.
III. EVALUATION OF ANTIVIRUS ENGINE’S
When entering into an evaluation of antivirus engines the path to conclusive results requires patience and
knowledge. Figure 1 shows simple flow chart of virus detection and table 1 shows comparison of some
important virus detection methods according to their feature. Symbol √ means the method can support the
property or may affect on the property positively. Actually, symbol √ dedicates an advantage for the method,
while symbol X shows a weakness of the method. In scanning speed column, √ denotes that the method can
improve the scanning speed and reduce the time complexity. For example from the table it can be seen that
hashing techniques in first generation scanners can improve the scanning speed and supports complete
disinfection of the infected host, but it cannot used for detection of variants of a virus family or unknown viruses
or macro viruses. It has no effects on the false negative or false positive alarm, as well in comparison to simple

International conference on Science, Technology and Management ICSTM-2015
YMCA, New Delhi (India), 1 Feb 2015 www.conferenceworld.in
553 | P a g e
string signature scanning. Recently dynamic malware detection technology is mostly used in virus detection.
The design of the testing process and the test files used will directly influence the outcome. Some important key
point is given bellow[5-7].
(i) Use a mixture of new and old files and a mixture of bad and good files
(ii) Do not just compare “number detected” but rather divide the detected files into categories like garbage
/corrupted files, virus files and clean files in order to accurately compare detection rates of various engines
(iii) Consider turning off signature updates for a few days to a week, to test the engine‟s proactive capabilities
(iv) When using third party test results, it is important to understand how those results were achieved
(v) Besides testing virus detection levels, it is crucial to evaluate performance and/or system utilization,
since this has the largest impact on cost and overall satisfaction levels from the system
Fig. 1: Virus Detection Process
Table 1: Comparison of virus detection methods according to their feature

International conference on Science, Technology and Management ICSTM-2015
YMCA, New Delhi (India), 1 Feb 2015 www.conferenceworld.in
554 | P a g e
Scanner
Name
Subcategories Pro
mise
Perfect d
isinfectio
n
Sca
nn
ing
spee
d im
pro
vem
ent
Viru
s fam
ily d
etection
New
or u
nk
no
wn
Viru
ses detectio
n
En
cryp
ted/ p
oly
mo
rph
ic viru
ses
Meta
morp
hic
viru
ses
Ma
cro v
iruse
s
Fa
lse Po
sitive
Fa
lse Neg
ativ
e
First
generation
Scanners
[String
Signature
Scanning]
Simple scanning √ x x x x x x Low Low
Optimizing
Techniques
wildcard √ x √ x x x x Low Low
mismatch √ x √ x x x x Low Low
Generic
degree
√ x √ x x x x Low Low
Bookmark √ x x x x x x Very
low
low
Speed up
technique
Hashing √ √ x x x x x Low Low
Top and tail
scanning
√ √ x x x x x Low High
Entry
point/Fixed
point
√ √ x x x x x Low Low
Second
generation
scanning
Smart scanning √ √ √ x x √ √ Low Low
Skeleton detection √ x x x x x √ Low Low
Nearly exact identification √ x x x x x x Very
low
Very
low
Exact identification √ xx √ x x x x Zero Zero
Heuristic analysis x x √ √ x √ √ Very
high
Low
IV. VIRUS DEFENCE SOFTWARE
Common sense which are very useful for protecting computer system from virus infection given bellow.
(i) Keep your Internet browser up-to-date by „patching‟ it regularly. Most browser updates include new security
elements to meet newly identified virus threats. These updates can be obtained from Microsoft for Internet
Explorer and other browser can be updated from their website also.
(ii) Purchase virus defense software. You should identify your individual requirements depending on your
technical infrastructure, geographic spread and dependency on technology.
(iii) Suppliers offer many kinds of anti-virus program, some of which are downloadable from their web sites.

International conference on Science, Technology and Management ICSTM-2015
YMCA, New Delhi (India), 1 Feb 2015 www.conferenceworld.in
555 | P a g e
(iv) Use this software to scan e-mail attachments for viruses before you open them and also run an anti-virus
program that scans files as they are opened. This type of scanning should take place constantly, automatically
checking every file, programme or document each time it is opened or used. In network connected system
Gateway virus checking, Server virus checking , Workstation virus checking etc. Performed by antivirus
engine.
In present time various types of antivirus software are available. Some antivirus software support only
windows, Some Linux/Unix and some Mac, Some software are also available which support two or more than
two platforms. Table 2 shows list of Anti-virus Freeware, Table 3 shows list of Anti-virus Trialware, Table 4
shows Internet Security Suites Freeware which include anti-virus, firewall and other functions and Table 5
shows Internet Security Suites Trialware which include anti-virus, firewall and other functions[8-9].
Table 2: Anti-virus Freeware
Name Link Platforms
Windows Linux/Unix Mac Mobile
Android
Antivirus
https://play.google.com/store/ap
ps/details?id=and.anti Y (Support Android)
Zoner
Antivirus
http://www.zonerantivirus.com/ Y Y Y
(Support Android )
Symantec
iAnti Virus
http://www.iantivirus.com/produ
ct/
Y
Sophos
Antivirus
http://www.sophos.com/en-
us/products/free-tools.aspx
Y
Microsoft
Security
Essentials
http://www.microsoft.com/securi
ty_essentials/
Y
Kingsoft
AntiVirus
http://www.kingsoftsecurity.com
/
Y
Comodo
Antivirus
http://www.comodo.com/produc
ts/free-products.php
Y Y Y

International conference on Science, Technology and Management ICSTM-2015
YMCA, New Delhi (India), 1 Feb 2015 www.conferenceworld.in
556 | P a g e
Table 3: Anti-virus Trialware
Name Link Platforms
Windows Linux/Unix Mac Mobile
BitDefender
Antivirus Plus
http://www.bitdefender.com/Do
wnloads/
Y
F-Secure Anti-
Virus
http://www.f-
secure.com/en/web/home_global
/anti-virus
Y Y
G Data
AntiVirus
http://www.gdatasoftware.com/f
ree-trial.html
Y
McAfee
AntiVirus Plus
http://home.mcafee.com/store/an
tivirus-plus
Y
Panda Antivirus http://www.pandasecurity.com/h
omeusers/downloads/
Y Y
Symantec
Norton
AntiVirus
http://hk-
en.norton.com/downloads/
Y Y
Table 4: Internet Security Suites - Freeware (include anti-virus, firewall and other functions)
Name Link Platforms
Windows Linux/Unix Mac Mobile
Avast Free
Mobile Security
http://www.avast.com/free-
mobile-security Y (Support Android)
Avira Android
Security
http://www.avira.com/en/avira-
android-security
Y (Support Android)
BitDefender
Mobile Security
http://www.bitdefender.com/tool
box/freeapps/mobile/
Y (Support Android)
Checkpoint
ZoneAlarm Free
Antivirus +
Firewall
http://www.zonealarm.com/secu
rity/en-us/anti-virus-spyware-
free-download.htm
Y
Comodo
Internet
Security
http://www.comodo.com/produc
ts/free-products.php
Y
360
SecuritySafe
and MobileSafe
(Chinese
version)
http://www.360.cn/ Y Y
(Support Android,
iOS, Symbian
Table 5: Internet Security Suites – Trialware (include anti-virus, firewall and other functions)

International conference on Science, Technology and Management ICSTM-2015
YMCA, New Delhi (India), 1 Feb 2015 www.conferenceworld.in
557 | P a g e
Name Link Platforms
Windows Linux/Unix Mac Mobile
Panda Internet
Security
http://www.pandasecurity.com
/homeusers/solutions/internet-
security/
Y
Sophos Complete
Security Suite
http://www.sophos.com/en-
us/products/complete/complete
-security-suite.aspx
Y Y Y
Symantec Norton
Internet Security
http://us.norton.com/download
s Y Y
Kaspersky Internet
Security
http://www.kaspersky.com/tria
ls Y Y Y
(Support Android )
F-Secure Internet
Security, Mobile
Security
http://www.f-
secure.com/en/web/home_glob
al/support/installers
Y Y
(Support Android,
Symbian )
BitDefender
Sphere
http://www.bitdefender.com/D
ownloads/ Y Y Y
(Support Android)
AVG Internet
Security
http://www.avg.com/ww-
en/internet-security Y
avast! Internet
Security
http://www.avast.com/downlo
ad-software Y
McAfee Internet
Security, Mobile
Security
http://home.mcafee.com/store/
free-antivirus-trials Y Y
(Support Android,
Blackberry, Symbian
V. ANTIVIRUS SOFTWARE PERFORMANCE MEASUREMENT PARAMETER
Antivirus products are categorized into three parts such as Internet Security [IS], Total Security [TS] and
Antivirus [AV]. Antivirus products are the products, which are primarily focused on detecting and remediation
viruses and Spyware. Internet Security product provides all the virus and Spyware removal features of an
antivirus (AV) as well as additional functions to provide greater Internet protection. These features may include
protection against phishing, root kit detection, firewalls and scanning of web pages and HTTP data. Total
Security products provide data migration and backup features on top of all security features common to internet
security (IS) products. For the test performance of antivirus software following parameters were used [10-11].
1. Installation Size [INS].
2. Installation Time [INT].
3. Boot Time [BT].
4. Scan Time [ST].
5. User Interface Launch Time [UILT].
6. Memory Usage During System Idle [MUDSI].
7. Browse Time [BwT].
8. File Copy, Move and Delete [FCMD].

International conference on Science, Technology and Management ICSTM-2015
YMCA, New Delhi (India), 1 Feb 2015 www.conferenceworld.in
558 | P a g e
(i) Installation Size
A products Installation Size was previously defined as the difference between the initial snapshot of the Disk
Space (C: drive) before installation and the subsequent snapshot taken after the product is installed on the
system. Although this is a widely used methodology, we noticed that the results it yielded were not always
reproducible in Vista due to random operating system operations that may take place between the two snapshots.
We improved the Installation Size methodology by removing as many Operating System and disk space
variables as possible. This metric aims to measure a product‟s total installation size. This metric is defined as the
total disk space consumed by all new files added during a product's installation
(ii) Installation Time
This test measures the minimum installation time a product requires to be fully functional and ready for use by
the end user. Installation time can usually be divided in three major phases . The speed and ease of the
installation process will strongly influence the user‟s first impression of the antivirus software. This test
measures the minimum installation time required by the antivirus software to be fully functional and ready for
use by the end user. Lower installation times represent antivirus products which are quicker for a user to install.
(iii) Boot Time
This metric measures the amount of time taken for the machine to boot into the operating system. Security
software is generally launched at Windows startup, adding an additional amount of time and delaying the startup
of the operating system. Shorter boot times indicate that the application has had less impact on the normal
operation of the machine.
(iv) Scan Time
Scan Time is the time it took for each product to scan a set of sample files. The sample used was identical in all
cases and contained a mixture of system files and Office files. All antivirus solutions have functionality
designed to detect viruses and various other forms of malware by scanning files on the system. This metric
measured the amount of time required to scan a set of clean files.
(v) User Interface Launch Speed
This metric provides an objective indication as to how responsive a security product appears to the user, by
measuring the amount of time it takes for the user interface of the antivirus software to launch from Windows.
To allow for caching effects by the operating system, both the initial launch time and the subsequent launch
times were measured. Our final result is an average of these two measurements.
(vi) Memory Usage During System Idle
This metric measures the amount of memory (RAM) used by the product while the machine and antivirus
software are in an idle state. The total memory usage was calculated by identifying all antivirus software
processes and the amount of memory used by each process. The amount of memory used while the machine is
idle provides a good indication of the amount of system resources being consumed by the antivirus software on
a permanent basis. Better performing products occupy less memory while the machine is idle.

International conference on Science, Technology and Management ICSTM-2015
YMCA, New Delhi (India), 1 Feb 2015 www.conferenceworld.in
559 | P a g e
(vii) Browse Time
This metric measures the time taken to browse a set of popular internet sites to consecutively load from a local
server in a user‟s browser window.
(viii) File Copy, Move and Delete
This test measures the amount of time required for the system to copy, move and delete samples of files in
various file formats.
VI. RESULTS AND DISCUSSION
On the basic of parameter, Performance of Internet security products and Antivirus software are given bellow.
(i) Products with lower boot times are considered better performing products.
(ii) Products with lower scan times are considered better performing products.
(iii) Products with lower User Interface launch times are considered better performing products.
(iv Products with lower memory usage during system idle (usage of RAM) are considered better performing
products.
(v) Products with lower browse times are considered better performing Products.
(vi) Products with lower Internet explorer launch times are considered better performing products..
(vii) Products with lower installation times are considered better performing Products.
(viii) Products with lower installation sizes are considered better performing Products.
The one of most important parameter of antivirus, which is commonly known as the detection rate. The second
is to know under which circumstances the software is able to see the virus. Can it see viruses if they come
through a network share, via email or if they are already running in memory. There are three things you could
do and should not do to get the assurance that your anti-virus software is indeed reliable. First user could be
tempted to test the anti-virus yourself, to go on the net looking for virus libraries and throw them at the anti-
virus. I would strongly discourage you from doing so, even if some vendors include such a methodology in their
white papers. As EICAR (European Institute for Computer Ant-Virus Research) states: “Using real viruses for
testing in the real world is rather like setting fire to the dustbin in your office to see whether the smoke detector
is working”, You are not a virus expert and you never know what can happen. What if the anti-virus does not
catch them all and they start deleting data on your hard drive or start spreading in your enterprise. That could
cost you your job. Anti-virus experts themselves take all the precaution when dealing with viruses, ensuring, for
example, that all infected media they handle are destroyed after being reviewed. Second, if you really want to
know that the anti-virus is doing something, you can download at www.eicar.org a safe anti-virus test string.
Most anti-virus software will detect the eicar file as being infected. That is a secure way to check the anti-virus
ability to see viruses under different circumstances[12-13].
Finally, we can rely on external sources to verify the anti-virus detection rates. In order to understand what
detection rates really mean, you need to know the difference between viruses in the wild and viruses In-The-
Zoo. The In-The-Zoo viruses are lab viruses that have not been encountered in the real world. The In-The-Wild

International conference on Science, Technology and Management ICSTM-2015
YMCA, New Delhi (India), 1 Feb 2015 www.conferenceworld.in
560 | P a g e
viruses are viruses that have been infecting computers worldwide. A list of the In-The-Wild viruses is kept by
the WildList Organization International and can be found at www.wildlist.org.
(i) The Virus Bulletin at www.virusbtn.com , for example, awards a 100% logo to products that pass their
testing. It consists of testing anti-virus on-demand and real-time scanners against the list of the viruses found in
the wild. The products able to detect a 100% of the in-the-Wild list are awarded.
(ii) The West Coast Lab offers two levels of checkmarks for anti-virus products. Vendors have to pay to
have their products tested. The first level is passed if the product detects 100% of the virus listed in the
WildList. To obtain the level 2 checkmark, the anti-virus has to pass level 1 and has to be able to repair all
reparable viruses of the WildList without altering the system stability. The checkmarks can be found at
www.check-mark.com/cgi-bin/redirect.pl. The West Coast Lab also provides test results for anti-virus software
ability to catch Trojan horses.
(iii) The ICSA (International Computer Security Association), division of TrueSecure, offer certification for
On-Demand/On-Access anti-virus products, anti-virus products cleaning, anti-virus product for Internet
Gateway E-mail, anti-virus products for Microsoft Exchange and Lotus Notes, anti-virus products for Security
Service Providers, Internet Service Providers and anti-virus scanners. Anti-virus vendors also have to pay a fee
to have their products tested. To be certified an On-Access or Real-Time scanner, for example, has to detect
100% of the viruses listed in the current In-The-Wild List, detect 100% of the viruses listed in the ICSA Labs
Common Infectors Test Suite, detect 90% of macro viruses in the ICSA Labs Virus Collection and not cause
false positives. An exhaustive list of the certification criteria for each type of anti-virus product can be found
at:www.icsalabs.com/html /communities/antivirus/certification.shtml. A list of all testing results can be found
at: www.icsalabs. com /html /communities/antivirus/index.shtml.
VII. CONCLUSIONS
As a member of the IT community, user face challenges every day in keeping servers and workstations up and
running. These challenges are complicated by the demands of an increasingly complex IT environment, limited
IT resources and often the requirements of a service level agreement as well. Yet the failure to meet these
challenges can result in decreased IT credibility, unanticipated organizational changes, outsourcing of IT
functions and diminished resource allocations all of which make it even harder for you to provide excellent
service in the future. Computer viruses are among the most frustrating challenges faced by IT organizations
today. They rob workers of productivity, divert IT personnel from more strategic corporate concerns and can
even jeopardize company‟s information security. Yet there is no way which can keep every virus out of your
company‟s computers. Employees unthinkingly launch executable email attachments that contain them.
Newsreader programs pick up viruses attached to Usenet postings. Traveling employees bring them in on
laptops after visits to customer sites.
Different tools are good at tackling different malware related threads or problems. Some are better at one or two
than others. Some have better overall detection records than others and some are faster than others. There is no
best unique anti-virus product. The choice of anti-virus solution should depend on user needs, user environment

International conference on Science, Technology and Management ICSTM-2015
YMCA, New Delhi (India), 1 Feb 2015 www.conferenceworld.in
561 | P a g e
and user goals. Vendor information is always useful, but it is not wise to rely solely on them. In order to make
the right choice of antivirus products, user should see yourself, look vendor information and see tested result
released by different security company as well as other alternative sources.
REFERENCES
[1] OUCH, “Understanding Anti-Virus Software”, Newsletter, March 2011
[2] Singh Brijendra., “Network Security and Management”, Prentice Hall of India Private Limited, New
Delhi- 110001, Published in 2007.
[3] Stalling, William., “Network Security Essentials application and standards”, Third Edition, Pearson
Prentice Hall, Published in 2008
[4] http://en.wikipedia.org/Antivirus_software
[5] Anti-virus Product Evaluation Criteria, www.emory.edu/ITD/DESKNET/AV/criteria.htm
[6] SANS, “OUCH Monthly Security Awareness”, News Letter, March 2011
[7] Umakant Mishra, “An Introduction to Virus Scanners”, Available on http://www.trizsite.tk
[8] Peter Szor, “The Art of Computer Virus Research and Defense”, Addison Wesley Professional, edition
First, February 2005.
[9] ICSA, http://www.icsalabs.com/html/communities/antivirus/index.shtml.
[10] www.passmark.com, Access on Oct. 2014.
[11] Gordon Sarah, “A Short Course in Antivirus Software Testing”, White Paper, Available on
www.symantec.com; Access on Nov. 2014.
[12] www.virusbtn.com, Access on Dec. 2014
[13] www.icsalabs. com /html /communities/antivirus/index.shtml. , Access on Dec. 2014

International conference on Science, Technology and Management ICSTM-2015
YMCA, New Delhi (India), 1 Feb 2015 www.conferenceworld.in
562 | P a g e
THE OUTPUT VOLTAGE QUALITY OF THREE
PHASE MULTILEVEL INVERTERS CONSIDERING
COGENERATION SYSTEMS
S.Narasimha 1 , M.Sushama
2
1Research scholar, JNTUH College of Engineering Hyderabad, Department of E.E.E, (India)
2Profesor, JNTUH College of Engineering Hyderabad, Department of E.E.E, Hyderabad, (India)
ABSRACT
In This paper solar, wind and fuel cells based stand alone cogeneration systems are presented for remote area
utilities applications. The solar, wind and fuel cells based co generation system output voltages are not constant
or stable in always. The generated output voltages are directly connected to the loads or utilities without battery
bank or energy storage devices. A PI-control method was proposed in this paper such that the output voltage of
converter circuit is constant even though input voltages are fluctuation conditions. A three phase three level,
five level inverter with 3kw,5kw static load and dynamic load was examined to validate for proposed work in
MATLAB environment.
Keywords: Closed Loop Feedback Control; Cogeneration Systems; Voltage Fluctuations; PI-
Control; SPWM.
I INTRODUCTION
As one solution for the problem of environmental worsening and energy shortage, co-generation system using
natural energy and fuel cell widely increasing. The electric power generated from these systems is converted to
AC voltage by the inverter, after it is stored as DC electric power in the battery. In case of the system of power
generation using natural energy and fuel cell, comparatively large fluctuation is generated at the DC voltage [4].
As this counter measure, improvement of voltage utilization factor by the superposition of the third harmonic
wave was applied to absorb this voltage fluctuations [8]. The feed back control of output voltage was applied for
the stabilization of output voltage. In addition, the output voltage in the ideal modulation without the distortion
was obtained by controlling superposition ratio of third harmonic wave with the fluctuation of DC voltage. As a
circuit converted into AC power from DC power, the multilevel inverter circuit was applied considering the
reduction in switching component and capacity an expansion. The multilevel inverter is possible to reduce lower
harmonic wave and switching component by outputting many voltage levels [9]. It is possible to output
stabilizing AC voltage by the absorption of the fluctuation of DC voltage. And it will be possible to reduce the
capacity of the DC capacitor [4][5].
In an effort to improve efficiency and voltage quality, a simple control method for improving the voltage
utilization factor of multilevel inverter[9]. In this paper a control method which introduced the control of
superposition ratio of third harmonic wave into output voltage feedback control and improvement on voltage
utilization factor is proposed. It is applied to the multilevel inverter, and the operation principle and features are
explained. Block diagram of co-generation systems is an explained in Fig2. Which including Solar, Wind and
International conference on Science, Technology and Management ICSTM-2015
YMCA, New Delhi (India), 1 Feb 2015 www.conferenceworld.in
563 | P a g e
fuel cells system .The fluctuated inputs are converted to stable output by using Multilevel inverter. By
simulation the validity of proposed control has been confirmed.
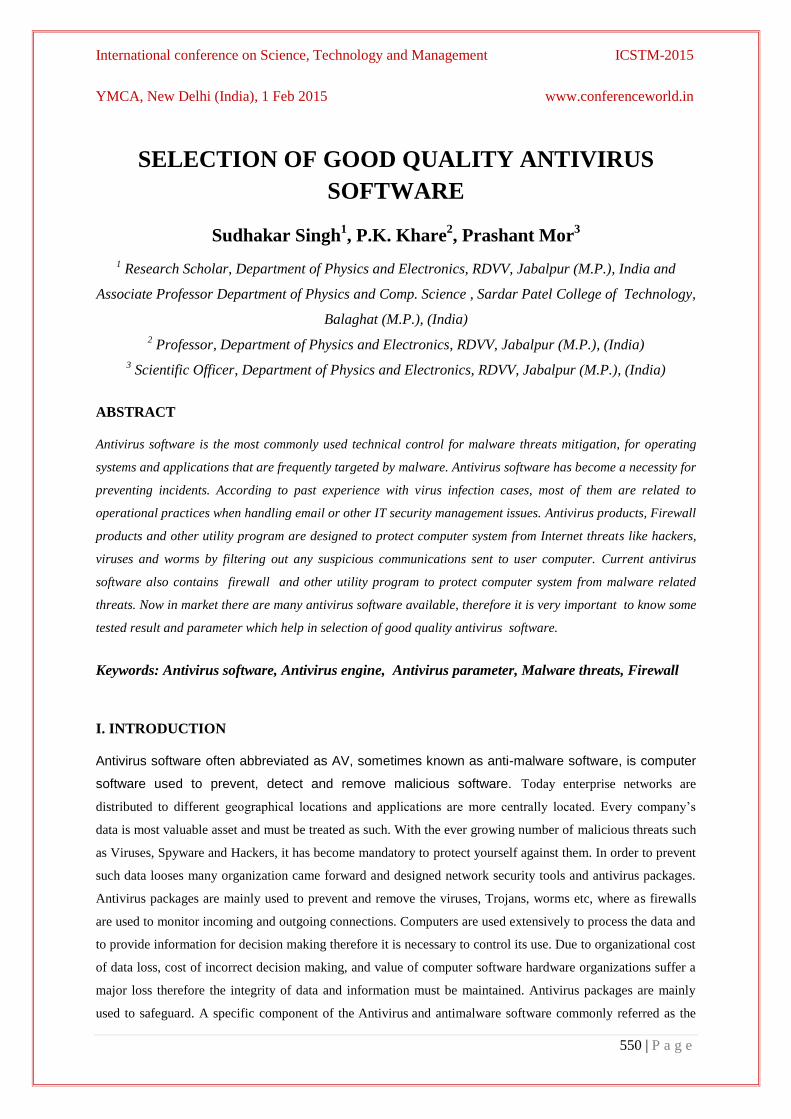
II. CIRCUIT CONFIGURATION
The circuit configuration is shown in Fig. 1.This circuit is an ordinary three-phase 5level inverter composed of
12 IGBTs, 6 diodes, and 2 DC sources. With E denoting the voltage of one DC source, the output provides five
levels of line voltage, namely ±2E, ±E, 0. In addition, pulse width modulation is applied in order to reduce
harmonic components. With more voltage levels, the content of switching components is reduced, and the
generation of harmful harmonics is suppressed [8].
Fig. 1 Circuit Configuration. Fig.2 Block Diagram of Co-Generation System Integration
III. CONTROL METHOD
In the proposed control method, the basic PWM control block used conventionally for multilevel inverters is
supplemented by output voltage feedback and improvement of the voltage utilization factor.
Assuming the use of a general-purpose digital control system, we aimed at the minimizing individual phase
control in order to simplify control processing. A block diagram of the proposed control method is shown in Fig.
2, and detailed explanations are given below.
3.1 Output voltage tracking control
Two phase output line voltages VRY and VBR are taken into the Simulation the following can be obtained from
the fundamental equations for a three-phase three-wire system, and from the relationship between the line
voltages and phase voltages:
VRY+VYB+VBR =0
VRY = VBN- VYN
VYB =VYN -VBN
VBR= VBN -VRN ……………………..(1)
Therefore,
VBN = 1/3(VRY- VBR)

International conference on Science, Technology and Management ICSTM-2015
YMCA, New Delhi (India), 1 Feb 2015 www.conferenceworld.in
564 | P a g e
VYN =1/3(VYB- VRY)
VBN =1/3 (VBR- VYB)……………..(2)
Three phase voltages VRN,VYN and VBN are converted into two-phase AC voltages V and V by using the
following:
=
…………………..(3)
Now the magnitude Vout of the resultant output vector is calculated as follows:
………… (4)
The magnitude Vout corresponds to the effective value of the output line voltage, which is a DC value in the
case of a three-phase balanced voltage without fluctuation. Therefore, tracking control of the output voltage can
be implemented by maintaining this value at a stable level [8].
The difference between the output voltage references V*out and the resultant vector magnitude Vout is given to
the proportional integrator, and the DC voltage compensation on Vpi is calculated. A coefficient related to the
superposition ratio α is applied to this value, and then a sinusoidal reference is obtained by multiplying by a
three-phase sine Wave with amplitude of one[7][8].
The advantage of this system is obtaining the fixed control characteristic, when the AC voltage of any frequency
is output, because the signal input to the proportional integrator is the instant DC voltage which does not depend
on the frequency of the output
Voltage. That is, the method can be applied to variable speed drive of electric motors and to other cases when a
variable-frequency source is required.
IV. PWM CONTROL
As shown in Fig 2, after output voltage tracking and Improvement of the voltage utilization factor, the three
phase signals V*R V*Y, and V*B are compared to two triangular carrier waves with positive and negative offsets.
The PWM signals thus generated are passed through control circuit. Then fed to control switches as gate signals
[5].
4.1. Sine + 3rd
Harmonic PWM Technique
The idea of Sine+3rd
harmonic modulation technique is based on the fact that the 3-phase inverter-bridge feeding
a 3-phase ac load does not provide a path for zero-sequence component of load current. Only three output points
are brought out from a three-phase inverter-bridge. These output points are connected to the three supply
terminals of the load. Such an arrangement does not cause any confusion for the delta connected load but for a
star connected load the neutral point remains floating. However for a balanced, three-phase, star-connected load
this should not be a drawback as the fundamental component in the load phase voltage is identical to the
fundamental component of inverter’s pole voltage[6]. In fact, the floating neutral point has the advantage that no
zero sequence current (which includes dc, third and integer multiples of third harmonics) will be able to flow
through the load and hence even if the pole voltage is distorted by, say, 3rd
and integral multiples of third
International conference on Science, Technology and Management ICSTM-2015
YMCA, New Delhi (India), 1 Feb 2015 www.conferenceworld.in
565 | P a g e
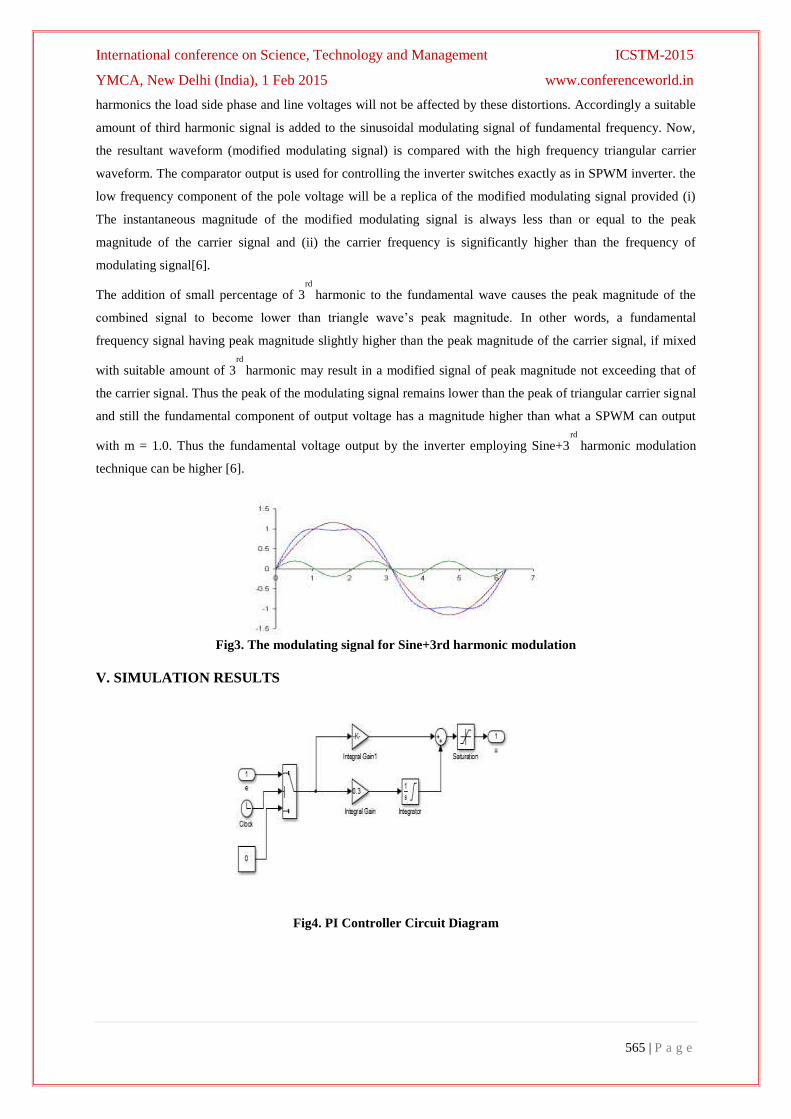
harmonics the load side phase and line voltages will not be affected by these distortions. Accordingly a suitable
amount of third harmonic signal is added to the sinusoidal modulating signal of fundamental frequency. Now,
the resultant waveform (modified modulating signal) is compared with the high frequency triangular carrier
waveform. The comparator output is used for controlling the inverter switches exactly as in SPWM inverter. the
low frequency component of the pole voltage will be a replica of the modified modulating signal provided (i)
The instantaneous magnitude of the modified modulating signal is always less than or equal to the peak
magnitude of the carrier signal and (ii) the carrier frequency is significantly higher than the frequency of
modulating signal[6].
The addition of small percentage of 3rd
harmonic to the fundamental wave causes the peak magnitude of the
combined signal to become lower than triangle wave’s peak magnitude. In other words, a fundamental
frequency signal having peak magnitude slightly higher than the peak magnitude of the carrier signal, if mixed
with suitable amount of 3rd
harmonic may result in a modified signal of peak magnitude not exceeding that of
the carrier signal. Thus the peak of the modulating signal remains lower than the peak of triangular carrier signal
and still the fundamental component of output voltage has a magnitude higher than what a SPWM can output
with m = 1.0. Thus the fundamental voltage output by the inverter employing Sine+3rd
harmonic modulation
technique can be higher [6].
Fig3. The modulating signal for Sine+3rd harmonic modulation
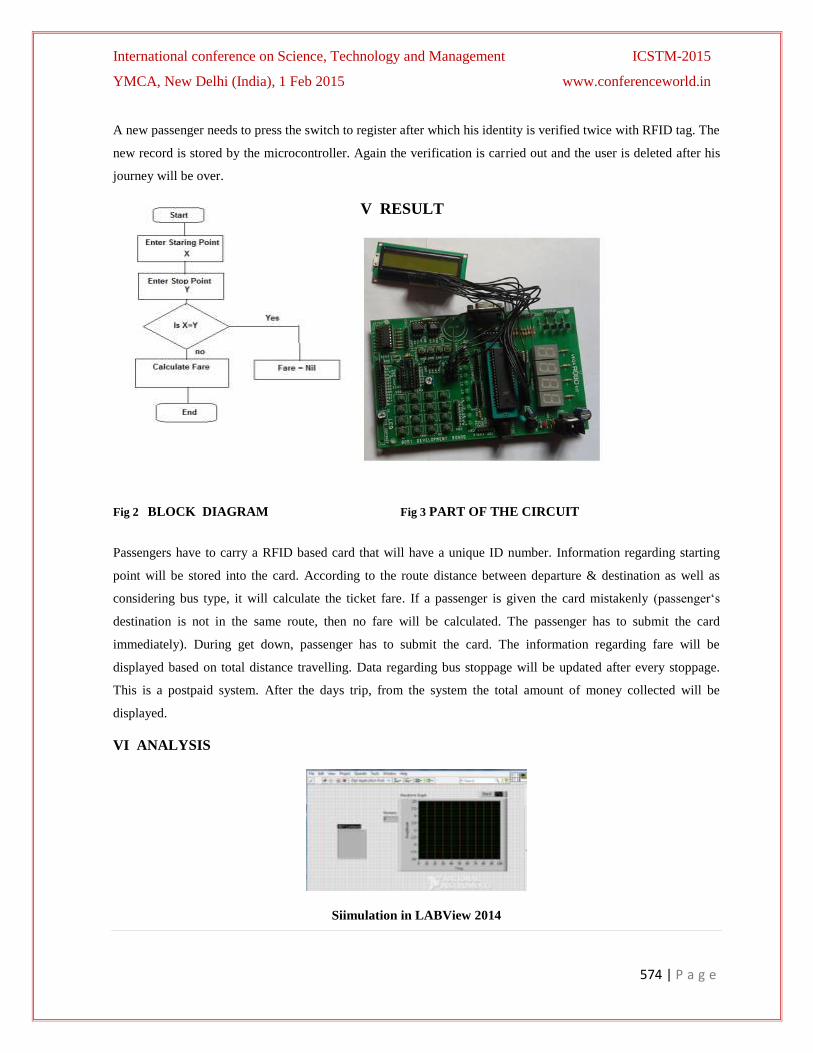
V. SIMULATION RESULTS
Fig4. PI Controller Circuit Diagram

International conference on Science, Technology and Management ICSTM-2015
YMCA, New Delhi (India), 1 Feb 2015 www.conferenceworld.in
566 | P a g e
Fig5. Sinusoidal PWM with (sine plus3rd harmonic injection)
Fig6.(a) Input DC voltage with 8% voltage fluctuation, (b)Superposition wave (c)Stable output voltage
(586.89V) .
From Fig6, (a) it show that voltage fluctuation of ±8% on peak magnitude, up to 0.35sec the DC voltage of more
than the rated value. From scale0.35sec to0.4 sec the DC voltage decreased to below value of rated. After the
scale 0.4sec to 0.45sedec the input DC voltage has decreased up to 8% less value than rated value. In fig6
(b)show the superposition wave(pu), its value up 0.35sec has constant magnitude after the scale from 0.4 to 0.45
sec superposition wave magnitude increase to such that the output voltage maintained constant magnitude. By
using spwm method the results are supported to validate the proposed work.

International conference on Science, Technology and Management ICSTM-2015
YMCA, New Delhi (India), 1 Feb 2015 www.conferenceworld.in
567 | P a g e
Fig7. 3level inverter (a) Input DC voltage with 10% voltage fluctuation, (b) Superposition wave (c) output
voltage (Vrms) with 3kw load static load.
Fig8. 3level inverter (a) Input DC voltage with 10% voltage fluctuation, (b) Superposition wave (c) output
voltage (Vrms) with 5kw static load.
From fig7&8, results are observed that the constant output voltages (Vrms),Even though input DC voltages are
10% fluctuation condition with static resistance load of 3kw and 5kw was an examined for three level inverter.
Fig : 9 Fig : 10 Fig9. 5 Level Inverter

International conference on Science, Technology and Management ICSTM-2015
YMCA, New Delhi (India), 1 Feb 2015 www.conferenceworld.in
568 | P a g e
(a) Input DC voltage with 10% voltage fluctuation,(b) Superposition wave (c) output voltage (Vrms) With 3kw load
static load
Fig10. 5 Level Inverter
(a) Input DC voltage with 14% voltage fluctuation, (b) Superposition wave (c) output voltage (Vrms) with 5kw load
static load
From fig9&10, results are observed that the constant output voltages (Vrms),Even though input DC voltages are
14% fluctuation condition with static resistance load of 3kw and 5kw was an examined for five level inverter. In
fig10(c) the output voltages is maintained constant magnitude with input DC voltages are 13% to 14%
fluctuation condition with static resistance load, from fig9&10 (c) we analysis that by using PI control technique
with spwm the obtained results are supported to up 13% to 14% input DC voltage fluctuation conditions, after
scale 0.4sec the output voltages is not maintained constant and fluctuation conditions.
In the fig 11. Simulation Results are an analyzed that the time scale up to 0.3sec, an Induction motor rotor speed
is constant and fluctuating nature for 5.4h.p induction motor load. After 0.3sec the motor speed is maintained
constant as shown in fig11(b) and fig(c) respectively, the results are an examined that the output voltage Vrms
is maintained constant. Table1, shows the validated result in this paper.
Fig11 .3level inverter (a) Input DC voltage with 10% voltage fluctuation, (b) Rotor speed of an
asynchronous induction motor (c) output voltage (Vrms) with Dynamic load.
Table :1

International conference on Science, Technology and Management ICSTM-2015
YMCA, New Delhi (India), 1 Feb 2015 www.conferenceworld.in
569 | P a g e
Fig 12.Static (Resistive) Load Parameters Fig13.Dynamic Load Parameters
VI CONCLUSIONS
In this paper, the proportional Integral (PI) control method which combined the improvement on voltage
utilization factor through the superposition of third harmonic wave with voltage feedback control was proposed
with validated results for static and dynamic load conditions, and it was applied to the three levels and five level
inverters. Features of this control are to control the superposition ratio with the high amount fluctuation of the
DC voltage. The improvement in the control performance is considered, and reduction of the capacity of the
common-mode filter and electrolytic capacitor -less of the DC link for nonlinear loads will be examined. In this
paper we confirmed the absorption of DC voltage fluctuations of about 14% was examined, 3,5Level cascade
connection multilevel inverters with SPWM and static load conditions and 5HP dynamic load. In the future, we
intend to focus on further reduction of output voltage distortion and improvement of the voltage control
characteristics for dynamic loads.
REFERENCES
[1] E. Najafi, Yatim, and A.H.M , “Design and Implementation of a New Multilevel Inverter Topology” IEEE
Transactions on Industry Electronics, vol. 59, no.11, pp. 4148-4154, Nov 2012.
[2] Amei K, Maeda T, Ohji T, Sakui M. “Method for reducing of high frequency component in the single
phase PWM inverter by the multilevel”. Joint Technical Meeting on Semiconductor Power Converter and
Industry Electric Application IEE Japan, SPC-03, No. 95, p 41–46, 2003.
[3] M. Malinowski , k. Gopakumar , j. Rodriguez and m. A. Pérez "a survey on cascaded multilevel
inverters", ieee trans. Ind. Electron., vol. 57, no. 7, pp.2197 -2206, 2010.
[4] Imai K. Power electronics hand book. NTS Co. Ltd.; 2002. p 533–535.
[5] A.M. Almaktoof, A.K. Raji, and M.T.E. Kahn “Robust current control technique for variable DC-link
Voltage Source Inverters for Renewable Energy Systems,” IEEE Industrial and commercial use of
energy(ICUE)no. 2, pp. 1–8, August. 2014.

International conference on Science, Technology and Management ICSTM-2015
YMCA, New Delhi (India), 1 Feb 2015 www.conferenceworld.in
570 | P a g e
[6] Version 2 EE IIT, Kharagpur “ DC to AC converters” Module5
[7] Yaow-Ming Chen, Yuan-Ming Cheng “Modified PWM control for the DC-AC inverter with a non-
constant voltage source,” IEEE Trans. Power Electronics and Drive system , vol. 2, pp.938–941, Jul 1999.
[8] Amei, K.; Tanizaki, Y.; Ohji, T.; Sakui, M.
“A Control Method of Superposition Ratio in the Improvement of Voltage Utilization Factor in Three
phase Multilevel Inverter considering the DC Voltage Fluctuation” Power Conversion Conference -
Nagoya, 2007.7Publication Year: 2007 , Page(s):37 – 142
[9] Maruyama T, Asaeda T, Ikeda K. “Multilevel inverter”. 1992 Annual Meeting Record IEE Japan, No. S8-4.
About the Authors
Mr.S.Narasimha born on 10th Aug 1979, obtained B.Tech degree in 2003 and M.Tech degree in
2009 with a specialization in Power Electronics & Industrial Drives from JNTUHCEH, INDIA.
Research Scholar in Dept of E.E.E, JNTU Hyderabad. His interests include Power Quality issue in
co-generation systems.
Dr.M.Sushama, born on 8th Feb 1973, .Obtained her B.Tech degree in 1993 and M.Tech degree in
2003 with a specialization in Electrical Power Systems from JNTU, INDIA. She obtained her Ph.D.
from JNTU Hyderabad, India in 2009 in the area of “Power Quality” using Wavelet Transforms
Presently she is working as Professor in the Department of E.E.E, JNTUH College of Engineering,
Kukatpally, Hyderabad.

International conference on Science, Technology and Management ICSTM-2015
YMCA, New Delhi (India), 1 Feb 2015 www.conferenceworld.in
571 | P a g e
RFID BASED AUTOMATED LOW COST DATA
ACQUISITION SYSTEM FORPUBLIC TRANSPORT
Anirban Patra1, Dr. Arijit Saha
2
1.Assistant Professor, ECE Dept., JIS College of Engineering, Kalyani, West Bengal (India)
2.Associate Professor, ECE Dept. ,B P Poddar Institute of Management &Technology, Kolkata (India)
ABSTRACT
In public transport system, particularly in bus collecting ticket is really a problematic issue. Transport Company
has to employ one or two personnel for this purpose. They have to knock everybody for this purpose. It is very
common practice for few people to travel without ticket or do not give proper fare. Sometimes there is a rough
argument during the journey regarding fare. Also bus personnel have to monitor whether a person has purchased
ticket or not. Again having no government authority to take control or keep an eye over the whole scenario, the
private sectors are creating a monopoly, taking control over the public transport and autocratic raise in bus fare.
To overcome this problem, RFID technology can be used. RFID technology has long been recognized as an
efficient method for identifying a single entity. RFID technology also provides for greater security in the system.
The ticketing systems using RFID can be merged to solve the above mentioned problems.
This paper actually suggests a much more public friendly, automated system of ticketing with the use of RFID
based tickets. This system is suitable for megacities like Kolkata where a large no of customers avail public
transport system daily.
Keywords : RFID Reader, 8051 Microcontroller and Display Unit
I INTRODUCTION
Radio Frequency Identification (RFID) systems use radio frequency to automatically identify products. TheRFID
system contains two parts, Reader and Tag. Ticket friend solution mainly proposed to overcome theproblems in
traditional ticketing method liketransferring tickets from one person to anotherto avoid confrontation.This system
introduces RFID technology.RFID technology has long been recognized as an efficient method for identifying a
single entity. RFID technology also provides for greater security in the system. The ticketing systems using RFID
can be merged to solve the above mentioned problems. Automated Fare calculation for Public transport system is
an Economic and Management Approach for Transit system. This provides a wealth of resourceful information to
everyone with interest in mass transit. All the conventional systems are prepaid system. Another disadvantage is

International conference on Science, Technology and Management ICSTM-2015
YMCA, New Delhi (India), 1 Feb 2015 www.conferenceworld.in
572 | P a g e
that the passenger has to carry a smart card and there is no scope of recharge at the bus. This system is postpaid
system. So if anybody forgets to bring the card, he can ride the bus easily.
II. RFID SYSTEMFUNDAMENTALS
Basically, an RFID system consists of an antenna or coil, a transceiver (with decoder) and atransponder (RF tag)
electronically programmed with unique information. There are many different types of RFID systems in the
market. These are categorized on the basis of their frequency ranges. Some of the most commonly used RFID kits
are low-frequency (30-500kHz), mid-frequency (900kHz-1500MHz) and high-frequency (2.4- 2.5GHz).
2.1 RFID Antenna
The antennaemits radio signals toactivate the tag and read/write data from/to it. It isthe conduit between thetag
and the transceiver,which controls the system‘sdata acquisition and communication.Theelectromagnetic field
produced bythe antenna can be constantly presentwhen multiple tags are expected continually.If constant
interrogation is notrequired, a sensor device can activatethe field.The readeremits radio waves in the range of
2.5cm to 30 meters or more, dependingupon its power output and the radio frequency used. When an RFID
tagpasses through the electromagneticzone, it detects the reader‘s activationsignal. The reader decodes the
dataencoded in the tag‘s integrated circuit(silicon chip) and communicates to thehost computer for processing.
2.2 RFID Tag
It comprises a microchip containingidentifying information about theitem and an antenna that transmitsthis data
wirelessly to the reader. Atits most basic, the chip contains a serializedidentifier or license plate numberthat
uniquely identifies that item(similar to bar codes). A key difference,however, is that RFID tags havea higher data
capacity than their barcode counterparts. This increases theoptions for the type of information thatcan be encoded
on the tag; it may includethe manufacturer‘s name, batchor lot number, weight, ownership,destination and history
(such as thetemperature range to which an itemhas been exposed). In fact, an unlimitedlist of other types of
informationcan be stored on RFID tags, dependingon the application‘s requirements.RFID tag can be placed on
individualitems, cases or pallets for identificationpurposes, as well as fixed assetssuch as trailers, containers and
totes.
2.3. Electronic product code (EPC) Tags :
EPC is an emerging specification for RFID tags, readers and business applications. It represents a specific approach to item
identification, including an emerging standard for the tags—with both the data content of the tag and open wireless
communication protocols.

International conference on Science, Technology and Management ICSTM-2015
YMCA, New Delhi (India), 1 Feb 2015 www.conferenceworld.in
573 | P a g e
2.4. RF transceiver
RF transceiver isthe source of RF energy used to activateand power the passive RFID tags.It may be enclosed in
the same cabinetas the reader or it may be a separatepiece of equipment. When providedas a separate piece of
equipment, thetransceiver is commonly referred to asan RF module. RF transceiver controlsand modulates the
radio frequenciesthat the antenna transmits andreceives. The transceiver filters andamplifies the backscatter
signal from apassive RFID tag.
III BLOCK DIAGRAM OF THE SYSTEM
Fig 1
IV CIRCUIT OPERATION
The RFID tag is used as an identity for a particular user. If the identity (serial number of the tag) of the user is
matched with the one already stored in this system, he gets the actual fare of the travelled distance. This RFID
based is a secured access system with many additional features. For example, a new passenger‘s databasewill be
installedinto the system. A registered passenger can also withdraw his entry from the system in case of mistake.
These features can be accessed by pressing a tactile switch connected to the microcontroller.
In beginning, the user is prompted to scan his tag or ID which will be given to him through a smart card. The
information regarding starting of the journey will be stored into the system.At the end of the journey, passenger
has to produce the smart card to the system. The serial code of the tag is identified by the reader module and is
sent to AT89C51 for checking. If the ID is matched by the microcontroller, the user will the amount of the total
fare .
International conference on Science, Technology and Management ICSTM-2015
YMCA, New Delhi (India), 1 Feb 2015 www.conferenceworld.in
574 | P a g e
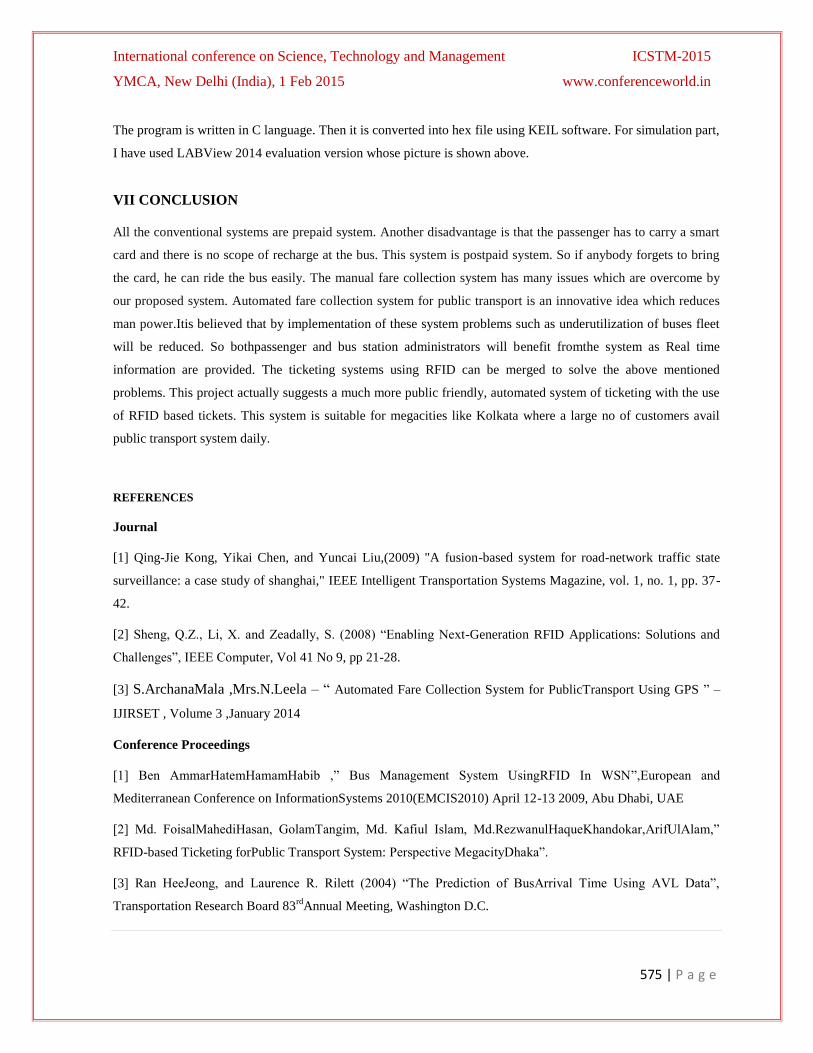
A new passenger needs to press the switch to register after which his identity is verified twice with RFID tag. The
new record is stored by the microcontroller. Again the verification is carried out and the user is deleted after his
journey will be over.
V RESULT
Fig 2 BLOCK DIAGRAM Fig 3 PART OF THE CIRCUIT
Passengers have to carry a RFID based card that will have a unique ID number. Information regarding starting
point will be stored into the card. According to the route distance between departure & destination as well as
considering bus type, it will calculate the ticket fare. If a passenger is given the card mistakenly (passenger‗s
destination is not in the same route, then no fare will be calculated. The passenger has to submit the card
immediately). During get down, passenger has to submit the card. The information regarding fare will be
displayed based on total distance travelling. Data regarding bus stoppage will be updated after every stoppage.
This is a postpaid system. After the days trip, from the system the total amount of money collected will be
displayed.
VI ANALYSIS
Siimulation in LABView 2014
International conference on Science, Technology and Management ICSTM-2015
YMCA, New Delhi (India), 1 Feb 2015 www.conferenceworld.in
575 | P a g e
The program is written in C language. Then it is converted into hex file using KEIL software. For simulation part,
I have used LABView 2014 evaluation version whose picture is shown above.
VII CONCLUSION
All the conventional systems are prepaid system. Another disadvantage is that the passenger has to carry a smart
card and there is no scope of recharge at the bus. This system is postpaid system. So if anybody forgets to bring
the card, he can ride the bus easily. The manual fare collection system has many issues which are overcome by
our proposed system. Automated fare collection system for public transport is an innovative idea which reduces
man power.Itis believed that by implementation of these system problems such as underutilization of buses fleet
will be reduced. So bothpassenger and bus station administrators will benefit fromthe system as Real time
information are provided. The ticketing systems using RFID can be merged to solve the above mentioned
problems. This project actually suggests a much more public friendly, automated system of ticketing with the use
of RFID based tickets. This system is suitable for megacities like Kolkata where a large no of customers avail
public transport system daily.
REFERENCES
Journal
[1] Qing-Jie Kong, Yikai Chen, and Yuncai Liu,(2009) "A fusion-based system for road-network traffic state
surveillance: a case study of shanghai," IEEE Intelligent Transportation Systems Magazine, vol. 1, no. 1, pp. 37-
42.
[2] Sheng, Q.Z., Li, X. and Zeadally, S. (2008) ―Enabling Next-Generation RFID Applications: Solutions and
Challenges‖, IEEE Computer, Vol 41 No 9, pp 21-28.
[3] S.ArchanaMala ,Mrs.N.Leela – ― Automated Fare Collection System for PublicTransport Using GPS ‖ –
IJIRSET , Volume 3 ,January 2014
Conference Proceedings
[1] Ben AmmarHatemHamamHabib ,‖ Bus Management System UsingRFID In WSN‖,European and
Mediterranean Conference on InformationSystems 2010(EMCIS2010) April 12-13 2009, Abu Dhabi, UAE
[2] Md. FoisalMahediHasan, GolamTangim, Md. Kafiul Islam, Md.RezwanulHaqueKhandokar,ArifUlAlam,‖
RFID-based Ticketing forPublic Transport System: Perspective MegacityDhaka‖.
[3] Ran HeeJeong, and Laurence R. Rilett (2004) ―The Prediction of BusArrival Time Using AVL Data‖,
Transportation Research Board 83rd
Annual Meeting, Washington D.C.
International conference on Science, Technology and Management ICSTM-2015
YMCA, New Delhi (India), 1 Feb 2015 www.conferenceworld.in
576 | P a g e
REQUIREMENTS, PROPOSALS AND CHALLENGES IN
TRANSACTION MANAGEMENT SERVICE-ORIENTED
SYSTEMS
1 Vishal Bhanawase,
2 Sager Mane,
3 Avadhoot
Joshi
1 MTech (CSE),JNTU University, Hyderabad, Andhra Pradesh,(India)
2 M.E (CSE), Solapur University, Maharashtra, (India)
3 M.E (CN), Pune University, Maharashtra, (India)
ABSTRACT
Service orientation system has been treated as one the important technologies for designing, implementing
deploying large scale service provision software systems. The main idea of SOC is to explicitly separate software
Engineering from programming, to emphasize on software Engineering and to de-emphasize on programming.
Service-Oriented Computing (SOC) is becoming the mainstream development paradigm of applications over the
Internet, taking advantage of remote independent functionalities. The cornerstone of SOC’s success lies in the
potential advantage of composing services on the fly. When the control over the communication and the elements
of the information system is low, developing solid systems is challenging. In particular, developing reliable Web
service compositions usually requires the integration of both composition languages, such as the Business Process
Execution Language (BPEL), and of coordination protocols, such as WS-Atomic Transaction and WS-Business
Activity. Unfortunately, the composition and coordination of Web services currently have separate languages
and specifications. A list of potential challenges for the maintenance and reengineering of service-oriented
systems is presented for discussion.
Key Terms: Transaction Management, Service Oriented Computing, BPEL
1. INTRODUCTION
Although the Web was initially intended for human use, most experts agree that it will have to evolve probably
through the design and deployment of modular services to better support automated use. Services provide higher-
level abstractions for organizing applications for large-scale, open environments. Thus, they help us implement and
configure software applications in a manner that improves productivity and application quality. Because services are
simply a means for building distributed applications, we cannot talk about them without talking about service-based
applications specifically, how these applications are built and how services should function together within them.
The applications will use services by composing or putting them together. Architecture for service based applications
has three main parts: a provider, a consumer, and a registry. Providers publish or announce their services on
registries, where consumers find and then invoke them. Standardized Web service technologies are enabling a new
generation of software that relies on external services to accomplish its tasks. The remote services are usually

International conference on Science, Technology and Management ICSTM-2015
YMCA, New Delhi (India), 1 Feb 2015 www.conferenceworld.in
577 | P a g e
invoked in an asynchronous manner. Single remote operation invocation is not the revolution brought by Service-
Oriented Computing (SOC), though. Rather it is the possibility of having programs that perform complex tasks
coordinating and reusing many loosely coupled independent services. It is the possibility of having
programs manages business processes which span over different organizations, people and information
systems. A new approach to software, such as that brought by SOC, calls for new ways of engineering
software and for new problems to be solved. The central role of these systems is played by services which are
beyond a centralized control and whose functional and, possibly, non-functional properties are discovered at
run-time. The key problems are related to the issue of discovering services and deciding how to coordinate
them. For instance, while planning to drive to a remote city, one might discover that it is heavily snowing there,
and may want to obtain snow tires. Therefore, one needs to find a supplier and a transport service to have the
appropriate tires in a specific location by a specific deadline. That is, various independent services are
composed into the form of a process, called the „get winter tires while traveling‟ with the requirement that we
order the tires if and only if we find also a transport service for them. In other words, we require the services of
tire ordering and tyre delivery to be composed in a transactional manner. In the present treatment, a service is a
standard XML description of an autonomous software entity, it executes in a standalone container, it may have
one or more active instantiations, and it is made of possibly many operations that are invoked asynchronously.
A service composition is a set of operations belonging to possibly many services, and a partial order relation defining
the sequencing in which operations are to be invoked. Such a partial order is adequately represented as a direct
graph. A service transaction is a unit of work comprehending two or more operations that need to be invoked
according to a specific transaction policy. The coordination of a service transaction is the management of the
transaction according to a given policy. One may argue that transaction management is a well-known
technique that has been around for ages but, as anticipated by Gray more than fifteen years ago, nested,
long-lived transactions demand for different techniques, and in fact they do. To cater for the new features of
transactions executed by Web services, various Web transaction specifications have been developed. WS-
Coordination specification describes an extensive framework for providing various coordination protocols. The WS-
Atomic Transaction and WS-Business Activity specifications are two typical Web transaction protocols. They
leverage WS-Coordination by extending it to define specific coordination protocols for transaction processing. The
former is developed for simple and short-lived Web transactions, while the latter for complex and long-lived
business activities. Finally, the Business Process Execution Language (BPEL) is a process- based composition
specification language. In order to develop reliable Web services compositions, one needs the integration of
transaction standards with composition language standards such as BPEL. Unfortunately, these are currently
separate specifications. This paper has a double goal: The first one is to look at the requirements of transaction
management for Service- oriented systems. The systematization of requirements is the starting point for an analysis
of current standards and technologies in the field of Web services. The second goal of the paper is to propose a
framework for the integration of BPEL with transaction protocols such as WS-Atomic Transaction and WS-Business
Activity. We use a simple but representative example across the paper, the drop dead order one, to illustrate
requirements and the proposed approach.

International conference on Science, Technology and Management ICSTM-2015
YMCA, New Delhi (India), 1 Feb 2015 www.conferenceworld.in
578 | P a g e
The need for filling the gap regarding transaction management for BPEL in a declarative way is testified also by
Other proposals in the Sam line. E.g., independently and in the same time window, Tai et al. have worked out
declarative approach to Web service transaction management. Their approach is very similar to ours with respect
to the execution framework and the use of a policy-driven approach to extend BPEL definitions with
coordination behavior. However, they do not consider the semi-automatic identification of transactions and
consequent process restructuring as we do. Earlier, Loecher proposed a framework for a model- based transaction
service configuration, though it was never implemented. Even before the birth of Web services, declarative
approaches to automate transaction management have been proposed, most notably. The present work extends our
survey and requirement analysis for service transactional systems and our proposal of the XSRL language for
handling requests against service compositions. In XSRL a construct is defined to express atomicity of
services execution, though no means for recovering from failures is provided. The rest of the paper is organized as
follows. First, we introduce the drop dead order example.
Fig. 1. The drop dead order example.
Requirements in Section 2 the proposed approach to transaction management is presented in Section 3.
II TRANSACTION REQUIREMENTS
In the field of databases,transactions are required to satisfy the so called ACID properties, that is, the set of
operations involved in a transaction should occur atomically, should be consistent, should be isolated from other
operations, and their effects should be durable in time. Given the nature of service oriented systems,
satisfying these properties is often not possible and, in the end, not necessarily desirable [14]. In fact, some
features are unique to service oriented systems: • Long-lived and concurrent transactions, not only traditional
transactions which are usually short and sequential.• Distributed over heterogeneous environments.• Greater
range of transaction types due to different types of business processes, service types, information types, or
product flows. Number of participants.Unpredictable execution length. E.g., information query and flight
payment needs 5 minutes; while e-shopping an hour; and a complex business trans- action like contracting may
take days. Computation and communication resources may change at run-time.• Unavailability of undo
operations, most often only compensating actions that return the system to a state that is close to the initial
state are available. Furthermore transactions may act differently when exposed to certain conditions such as

International conference on Science, Technology and Management ICSTM-2015
YMCA, New Delhi (India), 1 Feb 2015 www.conferenceworld.in
579 | P a g e
logical expressions, events expressed in deadlines and even errors in case of a faulty Web service. To make sure
that the integrity of data is persistent, the two transaction models used are namely Composite and Distributed
allow smooth recovery to a previous ”safe” state.
The set of emerging features mentioned earlier, which are a combination of requirements mostly coming from
the areas of databases and workflows, provide the basis for identifying the most relevant requirements for
transactions in service-oriented systems.
III PROPOSAL FOR INTEGRATING TRANSA-CIONS INTO BPEL
The above survey shows that there are standardized protocols for describing transactions and languages for
describing processes in terms of flows of activities. The connection among these is, to say the least, very loose.
The problem is that processes are described in terms of activities and roles capable of executing the activities, but
semantic dependencies among these activities are not represented beyond message and flow control. It may happen
that several operations from a single Web service are invoked within a BPEL process, and dependencies among
these operations may exist. For example, before a supplier provides the product requested by a distributor, he needs
first to process the request and then reply to the requester. The two operations correspond to two activities in the
BPEL process, namely providing products and processing request, which need to be managed in some
transactional way, but BPEL is unable to capture the right granularity and the dependencies among operations.
Our proposal consists of making the dependencies among the activities explicit via an automatic procedure and
performing a restructuring step of the process, where necessary. The identified dependencies among activities can be
then identified by the designer of the process as being transactions or not. In case they are, the designer will decide
which kind of transactions they are and simply annotate them. The execution framework then takes care that
transaction annotations are correctly managed at run time. Ply annotates them. The execution framework then takes
care that transaction annotations are correctly managed at run time.
Let us be more precise on what the phases of the proposed approach are. Consider Figure 3, where data
transformation goes from left to right and we distinguish three layers: the data layer at the bottom, the middle
execution layer defining the data transformation, and the knowledge level indicating from where the knowledge to
transform the data comes. We start with a generic business process designed to solve some business goal. An
automatic processing step, which we define next, identifies dependencies among activities. These are then
reviewed by an expert that decides which actually transactions are and which not. This step cannot be auto- mated
unless further semantic annotations are made on the BPEL. The restructured and annotated process is then ready to
be sent for execution. We notice that the restricted process may be sent to execution several times. In fact, at this
stage no concrete binding has occurred.
3.1 Preprocessing
Preprocessing the BPEL specification is performed in two steps, namely (I) identification and (ii) resolution of
transaction dependencies. In order to illustrate the two steps, we introduce an abstract model of BPEL.1 Abstract
model of BBBPPPEEEL specifications A BPEL process specification describes the interaction between services in a

International conference on Science, Technology and Management ICSTM-2015
YMCA, New Delhi (India), 1 Feb 2015 www.conferenceworld.in
580 | P a g e
specific composite Web service. Its abstract model, known as behavioral interface, defines the behavior of a group
of services by specifying constraints on the order of messages to be sent and received from a service [15]. In
this sense, a BPEL specification S is a set of activities A and its associated links L, represented by S = (A, L).
The links, which are directed, define a partial ordering over the set of activities and are thus well
represented as a directed graph (e.g., Figure 4).
• An activity a in A having a type represented by
Ta, has the following properties:
Name Na.
Operation OPa, which is usually implemented by the Web service at a specific port.
input variable IVa and output variable OVa, which specifies the parameters required and produced by the
OPa, respectively
set of source links SLa and set of target links T La , which specify the outgoing and
incoming links (transitions), respectively.
• A link l in S has a unique name Nl and is indirectly defined through two activities a1 and a2 which
indicates not only the direction ld of the transition, but also the conditions lc for the transaction to take

International conference on Science, Technology and Management ICSTM-2015
YMCA, New Delhi (India), 1 Feb 2015 www.conferenceworld.in
581 | P a g e
place. Furthermore, the Customer-to-distributor link lc−d is one of the source links of the Receive Order
activity a1,Furthermore, lc−d∈ La6, where T La6 is the target link of the Complete Distribution
3.2 Dependencies identification algorithm
To identify the existence of transaction dependencies within a given BPEL specification S, we propose Algorithm
4.1. The algorithm is a standard graph algorithm similar to those for reachable set construction, e.g., [16]. The
function Identify Dependency takes S as input and outputs a Boolean value that represents the existence of
transaction dependencies td. The function first creates a path p for any two activities am and an . Then
traverses the links in the link chain ls obtained from p. When a link l is detected and its transition condition lc
contains the output variable OVam of the first activity am , or if it contains an output variable OVaI
which is identical to OVam semantically, the algorithm stops and returns TRUE. Otherwise, it continues
until all pairs of activities in St have been visited. Finally, if no transaction dependencies are detected, the
algorithm returns FALSE.
3.3 Declaration of transaction policies
Once transactions are identified and BPEL has been accordingly restructured, one needs to define the
desired transactional behavior. One can declare the transaction policy using the following elements:
1) T rams ID is a non-zero integer, representing transactions within a business process.
2) T rams P rotocol specifies a protocol for the transaction, such as WS- Atomic Transaction (WS-AT) or WS-
Business Activity (WS-BA).
3) Trans Root indicates the parent transaction identified by TransID. The value 0 is used to indicate the root
transaction within the business process.
One can specify the hierarchy of transactions by assigning appropriate TransIDs and Trans Roots.
With such a schema, one can annotate constraints or preferences to a specific activity in the BPEL specification. The
annotated activity must be an invoke activity. One can separately specify the desired constraints or preferences in
the design-time-info or run-time-info sections. For trans- action management, we declare the transaction policies in
the section of the trans-info which is embedded within the section of run-time-info, since a transaction policy is
a run-time constraints. Together with the other types of process information, transaction policies are stored in an
XML file for use at run-time.
3.4 The Execution framework
The proposed approach transforms a generic business process into a restructured one in which transactions are
identified and annotated. Now one needs an execution framework that is richer than a simple BPEL engine. In fact,
one needs to interpret the annotations, make sure that activities are executed according to the transaction
conditions and also that the binding among dependent activities is consistent with the transaction semantics. To
achieve this we rely on the Sense platform in the context of which the current approach has been developed. Ser-
vice Centric System Engineering (Sense) is an Europe an sixth framework integrated project, whose primary goal is

International conference on Science, Technology and Management ICSTM-2015
YMCA, New Delhi (India), 1 Feb 2015 www.conferenceworld.in
582 | P a g e
to create methods, tools and techniques for system integrators and service providers and to support the cost-
effective development of service-centric applications [17], [18].
The SeCSE service composition methodology sup- ports the modeling of both the service interaction view and
the service process view [19]. A service integrator needs to design both the abstract flow logic and the decision
logic of the process-based composition. Therefore, the SeCSE composition language allows the definition of a
service composition in terms of a process and some rules that determine its dynamic behavior [20].
Correspondingly, the flow logic can be represented by a BPEL specification, while the decision logic is defined by
rules. Based on the architecture of the Sense platform, we built a transaction management tool called DecTM4B. It
consists of three modules, namely The Preprocessor for T.M. Is used to identify and eliminate transaction
dependencies occurring in the original BPEL specification. The output is the preprocessed BPEL specification.
The SeCSE platform will deal with the binding of abstract services before the BPEL engine executes the BPEL
specification. The preprocessing executed by Preprocessor for T.M. happens just before the binding. Currently,
ODE and Active BPEL [21] are two BPEL engines supported by the SCENE platform. The Event Adapter maps
the low- level events from the BPEL engine onto the binding-related events. The first version of SeCSE event
adapter is extended to support the mapping of transaction related events. The Transaction Manager is a separate
component in the executor and deployed in the Mule container (Mule is a messaging platform based on ideas
from Enterprise Service Bus (ESB) architectures).The Transaction Manager consists of the following two
transaction- specific components...
1) TransLog is responsible for managing the lifecycle of transactions, such as creating transaction instances,
maintaining the status of transaction instances, and destroying transaction instances.TransLog is also responsible
for transferring the information among the components in the executor. For example, it listens the transaction
related events from the Event Adapter, and it is responsible for the communication between Transaction Manager
and JBoss Transaction Server.
2) Policy Operator retrieves the transaction policies from the XML file, and parses the transaction policies, and then
maps transaction policies onto the coordination context. It provides a set of APIs which are to be called by the
TransLog.
IV RESEARCH CHALLENGES FOR SERVICE ORIENTED SYSTEMS
The following is an attempt to classify research issues in the previously identified domains. The challenges listed
under each category are still at a very high level.
They are based on a preliminary literature search, expert opinions from academia and industry, as well as the
author‟s experience. This list is by no means complete and it is the intent of the authors to gather feedback
from a wide community through exposure of the proposed classification and challenges.

International conference on Science, Technology and Management ICSTM-2015
YMCA, New Delhi (India), 1 Feb 2015 www.conferenceworld.in
583 | P a g e
V CONCLUSION
The Requirements, Challenges Proposed in our paper consist of business domain and the role of business domain is
to focus on activities pertaining to the overall business process as well as on Compliance, trust and analytics.
Management. The research pointers in the operations domain focus on activities pertaining to specific application
domains, as well as monitoring, support, adoption, and usability. The challenges in the engineering domain focus on
activities that relate to the life-cycle of the system from its requirements specification to its maintenance.
REFERENCES
[1] WS-BA, “Web Services Business Activity Framework (WSBusinessActivity), Version 1.1,” Aruba
Technologies Ltd., BEA Systems, Hitachi Ltd., IBM, IONA Technologies and Microsoft, Tech. Rep., 2007
[2] BPEL, “Business Process Execution Language for Web Services Version 1.1,” IBM, Microsoft, BEAT, SAP and
Siebel Systems, Tech. Rep., 2003.
[3][Brown06] SOA Governance: How to Oversee Successful Implementation through Proven Best Practices and
Methods.IBM white Paper. Ftp: //
ftp.software.ibm.com/software/rational/web/whitepapers/10706900_SOA_gov_model_app_v1f.pdf
[4]A. Lazuli, M. Aiello, and M. Papazoglou, “Planning and monitoring the execution of Web service requests,”
International Journal on Digital Libraries, vol. 6, no. 3, pp. 235–246, 2006.
[5] M. Aiello and A. Lazuli, “Monitoring assertion-based business process,” International Journal of
Cooperative Information Systems, vol. 15, no. 3, pp. 359–390, 2006.
[6] B. Haugen and T. Fletcher,“Multiparty electronic business transactions. Version 1.1,” UN, Tech. Rep., 2002.
[7] M. Little,“Transactions and web services,” Communication of the ACM, vol. 46, no. 10, pp. 49–54, 2003.
[8] OASIS, “Business transaction protocol,” OASIS, Tech.Rep 2004.

International conference on Science, Technology and Management ICSTM-2015
YMCA, New Delhi (India), 1 Feb 2015 www.conferenceworld.in
584 | P a g e
[9] BPEL, “Business Process Execution Language for Web Services Version 1.1,” IBM, Microsoft, BEAT, SAP and
Siebel Systems, Tech. Rep., 2003.
[10] C. Sun, D. Hammer, G. Biomet, and H. Groefsema, “An evaluation of description and management- standards
and languages for Web service transactions,” Univ. Of Groningen/ Sense Project, Tech. Rep., 2006.
[11][Gold-Bernstein05] Gold-Bernstein, B. And So, G.Integration and SOA: Concepts,technologies and best
Practices.
[12][High05] High, R., Kinder, S., and Graham, S. IBM‟s SOA Foundation: An Architectural Introduction and
Overview. November2005. http://download.boulder.ibm.com/ ibmdl/pub/software/dw/web-services/ws-soa-
whitepaper.pdf[13][IBM06]
[13]B.HaugenandT.Fletcher,“Multiparty electronic business transactions.
[14]M.Little, “Transactionsandwebservices,”Communication of the ACM, vol.46, no.10, pp.49–54, 2003.
[15]C.Ouyang,E.Verbeek,W.M.vanderAalst,S.Breutel,M.Dumas, andA.terHofstede,“Formal semantics and
analysis of control owinBPEL,”Sci.Comput.Program.,vol.67,pp.162–198,2007. [16]G.Chiola, “Area chability
graph construction algorithm based on canonical transition ring count vectors,” in Petri Nets and Performance
Models, 2001, pp.113–122.
[17] S. Consortium, “http://www.secse-project.eu/,” European Union, Tech. Rep., 2005–2007.
[18] The SECSE Team, “Designing and deploying service-centric systems: The SeCSE way.” in Service Oriented
Computing: a look at the Inside (SOC@Inside‟07), 2007.
[19] Various Authors, “Report on methodological approach to designing service compositions(final), version 4.0
SeCSE A3.D3,” ESI, CA and CE-FRIEL, Tech. Rep., 2005, http://www.secseproject. Eu/.
[20]“Report on methodological approach to design service compositions (v2.0) SeCSE A3.D3.2.b,” CEFRIEL
Unisannio, Tech. Rep., 2006, http://www.secse-project.eu/.

International conference on Science, Technology and Management ICSTM-2015
YMCA, New Delhi (India), 1 Feb 2015 www.conferenceworld.in
585 | P a g e
A SURVEY ON MEDICAL IMAGE SECURITY
DURING TRANSMISSION
1Asmita,
2 Priyanka,
3 Rajesh
1,2,3 Computer Science & Engineering Department, M.D.U, (India)
ABSTRACT
This paper presents the problem of secure transmission of medical images. There are many reviewed algorithms
which are applied to images. In this paper a study of various papers is done, and in the reviewed papers the
patient information is embedded in the medical image and after applying encryption sends the message to the
receiver. The study in this paper show how different methods provide security to medical imagery during
transmission, and also once this digital data is received.
Keywords: Datahiding, Decryption, Encryption, Segmentation, Watermarking
I INTRODUCTION
The necessity of fast and secure diagnosis is vital in the medical world. Nowadays, the transmission of images
is a daily routine and it is necessary to find an efficient way to transmit them over the net. In this paper we
study different techniques of medical image protection which is based on combination of watermarking and
encryption. Our research deals with image cryptography, data hiding. There are several methods to encrypt
binary or grey level images [1,2, 3].
The works presented in this paper show how encryption Algorithms provide security to medical imagery. The
main objective is to guarantee the protection of medical images during transmission, and also once this digital
data is archived. The subsequent challenge is to ensure that such coding withstands severe treatment such as
compression, denoising. When a physician receives a visit from a patient, he often requires a specialist opinion
before giving a diagnosis. One possible solution is to send images of the patient, along with a specialist report,
over a computer network. We are therefore faced with a real security problem when sending data. For ethical
reasons, medical imagery cannot be sent when such a risk is present, and has to be better protected. Encryption
is the best form of protection in cases such as this. Many different techniques for the encryption of text already
exist. Nowadays, a new challenge consists to embed data in encrypted images. Since the entropy of encrypted
image is maximal, the embedding step, considered like noise, is not possible by using standard data hiding
algorithms. [4]
In this paper, section 2, we recall watermarking encryption (block cipher, stream cipher, asymmetric and
symmetric encryption)
In section 3 we will present combination of image encryption and watermarking method. Then in section 4 we
describes the partial encryption, compression and watermarking methods. In the section 5 we describes the
reversible watermarking method with encryption. In section 6 we describe the method of watermarking with
segmentation and encryption and in section 7 we describe conclusion and future work.

International conference on Science, Technology and Management ICSTM-2015
YMCA, New Delhi (India), 1 Feb 2015 www.conferenceworld.in
586 | P a g e
II. WATERMARKING AND ENCRYPTION
Watermarking can be an answer to make secure image transmission. For applications dealing with images, the
watermarking objective is to embed invisibly message inside the image.[1] To embed the encrypted image in the
patient information.
There are two main groups of information hiding techniques: techniques in the spatial domain and techniques in
the transform domain. Spatial domain techniques generally involve manipulation of pixel intensity. Lossless
image formats are most suited for spatial domain techniques [5]. The most well-known technique of information
hiding in the image domain is Least Significant Bit (LSB) algorithm. In this algorithm, the least significant bit,
which will affect pixel colour the least, is examined and either changed or not changed so that it matches the bit
that is to be embedded. The algorithm can either adjust every least significant bit or, for greater security, adjust
only every nth bit with n being known only to the message recipient thus providing and additional level of
security. [5] Hiding information in the transform domain is a multi step process. First an appropriate transform
must be applied. The most popular are the Discrete Fourier Transform (DFT) and the DCT. The transform
changes the signal to a frequency representation from a spatial representation. This has the effect of spreading
the pixel values over a part of the image, usually an 8x8 block. The next step is to modify the transform
coefficients to embed a desired bit. This has the effect on the image of modifying the brightness of the image.
[5] The modified DCT coefficient blocks are then transformed back to the spatial domain to obtain the stego-
image. [6]
The encryption can be done by block or by stream. But the encryption block methods applied to image, have
presented two inconvenient. The first one was when you have homogeneous zones. all blocks of this kind are
encrypted on the same manner. The second problem was that block encryption methods are not robust to noise.
The stream cipher method is robust to moderate noise like JPEG compression with high quality factor.[1] In
asymmetric algorithm we use two key private and public for encryption and decryption of the message. Private
key keeps private and public key can accessed by any one And In symmetric encryption there is only one secret
or private key for encryption and decryption of message and key keeps secret.
III.DESCRIPTION OF THE COMBINATION OF IMAGE ENCRYPTION AND
WATERMARKING
In this section we study how it is possible to combine the techniques of encryption and watermarking in images.
Indeed, we constructed a new method with encryption algorithm with secret key for the image, with encryption
based on public private key for the secret key and with watermarking method. For example, if a medical doctor
M wants to send, by network, a medical image to a specialist S, it should be made in a safe way. To do that, the
doctor M can use a fast encryption algorithm with secret key K to cipher the image. In order to transfer K, M can
encrypt the key K by using encryption algorithm with public key, like RSA for example [7]. If pub is a public
key and priv a private key for RSA, then M possesses the public and private keys pubm and privm, and S the
public and private keys pubs and privs. Firstly, M generates a secret key K for this session and encrypt the
image with the stream cipher algorithm. Secondly, M should encrypt the key K with RSA algorithm by using
his private key, privm, in order to get an encrypted key K .This encrypted key K is also encrypted with RSA by
using the public key pubs of his corresponding S in order to generate K. This encrypted key K is then embedded
in the ciphered image by using a DCT-based watermarking method [8]. Finally, the doctor M sends this image

International conference on Science, Technology and Management ICSTM-2015
YMCA, New Delhi (India), 1 Feb 2015 www.conferenceworld.in
587 | P a g e
to the specialist S. The specialist S receives the watermarked-encrypted image and extracts from it the
encrypted key K. He can then authenticate M and decrypt the key K by using his self private key privs and the
public key pubm of M. With the obtained key K, S can then decipher the image and visualize it. If the specialist
S wants to send another image to the doctor M, he can create a new secret key K1 for this new session. The
process will be the same, but the private and public key for RSA will not be applied in the same order. Even, if
five keys are necessaries for each session, most of them are transparent for the users. Indeed, the private key can
be associated to the software used by the receptor, and for the two correspondents it is not necessary to know the
secret key which is encrypted and embedded in the image. However, for each session the value of the secret key
K must change. Otherwise, if the key has no changing, all the people who have the software can decrypt the
images.
IV.TH PARTIAL ENCRYPTION, COMPRESSION AND WATERMARKING METHODS
In this section a novel reversible method for fast and safe image transfer is proposed. The method combines
compression, data hiding and partial encryption of images in a single processing step. The proposed approach
can embed data into the image according to the message size and partially encrypt the image and the message
without changing the original image content. Moreover, during the same process the image is lossless
compressed. Nevertheless, the compression rate depends on the upper bound of message size to embed in
the image. The main idea is to decompose the original image into two sub-images and to apply various
processes to each sub-image in order to gain space and increase the amount of embedded data. The two sub-
images are then scrambled and partially encrypted. The most significant characteristic of the Proposed method is
the utilization of a single procedure to Simultaneously perform the compression, the reversible data hiding and
the partial encryption rather than using three separate procedures. Our approach reduces then the computational
effort and the required computation time. This method is specially suited for medical images where one can
associate the patient diagnostic to the concerned medical image for safe transfer purpose [9]. The keywords of
this work are fast and safe image transmission, lossless compression, reversible data hiding, partial encryption,
image protection and real time image processing.
V. THE REVERSIBLE WATERMARKING METHOD WITH ENCRYPTION
Since several years, the protection of multimedia data is becoming very important. The protection of this
multimedia data can be done with encryption or data hiding algorithms.To decrease the transmission time, the
data compression is necessary. Since few years, a new problem is trying to combine in a single step,
compression, encryption and data hiding. So far, few solutions have been proposed to combine image
encryption and compression for example. Nowadays, a new challenge consists to embed data in encrypted
images. Since the entropy of encrypted image is maximal, the embedding step, considered like noise, is not
possible by using standard data hiding algorithms. A new idea is to apply reversible data hiding algorithms on
encrypted images by wishing to remove the embedded data before the image decryption. Recent reversible data
hiding methods have been proposed with high capacity, but these methods are not applicable on encrypted
images. In this paper we propose an analysis of the local standard deviation of the marked encrypted images in
order to remove the embedded data during the decryption step. We have applied our method on various images,
and we show and analyze the obtained results [9].

International conference on Science, Technology and Management ICSTM-2015
YMCA, New Delhi (India), 1 Feb 2015 www.conferenceworld.in
588 | P a g e
VI. THE METHOD OF WATERMARKING WITH SEGMENTATION AND ENCRYPTION
In present times, identity protection is becoming increasingly jeopardized. Numerous ways of protecting one's
personal, financial or medical information are therefore being utilized by individuals, businesses, and
governments. When it comes to protecting patient information in medical images, we have developed an
information hiding methodology that includes the RSA encryption algorithm and a Discrete Cosine Transform
(DCT) based hiding technique. With this system, any medical image that will be electronically transferred (i.e.
emailed, faxed, etc.) will have the patient's information hidden and embedded in the image outside of the Region
of Interest (ROI). For example, an X-ray of a skull that is emailed will not have the patient information
displayed during transmission, but will be readily available once it reaches its destination. This system is also
unique in the fact that when a medical image is electronically delivered, the patient information and the picture
are transferred in the same file, where as now an image and the corresponding patient information are
transmitted in two different files.[2]
VI. CONCLUSION
In this review paper we have study combined approaches of cryptography and data hiding for protection of
medical image. In all methods the original image and patient information is embedded and encrypted and then
send the message to the receiver. We have found problem related to slow transfer of message and noise during
embedding and to resolve this problem compression and segmentation is used but compression technique were
not reversible,erasable, invertible and segmentation uses large data to embed with patient information and
original image but due to large data the transmission takes more time. so For fast transfer the encrypted image is
embedded using lossless data hiding method with patient information and for denoised transmission we have to
apply reversible data hiding algorithm on encrypted image to remove the embedded data before the image
decryption in the receiver side . So that we find more secured and less noisy medical image.
ACKNOWLEDGMENT
My express thanks and gratitude to all the departments’ personals and sponsors who give me a opportunity to
present and express my paper on this level. I wish to place on my record my deep sense of gratitude to all
reference papers authors for them valuable help through their papers, books, websites etc.
REFERENCES
[1] W. Puech” Image Encryption and Compression for Medical Image Security” PROCEEDING OF IEEE
Image Processing Theory, Tools & Applications.
[2] Ming YANG,Lei SONG,Monica TRIFAS,Dorothy BUENOS-AIRES,Lei CHEN, Jaleesa ELSTON,” Secure
Patient Information and Privacy in Medical Imaging IEEE ”
[3] Xinpeng Zhang ]IEEE SIGNAL PROCESSING LETTERS, VOL. 18, NO. 4, APRIL 2011 255 Reversible
Data Hiding in Encrypted Image
[4] W. Puech” Image Encryption and Compression for Medical Image Security” Image Processing Theory,
Tools & Applications

International conference on Science, Technology and Management ICSTM-2015
YMCA, New Delhi (India), 1 Feb 2015 www.conferenceworld.in
589 | P a g e
[5]. T. Morkel, J.H.P. Eloff, and M.S. Olivier, "An Overview of Image Steganography," Proceedings of the Fifth
Annual Information Security South Africa Conference., June/July 2005.
[6]. M. Yang, and N. Bourbakis, “A High Bitrate Multimedia Information Hiding Algorithm in DCT Domain”,
Proceeding of World Conference of Integrated Design and Process Technology (IDPT 2005), June 13th-
17th,2005.
[7] RSA Security. http://www.rsasecurity.com/. 2003.
[8] G. Lo-varco,W. Puech, and M. Dumas. Dct-based watermarking method using error correction codes. In
ICAPR’03, International Conference on Advances in Pattern Recognition, Calcutta, India, pages 347–
350,2003.
[9] W. Puech, M. Chaumont, and 0. Strauss. A Reversible Data Hiding Method for Encrypted Images. In Proc.
SPIE, Electronic Imaging,Security, Forensics, Steganography, and Watermarking of Multimedia Contents
X, volume 6819, pages 68191E-1-68191E-9, San Jose, CA,USA, January 2008.
BIOGRAPHICAL NOTES
Miss Asmita is Presently persuing M.Tech Final Year in Computer Science & Engineering Department From
SRCEM,Affilated to M.D.U,Rohtak,INDIA.
Miss Priyanka is Presently persuing M.Tech Final Year in Computer Science & Engineering Department From
SRCEM,Affilated to M.D.U,Rohtak,INDIA.
Mr Rajesh is Presently persuing M.Tech Final Year in Computer Science & Engineering Department From
SRCEM,Affilated to M.D.U,Rohtak,INDIA

International conference on Science, Technology and Management ICSTM-2015
YMCA, New Delhi (India), 1 Feb 2015 www.conferenceworld.in
590 | P a g e
PREPARATION AND CHARACTERISATION OF
DITHIOCARBAMATE BASED CALIX [4] PYRROLE
ASSEMBLIES ON Ag NANOPARTICLES: POTENTIAL
ANTIMICROBIAL AGENT
Disha J. Vyas1 , Kamini H. Vyas
2, Bharat A.Makwana
3
1Department
of Chemistry, School of Sciences, Gujarat University, Ahmedabad-380009.(India)
2,3HVHP Institute of PG Studies and Research, S.V Campus, KSV University,
Kadi-382715,Gujarat,(India)
ABSTRACT
In this communication, The synthesis of metal nanoparticles by eco-friendly and reliable processes is an important
aspect in many fields. meso-tetra(methyl) meso-tetra (4-ethyl carbamodithioate) calix pyrrole (CPADTC) have been
used as reducing as well as stabilizing agent for the preparation of silver nanoparticles via simple one pot method.
Synthesized silver nanoparticles (CPADTC-AgNP) were characterized by UV-vis spectroscopy, transmission
electron microscopy (TEM) Dynamic Light Scaatering (DLS), particle size analyzer (PSA) and Atomic force
microscopy (AFM). The method used for the synthesis of silver nanoparticles was found to be rapid and it required
no toxic chemicals. The meso-tetra(methyl) meso-tetra (4-ethyl carbamodithioate) calix pyrrole (CPADTC) capped
silver nanoparticles (CPADTC-AgNP) were found to be highly stable over a long period of time. Further, the
CPADTC-AgNP showed high antimicrobial and bactericidal activity against bacteria such as Escherichia coli,
Bacillus megaterium, Staphylococcus aureus, Bacillus subtilis and found highly strain. CPADTC-AgNP were also
found to exhibit reasonably good antimicrobial activity, when compared with standard Chloramphenicol, suggests
its potential use as antimicrobial agent.
Keywords : AgNp, Antimicrobial effect, Calix, Pyrrole, Silver Nanoparticles,
I INTRODUCTION
The field of nanoscience has been established recently as a new interdisciplinary science and the need for
nanotechnology will only increase as miniaturization becomes more important in areas such as computing, sensors,
and biomedical applications [1]. Nanoscience can be defined as a whole knowledge on fundamental properties of
nano-size objects[2]. Size and shape of nanoparticles provide an efficient control over many of their physical and
chemical properties [3,4], and their potential application in optoelectronics [5,6], recording media [7,8], sensing

International conference on Science, Technology and Management ICSTM-2015
YMCA, New Delhi (India), 1 Feb 2015 www.conferenceworld.in
591 | P a g e
devices[9,10], medicine [11-13] and catalysis [14].It is well known that Ag ions and AgNPs were found to be highly
toxic to microbes, with strong biocidal effects. Silver nanoparticles possess potential application to eliminate
microorganisms and hold thepromise of killing microbes effectively [15,16].
Hence, synthesis and characterization of nanoparticles is, now a day, an important area of research. Silver
nanoparticles have unique electronic and optical properties and hence they have been used in a broad range of fields,
including catalysis, biological labeling and photonics etc.[17-22]. Various methods i.e. aerosol technique [23],
electrochemical or sonochemical deposition [24,25], photochemical reduction[26], laser irradiation technique [27]
etc have been reported over the last two decades for the synthesis of silver nanoparticles. Generally and widely used
method is chemical reduction method which involve the reduction of metal salt with the help of different reducing
agents such as citric acid ,borohydride (Lee and Meisel Method)[28], , N2H4 [29], NH2OH[30], ethanol[31], ethylene
glycol[32] and N,N-dimethyformamide (DMF)[33] which prevents the nanoparticles from aggregation. Other
organic compounds like cetyl trimethylammonium bromide[34], sodiumdodecyl sulphate[35], poly(vinyl
alcohol)[36] and poly(vinylpyrrolidone)[37] poly (lactic Acid)[38]poly (methyl vinyl ether)[39] have also been used
which not only act as reducing agent but also stabilize them and increase their shelf life.
Most of the methods used for the formation of Ag nanoparticles from calix system limit their potential application
either because some of them are prepared in organic solvents because of the poor solubility of calix molecules in
aqueous media [40-43]or poor shelf life[44,45,41]. Recently, Chao - Guo yan made a study of resorcinarenes as a
ligand for the fabrication of water-soluble noble nanoparticles such as AgNPs, AuNPs, Pt-NPs, and PdNPs.(Sun et
al. 2010)
The functionalization of metal substrate with such organic ligands has become a standard practice in surface science
and nanomaterial chemistry Perhaps the most prevalent example is the chemisorptions of the ligand containing
dithiocarbamate group on silver nanoparticles. Dithiocarbamates are organosulfur compounds and are commonly
used in agriculture as pesticides, in rubber industry as antioxidants and vulcanization accelerators.Molecules with
dithiocarbamate group have superior chemisorptions property and gained substantial attention in nanotechnology
due to the ease with which they can be synthesized and the fact that small interatomic distance between two sulfur
atoms. Dithiocarbamates are considered unstable in acidic form and are often prepared as metal salt by the
condensation of primery or secondary amines with CS2 under strong basic condition.
Here, we show that primary amine can condense with carbon disulfide at room temperature without addition of base
to form dithiocarbamate ligand. We describe the spontaneous assembly of dithiocarbamate calix[4]pyrrole ligands
on silver nanoparticles. Dithiocarbamate calix[4]pyrrole derivative and its self-assembly on a nano structured metal,
has been shown to be a good strategy to design new sensitive and selective surface.

International conference on Science, Technology and Management ICSTM-2015
YMCA, New Delhi (India), 1 Feb 2015 www.conferenceworld.in
592 | P a g e
II EXPERIMENTAL SECTION
2.1Chemicals and Reagents
All the reagents and metal salts of AR grade were purchased from Sigma-Aldrich and used without further
purification. Solvents used for spectroscopic studies were purified and dried before use
2.2Instruments and Measurements
All aqueous solutions were prepared from quartz distilled deionized water which was further purified by a Millipore
Milli-Q water purification system (Millipack 20, Pack name: Simpak 1, Synergy). Melting points (uncorrected) were
taken in a single capillary tube using a VEEGO (Model No: VMP-DS, India) melting point apparatus. FT-IR
spectra were recorded on Bruker, tensor 27Infrared spectro-photometer as KBr pellets. 1
H NMR spectra were
recorded on a Bruker-ARX 500MHz instrument, using tetramethylsilane as internal standard. Mass Spectra were
recorded on MICROMASS QUATTRO II triple quadruple mass spectrometer using ESI capillary (3.5 KV, 40
V).The spectra were recorded at room temperature. Absorption spectra were studied on a Jasco V-570 UV-Vis
recording spectrophotometer. pH of the solutions was measured using pH analyzer LI 614- Elico. The particle size
and zeta potential were determined by using the Malvern Zetasizer (Model; ZEN3600) as such without dilution.
TEM images were recorded in MACK/model JEOL, JEM 2100 at an accelerated voltage of 200 kV. A drop of dilute
solution of a sample in water on carbon coated copper grids was dried in vacuum and directly observed in the
TEM.The antimicrobial susceptibility of nanoparticles was evaluated using the disc diffusion or Kirby-Bauer
method and zones of inhibition were measured after 24 hours of incubation at 35 °C.
2.3 Synthesis of Ethyl (4-acetylphenyl)carbamodithioate
Carbon disulfide (5.6g, 0.0736mol) was added to p-amino acetophenone(5g, 0.036mol) in DMSO. The reaction
mixture was stirred under vigorous stirring at room temperature for 5-6 h. Ethyl iodide (5.7g, 0.036mol) was added
to the reaction mixture drop wise and kept for stirring for about 3-4 hours. After completion of reaction time the
reaction mixture was poured in ice cold water with stirring. Yellow colored precipitates separated were washed
several times with methanol and recrystalized in a mixture of methanol and DMF to obtain the pure product. The
purified form was further utilized for the formation of calix[4]pyrrole derivative.
2.4 Synthesis of meso-tetra(methyl) meso-tetra (4-ethyl carbamodithioate) calix pyrrole (CPADTC)
A solution of ethyl (4-acetylphenyl)carbamodithioate (4mmol, 1g) in absolute ethanol (ml) was added to the stirring
mixture of pyrrole (4mmol, 0.31ml) and 2 ml of BF3.(OEt)2. After stirring at 60c for 24 hours the reaction mixture
was brought to room temperature and was poured in 500 ml of ice cold water. The precipitates found were directly
extracted from aqueous layer to the organic layer of ethyl acetate. This method of extraction was repeated (3
X100ml). The organic layer was separated and dried over anhydrous Na2SO4 The solvent was removed in vacuo to
give desired product and the crude product was recrystallized in ethanol to obtained pure product.(Fig.1)

International conference on Science, Technology and Management ICSTM-2015
YMCA, New Delhi (India), 1 Feb 2015 www.conferenceworld.in
593 | P a g e
2.5 Synthesis of meso-tetra(methyl) meso-tetra (4-ethyl carbamodithioate) calix pyrrole capped Ag
nanoparticles (CPADTC-AgNP)
The synthesis of the silve nanoparticles was carried out according to the method reported by Lee and Meisel. A total
of 1 mL of a 1%w/v trisodium citrate aqueous solution was added to 50 mL of a boiling 10-3
M silver nitrate
aqueous solution, and boiling was continued for 1 h. The colloid obtained showed a turbid gray. First, the Ag NP
suspensions were aggregated by adding an aliquot of potassium nitrate solution up to a final concentration of 3 x 10-
2 M, and then an aliquot of the CPADTC solution (5 x 10
-2 M) was added (Fig.2).
III RESULTS AND DISSCUSSION
3.1 Characterization of CPADTC-AgNp by UV-Vis Spectroscopy
In UV vis absorption spectra a very pronounced peak of silver nanooparticles, dithiocarbamate calix[4]pyrrole and
dithiocarbamate calix[4]pyrrole AgNp assembly can be seen at λmax 421 nm, 310 nm and 306,445nm respectively,
which is characteristic of nanometer-sized Ag particles and formation of nano assembly of dithiocarbamate
calix[4]pyrrole-AgNp. (Fig.3)
3.2 Characterization of CPADTC-AgNp by Atomic force microscopy (AFM)
The particle dimensions were calculated by AFM measurements, in which a drop of the particle solution was spread
onto a freshly peeled mica surface and dried under a gentle nitrogen stream. The AFM micrographs exhibit very
visible and well-dispersed nanosized particles. Because of tip convolution, particle core diameter was estimated by
the heights in AFM measurements. The AFM result for AgNp shows the average particles size around 70nm where
as CPADTC-AgNp shows the average particle size around 185nm and roughness is around 905pm(Fig.4).
3.3 Characterization of CPADTC-AgNp by Dynamic light scattering (DLS)
Dynamic light-scattering (DLS) profiles show that the average diameters of silver nanoparticels around 70nm where
as the average diameter of CPADTC capped silver nanoparticles was found around 195nm.(Fig.4)
3.4 Characterization of CPADTC-AgNp by transmission electron microscopy (TEM)
The morphology and particles size of CPADTC-AgNp were studied by Transmission Electron Microscopy (TEM).
(Fig. ) depicts that the sample was composed of a large quantity of well dispersed spherical silver nanoparticles with
an average particle size of 8±2 nm. The size distribution of the CPADTC-AgNp was also determined by particle size
analyser and the average hydrodynamic diameter of silver nanoparticles was found to be 9 nm. These higher values
were due to the light scattered by the core particle and the layers formed on the surface of the particles. Energy-
dispersive X-ray (EDX) analysis spectrum recorded in the spot-profile mode from one of the densely populated
CPADTC-AgNp regions on the surface of film, strong signals from Ag atoms while weaker signals from C, O, Si,
Cu and Ca atoms were observed (Fig.5 a,5b and 5c)

International conference on Science, Technology and Management ICSTM-2015
YMCA, New Delhi (India), 1 Feb 2015 www.conferenceworld.in
594 | P a g e
3.5 Anti bacterial Assays study of silver nanoparticles
The antimicrobial susceptibility of silver nanoparticles was evaluated using the disc diffusion or Kirby-Bauer
method. The antibacterial assays were done on bacterial organisms like Escherichia coli, Staphylococcus aureus. by
Muller Hinton Agar (MHA) plates. Sterile paper disc of 20mm diameter containing 100mg/liter silver nanoparticles
and standard antibiotic chloroemphenicol (100μg/ml) containing discs were placed in each plate as control. The
plates were incubated at 37◦C for overnight. Next day the inhibition zones around the discs were measured.
Here we shows the antimicrobial activity of synthesized Ag nanoparticles against two different bacteria such as
E.coli, S.auereus. As it showed a clear inhibition zone. the synthesized Ag nanoparticles were highly effective in
their activity against than antibiotics. Standard antibiotic disc (100μg/ml) chloremphenicol was used as control.
Bacterial membrane proteins and DNA makes preferential sites for silver nanoparticles interaction as they possess
sulphur and phosphorus compounds and silver have higher affinity to react with these compounds. Antibacterial
effect of silver nanoparticles obeyed a dual action mechanism of antimicrobial activity, (i.e.) the bactericidal effect
of Ag+ and membrane disrupting effect of the polymer subunits(Table 2)
The nanoparticles smaller than 10 nm interact with bacteria and produce electronic effects, which enhanced the
reactivity of nanoparticles. Thus, it is corroborated that the bactericidal effect of silver nanoparticles is size
dependent [46]. The nanoparticles release silver ions in the bacterial cells, which enhance their bactericidal activity
(Fig.7) [47,48]. In this study, the antibacterial effect of synthesised compounds (1 – 4) was also investigated against
various microorganisms with their inhibition zone diameter, as shown in Table 1. Among all, CPADTC-AgNps was
found to be the most effective in inhibition of bacterial growth have comparatively less antibacterial activity to that
of the other standard antibiotics such as chloramphenicol.
IV. FIGURES AND TABLES
NH
NHNH
NH
NH NH
NHNH
S
S
S
S
S
S
S
S
H5C2C2H5
C2H5H5C2
NH
O
SSH5C2
NH2
O
NH
CS2 / DMSO
Ethyl Iodide

International conference on Science, Technology and Management ICSTM-2015
YMCA, New Delhi (India), 1 Feb 2015 www.conferenceworld.in
595 | P a g e
Fig.1 Synthesis Scheme of meso-tetra(methyl) meso-tetra (4-ethyl carbamodithioate) calix pyrrole (CPADTC)
Fig.2 Synthesis of Silver Nanoparticles
Fig.3a UV spectra of AgNp and CPADTC
NH
NH
NH
NH
CH3
CH3
CH3
CH3
NH
NH NH
NHSC2H5
S
SC2H5
S
H5C2S
S
H5C2S
S
HN HN
HN H
N
CH3
CH3
CH3
CH3
NH NH NHNH
S SSSS SSS
C2H5C2H5C2H5C2H5
AgAgAg Ag Ag Ag Ag Ag Ag Ag Ag Ag Ag Ag
Ag Ag AgAgAgAg AgAg Ag Ag AgAg Ag Ag Ag Ag Ag

International conference on Science, Technology and Management ICSTM-2015
YMCA, New Delhi (India), 1 Feb 2015 www.conferenceworld.in
596 | P a g e
Fig.3b The typical UV/Vis spectra of a) silver nanoparticles in water (10-3
m) b) CPADTC in
methanol (10 -3
m) c) CPADTC capped AgNp (10-3
m)
AgNps and CPADTC- AgNps

International conference on Science, Technology and Management ICSTM-2015
YMCA, New Delhi (India), 1 Feb 2015 www.conferenceworld.in
597 | P a g e
AgNps CPADTC- AgNps
Fig.4 Characterization of CPADTC-AgNp by Atomic force microscopy (AFM) and Dynamic light scattering
(DLS)
Fig.5a)TEM image of CAH reduced AgNPs and (b) particle size distribution graph. (c)EDX results of silver
nanoparticles

International conference on Science, Technology and Management ICSTM-2015
YMCA, New Delhi (India), 1 Feb 2015 www.conferenceworld.in
598 | P a g e
Comp. M.P. UV Elemental analysis
H1NMR (ppm)
C H N S O CH3 Ar Ar
C-
NH
Py
NH
Py
B-
CH
CH2-
CH3
CPADT
C
AgNps
>200 306,44
5
60.23
(62.46)
9.27
(9.71)
5.11
(5.59)
21.98
(22.23)
1.75
(m)
6.4-
6.8
(m)
4.1
(m)
5.1
(s)
5.6
5
(m)
2.91
(q)
3.1( t)
CPADT
C
190-
192
317 51.90
(52.20)
5.21
(5.47)
5.51
(5.85)
26.2
(26.79)
6.45
(6.68)
2.55
(s)
6.5-
7.1
4.0
(s)
- - 2.91
(q)
3.1( t)
Table 1. Characterization of CPADTC by UV, NMR and Elemental analysis
Name of
compound
Zone of inhibition (mm)
E.coli
B.subtilis S.aureus B.megaterium
50 ppm
100 ppm 50 ppm 100 ppm 50 ppm 100 ppm 50 ppm 100 ppm
A* 9
8 10 10 9 8 9 7
1 6
4 7 4 8 8 6 5
2 6
5 4 5 5 5 5 5
3 7
6 6 6 5 5 6 5
4 7
8 9 8 6 5 8 7
A* = Chloramphinicol (Antibiotic control)
Table 2. Antimicrobial activity (Zone of inhibition in mm) of Compounds 1-4.
1. 4-Amino Acetophenone
2. Ethyl (4-acetylphenyl)carbamodithioate
3. CPADTC
4. CPADTC-AgNP

International conference on Science, Technology and Management ICSTM-2015
YMCA, New Delhi (India), 1 Feb 2015 www.conferenceworld.in
599 | P a g e
V. CONCLUSION
In conclusion, an efficient, eco-friendly and simple process has been developed for the synthesis of silver
nanoparticles using CPADTC as reducing, capping as well as stabilizing agent. The Silver nanoparticles exhibited
antibacterial activity against the common pathogens. Dithiocarbamate calix[4]pyrrole assembly was synthesized and
characterized by UV, Mass, NMR and Elemental analysis. Silver nanoparticles has been successfully synthesized by
citrate method and characterized by UV and DLSDithiocarbamate calix[4] pyrrole capped silver nanoparticles
assembly was characterized by UV, DLS and AFM from AFM and DLS the average particles size of
calix[4]pyrrole dithiocarbamate capped silver nanoparticles assembly was found around 185-190nm which indicates
the successfull formation of nano assembly of dithicoarbamate calix[4]pyrrole capped silver nanoparticles. The
results of the antibacterial activity study clearly demonstrated that the colloidal silver nanoparticles inhibited the
growth and multiplication of the tested bacteria, including highly multi resistant bacteria such as Staphylococcus
aureus, Escherichia coli, Bacillus megaterium and Bacillus subtilis . Such high antibacterial activity was observed at
very low total concentrations of silver nanoparticles. These stable silver nanoparticles synthesised by cost effective
reduction method seems to be a promising and an effective antibacterial agent and can have innumerable
applications in different biological fields.
VI. ACKNOWLEDGEMENTS
The authors gratefully acknowledge the financial assistance provided by GUJCOST, Gandhinagar and University
Grant Commission (UGC), New Delhi. The authors also acknowledge CSMCRI (Bhavanagar), GFSU
(Gandhinagar), CDRI (Lucknow) for providing instrumental facilities and INFLIBNET, Ahmedabad for e-journals.
We are also thankful to Department of Microbiology (Gujarat University) for help in antimicrobial studies.
REFERENCES
[1] Evanoff Jr DD, Chumanov G Synthesis and optical properties of silver nanoparticles and arrays.
ChemPhysChem 6 (7),2005, 1221-1231
[2] Nanochemistry SG Synthesis And Stabilization of Nanoparticles, . Elsevier, Amsterdam,2006.
[3] Alivisatos AP Perspectives on the physical chemistry of semiconductor nanocrystals. The Journal of
Physical Chemistry 100 (31),1996,13226-13239
[4] Sergeev GB, Shabatina TI Cryochemistry of nanometals. Colloids and Surfaces A: Physicochemical and
Engineering Aspects 313,2008,18-22
[5] Jin R, Cao YW, Mirkin CA, Kelly K, Schatz GC, Zheng J Photoinduced conversion of silver nanospheres
to nanoprisms. Science 294 (5548),2001,1901
[6] Peyser LA, Vinson AE, Bartko AP, Dickson RM Photoactivated fluorescence from individual silver
nanoclusters. Science 291 (5501),2001,103-106

International conference on Science, Technology and Management ICSTM-2015
YMCA, New Delhi (India), 1 Feb 2015 www.conferenceworld.in
600 | P a g e
[7] Sun S, Murray C, Weller D, Folks L, Moser A Monodisperse FePt nanoparticles and ferromagnetic FePt
nanocrystal superlattices. Science 287 (5460),2000,1989-1992
[8] Mayes E, Bewick A, Gleeson D, Hoinville J, Jones R, Kasyutich O, Nartowski A, Warne B, Wiggins J,
Wong K Biologically derived nanomagnets in self-organized patterned media. Magnetics, IEEE
Transactions on 39 (2),2003,624-627
[9] Han M, Gao X, Su JZ, Nie S Quantum-dot-tagged microbeads for multiplexed optical coding of
biomolecules. Nature biotechnology 19 (7),2001,631-635
[10] Wang J Nanoparticle-based electrochemical DNA detection. Analytica chimica acta 500 (1-2),2003,247-
257
[11] Moreno-Mañas M, Pleixats R Formation of carbon-carbon bonds under catalysis by transition-metal
nanoparticles. Accounts of chemical research 36 (8),2003,638-643
[12] Yamada T, Iwasaki Y, Tada H, Iwabuki H, Chuah M, VandenDriessche T, Fukuda H, Kondo A, Ueda M,
Seno M Nanoparticles for the delivery of genes and drugs to human hepatocytes. Nature biotechnology 21
(8),2003,885-890
[13] Freitas RA What is nanomedicine? Nanomedicine: Nanotechnology, Biology and Medicine 1 (1),2005,2-9
[14] Rojas-Chapana JA, Giersig M Multi-walled carbon nanotubes and metallic nanoparticles and their
application in biomedicine. Journal of nanoscience and nanotechnology 6 (2),2006,316-321
[15] Priya MM, Selvi BK, Paul J (Green Synthesis of silver nanoparticles from the leaf extracts of Euphorbia
hirta and Nerium indicum. DIGEST JOURNAL OF NANOMATERIALS AND BIOSTRUCTURES 6 (2)
2011,869-877
[16] Marambio-Jones C, Hoek EMV A review of the antibacterial effects of silver nanomaterials and potential
implications for human health and the environment. Journal of Nanoparticle Research 12 (5),2010,1531-
1551
[17] Moskovits M Surface-enhanced spectroscopy. Reviews of Modern Physics 57 (3),1985, 783
[18] Jana NR, Sau TK, Pal T Growing small silver particle as redox catalyst. The Journal of Physical Chemistry
B 103 (1),1999,115-121
[19] Shiraishi Y, Toshima N Colloidal silver catalysts for oxidation of ethylene. Journal of Molecular Catalysis
A: Chemical 141 (1),1999,187-192
[20] Morones JR, Elechiguerra JL, Camacho A, Holt K, Kouri JB, Ramírez JT, Yacaman MJ The bactericidal
effect of silver nanoparticles. Nanotechnology 16,2005,2346
[21] Guo JZ, Cui H, Zhou W, Wang W Ag nanoparticle-catalyzed chemiluminescent reaction between luminol
and hydrogen peroxide. Journal of Photochemistry and Photobiology A: Chemistry 193 (2-3),2008,89-96
[22] Dadosh T, Sperling J, Bryant G, Breslow R, Shegai T, Dyshel M, Haran G, Bar-Joseph I Plasmonic control
of the shape of the Raman spectrum of a single molecule in a silver nanoparticle dimer. ACS nano 3
(7),2009,1988-1994

International conference on Science, Technology and Management ICSTM-2015
YMCA, New Delhi (India), 1 Feb 2015 www.conferenceworld.in
601 | P a g e
[23] Pastoriza-Santos I, Liz-Marzán LM Formation of PVP-protected metal nanoparticles in DMF. Langmuir :
the ACS journal of surfaces and colloids 18 (7),2002,2888-2894
[24] Harfenist SA, Wang Z, Alvarez MM, Vezmar I, Whetten RL Highly oriented molecular Ag nanocrystal
arrays. The Journal of Physical Chemistry 100 (33),1996, 13904-13910
[25] Stiger R, Gorer S, Craft B, Penner R Investigations of electrochemical silver nanocrystal growth on
hydrogen-terminated silicon (100). Langmuir : the ACS journal of surfaces and colloids 15 (3),1999,790-
798
[26] Pol VG, Srivastava D, Palchik O, Palchik V, Slifkin M, Weiss A, Gedanken A Sonochemical deposition of
silver nanoparticles on silica spheres. Langmuir : the ACS journal of surfaces and colloids 18
(8),2002,3352-3357
[27] Pal S, Tak YK, Song JM Does the antibacterial activity of silver nanoparticles depend on the shape of the
nanoparticle? A study of the gram-negative bacterium Escherichia coli. Applied and environmental
microbiology 73 (6),2007,1712-1720
[28] Lee PCM, D. . , . J Phys Chem 86,1982,3391.
[29] Ulrich Nickel AzC, Karin Po¨ppl, and Siegfried Schneider A Silver Colloid Produced by Reduction with
Hydrazine asSupport for Highly Sensitive Surface-Enhanced Raman Spectroscopy†. Langmuir : the ACS
journal of surfaces and colloids 16,2000,9087-9091
[30] Ivana Srnova´-Sÿloufova´, Frantisˇek Lednicky´, Antonı´n Gemperle, and, Gemperlova´ J Core-Shell
(Ag)Au Bimetallic Nanoparticles: Analysis of Transmission Electron Microscopy Images. Langmuir : the
ACS journal of surfaces and colloids 16,2000, 9928-9935
[31] Angshuman Pal SS, Surekha Devi Microwave-assisted synthesis of silver nanoparticles using ethanol as a
reducing agent. Materials Chemistry and Physics 114 (2-3)2009,5,30-532
[32] B. Chefetz LS, ‡ M. Pinchas,‡ T. Ginsburg,‡ S. Elmachliy,‡ E. Tel-Or,§ and, A. Gedanken* (New
Approach for the Removal of Metal Ions from Water: Adsorption onto Aquatic Plants and Microwave
Reaction for the Fabrication of Nanometals. J Phys Chem B, Vol. 109 2005,32)
[33] Renjis T. Tom ASN, † Navinder Singh,‡ M. Aslam,§, C. L. Nagendra RP, *,‡ K. Vijayamohanan,*,§ and
T. Pradeep*,† Freely Dispersible Au@TiO2, Au@ZrO2, Ag@TiO2, and Ag@ZrO2 Core-Shell
Nanoparticles: One-Step Synthesis, Characterization, Spectroscopy, and Optical Limiting,Properties.
Langmuir : the ACS journal of surfaces and colloids 19,:2003,3439-3445
[34] Gil-Jae Lee S-IS, Young-Chai Kim, Seong-Geun Oh Preparation of silver nanorods through the control of
temperature and pH of reaction medium Materials Chemistry and Physics 84 (2-3): 2004,197-204
[35] Krzysztof SZCZEPANOWICZ JS, Robert P. SOCHA,, WARSZYŃSKI P PREPARATION OF SILVER
NANOPARTICLES VIA CHEMICAL REDUCTION AND THEIR ANTIMICROBIAL ACTIVITY.
Physicochem Probl Miner Process 45: 2010,85-98

International conference on Science, Technology and Management ICSTM-2015
YMCA, New Delhi (India), 1 Feb 2015 www.conferenceworld.in
602 | P a g e
[36] Temgire MKJ, S.S. ., Optical and structural studies of silver nano-particles. Radiat Phys Chem 71:
2004,1039-1044.
[37] Shin HSY, H.J.; Kim, S.B.; Lee, M.S. , Mechanism of growth of colloidal silver nanoparticles stabilized by
polyvinyl pyrrolidone in γ-irradiated silver nitrate solution. J Colloid Interface Sci 274, : 2004,89-94.
[38] Shameli KA, M.B.; Yunus, W.M.Z.W.; Ibrahim, N.A.; Rahman, R.A.; Jokar, M.;, Darroudi M Silver/poly
(lactic acid) nanocomposites: Preparation, characterization, and antibacterial activity. . Int J Nanomed 5, :
2010,573-579.
[39] Shervani ZI, Y.; Sato, M.; Kawanami, H.; Hakuta, Y.; Yokoyama, T.; Nagase, T.;, Kuneida HA, K. .
Morphology and size-controlled synthesis of silver nanoparticles in aqueous surfactant polymer solutions.
Colloid Polym Sci 286: 2008,403-410.
[40] Tarun Kumar Misra T-SC, Chuen-Ying Liu ∗ Phase transfer of gold nanoparticles from aqueous to organic
solution containing resorcinarene. Journal of colloid and interface science 297: 2006,584-588
[41] R. Balasubramanian JX, Beomseok Kim,, Bryce Sadtler aAW (2001) Extraction and Dispersion of Large
Gold Nanoparticles in Nonpolar Solvents. J Dispersion Science and Technology 22 (5):485-489
[42] Kirsi Salorinne, a, Olga Lopez-Acevedo, b, Elisa Nauha, a, € HH, ab, Nissinen aM, A. Gedanken* Solvent
driven formation of silver embedded resorcinarene nanorods. CrystEngComm, 2012,14:347
[43] ALEXANDER WEI BK, STEPHEN V. PUSZTAY, STEVEN L. TRIPP and, R. Balasubramanian BK,
Steven L. Tripp, Xuejun Wang, Resorcinarene-Encapsulated Nanoparticles: Building Blocks for Self-
Assembled Nanostructures. Journal of Inclusion Phenomena and Macrocyclic Chemistry 41: 2001,83-86
[44] Kevin B. Stavens SVP, Shouzhong Zou,, Ronald P. Andres aAW Encapsulation of Neutral Gold
Nanoclusters by Resorcinarenes. Langmuir : the ACS journal of surfaces and colloids 15 (24): 1999,8338-
8339
[45] R. Balasubramanian BK, Steven L. Tripp, Xuejun Wang,, Marya Lieberman aAW Dispersion and Stability
Studies of Resorcinarene-Encapsulated Gold Nanoparticles Langmuir : the ACS journal of surfaces and
colloids 18: 2002,3676-3681
[46] Rai M, Yadav A, Gade A Silver nanoparticles as a new generation of antimicrobials. Biotechnology
advances 27 (1): 2009,76-83
[47] Feng Q, Wu J, Chen G, Cui F, Kim T, Kim J A mechanistic study of the antibacterial effect of silver ions
on Escherichia coli and Staphylococcus aureus. Journal of biomedical materials research 52 (4): 2000,662-
668
[48] Raimondi F, Scherer GG, Kötz R, Wokaun A Nanoparticles in energy technology: Examples from
electrochemistry and catalysis. Angewandte Chemie International Edition 44 (15),2005,2190-2209

International conference on Science, Technology and Management ICSTM-2015
YMCA, New Delhi (India), 1 Feb 2015 www.conferenceworld.in
603 | P a g e
EXTRACTION TECHNIQUES OF NATURAL
EMULSIFIERS AND CHARACTERIZATION OF
EMULSIONS-A REVIEW
Malini Dasgupta1, SoumenPanda
2, Sneha
3, Rituparna Das
4
1Department of Chemical Engineering, B.M.S.C.E, Bangalore, (India)
2Assistant Professor, Department of Chemical Engineering, B.M.S.C.E, Bangalore, (India)
3Department of Chemical Engineering, B.M.S.C.E, Bangalore, (India)
4Department of Chemical Engineering, B.M.S.C.E, Bangalore, (India)
ABSTRACT
An emulsifier is a molecule with a hydrophobic/lypophilic end and hydrophilic end,respectively. Emulsifiers are
used in stabilizing various oil-in-water and water-in-oil emulsions by reducing the surface energy and surface
tension of the two interfaces. They find wide applications in food and pharmaceutical industries. Many of the
emulsifiers can be obtained from natural sources. Some of them include soya bean, egg yolk, lady’s finger,
orange peels, beeswax etc. This paper is intended to review various extraction techniques and characterization
of naturally obtained emulsifiers. Rheological properties of the extracted yolk-based emulsions and gel
networks of the emulsifiers are also discussed. pH, temperature effects on the emulsions are also enlisted in this
review.
Keywords: Egg-Yolk, Emulsion, Lecithin, Okra, Orange Peel, Pectin, Rheology.
I.INTRODUCTION
Emulsions are one of the most important colloidal systems in which one liquid is dispersed in another
immiscible liquid in the form of tiny droplets as mentioned by(PallabGhosh, 2009)[1].These systems are a very
complex system to be investigated for their intended end use. Emulsions find use in metallurgical,
pharmaceuticals, food cosmetic, building roads, paint industries to name a few. These emulsions from various
industries are ultimately discharged into water bodies and find their way into soil and aquatic ecosystems.
Emulsions in water bodies affect mucous layers in fish that results in easy infection by bacteria, virus and
parasites. They cause damage to the gills. Presence of emulsions also lowers the surface tension, as a result of
which organic chemicals are easily absorbed by fish. They also create oxidative stress on the aquatic life.
Emulsions in large concentrations when discharged into the ecosystem, thus pose serious threat to it. Hence it
becomes important to find emulsifiers that are natural in origin and can suitably be used to replace synthetic
emulsifiers that have an adverse impact on the environment in order to maintain eco-friendly environment.
II. RESEARCH OBJECTIVES
Natural emulsifiers extracted from organic sources such as egg-yolk, orange peels and okra seeds have been
discussed in this review.
III.EXTRACTION OF LECITHIN FROM EGG YOLK

International conference on Science, Technology and Management ICSTM-2015
YMCA, New Delhi (India), 1 Feb 2015 www.conferenceworld.in
604 | P a g e
Hen’s yolk can be found in a number of food products such as mayonnaise, bakery products, salad dressings etc.
The most promising emulsifying components in egg yolk are phospholipids, lipoproteins and proteins (livetin
and phosvitin). As discussed by (Kiosseoglou,2008)[2],preparation and stability of yolk-based products depend
to a large extent on yolk constituent ability, either to adsorb at o/w interfaces and form a strong cohesive film
around oil droplets that stabilises them against coalescence
In the technical note by (Maximiano, Silva, Daghastanl,Araujo, Chaimovich, and Cuccovia 2008)[3]a simple
process of purification of lecithin from egg yolk is illustrated. The common steps in the process include a)
homogenization and extraction of yolks was carried out from fresh eggs using acetone, b) solubilization with
ethanol and solvent elimination and c) repeated solubilization/precipitation was carried out with petroleum ether
or acetone. This crude extract was chromatographed on alumina which was neutral in nature, and was
exhaustively washed with chloroform before elution with chloroform and methanol, which helped in the
sequential separation of fatty acids and lecithin. This fast procedure yields fatty acid-free lecithin at a
competitive cost.
Emulsifying properties of egg yolk as a function of pH and oil volume were studied by (Y. Mine 1998)[4] as
depicted by Fig. 1 and Fig. 2. Egg yolk proteins formed larger emulsion particles at pH 3 and mean droplet size
of the emulsions were decreased with increasing pH. Egg yolk proteins led to the formation of thicker
multilayers at low oil content. However, total protein adsorption ratio against original proteins was 55-65%,
independent to protein as well as oil concentration. Also, Electrophoretic analysis of the egg yolk emulsions
revealed that the main components to adsorb at the interface were granular lipovitellins. The results indicated
that the main contributor for egg yolk emulsion is granules and it can affect the emulsifying properties of egg
yolk at different pH values.
The emulsions prepared from egg yolk are found to have high functional and textural value. Stability and
rheological properties are intimately related to interactions taking place among adsorbed protein molecules
either within the interfacial film or between neighbouring oil droplets. The rheological properties of this system
depend heavily on the size of the oil droplets as well as on oil volume fraction. Spray-dried yolk produces
emulsions exhibiting higher viscoelasticity compared to those of native yolk as discussed by(Chen, Zhang, Sun
and Wei 2014)[8].
IV.EXTRACTION OF PECTIN FROM ABELMOSCHUS ESCULENTUS

International conference on Science, Technology and Management ICSTM-2015
YMCA, New Delhi (India), 1 Feb 2015 www.conferenceworld.in
605 | P a g e
Abelmoschus esculentus or okra has a substantial content of polysaccharide present it that confers it athick and
slimy nature. In the work done by (Georgiadis ,Ritzoulis, Sioura, Kornezou, VasiliadouandTsioptsias,
2011)[5],okra polysaccharide extracts were investigated for their composition and structure. Emulsifier was
characterized for protein content, zeta potential and subjected to high pressure size exclusion chromatography.
Emulsions were prepared by mixing equal volumes of stock emulsion (A) and an okra extract solution (B) of
either hot buffer soluble solids (HBSS) or chelating agent soluble solids (CHSS) or diluted alkali soluble solids
(DASS). It was found that the HBSS extract exhibited extensive flocculation, strong shear-thinning rheology
and fast creaming at low concentration. However at a high concentration (1.25% - 2.5%) creaming greatly
reduces. On the other hand CHSS exhibiting almost the same behaviour did not reduce creaming even at a
concentration of 2.5%. DASS exhibited intermediate behaviour and a concentration of more than 1.65% delayed
creaming.
In another work done by (Gangurde, 2012)[6], emulsifier was extracted from the mucilage content of okra.
Immature fruits were homogenized and extracted using sodium metabisulphate and ethanol. The brown colour
emulsifier powderobtained was pulverized and screened using 80# sieve. The extraction process was followed
by phytochemical evaluation and determination of viscosity, particle size distribution and stability. Results
indicated better properties exhibited by the okra gum as compared to acacia gum.
The emulsifying efficiency and capacity of gum extracted from okra pods in model acidic emulsions of
hexadecane in water at pH 3.0 was investigated by (Alba, Ritzoulis, Georgiadis and Kontogiorgos, 2013)[7].
Isolation of pectin, a heteropolysaccharide, was carried out at a pH of4.0, Okra Extract4 (OE4) and
6.0(OE6)(Fig. 3). OE6 proved to be more stable in terms of droplet size distribution and average droplet size
after 30 days of storage whereas OE4 exhibited Ostwald’s ripening. Interms of viscosity, OE6 showed a value
twice that of OE4.
The effect of extraction parameters of pectin from okra extracts was studied by (Chen,Zhang, Sun and
Wei,2014)[8]. In their work, the parameters studied were effect of pH, temperature, extraction time and liquid-
solid ratio on the pectin yield. Response surface methodology, a statistical method that reduces the number of
trials, was used to optimize the experimental conditions (Fig. 4). Rheological properties were also studied and a
polynomialregression model was used to describe the results. The optimal conditions were a temperature of
40°C, extraction time of 64 minutes, liquid-solid ratio of 42:1 and a pH of 3.9. The emulsions depicted
pseudoplasticbehaviour, high viscosity and shear-thinning behaviour.

International conference on Science, Technology and Management ICSTM-2015
YMCA, New Delhi (India), 1 Feb 2015 www.conferenceworld.in
606 | P a g e
V.EXTRACTION OF PECTIN FROM ORANGE PEEL
Orange peel is a rich source of pectin. Pectin is a natural food-additive used extensively in food industries as a
thickener, a texturizer, a stabilizer and other applications include fat replacer in spreads, salad dressing, ice-
cream etc. as discussed by (Liu, Shi and Langrish, 2006)[9]. Also, according to (Yeoh, Shi and Langrish,
2008)[10] the world market demand for pectin is an excess of 30000 tons annually and growing by 4-5% per
annum. Therefore, it is necessary to establish a method by which the pectin could be extracted in a shorter time
and in better quality.
In a technical note by(Maran, Sivakumar,ThirugnanasambandhamandSridhar ,2013)[11], extraction of pectin
from orange peel using microwave is described. It has many advantages like shorter time, less solvent, higher
extraction, better products with lower cost. The steps associated with this extraction are a) Removal of peels,
fine cutting and drying in a hot oven at 60° C until it attains a constant weight. b) Addition of different amount
of distilled water (10-20-30 ml) with different pH (1-1.5-2) to 1 g of orange peel powder placed in 250 ml Pyrex
beaker. c) Exposure to microwave at different powers (160-320-480 w) for selected irradiation time (60-120-180
s).d) Cooling down to room temperature and filtering using filter. e) Centrifuging filtered extract and
precipitation of supernatant with equal volume of 95% (v/v) ethanol. f) Washing of coagulated pectin with 95%
(v/v) ethanol for three times. g) Drying of wet pectin at 50° C in hot air oven until weight was constant and
weighed.Pectin yield was calculated from following equation proposed by (Li, Jia, Wei and Liu, 2012)[12].
PY= (mo/m) ×100(1)
mo= weight of dried pectin (g)
m= weight of dried orange peel powder (g)

International conference on Science, Technology and Management ICSTM-2015
YMCA, New Delhi (India), 1 Feb 2015 www.conferenceworld.in
607 | P a g e
By studying the experimental data (Fig.5) it was found that extraction efficiency was improved by raising
microwave power from 160 to 480 W. Pectin yield was increased steadily and reached maximum at 125 s, but
excessive time exposure in microwave field may cause the degradation of pectin which was investigated by
(Xianzhe, Fangping, ChenghaiandXiangwen, (2011)[13]. Pectin yield was increasing with decreasing pH value
and increasing solid-liquid ratios (upto 1:16 g/ml).
VI. RESULTS AND DISCUSSION
The review clearly lists down inexpensive and feasible methodologies to extract useful emulsifiers from natural
organic sources. It also explicitly depicts the effect of various parameters on the extraction procedure that would
result in optimization.The emulsions prepared from egg yolk are found to have high functional and textural
valuewhile the extraction of pectin from okra indicated better properties exhibited as compared to acacia gum.
The extraction of pectin from orange peel is also feasible in shorter time, using less solvent, giving higher
extraction and better products with lower cost.Thus; the nature of extracted emulsifiers makes them suitable for
practical applications.
VII. CONCLUSION
Although we have identified few potential sources for extracting the emulsifiers, it becomes important to look
into other potent natural sources. Economizing on the quantity of the initial raw material is also an important
consideration to bear in mind. Varying the initial raw material amount to achieve the best emulsification can

International conference on Science, Technology and Management ICSTM-2015
YMCA, New Delhi (India), 1 Feb 2015 www.conferenceworld.in
608 | P a g e
form the further scope of this review. Extension of the above mentioned laboratory scale extraction to the
commercial scale should also be further looked into.
REFERENCES
[1] P. Ghosh, Colloid and Interface Science (PHI Learning Pvt. Ltd., 358, 182-191, 2009)
[2] V. Kiosseoglou, Egg yolk protein gels and emulsions,Colloid and Interface Science, 8, 2008, 365-370.
[3] Maximiano, F. A. Silva, M. A. Daghastanl, K. R. P. Araujo, P. S. Chaimovich, and I.M. Cuccovia,A
convenient method for lecithin purification from fresh eggs, Quim Nova,2008, 31.
[4] Y. Mine, Emulsifying characterization of hen’s egg yolk proteins in oil-in-water emulsions, Food
Hydrocolloids, 12, 1998, 409-415.
[5] N. Georgiadis,C.Ritzoulis, G. Sioura, P. Kornezou,C.Vasiliadou, and C.Tsioptsias, Contribution of okra
extracts to the stability and rheology of oil-in-water emulsions, Food Hydrocolloids, 25, 2011, 991-999.
[6] A. B.Gangurde, Preliminary characterization of Abelmoschus esculentus (L.) pod mucilage as o/w type
emulsifier, International Journal of Advances in Pharmacy, Biology and Chemistry, 1(1), 2011.
[7] K.Alba,C.Ritzoulis, N.Georgiadis, andV. Kontogiorgos, Okra Extracts as emulsifiers for acidic
emulsions.Food Research International, 54, 2013, 1730-1737.
[8] Y. Chen, J. G. Zhang, H. J. Sun, and Z. J Wei, Pectin from Abelmoschus esculentus; Optimization of
extraction and rheological properties.International Journal of Biological Macromolecules, 70, 2014, 498-
505.
[9] Y. Liu, J. Shi, andT. A. G. Langrish, Water-based extraction of pectin flavedo and albedo of orange
peels, Chemical Engineering Journal, 120, 2013, 203-209.
[10] S. Yeoh, J. Shi,andT. A. G. Langrish,Comparisons between different techniques for water-based
extraction of pectin from orange peels,Desalination, 218, 2008, 229-237.
[11] J. P. Maran, V. Sivakumar, K. Thirugnanasambandham, and R Sridhar, Optimization of microwave
assisted extraction of pectin from orange peels, Carbohydrate Polymers, 97, 2013, 703-709.
[12] D. Q. Li, X. Jia, Z. Wei and Z. Y. Liu, Box–Behnken experimental design for investigation of microwave-
assisted extracted sugar beet pulp pectin, Carbohydrate Polymers, 88(1), 2012, 342–346.
[13] Z. Xianzhe, Y. Fangping, L. Chenghai and X. Xiangwen, Effect of process parameters of microwave
assisted extraction (MAE) on polysaccharides yield from Pumpkin, Journal of Northeast Agricultural
University 8(2), 2001, 79–86.
Biographical Notes
Ms. Malini Dasguptais presently pursuing B.E final year in Chemical Engineering Department, B.M.S.C.E,
Bangalore, India.
Mr. Soumen Panda, M.Tech, is working as an Assistant Professor in Chemical Engineering Department,
B.M.S.C.E, Bangalore, India.
Ms. Sneha is presently pursuing B.E final year in Chemical Engineering Department, B.M.S.C.E, Bangalore,
India.
Ms. Rituparna Das is presently pursuing B.E final year in Chemical Engineering Department, B.M.S.C.E,
Bangalore, India.

International conference on Science, Technology and Management ICSTM-2015
YMCA, New Delhi (India), 1 Feb 2015 www.conferenceworld.in
609 | P a g e
IMPLEMENTATION OF TRUST RANK ALGORITHM
ON WEB PAGES
1Mrs.Pallavi Chandratre,
2Prof. UmeshKulkarni
1ME Computer,
2DepartementOf Computer Engg.
Vidyalankar Institute of Technology, Mumbai (India)
ABSTRACT
On every e-commerce web sites how to use web mining technology for providing security is a big issue. The
connection between web mining security and ecommerce analyzed based on user behavior on web . Based on
customer behavior different web mining algorithms and security algorithm are used to provided security on e-
commerce web sites. In order to provide security this application will develop false hit database algorithm, nearest
neighbor algorithm and trust rank algorithm to provide security on e-commerce web site.
Keyword: Web Mining,Security, E- Commerce.
I INTRODUCTION
The World Wide Web popularity leads to a revolution towards electronic commerce. Network transactions,
electronic payments and on-line receipts are changing the traditional ways of doing business. Many companies take
benefits of the e-commerce chances and other institutions will follow. The rapid growth of e-commerce is attracting
the attention of businesses with its characteristics high-efficiency, low cost, high-profitability and global application.
However, Security fears cause million dollars loss for e-commerce retailers .
Lack of trust is one of the main reasons which can make e-commerce less attractive because of the fear of credit card
numberor sensitive information being stolen[4]. The increasing number of the web security attacks causes fears to
consumers that resulted in lack of trust. Hence, many businesses and internet users are reluctant to use the new
technology.
According to the largest internet security company McAfee , almost half of consumers had terminated an order or
due to security fears. Even in an attempt to get a good deal, 63% consumers will refuse to purchase from a Website
that does not show a Trustmark or security policy. Usually, e-commerce firms seek to get trust of their users by
creating and advertising new security strategies, but the security threat is still growing and affecting e-commerce
firms negatively. The issues of available reliable security technology and exploitation are not only limited to e-
commerce technologies, but also broadly impacting computer and information systems throughout the world

International conference on Science, Technology and Management ICSTM-2015
YMCA, New Delhi (India), 1 Feb 2015 www.conferenceworld.in
610 | P a g e
especially in developing countries because there are many gaps and lack of awareness as they are still at the
exploratory stages.
1.1 E-Security Issues and Trust
“A security threat has been known as a situation, or event with the potential to effect economic adversity to data or
network resources in the form of destruction, disclosure,modification of data, denial of service, and/or fraud, waste,
and abuse Security, then, is the protection against these threats”. Under this definition, threats can be made either
through network and data transaction attacks, or via unauthorized access by means of defective authentication. This
definition must be tailored in order to be appropriate to consumer transactions to acknowledge that consumer
information has value. For customers, it must be recognized that economic hardship encompasses damages to
privacy as well as theft, of credit information and authentication issues for consumers will be overturned; as in
whether the Web site is „real‟ rather than whether the purchaser's identity is real. This modified definition explains
the security threats from a consumer's point of view. Security inB2C electronic commerce is reflected in the
technologies used to secure customer data. Security concerns of consumers may be addressed by many of the same
technology protections as those of businesses, such as encryption and authentication[1].
Because of all these security issues there is a great need of web security. Therefore the proposed system will
implement the security by implementing the Trust Rank algorithm. The Proposed System consist of three phase‟s
web structure mining analysis, Web Content Mining analysis, decision analysis.
II. WEBMINING FRAMEWORK SYSTEM
Web mining is the use of data mining techniques to automatically discover and extract knowledge from web
documents.web mining is the information service centre for news, e-commerce, and advertisement, government,
education, financial management, education, etc. We have developed Web mining framework for evaluating
ecommerce web sites[1] .In general web mining task can be classified into web content mining, web structure
mining and web usage mining. Some of the well-known classification techniques for web mining such as like, page
rank algorithm and trust rank algorithm is used in this paper.
III. WEB STRUCTURE MINING ANALYSIS
This phase analyses a web site by using both page rank algorithm and trust rank algorithm. The ranking of a page is
determined by its link structure instead of its content. The trust rank algorithm is procedure to rate the quality of web
sites. The output is quality based score which correspond to trust assessment level of the web site. The initial step is
collects information from web sites and stores those web pages into web repository.

International conference on Science, Technology and Management ICSTM-2015
YMCA, New Delhi (India), 1 Feb 2015 www.conferenceworld.in
611 | P a g e
3.1 Page Rank Algorithm
Page Rank algorithm used by search engine .We have computed page rank of web sites by parse web pages for
links, iteratively compute the page rank and sort the documents by page rank engine .Page Rank algorithm is in fact
calculated as follows
PAR(A)=(1-d) +d(PAR(T1)/OG(T1)+….+PAR(TN)/OG(TN)
Where PAR(A) is the PageRank of page A
0G(T1) is the number of outgoing links from page T1
d is a damping factor in the range 0<d<1 ,usually set to 0.85
The PageRank of web page is calculated as sum of the PageRank of all pages linking to its divided by the number of
links on each of those pages its outgoing link.
3.2 Trust Rank Algorithm
The trust rank algorithm is procedure to rate the quality of web sites. Taking the linking structure to generate a
measure for quality of a page. Steps of Trust Rank algorithm.
1 The starting point of the algorithm is the selection of trusted web pages.
2 Trust can be transferred to other page by linking to them.
3 Trust is propagating in the same was as Page Rank
4 The negative measure is propagating backwards and is a measure of bad pages
5 For the ranking algorithm both measures can be taken into account.
Trust Rank algorithm is in fact calculated as follows
Trust Rank = Trust Rank Of the User + Trust Rank of the Web Page
Trust Rank Of The User : It uses nearest neighbor algorithm.
Whenever user register into the system he has to give the reference of the previous trusted user. The trust value of
the user is calculated as
Trust Value = Trusted value of the referenced user / 2
Trust rank of Web pages :
As the user visit the web page he has to assign the rank value to that particular page.
The number of user visited to that page will give the different rank values to that page. Therefore the final trust rank
of the page is calculated as
Trust value of the Page = Average trust value assign by each user to the page
IV. WEB CONTENT MINING ANALYSIS
Web content mining is defined as searching of new information from web data. Data is retrieved for desired topic by
user. In Web content mining analysis we have taken example product categories & their features associated with
them.

International conference on Science, Technology and Management ICSTM-2015
YMCA, New Delhi (India), 1 Feb 2015 www.conferenceworld.in
612 | P a g e
We are performing a cluster analysis on the products in two phases. Hierarchical agglomerative
Clustering is the first step to identify unique skill set clusters. The classification of product is validated into clusters
by performing k-means cluster analysis.
4.1 Hierarchical Agglomerative Clustering
Hierarchical clustering is a bottom-up clustering method where clusters have sub-clusters, which in turn have sub-
clusters, etc. The classic example of this is species taxonomy. Gene expression data might also exhibit this
hierarchical quality (e.g. neurotransmitter gene families). Agglomerative hierarchical clustering starts with every
single object (gene or sample) in a single cluster. Then, in each successive iteration, it agglomerates (merges) the
closest pair of clusters by satisfying some similarity criteria, until all of the data is in one cluster. The hierarchy
within the final cluster has the following properties: Clusters generated in early stages are nested in those generated
in later stages. Clusters with different sizes in the tree can be valuable for discovery. A Matrix Tree Plot visually
demonstrates the hierarchy within the final cluster, where each merger is represented by a binary tree.
Process: Assign each object to a separate cluster. Evaluate all pair-wise distances between clusters . Construct a
distance matrix using the distance values. Look for the pair of clusters with the shortest distance. Remove the pair
from the matrix and merge them.Evaluate all distances from this new cluster to all other clusters, and update the
matrix. Repeat until the distance matrix is reduced to a single element.
Advantages: It can produce an ordering of the objects, which may be informative for data display. Smaller clusters
are generated, which may be helpful for discovery.
4.2 K-Means Cluster Analysis
K-means clustering is a method of cluster analysis which aims to partition n observations into k clusters in which
each observation belongs to the cluster with the nearest mean. It is similar to the expectation-maximization
algorithm for mixtures of Gaussians in that they both attempt to find the centers of natural clusters in the data as well
as in the iterative refinement approach employed by both algorithms.
Process: The dataset is partitioned into K clusters and the data points are randomly assigned to the clusters resulting
in clusters that have roughly the same number of data points. For each data point: Calculate the distance from the
data point to each cluster. If the data point is closest to its own cluster, leave it where it is. If the data point is not
closest to its own cluster, move it into the closest cluster. Repeat the above step until a complete pass through all the
data points results in no data point moving from one cluster to another. At this point the clusters are stable and the
clustering process ends. The choice of initial partition can greatly affect the final clusters that result, in terms of
inter-cluster and intra cluster distances and cohesion.
Advantages: With a large number of variables, K-Means may be computationally faster than hierarchical clustering
(if K is small).K-Means may produce tighter clusters than hierarchical clustering, especially if the clusters are
globular.

International conference on Science, Technology and Management ICSTM-2015
YMCA, New Delhi (India), 1 Feb 2015 www.conferenceworld.in
613 | P a g e
V.DECISION ANALYSIS
This phase uses the total trust of web page generated from Web structure mining analysis phase to perform the
Trust calculation of web site.
VI. MODULES OF THE PROPOSED SYSTEM& ITS ARCHITECTURE
Architecture of the proposed system consist of the following modules
6.1 User Identification
Users are of different categories. New Users will get registered in the system. Existing users can logon to their
account. Administrator has the highest priority. Generate user profiles based on their access patterns.The
administration login module is as follows.
The user login module is as follows.

International conference on Science, Technology and Management ICSTM-2015
YMCA, New Delhi (India), 1 Feb 2015 www.conferenceworld.in
614 | P a g e
After admin has login into the system he can view number of approved users in the system,productwise analysis of
the system & analysis chart of the system. With the help of analysis chart admin can analysis the last 4 weeks
products updates.
6.2 E-Commerce Module
This will facilitate users to add products and their features into the system in a particular format. It will also facilitate
to view the valid product list populated. This will lead to generation of pages related to products which will be
validated for its trust level based on the Trust Rank mechanism.
1) Add Product Module
This module facilate the user to add the products & their features into the system

International conference on Science, Technology and Management ICSTM-2015
YMCA, New Delhi (India), 1 Feb 2015 www.conferenceworld.in
615 | P a g e
2) Edit Profile Module
User can edit his own profile by using this module.g.change address, change email-id etc.
3) Pending Approval Module
As each user registered in the system he has to give reference email address of another user. User can enter into the
system if the refered user will approve him. This module will display the pending approval for the user.

International conference on Science, Technology and Management ICSTM-2015
YMCA, New Delhi (India), 1 Feb 2015 www.conferenceworld.in
616 | P a g e
6.3 Product Search Module
This module will facilitate searching of the products present in the product list based on the keyword specified as
well as the Trust Rank associated with the product. Thereby, the user will be facilitated to perform an accurate
searching of products.
As the user enter the product to be search it will display all the products available in the system according to the
keyword & the features of the product.
6.4 Product Clustering
This module will facilitate the system to categorize the products into various categories based on a selected set of
characteristics. These clustered products will be utilized for performing the search process. The cluster database are
as shown

International conference on Science, Technology and Management ICSTM-2015
YMCA, New Delhi (India), 1 Feb 2015 www.conferenceworld.in
617 | P a g e
6.5 Product Page Analysis
This module will facilitate the system to analyze various product pages and finalize the Trust Rank associated with
them. Thereby, the product validity will be decided by the system based on the Rank associated with them. Thus,
only valid products will be displayed by the application on the product page.
VII. CONCLUSION
In this paper we have proposed web mining framework for e-commerce web sites. In web mining framework we
have developed three phases‟ web structure mining analysis, Web Content Mining analysis, decision analysis. In
web structure mining analysis we have used page rank algorithm and trust rank algorithm. In Web Content Mining
analysis we have used Hierarchical agglomerative clustering and k-means cluster analysis. In decision analysis we
have used trust calculation of web site to analyses the result of the evaluation.
REFERENCES
[1] R. Manjusha, Dr.R.Ramachandran, “Web Mining Framework for Security in E-commerce” , IEEE-ICRTIT
2011.
[2]Chuck Litecky, Andrew Aken, Altaf Ahmad, and H. James Nelson, Southern Illinois University,
Carbondale,Mining computing jobs, January/February 2010 IEEE SOFTWARE.

International conference on Science, Technology and Management ICSTM-2015
YMCA, New Delhi (India), 1 Feb 2015 www.conferenceworld.in
618 | P a g e
[3] Lu Tao & Lei Xue , “Study on Security Framework in E-Commerce”,1-4244-1312-5/07 © 2007 IEEE.
[4] Ahmad TasnimSiddiqui ,Arun Kumar Singh ,” Secure E-business Transactions By Securing Web services”978-
0-7695-4853-1/12 © 2012 IEEE.
[5] Jun Li, Dongting Yu, Luke Maurer, “ A Resource Management Approach to WebBrowser Security” 978-1-
4673-0009-4/12 © 2012 IEEE.
[6] Sankar K. Pal, Fellow, IEEE, VarunTalwar, Student Member, IEEE, and PabitraMitra, Student Member, IEEE ,
“Web Mining in Soft Computing Framework:Relevance, State of the Art and Future Directions”, IEEE
TRANSACTIONS ON NEURAL NETWORKS, VOL. 13, NO. 5, SEPTEMBER 2002.
[7]YacineAtif ,”Building Trust in E-commerence”,1089-7801/02 ©2002 IEEE.
[8] HatoonMatbouli&Qigang Gao, “An Overview on Web Security Threats and Impact to E-Commerce Success”,
978-1-4673-1166-3/12 ©2012 IEEE.
[9] Jun Li&Dongting Yu, Luke Maurer ,“A Resource Management Approach to Web Browser Security “,978-1-
4673-0009-4/12©2012 IEEE.

International conference on Science, Technology and Management ICSTM-2015
YMCA, New Delhi (India), 1 Feb 2015 www.conferenceworld.in
619 | P a g e
RELIABLE QSAR FOR ESTIMATING KOC FOR
PERSISTENT ORGANIC POLLUTANTS:
CORRELATION WITH MOLECULAR CONNECTIVITY
INDICES
Manish Rao Ambedkar1, Kushal Kumar
2, Madhu Gupta
3
1, 3 Department Of Chemistry, M. M. H. College Ghaziabad, C.C.S.University Meerut U.P (India)
2 IIMT College of Engineering Greater Noida , Uttar Pradesh Technical University Lucknow U.P. (India)
ABSTRACT
Persistent organic pollutants (POPs) are chemicals that persist for a very long time in the environment and
consequently may concentrate to a high level (106) in the food chain. They may also cause toxic effects on the
animal and human reproduction, development and immunological function. Several recent studies have shown that
the logarithmic n-octanol/water partition coefficient (logKow) may not be a good predictor for estimating soil
sorption coefficients of persistent organic pollutants (POPs), defined here as chemicals with LogKo/w greater then
5. Thus an alternative QSAR model was developed that seems to provide reliable estimates for the soil sorption
coefficients of persistent organic pollutants (POPs). Quantitative structure–activity relationship (QSAR) model for
soil absorption coefficients of 18 persistent organic pollutants (POPs) is analyzed using multiple linear regression
analysis (MLRA) followed by statistical evaluation by SPSS software ( IBM ). In order to indicate the influence of
different molecular descriptors on soil sorption coefficients values and well understand the important structural
factors affecting the experimental values, a set of physiochemical and topological parameters were taken into
consideration. The proposed models gave the following results: the square of correlation coefficient, R2, for the
models with one, two and three molecular descriptors are 0.5960, 0.6738 and 0.8948.
Keywords: Persistent Organic Pollutant ( Pops ) , Quantitative Structure Activity Relationship (QSAR),
SPSS .
I. INTRODUCTION
Persistent organic pollutants (POPs) are chemicals that persist for a very long time in the environment and
consequently may concentrate to a high level (106) in the food chain. The Stockholm Convention, held in May 2001,
focuses on eliminating or reducing releases of 12 POPs, the so-called “Dirty Dozen”. These 12 chemicals include
aldrin, chlordane, DDT, dieldrin, endrin, heptachlor, mirex, and toxaphene used principally as pesticides, two

International conference on Science, Technology and Management ICSTM-2015
YMCA, New Delhi (India), 1 Feb 2015 www.conferenceworld.in
620 | P a g e
industrial chemicals polychlorinated biphenyls and hexachlorobenzene used in industry but also produced
unintentionally together with dioxins and furans. The chemicals known as persistent organic pollutants act as
powerful pesticides and serve a range of industrial purposes. Some POPs are also released as unintended by-
products of combustion and industrial processes.While the risk level varies from POP to POP, by definition all of
these chemicals share four properties:
1) They are highly toxic;
2) they are persistent, lasting for years or even decades before degrading into less dangerous forms;
3) they evaporate and travel long distances through the air and through water; and
4) they accumulate in fatty tissue.
This is a dangerous combination. The persistence and mobility of POPs means that they are literally everywhere in
the world, even in the Arctic, Antarctica, and remote Pacific islands. Their attraction to fatty tissue, known as
"bioaccumulation", means that even though a poison is first dispersed widely and thinly it gradually starts to
concentrate as organisms consume other organisms as they move up the food chain. The chemicals reach magnified
levels – up to many thousands of times greater than background levels – in the fatty tissues of creatures at the top of
the food chain, such as fish, predatory birds, and mammals, including human beings. Worse still, during pregnancy
and breastfeeding these POPs are often passed on to the next generation. Human beings and other mammals are thus
exposed to the highest levels of these contaminants when they are most vulnerable – in the womb and during
infancy, when their bodies, brains, nervous systems, and immune systems are in the delicate process of construction.
Direct contact with POPs can cause acute effects – accidents with pesticides, for example, have killed and seriously
sickened agricultural workers. But the kind of harm caused to human beings by low levels of POPs – cancer,
immune-system disruption, nervous-system damage, liver damage, memory loss, endocrine disruption, birth defects,
other reproductive problems – can be difficult to prove conclusively. It is hard to demonstrate that someone's
immune system is weaker than it might have been, let alone that a particular chemical is the culprit. Nervous-system
damage may result in something as basic and yet as nebulous as a lower level of intelligence. Once again, this can be
hard to demonstrate beyond challenge. But unless precautionary action is taken to curtail exposure to these
chemicals, millions of people – not to mention millions of other creatures ranging from lake trout to penguins – are
likely to suffer terrible harm. They may also cause toxic effects on the animal and human reproduction, development
and immunological function.[1]
Typical examples of these chemicals are Polychlorinated bi phenyls (PCBs), Polychlorinated dibenzo p-dioxims and
furans, polycyclic aromatic hydrocarbons (PAHs) and pesticides such as DDT, Chlordane and Heptachlor. To deal
with POPs, the nations of the world really will have to work together as a team. That will be good for eliminating
the use of these dangerous chemicals and if such cooperation becomes a habit, it could be good for facing up to
many other global problems as well.
One chemical property that is of particular importance in evaluating the fate and persistence of POPs in the
environment is the soil/water partition coefficient normalizes to organic carbon (Koc). Since measured Koc data are
not available for majority of those chemicals, numerous correlations have been developed relating Koc to other

International conference on Science, Technology and Management ICSTM-2015
YMCA, New Delhi (India), 1 Feb 2015 www.conferenceworld.in
621 | P a g e
physicochemical or structural descriptors, in particular with the n-octanal/water partition coefficient (Kow).[2-3]
This
has enabled simple and fast estimation of Koc for POPs.[4]
However, Aleksandar Sabljic et al have observed the breakdown in linear relationship between LogKoc and
LogKow as a chemical’s LogKow reached the range of 6 to 7. Furthermore, Baker et all [5]
Have demonstrated
using a high quality database of LogKoc test using a high quality database of Koc values for 18 POPs that there is
only a week correlation between LogKoc and LogKo/w (R2=0.2940) and its application will result in predicted
values which may be off by a factor of 15.[6-9]
Many coworkers has shown correlation with LogKoc.
II. MATERIALS AND METHODS
2.1. Data Set
All data of the present investigation were obtained from the reference ( Aleksandar Sabljic et al., 2000). The data set
for this investigation consisted of 18 POPs is reported into ( Table no. 1).
2.2. Molecular Descriptor Generation
To obtain a QSAR model, compounds are often represented by the molecular descriptors. The calculation process of
the molecular descriptors was described as below: The two-dimensional molecular structures of 18 POPs were
drawn by Chem Sketch 12.0 then calculated some parameters. Then this optimize structure files were exported into
software Dragon 6.0 to calculate all kinds of descriptors. The software Dragon 6.0 can calculate Physicochemical
parameters, constitutional, topological, geometrical, descriptors and has been successfully used in various QSAR
researches. Then value of all parameters put into NCSS statistical and data
analysis software or SPSS ( We can also use MSTAT & NCSS instead of SPSS ) statistical and data analysis
software to get data regression and correlation. Constitutional descriptors are related to the number of atoms and
bonds in each molecule. Topological descriptors include valence and non-valence molecular connectivity indices
calculated from the hydrogen-suppressed formula of the molecule, encoding information about the size,
composition, and the degree of branching of a molecule. The topological descriptors describe the atomic
connectivity in the molecule. The geometrical descriptors describe the size of the molecule and require
3Dcoordinates of the atoms in the given molecule. The electrostatic descriptors reflect characteristics of the charge
distribution of the molecule. The quantum chemical descriptors offer information about binding and formation
energies, partial atom charge, dipole moment, and molecular orbital energy levels.
III. RESULTS AND DISCUSSION
By using the multiple linear regression analysis (MLRA) method of QSAR, regression models were developed for
18 POPs. To select the sets of descriptors that are most relevant to logKow & logKoc values and effectively show
the relation between descriptors , logKow & logKoc values of these compounds, three subsets with the descriptors
from one to three were determined to establish the QSAR models. However, Baker et al have observed the
breakdown in linear relationship between LogKoc and LogKow as a chemical’s LogKow reached the range of 6 to

International conference on Science, Technology and Management ICSTM-2015
YMCA, New Delhi (India), 1 Feb 2015 www.conferenceworld.in
622 | P a g e
7. Multi-linear regression method for descriptor selection proceeds with a reselections of descriptors by sequentially
eliminating descriptors which do not match any of the following criteria: (i) the F-test greater than one unit; (ii) R2
value less than a value defined at the start (default 0.01); (iii) the student’s t-test less than that defined (default 0.1);
and (iv) duplicate descriptors having a higher squared inter-correlation coefficient than a predetermined level
(usually 0.8). The next step involves correlation of the given property with (i) the top descriptor in the above list
with each of the remaining descriptors, and (ii) the next one with each of the remaining descriptors, etc. The
goodness of the correlation is tested by the correlation coefficient (R2) and The stability of the correlations was
tested against the cross-validated coefficient (R2 CV). Besides, it will demonstrate which descriptors have bad or
missing values, which descriptors are insignificant, and which descriptors are highly intercorelated .This information
will be helpful in reducing the number of descriptors involved in the search for the best QSAR/QSPR model.
Comparison with Aleksandar Sabljic et al we have observed that in our case R2 for models with one, two and three
molecular descriptors are 0.5960, 0.6738 and 0.8948. Our results are much more superior then the result reported by
Aleksandar Sabljic et al. Therefore simple 2D QSAR reported by us is much betters then the QSAR modeling of
Aleksandar Sabljic et al.
Following topological indices have been calculated using Dragon software and they are reported in (Table no. 2).
The calculating connectivity indices have been calculated is in (Table no. 3). Topological parameters used for
modeling LogKoc value for set of 18 compound’s used in present sturdy, when single parameter is used 17 mono-
parametric model have been obtained. No significant mono-parametric model is obtained. When two parameter are
taken together 10 bi-parametric model have been obtained. Out of 10 bi-parametric models the best model contains
LogKow and J. The R2 value of best model is 0.6377.The best model is as given below.
3.1 Best Bi-Parametric Model
LogKoc=0.3730(±0.1448)LogKow -1.0270(±0.2722)J +5.2507
N=18, Se=0.0805, R2=0.6377, R
2A=0.5894, F-Ratio=13.2040, Q=9.9200
In the above model LogKow has positive coefficient and J has negative coefficient. Suggesting that the high value of
LogKow and low value of J will favor the modeling of LogKoc.
When three parameters are taken together eight tri-parametric models have been obtained. These models are
statistically are better then there bi-parametric models. The best model contains BAC, J and Jhetm having R2 value
0.8277. The model is as given below.
3.2 Best Tri Parametric Model
LogKoc=0.039(±0.0082)BAC -6.3928(±1.0153)J 1.9091(±0.3849)Jhetm +11.4779
N=18, Se=0.0574, R2=0.8277, R
2A=0.7908, F-Ratio=22.4230, Q=15.8498
In the above model BAC and Jhetm have positive coefficient and J has negative coefficient, suggesting that the high
value of BAC and Jhetm and low value of J will favor the modeling of LogKoc.
The observed and estimated activity along with difference the LogKoc values for the compounds used in the present
study using the best model are reported in ( Table no. 5 ). Also the predictive power of the model comes out to be

International conference on Science, Technology and Management ICSTM-2015
YMCA, New Delhi (India), 1 Feb 2015 www.conferenceworld.in
623 | P a g e
0.8277 as demonstrated in ( Figure no. 1). This is also confirm on the basis of cross-validated parameters as reported
in ( Table no. 7 ). A study of (Table no. 6 ) shows that compound no. 6 is serious outlier there for it is not considered
in deriving new models. However we observed improvement in quality of statistics only in all the previously
discussed models. They are reported in ( Table no. 8 ). The new tri-parametric model has now R2 value 0.8948 and
in the best using model the LogKoc values calculated for different compounds and they are reported in ( Table no. 9
). A plot between observed and estimated LogKoc values has been drawn which shown in ( Figure no. 2 ). The
cross-validated parameters are for these models are reported in (Table no. 10). The best model after deleting of
compound no. 6 is as given below.
3.3 Best Tri Parametric Model without considereing compound no. 6
LogKoc=0.0335(±0.0068)BAC -6.1480(±0.8094)J 1.8226(±0.3067)Jhetm +11.4419
N=18, Se=0.0453, R2=0.8948, R
2A=0.8706, F-Ratio=36.8700, Q=20.8816
IV. CONCLUSION
A quantitative structure–activity relationship model was derived to study the logKow and LogKoc values of a
diverse set of 17 POPs. Three QSAR models were developed with the squared correlation coefficient (R2)
of one,
two and three molecular descriptors are 0.5960, 0.6738 and 0.8948. These models showed strong predictive ability.
The present work provides an effective method for the prediction of the logKow and LogKoc values for the POPs.
This study also showed that the utility of the QSAR treatment involving descriptors derived solely from chemical
structure and the correlation equation and descriptors can be used for the prediction of the logKow and LogKoc
values for unknown structures. Following conclusion may be drawn on the basis of above discussion. To understand
the correlated values among the parameters a correlation matrix has been obtained which is demonstrated in (Table
no. 4 ). Close look at this matrix has been obtained which is demonstrated in (Table no. - 4).Close look at this table
revels that…
CO-RELATION
1. The LogKoc has poor co-relation with the Topological parameters used.
2. LogKow has poor co-relation with all the parameter we have used.
3. W has moderate co-relation with Balaban and Balaban type indices, poor co-relation with
BAC and good co-relation with 0X, 1χ, 2χ and 1χv.
4. J and all the Balaban type indices have good co-relation with among themselves and with 0χ,
1χ, 2χ and 3χ.
5. BAC has poor co-relation with all the parameters used.
6. All the Ranadic and Kiren Hall type of connectivity type indices has good co-relation among
themselves except 3χv which has poor co-relation.
REFERENCES
1. Wania, F. ; Mackay, D. ; Environ. Sci. Technol. 30 (1996) 390A-396A.
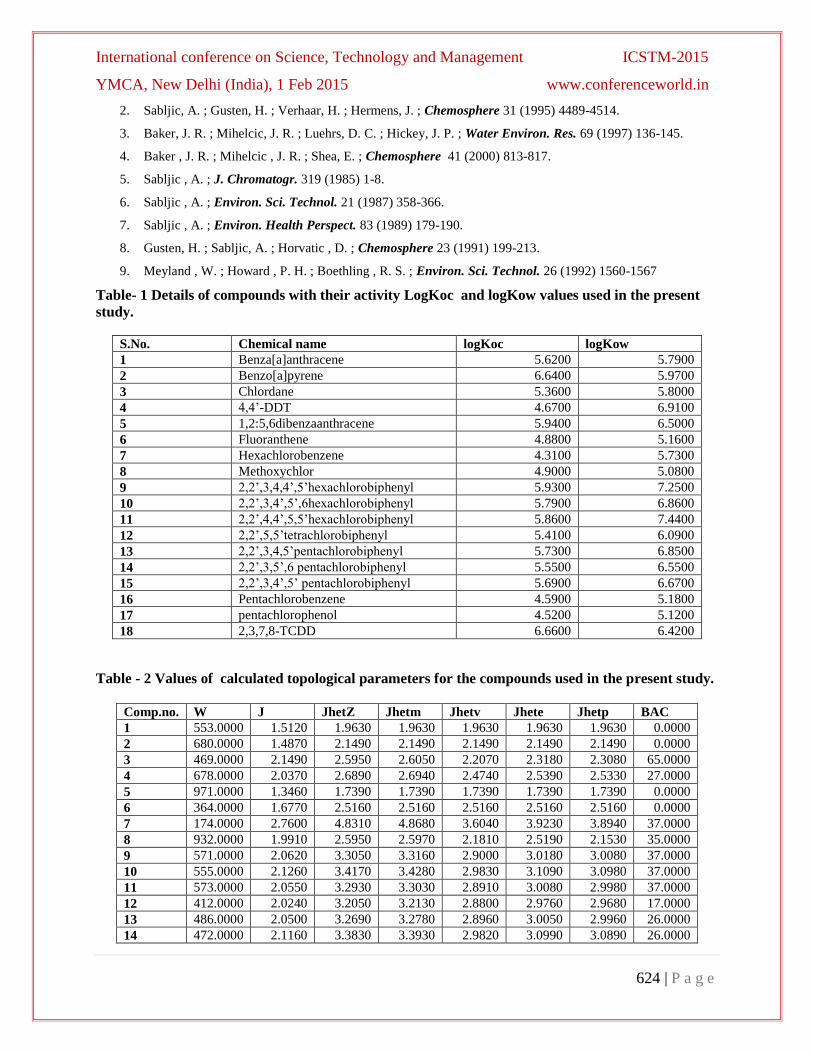
International conference on Science, Technology and Management ICSTM-2015
YMCA, New Delhi (India), 1 Feb 2015 www.conferenceworld.in
624 | P a g e
2. Sabljic, A. ; Gusten, H. ; Verhaar, H. ; Hermens, J. ; Chemosphere 31 (1995) 4489-4514.
3. Baker, J. R. ; Mihelcic, J. R. ; Luehrs, D. C. ; Hickey, J. P. ; Water Environ. Res. 69 (1997) 136-145.
4. Baker , J. R. ; Mihelcic , J. R. ; Shea, E. ; Chemosphere 41 (2000) 813-817.
5. Sabljic , A. ; J. Chromatogr. 319 (1985) 1-8.
6. Sabljic , A. ; Environ. Sci. Technol. 21 (1987) 358-366.
7. Sabljic , A. ; Environ. Health Perspect. 83 (1989) 179-190.
8. Gusten, H. ; Sabljic, A. ; Horvatic , D. ; Chemosphere 23 (1991) 199-213.
9. Meyland , W. ; Howard , P. H. ; Boethling , R. S. ; Environ. Sci. Technol. 26 (1992) 1560-1567
Table- 1 Details of compounds with their activity LogKoc and logKow values used in the present
study.
S.No. Chemical name logKoc logKow
1 Benza[a]anthracene 5.6200 5.7900
2 Benzo[a]pyrene 6.6400 5.9700
3 Chlordane 5.3600 5.8000
4 4,4’-DDT 4.6700 6.9100
5 1,2:5,6dibenzaanthracene 5.9400 6.5000
6 Fluoranthene 4.8800 5.1600
7 Hexachlorobenzene 4.3100 5.7300
8 Methoxychlor 4.9000 5.0800
9 2,2’,3,4,4’,5’hexachlorobiphenyl 5.9300 7.2500
10 2,2’,3,4’,5’,6hexachlorobiphenyl 5.7900 6.8600
11 2,2’,4,4’,5,5’hexachlorobiphenyl 5.8600 7.4400
12 2,2’,5,5’tetrachlorobiphenyl 5.4100 6.0900
13 2,2’,3,4,5’pentachlorobiphenyl 5.7300 6.8500
14 2,2’,3,5’,6 pentachlorobiphenyl 5.5500 6.5500
15 2,2’,3,4’,5’ pentachlorobiphenyl 5.6900 6.6700
16 Pentachlorobenzene 4.5900 5.1800
17 pentachlorophenol 4.5200 5.1200
18 2,3,7,8-TCDD 6.6600 6.4200
Table - 2 Values of calculated topological parameters for the compounds used in the present study.
Comp.no. W J JhetZ Jhetm Jhetv Jhete Jhetp BAC
1 553.0000 1.5120 1.9630 1.9630 1.9630 1.9630 1.9630 0.0000
2 680.0000 1.4870 2.1490 2.1490 2.1490 2.1490 2.1490 0.0000
3 469.0000 2.1490 2.5950 2.6050 2.2070 2.3180 2.3080 65.0000
4 678.0000 2.0370 2.6890 2.6940 2.4740 2.5390 2.5330 27.0000
5 971.0000 1.3460 1.7390 1.7390 1.7390 1.7390 1.7390 0.0000
6 364.0000 1.6770 2.5160 2.5160 2.5160 2.5160 2.5160 0.0000
7 174.0000 2.7600 4.8310 4.8680 3.6040 3.9230 3.8940 37.0000
8 932.0000 1.9910 2.5950 2.5970 2.1810 2.5190 2.1530 35.0000
9 571.0000 2.0620 3.3050 3.3160 2.9000 3.0180 3.0080 37.0000
10 555.0000 2.1260 3.4170 3.4280 2.9830 3.1090 3.0980 37.0000
11 573.0000 2.0550 3.2930 3.3030 2.8910 3.0080 2.9980 37.0000
12 412.0000 2.0240 3.2050 3.2130 2.8800 2.9760 2.9680 17.0000
13 486.0000 2.0500 3.2690 3.2780 2.8960 3.0050 2.9960 26.0000
14 472.0000 2.1160 3.3830 3.3930 2.9820 3.0990 3.0890 26.0000

International conference on Science, Technology and Management ICSTM-2015
YMCA, New Delhi (India), 1 Feb 2015 www.conferenceworld.in
625 | P a g e
15 486.0000 2.0490 3.2670 3.2760 2.8940 3.0040 2.9940 26.0000
16 140.0000 2.6250 4.5490 4.5810 3.4560 3.7430 3.7180 26.0000
17 174.0000 2.7600 4.6700 4.6980 3.4020 3.9330 3.5650 37.0000
18 571.0000 1.6880 2.5360 2.5400 1.5460 2.3980 1.4670 17.0000
Table - 3 Values of calculated connectivity indices for the compounds used in the present study.
Comp.no. 0χ 1χ 2χ 3χ 0χv 1χv 2χv 3χv
1 11.9490 8.9160 7.9860 7.2780 10.1350 6.4820 5.0250 3.9710
2 13.1040 9.9160 9.1280 8.6240 11.1880 7.2500 5.7440 4.6730
3 13.6190 8.1690 8.8580 8.8770 14.5350 8.4150 9.1900 9.2800
4 14.0440 8.8760 8.9320 6.1370 13.3660 7.3430 7.3200 3.8930
5 14.5180 10.8990 9.8910 9.2130 12.5500 8.1720 6.4820 5.2780
6 10.5350 7.9490 7.1390 6.7330 8.7740 5.5650 4.2550 3.4120
7 9.4640 5.4640 5.1550 4.9760 9.8030 4.9020 4.1520 4.0040
8 15.4580 9.9520 9.2700 6.9530 13.9140 7.4340 6.8900 3.8800
9 13.4470 8.4140 8.0040 6.9970 13.1130 6.9670 5.8540 4.6640
10 13.4470 8.4140 8.0350 6.8230 13.1130 6.9670 5.8780 4.4770
11 13.4470 8.3970 8.1340 6.7300 13.1130 6.9610 5.9360 4.3800
12 11.7070 7.5750 7.1190 5.5900 11.0000 5.9940 4.9360 3.2760
13 12.5770 8.0030 7.4960 6.4280 12.0560 6.4830 5.3540 4.1120
14 12.5770 8.0030 7.5280 6.2540 12.0560 6.4830 5.3780 3.9260
15 12.5770 8.0030 7.4980 6.4100 12.0560 6.4830 5.3540 4.1050
16 8.5940 5.0370 4.7680 4.1970 8.7470 4.4120 3.7300 3.2040
17 9.4640 5.4640 5.1550 4.9760 9.1170 4.5580 3.8080 3.4430
18 12.8610 8.5420 8.3640 7.1850 11.6610 6.3940 5.2590 3.8570
Table- 4 Correlation matrix showing inter-correlation among all the parameters with the activity. logKoc log kow W J JhetZ Jhetm Jhetv Jhete Jhetp BAC
logKoc 1.0000
log Kow 0.5422 1.0000
W 0.4987 0.3304 1.0000
J -0.6917 -0.2210 -0.7349 1.0000
JhetZ -0.5818 -0.1600 -0.7944 0.9534 1.0000
Jhetm -0.5825 -0.1613 -0.7947 0.9537 1.0000 1.0000
Jhetv -0.5820 -0.0450 -0.7402 0.8612 0.9211 0.9204 1.0000
Jhete -0.5595 -0.1243 -0.7796 0.9339 0.9918 0.9913 0.9374 1.0000
Jhetp -0.5894 -0.0489 -0.7481 0.8723 0.9270 0.9265 0.9982 0.9361 1.0000
BAC -0.3108 0.1137 -0.2498 0.6787 0.4967 0.4969 0.4179 0.4765 0.4339 1.0000
0χ 0.5177 0.4997 0.9206 -0.5903 -0.7016 -0.7025 -0.6349 -0.6760 -0.6433 0.0661
1χ 0.6224 0.3479 0.9568 -0.8733 -0.9101 -0.9106 -0.8119 -0.8881 -0.8225 -0.3651
2χ 0.6044 0.3997 0.9313 -0.7932 -0.8844 -0.8847 -0.8137 -0.8716 -0.8184 -0.1690
3χ 0.6555 0.2308 0.7347 -0.7815 -0.8445 -0.8438 -0.7999 -0.8646 -0.7916 -0.1866
0χv 0.3623 0.5755 0.6829 -0.2438 -0.4070 -0.4076 -0.3626 -0.3966 -0.3592 0.4686
1χv 0.5231 0.4528 0.8394 -0.6241 -0.7605 -0.7604 -0.6732 -0.7649 -0.6666 0.0855
2χv 0.2347 0.3069 0.6243 -0.3153 -0.5448 -0.5443 -0.5078 -0.5669 -0.4924 0.4074
3χv 0.2037 0.1110 0.2143 -0.1229 -0.3097 -0.3080 -0.3179 -0.3711 -0.2850 0.4927

International conference on Science, Technology and Management ICSTM-2015
YMCA, New Delhi (India), 1 Feb 2015 www.conferenceworld.in
626 | P a g e
0χ 1χ 2χ 3χ 0χv 1χv 2χv 3χv
0χ 1.0000
1χ 0.8887 1.0000
2χ 0.9410 0.9676 1.0000
3χ 0.7190 0.8427 0.8662 1.0000
0χv 0.8981 0.6188 0.7553 0.5547 1.0000
1χv 0.9291 0.8640 0.9461 0.8647 0.8700 1.0000
2χv 0.8025 0.6114 0.7756 0.6846 0.8886 0.9059 1.0000
3χv 0.3983 0.2719 0.4389 0.6621 0.5819 0.6611 0.7912 1.0000
Table- 5 Regression parameters and quality of correlation with Topological and connectivity indices.
Model
No.
Parameter
used
Ai=(1…3) B Se R2 R
2A F –Ratio Q=R/Se
1 LogKow 0.4927(±0.1909) 2.3988 0.1088 0.2940 6.6617 4.9836
2 W 0.0015(±0.0007) 4.6669 0.1122 0.2487 5.2961 4.4447
3 J -1.1816(±0.3084) 7.8441 0.0935 0.4784 14.6744 7.3974
4 Jhetz -0.4505(±0.1574) 6.8480 0.1053 0.3385 8.1870 5.5252
5 Jhetm -0.4458(±0.1555) 6.8379 0.1052 0.3393 8.2165 5.5370
6 Jhetv -0.6773(±0.2366) 7.2408 0.1053 0.3388 8.1968 5.5276
7 Jhete -0.6107(±0.2262) 7.1763 0.1073 0.3130 7.2904 5.2140
8 Jhetp -0.5978(±0.2048) 7.0796 0.1046 0.3474 8.5164 5.6348
9 BAC -0.0123(±0.0094) 5.7555 0.1231 0.0966 1.7105 2.5248
10 0χ 0.1918(±0.0792) 3.0674 0.1108 0.2680 5.8573 4.6722
11 1χ 0.2779(±0.0874) 3.1933 0.1013 0.3873 10.1160 6.1434
12 2χ 0.2866(±0.0944) 3.2426 0.1032 0.3653 9.2077 5.8565
13 3χ 0.3399(±0.0979) 3.1743 0.0978 0.4297 12.0559 6.7026
14 0χv 0.1397(±0.0898) 3.8156 0.1207 0.1313 2.4173 3.0020
15 1χv 0.3214(±0.1309) 3.3533 0.1103 0.2736 6.0276 4.7422
16 2χv 0.1204(±0.1247) 4.7745 0.1259 0.0551 0.9330 1.8644
17 3χv 0.1036(±0.1245) 4.9994 0.1268 0.0415 0.6924 1.6065
18 LogKow
Jhete
0.4362(±0.1604)
-0.5456(±0.1927)
4.2928 0.0907 0.5399 0.4786 8.8010 8.1012
19 J
Jhetm
-2.5690(±0.9898)
0.6518(±0.4434)
8.6253 0.0903 0.5441 0.4833 8.9500 8.1686
20 J
Jhetz
-2.5699(±0.9865)
0.6601(±0.4471)
8.6080 0.0902 0.5446 0.4838 8.9680 8.1814
21 LogKow
Jhetz
0.4188(±0.1602)
-0.3934(±0.1365)
4.0791 0.0902 0.5455 0.4849 9.0010 8.1882
22 LogKow
Jhetm
0.4182(±0.1603)
-0.3890(±0.1350)
4.0732 0.0901 0.5456 0.4850 9.0050 8.1980
23 3χ
LogKow
0.2905(±0.0880)
0.3752(±0.1542)
1.1832 0.0855 0.5911 0.5366 10.8420 8.9921
24 1χv
2χv
1.0639(±0.2391)
-0.6844(±0.1997)
2.3390 0.0853 0.5927 0.5384 10.9120 9.0254
25 LogKow
Jhetv
0.4698(±0.1475)
-0.6502(±0.1889)
4.2621 0.0840 0.6055 0.5529 11.5130 9.2635
26 LogKow
Jhetp
0.4676(±0.1464)
-0.5722(±0.1634)
4.1166 0.0833 0.6116 0.5598 11.8080 9.3883

International conference on Science, Technology and Management ICSTM-2015
YMCA, New Delhi (India), 1 Feb 2015 www.conferenceworld.in
627 | P a g e
27 LogKow
J
0.3730(±0.1448)
-1.0270(±0.2722)
5.2293 0.0805 0.6377 0.5894 13.2040 9.9200
28 1χv
J
Jhetm
0.4616(±0.1567)
-4.0014(±0.9405)
1.7008(±0.5069)
5.2507 0.0734 0.7185 0.6582 11.9100 11.5482
29 0χv
J
Jhetz
0.2178(±0.0677)
-4.0986(±0.9086)
1.4988(±0.4373)
6.5561 0.0708 0.7381 0.6819 13.1490 12.1345
30 BAC
J
Jhete
0.0304(±0.0092)
-4.6496(±0.9736)
1.7656(±0.5197)
9.1212 0.0706 0.7397 0.6839 13.2590 12.1821
31 3χ
2χv
LogKow
0.4728(±0.0969)
-0.2783(±0.0980)
0.4527(±0.1300)
1.0389 0.0705 0.7406 0.6850 13.3210 12.2068
32 2χv
J
Jhetm
0.4690(±0.1388)
-6.0829(±1.2880)
2.5336(±0.6527)
7.2625 0.0694 0.7489 0.6951 13.9190 12.4695
33 2χv
J
Jhetz
0.4698(±0.1382)
-6.0761(±1.2791)
2.5615(±0.6561)
7.1841 0.0692 0.7504 0.6969 14.0300 12.5181
34 BAC
J
Jhetz
0.0391(±0.0082)
-6.3584(±1.0123)
1.9185(±0.3883)
11.4034 0.0576 0.8269 0.7898 22.2950 15.7871
35 BAC
J
Jhetm
0.0393(±0.0082)
-6.3928(±1.0153)
1.9091(±0.3849)
11.4779 0.0574 0.8277 0.7908 22.4230 15.8498
Table- 6 Observed and calculated activity for the compounds using model- 35 (Table - 5)
Comp.
No.
Observed
log koc
Calculated
log koc
Residual
1 5.6200 5.5600 0.0600
2 6.6400 6.0740 0.5660
3 5.3600 5.2650 0.0950
4 4.6700 4.6590 0.0110
5 5.9400 6.1930 -0.2530
6 4.8800 5.5600 -0.6800
7 4.3100 4.5800 -0.2700
8 4.9000 5.0820 -0.1820
9 5.9300 6.0790 -0.1490
10 5.7900 5.8840 -0.0940
11 5.8600 6.0990 -0.2390
12 5.4100 5.3400 0.0700
13 5.7300 5.6510 0.0790
14 5.5500 5.4490 0.1010
15 5.6900 5.6540 0.0360
16 4.5900 4.4630 0.1270
17 4.5200 4.2550 0.2650
18 6.6600 6.2030 0.4570

International conference on Science, Technology and Management ICSTM-2015
YMCA, New Delhi (India), 1 Feb 2015 www.conferenceworld.in
628 | P a g e
y = 0.8276x + 0.9391
R2 = 0.8277
4.20
4.70
5.20
5.70
6.20
6.70
7.20
4.20 4.70 5.20 5.70 6.20 6.70 7.20
Observed logKoc
Cal
cula
ted
logK
oc
Fig- 1 Correlation between Observed and Calculated activity using model no-35 (Table- 5)
Table- 7 cross validated values for Topological and connectivity indices.
S.no. Parameters
used
PRESS SSY PRESS/SSY R2cv PSE SPRESS
1. J 4.1513 3.8074 1.0903 -0.0903 0.4802 0.5093
2. logKow,J 2.8830 5.0756 0.5680 0.4320 0.4002 0.4384
3. J,Jhetm,BAC 1.3710 6.5877 0.2081 0.7919 0.2759 0.3129
Table- 8 Regression parameters and quality of correlation with Topological and connectivity indices after
deleting one compound ( Compound no. 6 ).
Modeln
o.
Parameter
used
Ai=(1…3) B Se R2 R
2a F Ratio Q=R/Se
1 J -1.3224(±0.2811) 8.1906 0.0826 0.5960 - 22.1311 9.3463
2 log Kow
J
0.2786(±0.1525)
-1.1598(±0.2762)
6.1167 0.0769 0.6738 0.6272 14.4620 10.6742
3 J
Jhetm
BAC
0.0335(±0.0068)
-6.1480(±0.8094)
1.8226(±0.3067)
11.4419 0.0453 0.8948 0.8706 36.8700 20.8816
Table- 9 Observed and calculated activity for the compounds after deleting one compound
(compound no. 6) using model no. 3 (Table - 8).
Comp.
No.
Observed
log koc
Calculated
log koc
Residual
1 5.6200 5.7240 -0.1040
2 6.6400 6.2170 0.4230
3 5.3600 5.1540 0.2060
4 4.6700 4.7330 -0.0630

International conference on Science, Technology and Management ICSTM-2015
YMCA, New Delhi (India), 1 Feb 2015 www.conferenceworld.in
629 | P a g e
5 5.9400 6.3360 -0.3960
6 4.3100 4.5850 -0.2750
7 4.9000 5.1070 -0.2070
8 5.9300 6.0470 -0.1170
9 5.7900 5.8580 -0.0680
10 5.8600 6.0670 -0.2070
11 5.4100 5.4240 -0.0140
12 5.7300 5.6840 0.0460
13 5.5500 5.4870 0.0630
14 5.6900 5.6860 0.0040
15 4.5900 4.5230 0.0670
16 4.5200 4.2750 0.2450
17 6.6600 6.2630 0.3970
y = 0.8948x + 0.5763
R2 = 0.8949
4.20
4.70
5.20
5.70
6.20
6.70
7.20
4.20 4.70 5.20 5.70 6.20 6.70 7.20
Observed logKoc
Cal
cula
ted
logK
oc
Fig- 2 Correlation between Observed and Calculated activity using model no. 3 (Table- 8)
Table- 10 cross validated values for Topological and connectivity indices after deleting of one
compound (compound no. - 6).
S.no. Parameters
used
PRESS SSY PRESS/SSY R2cv PSE SPRESS
1. J 3.0775 4.5405 0.6777 0.3223 0.4254 0.4529
2. logKow,J 2.4847 5.1333 0.4840 0.5160 0.3823 0.4212
3. J,Jhetm,BAC 0.8011 6.8168 0.1175 0.8825 0.2170 0.2482