AN ANALYTICAL FRAMEWORK - EOC Review of Accountabilit… · ·...
45
SOUTH CAROLINA ACCOUNTABILITY REVIEW & REVISION: AN ANALYTICAL FRAMEWORK Sarah K. Collins, Innovation Lead Whitney DavisMolin, Lead Researcher Dr. Charis McGaughy, Director of Research Dr. David T. Conley, CEO Educational Policy Improvement Center (EPIC)
-
Upload
vuongthuan -
Category
Documents
-
view
214 -
download
1
Transcript of AN ANALYTICAL FRAMEWORK - EOC Review of Accountabilit… · ·...

SOUTH CAROLINA ACCOUNTABILITY
REVIEW & REVISION:
AN ANALYTICAL FRAMEWORK
Sarah K. Collins, Innovation Lead Whitney Davis-‐Molin, Lead Researcher
Dr. Charis McGaughy, Director of Research Dr. David T. Conley, CEO
Educational Policy Improvement Center (EPIC)

+
This report was prepared on behalf of the South Carolina Education Oversight Committee (EOC). The findings and conclusions contained within are those of the authors and do not necessarily reflect positions or policies of the EOC. ACKNOWLEDGMENTS: The authors wish to thank the staff from the EOC for their collaboration and support of this project, from framing the original analytical and public engagement needs, to organizing the three stakeholder meetings, to synthesizing and operationalizing the findings into concrete next steps for accountability in South Carolina; the 57 individuals who generously gave a collective 228 hours of their time and immeasurable insights to the stakeholder meeting process; and the EOC Cyclical Review Panel for their candor and feedback on the initial findings of the project.
Prepared and published by the Educational Policy Improvement Center (EPIC) 1700 Millrace Drive, Eugene, OR 97403
111 SW Fifth Avenue, Suite 2100, Portland, OR 97204
www.epiconline.org
Copyright © 2013 Educational Policy Improvement Center. All rights reserved.

TABLE OF CONTENTS Introduction………………………………………………………………………………………………………………………1 Stakeholder Meetings..……………………………………………………………………………………………………..2 Analytical Framework………………………………………………………………………………………………………..8 Constellation of Policy Considerations……………………………………………………………………………..15 Conclusion……………………………………………………………………………………………………………………….17 Appendix A: Stakeholder Meeting Raw Data……………………………………………………………………18 Appendix B: Stakeholder Feedback Survey Data………………………………………………………………37 Appendix C: Framework Indicators Defined……………………………………………………………………..41 Appendix D: Framework Criteria Categories and Essential Questions………………………………43

1
INTRODUCTION In 1998, The Educational Accountability Act was passed by the legislature and signed into law for the state of South Carolina. The Act established a performance-‐based accountability system centered on the finding that “South Carolinians have a commitment to public education and a conviction that high expectations for all students are vital components for improving academic achievement.”1 The objectives of the state accountability system were sixfold: 1) to use academic standards to increase student achievement through the alignment of assessments, policies, rewards, and assistance; 2) to provide public report cards of school quality that are clear and defensible; 3) to connect the state system with local accountability; 4) to provide resources to strengthen teaching and learning; 5) to support professional development as a key component of school improvement; and 6) to expand the state’s ability to evaluate the effectiveness of its public education system. Also included in the Act was a provision that the accountability system undergoes a cyclical review and revision process every five years. Prior cyclical reviews have resulted in incremental changes to the component measures of school quality, including adjustments to how high school graduation rates are calculated and the transition away from the PSAT/PLAN assessments. The cyclical review process of 2013, however, is situated within a contemporary policy context that carries deeper and more fundamental questions for a revision of the state accountability system:
• A changing economy is demanding new skills of current and future workers; • South Carolina ranks 37th among the states in adults with post-‐secondary credentials; • Fifteen years into the accountability era, a cohort of chronically low-‐performing schools
has shown little improvement under the current set of measures and stakes; • A wave of local innovation -‐ aided in part by technological advances -‐ is shifting the
delivery unit of learning from seat-‐time to competencies; and • States across the country are leveraging lessons learned from the early era of
accountability to engage in wholesale redesigns for “next generation” accountability systems.
To support the cyclical review process with an evidence-‐based analytical framework of accountability redesign and associated trade-‐offs, the Education Oversight Committee (EOC) contracted the services of the Educational Policy Improvement Center (EPIC). Since January of this year, EPIC has engaged in a three-‐part research initiative, conducting an environmental scan to understand the current policy context of South Carolina and to identify “peer state” accountability models, designing and facilitating a series of regional meetings to elicit the values and priorities of stakeholders in the education system, and constructing an analytical framework based on findings from those stakeholder meetings. The purpose of this document is to provide a summary report of these research activities alongside the formal presentation of the resulting analytical framework.
1 South Carolina Education Accountability Act of 1998; GA Title 59; Chap. 18.

2
STAKEHOLDER MEETINGS In April 2013, three regional stakeholder meetings were held in Charleston, Columbia, and Greenville. EPIC researchers outlined selection criteria emphasizing that the stakeholder groups have diverse representation from K12, early learning, postsecondary, business, parents, and community partners, and the EOC issued invitations to potential participants within its network. In total, 57 stakeholders participated in the meetings across the three locations. A list of the participants and their affiliations can be found in Appendix A. One consistent criticism of policy analysis – research activities similar to the present task of developing an analytical framework – is that it undermines basic democratic processes by replacing public participation with expert analysis.2 Too often, stakeholder meetings constitute a formal presentation of information followed by limited or contrived opportunities for participants to provide feedback. Rather than replicating such a unidirectional approach to stakeholder engagement, these four-‐hour meetings were highly participatory. A series of activities invited stakeholders to act as co-‐designers of the analytical framework, each one intentionally organized to elicit preferences, priorities, and driving rationale for measuring school quality. The following section provides a description of each activity and summarizes high-‐level findings. A full report of the raw data collected at the meetings can be found in Appendix A. Activity: Defining “True North” In the first part of this activity, stakeholders reviewed South Carolina’s definition of accountability and its purpose: “to establish a performance based accountability system for public education which focuses on improving teaching and learning so that students are equipped with a strong academic foundation.”3 Next, participants discussed with a neighbor their personal vision of a strong academic foundation. To capture individual responses, one partner wrote on an index card while the other team member spoke. After five minutes, roles reversed. Reconvening as the larger group, stakeholders expressed components or definitions that emerged across pairs. These components were synthesized on a large butcher paper. This led into the second part of the activity, in which each participant received three voting dots to place on their top three components to be included in the group’s definition of a solid academic foundation. The most highly rated components became the group’s “True North.” The activity closed out with a discussion of how South Carolina’s current accountability measures address or do not address the highest priority components of the group’s True North.
2 Walters, L. C., Aydelotte, J., and Miller, J. (2000). Putting More Public in Policy Analysis. Public Administration Review. Vol. 60 (4): pp 349-‐360. 3 South Carolina Education Oversight Committee (2012). 2012-‐2013 Accountability Manual. Columbia, SC: South Carolina Education Oversight Committee.

3
While stakeholders from each of the regional meetings independently defined their True North, there was surprising consistency across the three groups. The most strongly prioritized components of a solid academic foundation were: 1) literacy and numeracy, and 2) higher-‐order thinking skills. Other prioritized components common across the three stakeholder meetings included: love of learning, college and career readiness, soft skills such as collaboration and personal responsibility, leadership, creativity and innovation, confidence in abilities, learning how to learn, a well-‐rounded education (arts, civics, health, etc.), global literacy, and digital literacy. Activity: Round Robin Tournament of “Peer” States Once participants had a common understanding of South Carolina’s accountability system and a shared definition of a solid academic foundation, stakeholders were briefed on accountability systems of four peer states: Georgia, Florida, Kentucky, and New Hampshire. These states were selected based on the following criteria: 1) the accountability system has a clear theory of action that connects purpose, goals, and indicators; 2) at least one component of the state policy context mirrors the environment of South Carolina; and 3) the state had recently undergone an accountability redesign process, reflecting the most contemporary educational policy agenda and available metrics for measuring school quality. The group discussed distinguishing qualities, strengths, weaknesses, and tradeoffs for each state’s accountability system. In summary, the distinguishing qualities of the state systems are as follows:
• Kentucky.4 Kentucky school ratings are comprised of data from three categories: Next Generation Learners, Next Generation Instruction and Support, and Next Generation Professionals. Within the Learner category, a score for college and career readiness is assigned alongside status, growth, and gap scores scores on subject area tests. The readiness score is computed based on percent of students meeting readiness benchmarks for college (ACT or CAMPASS placement exams), career (WorkKeys or ASVAB plus a specialized technical examination), or both. The Instruction and Support category is constituted by comprehensive school program reviews of subject areas not necessarily assessed by state exams (e.g., arts, world languages, practical living/career studies). The Professionals category takes into account performance evaluations for teachers and administrators.
4 Kentucky Department of Education (2011). ESEA Flexibility Waiver Request. Accessed from US Department of Education website at http://www2.ed.gov/policy/elsec/guid/esea-‐flexibility/index.html
Figure 1. True North results from Columbia.

4
• New Hampshire.5 New Hampshire school ratings are similarly comprised of data from three categories: Knowledge, Skills, and Opportunity. The Knowledge category includes status and growth scores from state standardized tests in ELA, Math, and Science. The Skills category includes student achievement on a set of extended performance tasks designed, administered, and scored by the state. Still in pilot phase and slated for statewide roll-‐out in the 2014-‐15 academic year, these extended performance tasks take 1-‐2 weeks to complete and are designed to assess skills such as complex problem-‐solving, research, and critical thinking. The Opportunity category includes a self-‐assessment (subject to state audit) of whole school programs, including provision of arts and CTE coursework, information technology, and tutoring/mentoring programs.
• Florida.6 Florida school ratings include a number of data sources on student
achievement and success: status and growth scores on state ELA, Math, and Science assessments; participation and performance in accelerated coursework (e.g., AP/IB, Dual Enrollment, industry certifications); students meeting college readiness benchmarks on ACT, SAT, or the state placement exam; and graduation rates. Additionally, Florida calls out its lowest-‐performing students – those students who are struggling the most according to the previous year’s test data – as its primary subgroup of focus. School ratings include percent of the lowest-‐performing 25% of students who are making a year’s worth of progress in reading and mathematics as well as the graduation rates for the lowest-‐performing 25% of students.
• Georgia.7 Georgia recently transitioned its A-‐F school rating system to a numeric score
derived from the College and Career Readiness Performance Index, with its stated goal being “100% of Georgia high school graduates must be college and career ready and supremely competitive with students from all around the globe.” The index score is composed of 19 indicators drawn from the broad categories of content mastery, post-‐high school readiness, and graduation rates:
§ 4-‐year Cohort Graduation Rate § 5-‐year Cohort Graduation Rate § Graduates Entering 2-‐ or 4-‐Year Colleges NOT Requiring Remediation § Average ACT Score § Graduates Completing 3+ Pathway Options in the Arts or World Languages § Students Scoring 3 or Higher on AP Exams and/or 4 or higher on IB exams § Students Completing Accelerated Coursework (Dual Enrollment, AP, IB, etc.) § Graduated Students Earning High School 2+ Credits for a World Language
5 New Hampshire Department of Education (2012). New Hampshire ESEA Flexibility Waiver Request. Accessed from US Department of Education website at http://www2.ed.gov/policy/elsec/guid/esea-‐flexibility/index.html 6 Florida Department of Education (2011). Florida ESEA Flexibility Waiver Request. Accessed from US Department of Education website at http://www2.ed.gov/policy/elsec/guid/esea-‐flexibility/index.html 7 Georgia Department of Education (2011). Georgia ESEA Flexibility Waiver Request. Accessed from US Department of Education website at http://www2.ed.gov/policy/elsec/guid/esea-‐flexibility/index.html
5
§ Students Completing 3+ Designated CTAE Pathway Courses § CTAE Pathway Completers Earning a CTAE Industry-‐Recognized Credential § Students Receiving a Silver or higher on the Georgia Work Ready Assessment § Students Scoring at Meets or Exceeds on End-‐of-‐course-‐exams (9th Grade
Literature, American Literature, Math I/Algebra, Math II/Geometry, Physical Science, Biology, US History, and Economics)
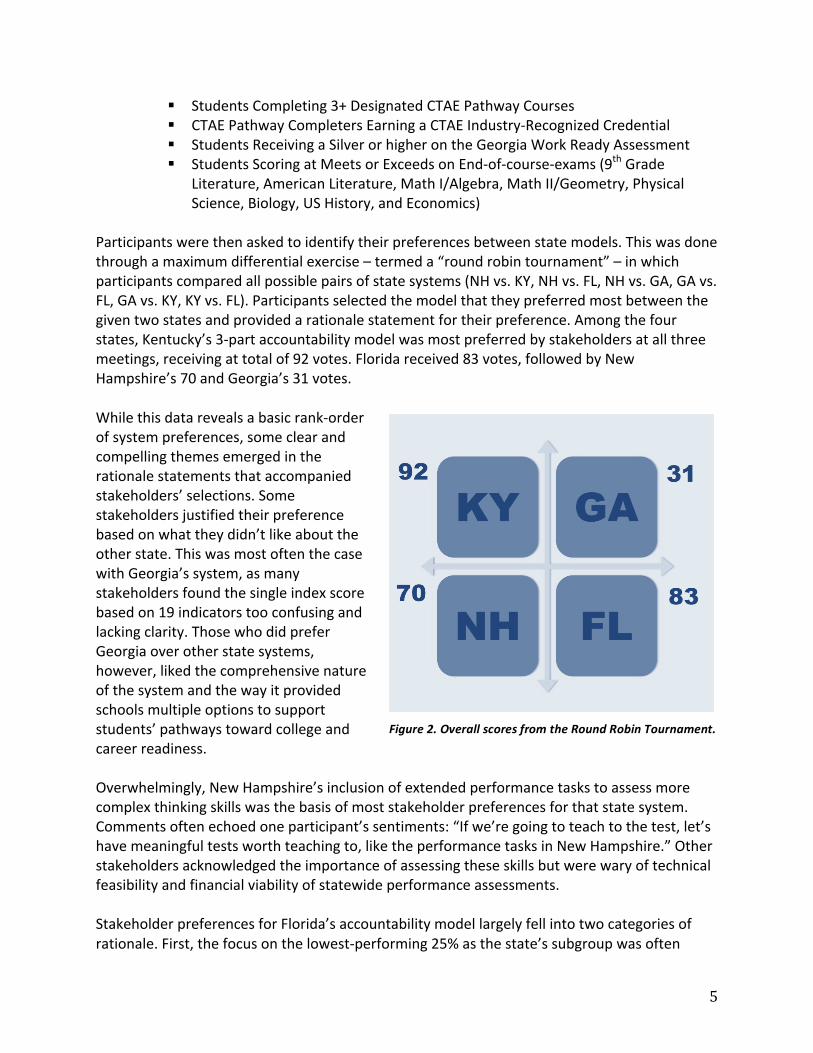
Participants were then asked to identify their preferences between state models. This was done through a maximum differential exercise – termed a “round robin tournament” – in which participants compared all possible pairs of state systems (NH vs. KY, NH vs. FL, NH vs. GA, GA vs. FL, GA vs. KY, KY vs. FL). Participants selected the model that they preferred most between the given two states and provided a rationale statement for their preference. Among the four states, Kentucky’s 3-‐part accountability model was most preferred by stakeholders at all three meetings, receiving at total of 92 votes. Florida received 83 votes, followed by New Hampshire’s 70 and Georgia’s 31 votes. While this data reveals a basic rank-‐order of system preferences, some clear and compelling themes emerged in the rationale statements that accompanied stakeholders’ selections. Some stakeholders justified their preference based on what they didn’t like about the other state. This was most often the case with Georgia’s system, as many stakeholders found the single index score based on 19 indicators too confusing and lacking clarity. Those who did prefer Georgia over other state systems, however, liked the comprehensive nature of the system and the way it provided schools multiple options to support students’ pathways toward college and career readiness. Overwhelmingly, New Hampshire’s inclusion of extended performance tasks to assess more complex thinking skills was the basis of most stakeholder preferences for that state system. Comments often echoed one participant’s sentiments: “If we’re going to teach to the test, let’s have meaningful tests worth teaching to, like the performance tasks in New Hampshire.” Other stakeholders acknowledged the importance of assessing these skills but were wary of technical feasibility and financial viability of statewide performance assessments. Stakeholder preferences for Florida’s accountability model largely fell into two categories of rationale. First, the focus on the lowest-‐performing 25% as the state’s subgroup was often
Figure 2. Overall scores from the Round Robin Tournament.

6
viewed as an innovative and compelling alternative to racial subgroups. “It forces schools to focus on the kids who need the most support,” one stakeholder wrote. Second, the system’s inclusion of participation and performance in accelerated coursework was a compelling feature because: 1) it drove concrete behavior for school improvement beyond just increasing test scores; 2) it forced schools to provide these opportunities to students who might not have otherwise received them; and 3) performance in accelerated coursework had currency outside of the accountability system (i.e. student received college credit or industry certifications for future employment). Similar to this last issue of currency outside the state accountability system, stakeholders often cited the college and career readiness measures for Kentucky’s accountability system as their preference rationale. Each of the assessments used to determine readiness had some sort of portability and value for the student’s future plans, whether its an ACT score for college applications, a WorkKeys score to share with potential employers, or an ASVAB score for entrance into military service. More than the currency of the readiness assessments, however, stakeholders most often cited the “balanced” and “comprehensive” approach to Kentucky’s system that holds schools accountable for student achievement, school programs, and effective educators. “Balanced” and “comprehensive,” however, were not the sole province of the Kentucky system. These descriptors were consistently ascribed to all four systems as qualities stakeholders were looking for in an accountability model. Other common descriptors in stakeholder rationale statements included “innovative,” “feasible,” “meaningful,” “flexible,” and “easy to understand.” Several stakeholders noted how these qualities were often in opposition to one another (e.g., innovation/feasibility of performance assessments or flexibility/clarity of an index score). Others noted that no one system had a combination of qualities that fully satisfied their preferences. The opportunity to select and combine indicators to meet their preferences would be offered in the final two activities, yet with different constraints and tradeoffs attached. Activity: Indicator Matrix In the third activity of the day, participants independently completed a worksheet matrix with twenty-‐eight possible accountability indicators. Each participant individually rated every indicator on a scale of 0-‐3, ranging from 0 (not important) to 3 (most important) as it related to supporting the group’s True North. Stakeholders were also asked to provide a rationale statement for each rating, and they identified their top three indicators with stars. The worksheet also afforded space for indicators that stakeholders felt were missing from the list that supported components of their True North. Data from this activity came in two forms: indicators with the highest average ratings and indicators with the most number of priority stars. Figure 3 provides a side-‐by-‐side comparison of the 10 indicators with the highest average rating and those most prioritized. These two “top 10” lists have interesting commonalities and differences. Given an unlimited set of choices, stakeholders tended to give high ratings to new indicators related to postsecondary readiness

7
and 21st Century skills. In a situation of constrained choices, they selected more traditional measures. In fact, every component of the state’s current accountability was among the stakeholders’ top 10 most prioritized indicators. The only “new” or “innovative” indicators that defied this trend were extended performance tasks, measures of teacher quality, and performance on ACT/SAT, each appearing on both preference lists. Figure 3. Comparison of Highest Average and Most Prioritized Accountability Indicators
Indicators with Highest Average Ratings Most Prioritized Indicators Graduation Rates Reporting on Subgroups Extended Performance Tasks Growth on Standardized Test Scores Growth on Standardized Test Scores Extended Performance Tasks Reporting on Subgroups Graduation Rates Performance on ACT/SAT Absolute Scores on State Standardized Tests Measures of Teacher Quality Performance on ACT/SAT College Remediation Rates/Placement Scores Measures of Teacher Quality College Persistence Rates End of Course Exams Absolute Scores on State Standardized Tests % of students who filled out a career plan Performance in IB/AP HS Exit Exams: ELA and Math Activity: Create Your Prototype In the final activity of the day, stakeholders broke out into small groups to build prototypes of their optimal accountability systems. They used their worksheet matrices, comparable states models, and True North definition to select indicators to include in their systems. A facilitator joined each group to document points of contention, non-‐negotiables, and trade-‐offs that were discussed. The day concluded with each team presenting their system to the larger stakeholder group. The activity’s primary challenge was found in stakeholders reaching consensus on what elements to include in their optimal systems. Some teams accommodated this challenge by including everyone’s favorite indicators, resulting in systems that looked like laundry lists and lacked coherent frameworks. Others had such difficulty coming to agreement on certain issues that their systems were composed of a scant few indicators or key concepts. One interesting outcome of some group systems was the introduction of new indicators that had not yet been addressed in the day yet met criteria and rationale that were consistent through earlier conversations. Specifically, these indicators included a school climate survey and longitudinal tracking of students well into their postsecondary education and/or career path. Appendix A contains a full listing of each group’s prototype with accompanying facilitator notes, yet the following indicators were most common to the group system prototypes:
• Growth Scores on State Standardized Tests • Performance Tasks/Extended Project • Opportunity-‐to-‐Learn Measures • Subgroup Data

8
• Educator Evaluations • Participation and Performance Dual Enrollment/IB/AP • Assessments of Soft Skills • School Climate Surveys • A CCR Indicator (undefined)
In summary, the stakeholders convened by these three regional meetings brought a diverse set of perspectives alongside a shared commitment to improving public education for South Carolina students. Following the meetings, a survey was distributed to participants to gather feedback on their experiences. A full report of survey data is presented in Appendix B, where overall participants reported that the meetings were sufficiently diverse, informative, engaging, and effective in soliciting participants’ insights. In addition to convening an engaging public process, these meetings were successful in gathering a wealth of data to inform the construction of an analytical framework for the Educational Oversight Committee to evaluate options and tradeoffs for the revision of the state’s accountability system, discussed in the next section. ANALYTICAL FRAMEWORK The purpose of this analytical framework is to provide a structure for decision makers to consider the trade-‐offs associated with potential components of the next generation accountability system for South Carolina public schools. Cornerstone to the construction of the framework is the input of stakeholders into its very design. As such, researchers analyzed stakeholder meeting data to generate content for two axes of the framework: a rank-‐order listing of measurement options and a set of criteria to evaluate the extent to which the measures support the state’s (or the stakeholders’ goals and values, at the very least) underlying goals and values.
Figures 4 – 5 – 6. Stakeholders broke into small groups to negotiate and prototype optimal accountability systems.

9
To generate the rank-‐order of potential measures, quantitative data from each of the stakeholder meeting activities was combined into a single preference rating for each indicator identified in the meetings. Rationale statements and facilitator notes then underwent a qualitative coding process, identifying additional counts of indicator preferences to be included in the preference ratings. A normative cut score was identified where overall ratings were two standard deviations from the mean, leaving a total of 29 indicators for consideration in the framework. Because this rating approach was a rough approximation of stakeholder preferences, criteria were sorted based on ratings yet overall scores were not reported in the framework. Appendix C defines each of the following rank-‐ordered indicators:
1) Growth Scores on State Standardized Tests: ELA, Math, Science, Social Studies 2) Extended Performance Tasks 3) Reporting on Subgroups 4) Input measures on School Programs/Program Reviews 5) Graduation Rates 6) Performance on College Aptitude Exam (SAT/ACT) 7) Performance on Commercial Career Readiness Exam (e.g., WorkKeys) 8) Percent Passing College Placement Exams 9) Performance in IB/AP courses 10) Performance in Dual Enrollment 11) Participation in IB/AP courses 12) Participation in Dual Enrollment 13) Educator Evaluations 14) Input measures on Teacher Quality 15) Performance or growth of the lowest 25% 16) College Persistence Rates 17) Absolute Scores on State Standardized Tests: ELA, Math, Science, Social Studies 18) End of Course Exams: ELA, Math, Science, and Social Studies 19) HS Grades 20) Participation in ACT/SAT 21) College Matriculation Rates 22) College Acceptance Rates 23) Self-‐Reported School Climate 24) Metacognitive Assessment 25) % of students who filled out a career plan 26) HS Exit Exams: ELA & Math 27) Performance on military exams 28) % of students completing a college application 29) % of students filling out a FAFSA
To generate the evaluative criteria, stakeholder rationale statements and facilitator notes underwent another qualitative coding process to identify the most prevalent goals and values identified through each of the meeting activities. These goals and values were aggregated into 9 thematic categories, and researchers generated “essential questions” for each category.

10
Documented separately in Appendix D, the criteria categories and essential questions are as follows:
• Basic KSAs: Does it assess the basic knowledge and skills students need to live, learn, and work in the 21st century?
• Higher Order Thinking: Does it assess the critical thinking and complex problem solving skills students need to live, learn, and work in the 21st century?
• Meaningful: Does the measure have meaning or currency outside of the accountability system?
• Clear: Can the measure be clearly communicated and understood by the public? • High Needs: Does it address students with the highest need? • Pathways: Does the measure promote high aspirations, regardless of their future
pathway? (college, career, military) • Feasible: Is it feasible to implement this measure with fidelity at the state level?
(political, administrative, technical) • Whole School: Does it hold the whole school accountable? Does it define quality across
the whole school building? (curriculum, instruction, opportunities to learn, resources) • Aligned: Does it promote alignment across the education system?
With the content of the axes identified based on stakeholder meeting data, researchers then completed the framework by answering the essential questions for each indicator. The extent to which the indicator satisfied each of the criteria was determined on a progressive scale of not met/satisfied, partially or conditionally met/satisfied, and met/satisfied. Figure 7 describes the symbols used in the framework to illustrate the progressive scale. The final element of the analytical framework is a brief discussion of trade-‐offs for each potential indicator. These trade-‐off discussions represent an accumulation of analysis collected through both previous EPIC policy analyses as well as research completed by other leading experts in accountability and educational measurement. The following pages contain the full analytical framework, across 9 evaluative criteria and 28 indicators. A set of recommendations for using the framework closes this section of the report.

Indicator B
asic KS
AH
igher O
rder Thinking
Meaningful
Clear
High
Needs
Pathw
aysFeasible
Whole
School
Aligned
Trade Offs
Overall
Ranking
Grow
th Scores S
tate S
tandardized Tests: grades 3- 8 (E
LA, M
ath, S
cience, and Social
Studies)
Prom
otes alignment and m
easures development over tim
e rather than benchm
ark status. Constraints arehyper focus
on the test scores not addressing whole school quality.
Challenges at exit level w
here large growth gains still don't
meet postsecondary readiness trajectory.
1
Extended P
erformance
Tasks
Generate better data on com
plex thinking, and focuses curriculum
on readiness skills. Tasks must be integrated into
regular instruction and meet techinical adequacy
requirements. Large scale version is not feasible at this
point to without infrastructure to support im
plementation.
2
Reporting on S
ubgroups
Critical to addressing the achievem
ent gap, highly rated by stakeholders. Technical constraints relate to N
size variability - at w
hat point is a subgroup a subgroup, statistically versus reality?
3
Input measures on
School
Program
s/Program
R
eviews
Incentivizes investment in a w
hole school curriculum in
exchange for a focus on activities vs. outcomes. E
nsures curriclum
is aligned with goals, allow
s multiples pathw
ays that all address readiness; requires curriculum
revision as an all-school activity and requires external review
s.
4
Graduation R
ates
Critical prerequisite to postsecondary success; established
and familiar foucs of policy and research; clear target
motivates som
e students. Tends to be more of an
endurance measuer than quality, w
ith tremendous variability
in KS
As and subject to m
anipulation.
5
Perform
ance on College
Aptitude E
xam
(SAT/A
CT)
Exchanging a m
easure that has high currency outside of the system
for a narrow focus and non-actionable data to
inform indivudal student im
porvement. O
ffers longitudinal trend data and is norm
ally distributed. An eligibilty not a
readienss measure; no real or natural cut score.
6
Perform
ance on C
omm
erical Career
Readiness E
xam (e.g.,
WorkK
eys)
Provides an alternative/com
plement to college readiness
measures that is used by em
ployers as well. B
asic skills assessm
ent. Trade currency for rigor/challenge. 7
Percent P
assing College
Placem
ent Exam
s
Useful tool w
ith value outside the system in exchange for a
narrow focus on basic skills. P
rocedural representation of postsecondary readiness. Focuses attention on the problem
and linked to fiscal and financial issues. Diagnostic
at item level analysis w
ith individualized interventions.
8

Indicator B
asic KS
AH
igher O
rder Thinking
Meaningful
Clear
High
Needs
Pathw
aysFeasible
Whole
School
Aligned
Trade Offs
Overall
Ranking
Perform
ance in IB/A
P courses
Expensive for districts, cost-saving for students. E
xternal currency and spans all subject areas. S
ets a high bar. E
xams consistent across disctricts and states; m
ore com
plex assisgments. A
ccess issues, bar might be too high
for all students. Needs C
TE com
plement.
9
Perform
ance in Dual
Enrollm
ent
Requires availability of dual enrollm
ent programs, policy
considerations to promote them
. The higher number of
college credits earned in HS
, the higher the probability of postsecondary success.
10
Participation in IB
/AP
courses
Incentivizes activity over achievement. Increases access to
a high bar for participating students offering more com
plex assignm
ents and expectations. Not all students m
ight need for desired career aspirations. M
easure best implem
ented w
ith CTE
Acceleration/C
ertification for balance.
11
Participation in D
ual E
nrollment
Requires availability of dual enrollm
ent programs, policy
considerations to promote them
. Prom
otes activity vs. perform
ance. Large variance in courses requiring external review
.
12
Educator E
valuations
Holds adults accountable for overall school rating, yet high
variability/unreliable methods for conducting evaluations
when applied to such a high stakes context. A
lso, political feasibility is an issue that m
ust be considered.
13
Input measures on
Teacher Quality
Focusing on inputs (teacher prep) and not student outcom
es in exchange for holding adults accountable in the system
. Need criteria to evaluate the input m
easures, but not strong research to understand relationship betw
een inputs and outcom
es.
14
Perform
ance or growth
of the lowest 25%
Focuses on the students who need the m
ost help a critical population that could span (or be m
issed by) subgroup data, but typically applied to m
easures that focus on content know
ledge.
15
College P
ersistence R
ates
Data system
s and infrastructures challenges. Holding K
-12 accountable for a higher ed m
easure, assumes causation
for an outcome prone to factors beyond the control of K
12 educators.
16

Indicator B
asic KS
AH
igher O
rder Thinking
Meaningful
Clear
High
Needs
Pathw
aysFeasible
Whole
School
Aligned
Trade Offs
Overall
Ranking
Absolute S
cores State
Standardized Tests:
grades 3- 8 (ELA
, Math,
Science, and S
ocial S
tudies)
Narrow
focus on content knowledge, bubble kids, kill/drill.
Well established and typically correlate to first-year college
GPA
. Challenges are that they have low
performance levels
and ceiling effect issues.
17
End of C
ourse Exam
s: E
LA, M
ath, Science, and
Social S
tudies
When done w
ell, EO
C E
xams can represent the cum
ulative know
ledge in core content areas. Too many concerns in the
state about the rigor, quality, and relevance of the current instrum
ents and they are not connected to postsecondary aspirations/pathw
ay.
18
HS
Grades
Well established, fam
iliar to public; somew
hat of a com
posite measure; single m
etric for all subjects and courses; and no additional costs to adm
inister. Challenges
incude highly variable compostion; difficult to say w
hat it m
easures; subject to false precision and gaming.
19
Participation in A
CT/S
AT
Prom
otes an activity that connects to postsecondary aspirations. Incentivizes an activity of taking the test not the quality instruction that prom
otes student success with them
. Trading A
ccess for learning
20
College M
atriculation R
ates
Data and technology infrastructure. Threat of gam
ifaction - pushing students into colleges w
hen they are not ready nor w
anting to go. Measure of how
well high schools focus on
college, tangible goal with strategies to increase; yet
Indicator is influenced by outside factors.
21
College A
cceptance R
ates
Narrow
measure of postsecondary options. N
eeds to be accom
panied by other measures. M
easure of how w
ell high schools focus on college and prom
ote student aspirations; eligibility does not equal readiness.
22
Self-R
eported School
Clim
ate
Can cover a m
uch wider range of variables, can be
sufficiently reliable, relatively inexpensive, and generate actionable inform
ation. Challenges are the general distrust
of self-reported information, can't be linked to high stakes
accountability, and requires addtional time for com
pletion.
23
Metacognitive
Assessm
ent
Can cover a m
uch wider range of variables, can be
sufficiently reliable, relatively inexpensive, and generate actionable inform
ation. Challenges are the general distrust
of self-reported information, can't be linked to high stakes
accountability, and requires addtional time for com
pletion.
24

Indicator B
asic KS
AH
igher O
rder Thinking
Meaningful
Clear
High
Needs
Pathw
aysFeasible
Whole
School
Aligned
Trade Offs
Overall
Ranking
% of students w
ho filled out a career plan
By m
aking it a box to check, may have less m
eaning. Im
portant goal if implem
ented with fidelity providing access
to sometim
es privileged information and advancing
aspirations. Not a m
easure of readiness, many students w
ill change career plans, and w
ide variance in level of effort.
25
HS
Exit E
xams: E
LA &
Math
Too many concerns in the state about the rigor, quality, and
relevance of the current instrument. E
liminating exit exam
w
hile still measuring graduation rates further incentivizes
schools to push students though without having to
demonstrate m
astery at an exit level benchmark.
26
Perform
ance on military
exams
Unique indicator w
ith outside currency for students with
military aspirations; low
passage rates and challenge level to prepare students for a full range of postsecondary options. B
est used as complem
ent with career and college-
oriented measures.
27
% of students
completing a college
application
Important goal for accesssing im
portant privileged procedural inform
ation and goes beyond graduation rates, m
easures aspiration not readiness, can be "gamed" by
having everyone apply and falls short of matriculation.
28
# of Students w
ho fill out a FA
FSA
Requires parent/guardian involvem
ent, need to consider undocum
ented students. Should be accom
panied by other efforts (e.g., financial literacy). C
ould help students who
don't think college is affordable see it as an attainable goal.
29

15
Recommendations for Using the Framework As illustrated in the previous pages, no single indicator addresses all of the framework’s evaluative criteria. Nor should that be the case, as stakeholders consistently called for an accountability model that was both balanced and comprehensive. This design consideration is echoed by the Council of Chief State School Officers’ recent monograph, Roadmap for Next-‐Generation Accountability Systems, which recommends using a mix of indicators to support and enhance student achievement and postsecondary readiness.8 In identifying such a mix of indicators, this analysis recommends starting with those measures included in the current accountability system. Which evaluative criteria do these measures address? Are there certain criteria that are overemphasized in the current system while others go unaddressed? Based on both lessons learned from fifteen years of state accountability and the brief discussions of trade-‐offs in the framework, are there current indicators whose weaknesses outweigh their utility or strengths? To select new -‐ or replace current – indicators for the system, decision makers might consider using convergent consensus. Such a process would check and balance decision makers’ preferences against the rank-‐ordered preferences captured in the stakeholder meetings. Comparing the EOC’s preferences to that of the stakeholders, are there specific evaluative criteria that emerge as taking on greater importance or priority? What’s the basis for this prioritization – political pragmatism, feasibility of implementation, commitment to reform, or otherwise? How does this compare to the underlying values of stakeholders’ prioritization? An effective convergent consensus process would negotiate a middle ground between the priorities of decision makers and stakeholders. Lastly, the identification of indicators should follow some structured framework for defining school quality, combining indicators in such a way that the state’s theory of action or underlying values are clearly communicated. Recalling the structure of Kentucky’s accountability model (Next Generation Learners, Instruction and Supports, and Professionals) or that of New Hampshire (Knowledge, Skills, and Opportunity), what framework of quality will the state’s accountability measures combine to communicate? This framing issue is an important one, understanding that what is measured and reported must be tightly linked to requisite actions, supports, and interventions. CONSTELLATION OF POLICY CONSIDERATIONS The revision of the state accountability system does not operate in isolation. As both a process and final set of decisions, it exists within a constellation of other policy considerations with deep implications for its capacity to measure and drive school quality. While not an exhaustive
8 Council of Chief State School Officers (2011). Roadmap for Next-‐Generation State Accountability Systems. Washington, DC: Council of Chief State School Officers.

16
list, the following considerations were derived from an environmental scan of South Carolina’s policy context and a set of “parking lot” issues generated during the three stakeholder meetings. Multiple Accountability Systems Currently, South Carolina schools are subject to accountability measures under state and federal systems that often send conflicting messages about school quality to educators and the public at large. For example, only one district met its federal Adequate Yearly Progress goals in 2011, meanwhile nearly 70 percent of South Carolina schools were given awards through the state Palmetto Gold and Silver Program that same year.9 Many states used the ESEA Flexibility Waiver as an opportunity to combine federal and state accountability requirements into a single system. Yet such a decision comes with trade-‐offs, exchanging clarity and focus for the constraints of federal requirements. A set of alternatives exist, namely in forms of a “multiple measures” state report card and innovation districts. In a multiple measures report card, the EOC would report those measures of academic knowledge and skills as outlined by federal accountability requirements and managed by the South Caroline Department of Education, alongside new categories of school quality that emerged through the stakeholder meetings and analytical framework (e.g., 21st Century Skills, Opportunities to Learn, and Future Success Indicators). In such a system, schools would aim to earn “straight A’s” across categories rather than a single rating, while at the same time the accountability system itself would communicate a more comprehensive profile of school quality to the public. Innovation districts, as were adopted by the state of Kentucky with through 2012 legislation, constitute a system within a system. In such a design, a select group of districts are released from certain state accountability provisions to develop, pilot, and incubate new models school reform and new measures of school quality. Graduation Requirements Across the three stakeholder meetings, graduation rates were identified as important outcomes, yet concerns were consistently raised as to the quality and rigor of the state’s high school exit exam. This issue has recently been elevated to a critical level with the introduction of legislation to eliminate the exam altogether. These concurrent policy processes raise the fundamental questions of the meaning of a high school diploma, what knowledge and skills are signified by its award, and whether graduation rates then meet the quality criteria of this revision process. Furthermore, if the exit exam is removed from diploma requirements and graduation rates are retained as a component of the state accountability, the issue of “gaming” must be carefully considered. Holding aside considerations of the quality of the exam, the HSA has acted as an external check to the internal process of moving a student through high school to graduation. With no external check, the inclusion of graduation rates in a school rating
9 South Carolina Department of Education (2012). South Carolina ESEA Flexibility Waiver Request. Accessed from US Department of Education website at http://www2.ed.gov/policy/elsec/guid/esea-‐flexibility/index.html

17
creates a perverse incentive for schools to grant diplomas to students who may not necessarily be academically prepared to graduate. There are, however, a number of mechanisms available to address this perverse incentive. An alternative assessment or external milestone could be introduced to state diploma requirements (e.g., a locally-‐administered senior capstone project). Graduation rates could also be given a quality rating. In this measurement approach, two schools with 70% graduation rates would receive different quality ratings if one graduated the majority of its students with the minimum diploma requirements and the other graduated the majority of its students with rigorous coursework (e.g., four years of math and science, a concentration in a career technical field that culminated in an industry certification, or focused pursuit of fine arts). Defining the End Goal Related to (but separate from) the issue of the high school graduation requirements is that of the end goal for students in the South Carolina public education system, and thus the target or “True North” driving school improvement through the state’s accountability system. The Education Accountability Act of 1998 stated a broad goal of equipping students with “a strong academic foundation,” and in 2009 the EOC adopted the 2020 Vision in which “all students will graduate with the knowledge and skills necessary to compete successfully in the global economy, participate in a democratic society, and contribute positively as members of families and communities.” What is lacking, however, is an explicit and actionable description of that academic foundation or the knowledge and skills to successfully learn, live, and work in the 21st Century. Whether termed a college and career readiness definition or otherwise, the adoption of such a description is fundamental to the identification of accountability indicators and alignment with the system’s theory of action. Moreover, the identification of a True North facilitates strategic investments in school and system improvements that are aligned with the state’s accountability system. CONCLUSION The review and revision the state accountability system presents a significant occasion for South Carolina to focus its efforts on impact, opportunity, and innovation. That is no small task, and this analytical framework aims to support the revision process by laying out an array of options, gathering feedback from stakeholders on their priorities and preferences, and exploring the tradeoffs associated with different accountability measures and models.

18
APPENDIX A – Stakeholder Meeting Raw Data In April 2013, three stakeholder meetings were held in Charleston, Columbia, and Greenville. This included a total of 57 participants that were selected by the South Carolina Education Oversight Committee (EOC). Researchers requested that the EOC issue invitations to potential participants within their network. EPIC outlined selection criteria emphasizing that the final group have a diverse representation across K12, Early Learning, Postsecondary, Business, Parents, and Community partners. A list of the participants and their affiliations follow. Stakeholder meetings were specifically designed to elicit preferences, priorities, and driving rationale for measuring school performance. Table A-‐1. Participants from Stakeholder Groups
Participant Affiliation Dr. Tammie Pawloski Director of Center of Excellence to Prepare Teachers for Teaching Students in
Poverty Dr. Windy Schweder Associate Professor of Special Education, USC-‐Aiken Ms. Melanie Cohen Principal, River Springs Elementary School Dr. Karen Woodward Superintendent, Lexington One School District Mr. Chip Jackson Chair, Richland School District Two Board of Trustees Ms. Mary Margaret Hoy Richland School District One, Div. of Accountability Ms. Marjorie Cooper Student at Columbia College, Teaching Fellow interning at EOC Ms. Bunnie Lempesis Ward Director, Early Education and Policy, United Way of the Midlands Ms. Mildred Phyllis Harris Parent Ms. Rebecca Kolb Youth and Family Services Supervisor, Richland Library Mr. Ken May Director, SC Arts Commission Ms. Janet Lawrence-‐Patten Principal, Aynor High School Dr. Reginald Harrison Williams SC State professor Mr. Shawn Rearden Parent Ms. Kristen Setzker Simensen Director, Calhoun County Library Cindy Ambrose CAO, Horry County Schools Phil Waddell South Carolina Chamber of Commerce Lemuel Watson Dean of USC School of Education Dr. Tony Johnson Dean, School of Education, The Citadel Mr. Michael Petry Teacher, Cane Bay High School Mr. Brian Solski Teacher, R.B. Stall High School Gary West Jasper County School District Office Mr. Bill Jordan Public Affairs Consultancy, Jordan House Adrian R. King Parent Ms. Diette Courrege Casey Reporter, Charleston Post and Courier Jon Butzon Charleston Education Network Janet Rose (Retired) Dir. Of Accountability with Charleston County School District Jim Dumm Tara Hall Home for Boys Ms. Eileen Rossier Trident United Way, VP of Education and Program Evaluation Mr. Jim Frye (Retired) Businessman Dr. David Longshore (maybe) SC State Board of Education Ms. Alana J. Ward Parent Ms. Erika Taylor Exec. Dir. Strategy and Communications, Charleston County School District

19
Ms. Lisa Patrick Dept. of Assessment and Accountability, Dorchester School District 2 Jessica Jackson K-‐12, Boeing Barbara Hairfield EOC Ed Moore Berkeley County School District Curriculum Specialist Drew Miller Science Applications Int'l Corp. Sarah Hogenson Boeing Mike Petry Berkeley County School ELA HS Teacher/Business Owner Brian Solski Charleston County HS SS Teacher Sean Alford Dorchester 2 School District Ms. Dana Howard Teacher, Daniel High School Mr. Wallace Hall Director of Special Projects, Greenwood 52 Ms. Dru James SC State Board of Education Glenda Morrison-‐Fair Greenville County School Board Dr. Darryl Owings Superintendent, Spartanburg County School District 6 Ms. Cheryl Smith FLUOR, Community and Public Affairs Lee Yarborough Propel HR and a parent Geier Mullins Director, Public Education Partners William W. Brown Wealth Coach / Family Legacy Inc. Charles Middleton Cyber Academy of NC; Cyclical Review Committee Greg Tolbert Director, Spartanburg Boys and Girls Club Herb Johnson Michelin North America Jason McCreary Greenville County Schools, Div. of Accountability and Quality Assurance Dr. Sandy Addis Associate Director, National Dropout Prevention Center, Clemson University Ms. Jacki Martin The Riley Institute, Furman University Activity: Defining Our “True North” In the first phase of this activity the stakeholder group reviewed South Carolina’s definition of accountability and its purpose: “to establish a performance based accountability system for public education which focuses on improving teaching and learning so that students are equipped with a strong academic foundation” (2012-‐2013 Accountability Manual, Education Oversight Committee). Next, Participants discussed with a neighbor their personal vision of a strong academic foundation. To capture individual responses, one partner wrote on an index card while the other team member spoke. After five minutes, roles reversed. Reconvening as the larger group, stakeholders expressed components or definitions that emerged across pairs. These components were synthesized on a large butcher paper. This led into the second phase of the activity, in which each participant received three voting dots to prioritize the components of a solid academic foundation. They were asked to place their voting dots on the top three components to be included in our group’s definition of a solid academic foundation. The most highly rated components became the group’s True North. The activity closed out with a discussion around South Carolina’s accountability measures and how the current indicators address or do not address the highest priority components of our True North.

20
Table A-‐2. Data collected from True North Activity CHARLESTON COLUMBIA GREENSVILLE
Themes Votes
Themes Votes Themes Votes
Thinking Skills/Analysis 15 Love of learning/motivation
9 College/Career/Citizen Readiness
11
Literacy 10 Thinking and Analyzing Multiple Perspectives, information and creating
7 Knowledge + Skills + Dispositions in context
8
Numeracy 7 Problem Solving 7 Basics R's 8 Soft Skills (Characters, Ownership)
5 Basic Literacy, math, science
6 Beyond the basics (Science skills, civics/history, arts education, physical/health)
5
Learn how to learn 4 Structure of Knowledge -‐ make connections
5 Critical Thinking/Higher Order
3
Multiple Language 4 Full system responsibility 4 Soft Skills 2
Problem Solving 3 Soft Skills -‐ social interactions
2 Communication 1
Current Events, Globally 3 Prep for next level 2 Individualized 1 Modes of Inquiry 3 Ownership of Learning g 2 Healthy Kids -‐ Exercise
and Diet 0
Collaboration Teamwork 2 Internship/community Exposure
2 Leadership 0
Disciplines for Broad Education
2 Life skills 1 Raising the bar to be competitive nationwide
0
Research Evaluating Information
2 Creativity Across Disciplines
1 Social Skills 0
Creativity/Innovation 2 Full Option Graduate 1 Well-‐Rounded Child/Full-‐Option Graduate
0
Digital Literacy 2 Research 0 Desire to Learn 0 Standard English 1 Individualized Learning 0
Civics, Democracy 1 Whole Student -‐ meet where they are at
0
Life Ready Knowledge and Skills
0 College and Career Ready Writing
0
Reading to 12th Grade 0 Motivation 0
Scientific Inquiry 0 Confidence in Abilities/Self-‐Awareness
0
Humanities Beyond Employability
0 Responsibility to community

21
Activity: Comparable States Once participants had a common understanding of South Carolina’s accountability system, stakeholders were briefed on accountability systems of four peer states: Georgia, Florida, Kentucky, and New Hampshire. These four states were selected based on the following criteria: 1) the accountability system has a clear theory of action that connects purpose, goals, and indicators; 2) at least one component of the state policy context mirrors the environment of South Carolina; and 3) the state had recently undergone an accountability redesign process, reflecting the most contemporary policy agenda and available metrics for measuring school quality. The group discussed distinguishing qualities, strengths and weaknesses, and indicator tradeoffs for each state’s accountability system. In summary, the distinguishing qualities of the state systems are as follows:
• Kentucky. Kentucky school ratings are comprised of data from three categories: Next Generation Learners, Next Generation Instruction and Support, and Next Generation Professionals. Within the Learner category, an index score for college and career readiness is assigned alongside status, growth, and gap scores scores on subject area tests. The readiness index is computed based on percent of students meeting readiness benchmarks for college (ACT or CAMPASS placement exams), career (WorkKeys or ASVAB plus a specialized technical examination), or both. The Instruction and Support category is constituted by comprehensive school program reviews of subject areas not necessarily assessed by state exams (e.g., arts, world languages, practical living/career studies). The Professionals category takes into account performance evaluations for teachers and administrators.
• New Hampshire. New Hampshire school ratings are similarly comprised of data from three categories: Knowledge, Skills, and Opportunity. The Knowledge category includes status and growth scores from state standardized tests in ELA, Math, and Science. The Skills category includes student achievement on a set of extended performance tasks designed, administered, and scored by the state. Still and pilot phase and slated for statewide roll-‐out in 2014-‐15, these extended performance tasks take 1-‐2 weeks to complete and are designed to assess skills such as complex problem-‐solving, research, and critical thinking. The Opportunity category includes a self-‐assessment (subject to
Life long learner 0
Global Metric 0
Competency, not seat time 0
Individualized Learning 0 Flexibility/Adaptability 0

22
state audit) of whole school programs, including provision of arts and CTE coursework, information technology, and tutoring/mentoring programs.
• Florida. Florida school ratings include a number of data sources on student achievement
and success: status and growth scores on state ELA, Math, and Science assessments; participation and performance in accelerated coursework (e.g., AP/IB, Dual Enrollment, industry certifications); students meeting college readiness benchmarks on ACT, SAT, or the state placement exam; and graduation rates. Additionally, Florida calls out its lowest-‐performing students – those students who are struggling the most according to the previous year’s test data – as its primary subgroup of focus. School ratings include percent of the lowest-‐performing 25% of students who are making a year’s worth of progress in reading and mathematics as well as the graduation rates for the lowest-‐performing 25% of students.
• Georgia. Georgia recently transitioned its school rating system to its new College and
Career Readiness Performance Index, with stated goal being “100% of Georgia high school graduates must be college and career ready and supremely competitive with students from all around the globe.” The index is composed of 19 indicators drawn from the broad categories of content mastery, post-‐high school readiness, and graduation rates:
o 4-‐year Cohort Graduation Rate o 5-‐year Cohort Graduation Rate o Graduates Entering 2 or 4 Year Colleges NOT Requiring Remediation o Average ACT Score o Graduates completing 3+ Pathway Options in the Arts or World Languages o Students Scoring 3 or Higher on AP Exams and/or 4 or higher on IB exams o Students Completing Accelerated Coursework (Dual Enrollment, AP, IB, etc.) o Graduated Students Earning High School 2+ Credits for a World Language o Students Completing 3+ Designated CTAE Pathway Courses o CTAE Pathway Completers Earning a CTAE Industry-‐Recognized Credential o Students Receiving a Silver or higher on the Georgia Work Ready Assessment o Students Scoring at Meets or Exceeds on End-‐of-‐course-‐exams (9th grade
Literature, American Literature, MathI/Algebra, MathII/Geometry, Physical Science, Biology, US History, and Economics)
Participants were then asked to identify their preferences between state models. This was done through a maximum differential exercise – termed a “round robin tournament” – in which participants compared all possible pairs of state systems (NH vs. KY, NH vs. FL, NH vs. GA, GA vs. FL, GA vs. KY, KY vs. FL). Participants selected the model that they preferred most between the given two states and provided a rationale statement for their preference.

23
Table A-‐3. Data from Round Robin Activity New Hampshire Kentucky
18 29 • Like the extended performance task for it focuses on assessing critical thinking. • More simplified but covers enough areas; project based. • I like the project based assessments; seems more simple. • Extended performance tasks. • Extended performance task; allow for a clearer measure of student ability. • Extended performance tasks can be project based learning with crossover; measures geared toward “real world” application. • NHs extended performance tasks as a measurement are good addition; Kentucky relies on evaluations that can be gamed. Ex. Teacher evaluation. • Seems to be the most comprehensive and thoughtful in terms of helping the state read its long-‐term goals. • Longitudinal data and performance tasks. • Liked the opportunity to assess skills. • Performance tasks. • Like the summative, formative, and interim approach. • Forward thinking and ambitious, balanced. • The opportunity and potential to go beyond into the realm of qualitative measurement. • Although largely undefined, I believe the focus on performance tasks is what results in creating a love of learning in children and a confidence of readiness in a state education’s system. • NH through underdeveloped has a balanced approach. • Skills w/ performance. • I don’t believe test scores are an adequate way to see what students know because they are narrow and never written in a students perspective, so extended performance task are a better way of students being able to show what they learn.
• Provides a range of assessments. • Diversity of evaluation along with teacher accountability. • Student indicators. • Multifaceted; student performance linked to CCR. • System versatility. • More complex measure that is not simplistic. • I like the program reviews and the readiness index; performance tasks may complicate things a bit. • Program reviews. • Prefer the next generation of educators. • Program reviews if they are done thoroughly and objectively; I don’t agree with the use of teacher and principal evaluations. • NH is not practical at this point; KY includes program evaluation and education. • They address the K-‐3 grades. • Innovative Elements (with program reviews and next gen approach) but also doable “realistic” not as “too” outside the box like the NH extended performance tasks. • Looks at varying factors to determine success/achievement (skills, performance, key stakeholders). • More comprehensive/holistic by being international about educator’s quality and their accountability is realistic – fuel system responsibility. • More detail – was easier to feel comfortable it would get measured. • Detailed scoring and college/career preparedness; included instructional/support and professionals. • Includes input, through puts, and outputs. Assessments are portable. Gave kids options. • Looks at teachers, looks at other programs besides the basics, liked the benchmarks for college/career. • I like the fact they are calling out next gen learner, instruction/support, and professionals. • NH not tenable for SC population. • Program reviews, college readiness benchmarks, multiple measure for students, and gap/growth scores. • KY is more comprehensive, more measures. • Many stakeholders involved. • College/Career Readiness, Gap Scores, Program Reviews • Multiple measures, instructional support-‐ applies to teaching and learning. Principal/teacher performance, gap scores, and College and Career. • College/Career Readiness – includes industry aptitude and teacher evals. • You didn’t ask me which I found to be most practical…that’s a whole other story – I like the concept of NHs 2-‐week project -‐ I just can’t see how it’s implemented

24
Florida Kentucky 18 26
• High risk students + accelerated learning. • High risk students. • I like the focus of Florida as opposed to KYs. • Like FL focus on at risk students + accelerated learning. • Florida’s focus on at-‐risk students is a great idea! • Wider range of assessments + inclusion of high risk students. • Florida participation balance and Kentucky is one dimensional. • Florida is attempting to design a system that’s flexible. • Access – gets to the most of student resource equality. • Proven results, subgroups recognized. • Accelerated learning, focus on high risk, looks at low, middle, and high performers. • Focuses on increasing access to AP/IB and focus on lowest 25% + minority groups. • FL drove behavior better. • Lowest 25% growth, accelerated course work available to all students. • Because of their focus on desired outcomes. • FLA rocks – few measures focus on high school performance and pushing schools to push students which is the best measure of future college success.
• Next generation educators – emphasis on teacher performance. • Kentucky has next generation for educators + program reviews. • Programs review. • I like that KY has the option of program reviews and an option for tracking teachers. • More focus on casual factors. • Focus on educational professions and CCR. • Kentucky was my favorite of all – not just focused on a student. • I like the reliance – program reviews and the focus on next generation education. • Focus on school staffing and programs vs. student achievement. • Good components. • Program review is balanced. • Their focus on the readiness in K-‐3. • This is tough. Forced to choose KY in that it is forward focused. Would like to see access to programs as part of the KY system. • Balanced approach. • Varied level of assessment – accountability. • Like systems approach with next generation indicators. • Inclusion – instruction/support & details – college/career. • Evaluate educators and program reviews. • Includes inputs and outputs, portable assessments, exit options. • Readiness index, program reviews, multiple measures of students • College readiness, Gap scores. • College Career Readiness tracks • Multiple measures • The clear breakdown of components that influence. Multiple entry points for success for differently abled students.

25
Georgia Kentucky
9 37 • College and Career Readiness • Wider range of assessments. • Like the focus on factors to create a rating. • I like Georgia’s plan! • Comprehensive; College • Practically speaking? Kentucky works – but this is my choice, right? I still like Georgia’s multiple entry points for influence of all of the members of the school community. • # scale, multiple measures • Graduation Rate.
• Program reviews – match program + achievement. • Fewer measurement indicators for consideration. • KY is slightly better, but neither is acceptable. • Don’t like KYs use of teacher evals, but GA system is too complicated. • Measurements focus on 3 specific areas, not just standards. • I like the program review and next gen educators. • I like the program reviews and next generation educators for their plan. • More inclusive of casual measures. • Next generation educators – emphasis on teacher effectiveness. • Next generation. • I just don’t like GAs at all. • Streamlined and 3 pronged. • More specific access; wider spectrum looked at whole school. • Easier to understand – transparency; system accountability includes educators. • GA is too complicated; KY is balanced. • Has a little focus on K-‐3. • More focused – GA tries to put too much in the formula. • KY seems to be more forward focused and does have program focus that includes things beyond typical standardized areas. • Evaluation included non-‐traditional consideration. • ACT Workkeys, skills assessment. • Readiness allows for different types of learners; program reviews. • Like causal factors in KY. • Seems less complicated. • Varies levels of accountability! • Forward thinking ability to instigate real change “whole system” approach looks at educators, schools, and students. GA seems hard to implement and managed – too complicated and focus is only on students.

26
Georgia Florida 10 36
• Like Georgia’s comprehensive approach vs. Florida’s targeted approach. • Multi-‐path for college/career readiness. • GA more inclusive; not subgroups. • Don’t like FL, GA allows multi-‐dimensions. • College/Career Readiness, multiple facets. • Same old story here…Georgia gives voice to so many stakeholders at the school level and without being across the curriculum will there even be school-‐wide efforts to reform? • No letter grades, # score.
• I like that Florida has the option to look at student grades as an indicators for efficacy; Georgia’s system seems too complicated. • I like the focus on high risk students. • I like the attention or focus on High Risk students. • Florida is better, but not acceptable. • Florida has a good mix and is less confusing. • Focus on high risk students. • Florida – good to focus on at risk students; GA too complicated, impossible to explain to public. • Inclusion of high-‐risk students. • GA is too complicated, FL focuses on high risk students. • Easier to read, better focus on their mission/vision. • Florida has participation: balance ‘jumping off ledge” vs. “being conservative” ; GA is “full” but complicated. Where are special needs students? • Hard to decide, but FL seems easier to implement and understand. Access focus is also a big difference. • Acknowledged awareness of the need to educate ALL kids and especially grouping different populations of students. • Access to courses. • Access/Accelerated. • Opportunities driving behavior – focus on lowest 25%. • Focus on all students and at risk students; proven results. GA is too complicated. • GA is too prescriptive + FL is open access for opportunity • GA is too complicated; FL focus on accelerated learning. • FL is more streamlined and responsive. I like focus on increasing access to AP/IB and on lowest 25%. GA doesn’t include enough incentive for real change. Focus on college/career is too extreme. • Focus on high risk students + subgroups + accelerated learning in readiness index. • Easier to understand; incentive-‐based and access to courses. • Focus on high risk students. • Drives innovation.

27
New Hampshire Florida 18 29
• Unfair to compare schools based upon AP/IB excellent + performance. • Although the Florida focus at risk students, again like the different system of accountability that NH has. • Florida focus on high risk is fools gold, look at total population. • Florida’s approach seems to black or white. • NH more inclusive of student results rather than smaller populations. • NH provides a broader measure. • It’s better. • Again, the NH reliance upon a kind of portfolio assessment has the potential for a more authentic assessment. • Same.. performance tasks, project based learning, real world app. • NH just isn’t well defined in my opinion. • Forced to choose? NH because I think it would be modified to include those incentives (focus on lowest 25% and incentives opportunities) and would still have performance task focus. • Close – NH authentic measure, self-‐assessment, though with FL participation is included. Weakness for both: implementation. • Method of assessment. • Performance tasks. • Tough choice, but skills assessment wins. • Don’t like FL, FL – same out acct stuff. • FL is too predictable and “Safe.” I like focusing on the lowest 25%, but I feel like the middle kids are ignored in the model – and there's the fact that FL’s track record with past data interpretation is a little suspect. So, NH is my winner not because I love it (or completely understand it) but because the gaps and stat quo of some elements of FL are displeasing to me.
• Takes into account high risk/starting point. • Florida because I think they are more defined. • Focus on high risk students. • Florida has a good mix of exactly what it is covering. • Focus on high risk groups – this is the challenge for all states. • Focus on high risk students and accelerated learning. • I think that Florida includes a grading component (looks at course grades). If administered objectively, this should be a good indicator. • Florida is the best so far, but I still don’t like any of the models. • Inclusion of high risk student assessment. • NH is less practical, FL focuses on high risk students. • Looks at all groups and then their focus on high risk students. • Multi-‐cultural recognition of different learners. • Opportunities for accelerated learning – FL drives behavior. • FL was realistic and thoughtful; I like the measurement of performance and access too. Lowest 25% focus is important. • Like breakout of 25%, incentive base for schools to take on more (participation), didn’t fully understand NHs model – vague? • More room for accountability, but hard to navigate. • More specifics available. • Lowest 25% measures of readiness. • Lowest 25% measure, plus push for AP. • Calling out and focusing on lowest 25%. • FLA plan rocks, we can up their 25% to 35% or 40%. • Dual credit/AP; focus on 25%. • Lowest 25%, access to/and performance in rigorous accelerated coursework, performance and gains. • Accelerated coursework, at risk emphasis. • FL because of focus on under performing population and accompanying incentives. • Lowest 25% growth, accelerated course work available to all students.

28
New Hampshire Georgia 34 12
• I think NHs project-‐based learning assessment is an excellent idea! • Again, prefer the possibility of a more meaningful and more authentic assessment of student performance. • Like NHs performance tasks; GA system way too complicated. • Something different then what’s being done in most states – allows more innovation and creativity. • I still don’t like either, but I like GAs even less. • Innovative and like emphasis on project-‐based learning. • Extended performance tasks (focus on what kids can demonstrate). • Impossible to really know without seeing the weights of Georgia’s measures. • Extended performance tasks. • Comprehensive had a lot of soft/squishy stuff. • NH is more simplified but covers what it needs; GA is too complex. • I think GAs system is a bit too complex in terms of a complete measure. • Projects, multi-‐prong. • NHs same as last time. • Speaks to more different and diverse students. • Individualized performance/application based. • NH is trying something different – it could work; GA is too bulky and complicated – I don’t see it making a real impact. • Performance based and longitudinal. • Performance assessment offers great opportunities; GA too cumbersome and complicated. • Performance tasks and GA it too opaque. • Like summative, formative, interim approach – balanced – extended performance task. • Focus is not on tests only. Performance tasks are necessary. Instead of achievement of a set goal. • More clearly defined measures that don’t appear to track students or label them. • Performance tasks would more clearly demonstrate what students can do (not just recall) and would be targeted to real world need (be they college, vocational, life skills, etc.) • Again, unlike NH, GA does not have a balanced approach. They include authentic measures and self-‐assessment. • Focus more on performance then testing. • GA is too complicated; NH input measures. • More holistic; more complete • Simple, allows more targeted resources to schools.
• College Readiness Indicators • CCR; business industry competition • Career Readiness Comprehensive college includes more students, teachers and content and opportunities for various levels of students. • Again broad range of assessments. • Didn’t it choose either because I wasn’t sure about GA and I don’t like NH. • Because they use the indexes instead of just using the standardized test scores. • College/Career, ACT score, Multiple Scores • Dual enrollment and pathway • NH not feasible in SC, GA has many of the good measures • Dual enrollment, pathway courses, holistic approach • All areas of Georgia Index covers entire curriculum of school • More comprehensive, grad rate, more involvement • Modules/lots of options, everyone included. • I love that GA provides involvement for everyone at the school level – despite the fact that it covers an almost obscene number of factors – I can’t imagine helping parents process this information in a meaningful way.

29
Activity: Indicator Matrix Participants completed a matrix with twenty-‐eight possible accountability indicators. Each participant individually rated every measure on a scale of 0-‐3, provided a rationale statement for each rating, and starred their top three indicators. 0: Not Important 1: Low Importance 2: Medium Importance 3: Most Important Participants were asked to list indicators that were missing or that they thought should be represented based on their True North. Table A-‐4. Data collected from Indicator Matrix INDICATORS AVERAGE MODE STARRED
Graduation Rates 2.44 3 9
Extended Performance Tasks 2.39 3 20
Growth Scores State Standardized Tests: grades 3-‐ 8 (ELA, Math, Science, and Social Studies)
2.35 3 21
Reporting on Subgroups 2.29 3 10
Performance on ACT/SAT 2.22 2 4
Input measures on Teacher Quality 2.16 3 5
Percent Passing College Placement Exams 2.06 2 1
College Persistence Rates 2.05 2 3
Absolute Scores State Standardized Tests: grades 3-‐ 8 (ELA, Math, Science, and Social Studies)
2.04 2 9
Performance in IB/AP courses 2.03 2 1
Performance in WorkKeys 2.02 2 4
Input measures on School Programs 2.01 3 2
Participation on ACT/SAT 1.99 2 0
Performance in Dual Enrollment 1.97 2 1
Participation in Dual Enrollment 1.96 2 0

30
End of Course Exams: ELA, Math, Science, and Social Studies 1.92 2 5
Participation in IB/AP courses 1.90 2 0
College Matriculation Rates 1.90 2 2
HS Grades 1.81 2 4
% of student who filled out a career plan 1.79 3 5
College Acceptance Rates 1.78 2 0
Self-‐Reported School Climate 1.72 3 4
ENGAGE or other Metacognitive Assessment 1.71 2 4
HS Exit Exams: ELA & Math 1.67 2 5
Performance on military exams 1.65 2 0
% of students completing a college application 1.27 2 0
# of Students who fill out a FAFSA 0.86 0 0
Activity: Create Your Prototype Participants broke out into small groups to build a prototype of their optimal accountability systems. They used their indicator matrices, comparable states framework, and True North definition to select indicators to include in their hybrid system. A facilitator joined each group to document points of contention, non-‐negotiables, and trade offs that we discussed. Each team presented their system to the larger stakeholder group.

31
Table A-‐5. Prototypes and Facilitator Notes CHARLESTON
Chart Paper Transcript Facilitator Notes Group 1 • Measure growth as opposed to status.
• Focus on low achievers and closing the achievement gap.: sub groups by race are not valuable. • Performance Review (objective and comprehensive) • End of course exams for math, ELA, science, History, Etc.
Group 2 • Growth – long tests thru elementary, middle, and high school. • Subgroups vs. low achievers (?) • Some sort of extended project. • Connectivity.
growth, going back and forth -‐ longitudinal test from element -‐ hs to show growth (learning progression); difficult to agree. Future ready indicators and connectivity (relevance)
Group 3 • Simple, clear • Based on growth • Extended performance • Measure the things that cause learning • Somebodies called to account • Measure what children need to know and be able to do – whatever that is. Sticking Points: • Perceived different between college and career readiness. • Political, economic, community
Simple, clear based on growth (some disagreement) Extended performance measure instead of just a number on a test measure the things that cause learning (need to identify those) Measure or not that makes any difference? Hold the accountability system accountable. Somebody needs to be held accountable.
Group 4 • Comprehensive list of standardize tests/certifications/classes. • Employment -‐> how man hs graduates find employment? Track students post graduation. • Program review • Portfolio review • Teacher development – by actual teachers. • Prerequisite skills updated.
Comprehensive and Varietal -‐ standardized test, certifications -‐Employment: track students post graduation, how many are employed? HS, 2 year, etc. -‐Program Review -‐Portfolio Review Instead of Teacher Evaluation, talking bout teacher development by actual teacher (not someone who hasn't actually been in the college) How to measure what’s necessary in the prerequisites. Tension around hi-‐stakes

33
COLUMBIA
Chart Paper Transcript Facilitator Notes Group 1 • Performance Tasks
•Grades •Well-‐designed standardized tests – performance, growth, readiness baseline, subgroups •Soft Skills •College/Career Readiness •Graduation Rate •Opportunity Measures (programs, facilities, Arts) •Teacher Evaluation •”Schools like ours”
Performance tasks Grades Well designed standardized tests (performance and growth, readiness baseline that starts at school entry, lowest quartile of students and subgroups). Soft Skills College/Career Readiness Graduation Rate Opportunity measures -‐ program availability, arts, community resources, to measure the school climate Teacher Evals -‐ tiptoed into this knowing its contreverisal, value-‐added measures, and whole schools like ours measures to be certain we're comparing similar schools. Lens "schools like ours" Soft skills -‐ metacognitive assessments, engage functioning skills (empathy, attitude leader indicators)… standardized and authentic. Soft -‐ Skills, Metacognitive Assessments, engage functioning skills
Group 2 • System that supports competencies •Variety of assessments with summative accountability measures at key points (not all at the end of the year) •Use of extended performance tasks (metacognitive) •Consideration of resources and inputs/out of school factors •Focus on college/career readiness indicator •Focus on critical content standards •Postsecondary longitudinal measures
System that supports competencies not finite skills (a comment learning) variety of assessment with summative accountability measures at key points (not all the end of the year, and not all of the time) Not testing all the time for summative testing for accountability, but formative assessment to inform how we're teaching our students. Use of performance task within soft skills (setting goals to accomplish the task), consideration of resource, inputs, out of school factors necessary for our students to achieve. Focus on CCR indicators (pathway out and after high school) to be a productive citizen. Post secondary longitudinal measures. Focus on critical content standards. Where are our students 10 years down the road -‐ maybe they got into college, but they weren't able to finish but they went back 10 years and are now a productive citizen, but are incarcerated (community resources) Differences in formative and summative reports to move forward and revamp some things vs. what we hold in regard to student achievement. Empirical data to support Sticking points: absolute scores vs. growth
Group 3 • School Climate (objective and subjective) inclusive of community • Productive Citizen Measure (GED, HS, Diploma, Get a Job, Military, not living off of
Climate self-‐study of positive and negative about what makes their school functions well to diagnose what they need to do. Don't trust self assessment overall. Make it work if the rest of the

34
unemployment, not in jail) •Teacher/Principal Evaluation •Growth/absolute K-‐2,3-‐8, 9-‐12 (achievement and readiness measures) •Extended Performance Tasks •High Expectations of reporting for all subgroups •Including soft skills measurements •Portfolio/authentic assessment component, evidence measure •SAT/ACT
accountability system … condition of the school building, objective measure that an building engineer could look at. opposed to someone giving subjectivity. Need to build in self-‐reflectiveness. Subjectivity and objectivity -‐ push/pull balanced. Graduation Rate vs job -‐ our are students able to leave in 4 years with a diploma? Subgroup. When they leave the hs, measure to move forward to being a productive citizen? OBSAP Productive Citizen Measure. Evaluation -‐ teacher qualification, building managers? or leadership for the teachers? Teacher and principal evaluation. Not anybody that's directly accountable. Superintendent can be fired by the board. Tension between growth and absolute. (could an elementary student or middle school students) Special education and make sure its not an excuse for poor performance. Soft skills/metacognitive assessment Need to measure how a school functions a learning environment -‐ objectives and subjective, inclusive of the community. Product Citizen Measure -‐ what do they look like when the leave (GED, HS, Get a job, Military, not living off of unemployment, not in jail) Teacher/Principal Evaluation -‐ both in some way to see inputs are putting in both sides and contributing to an effective school. Growth/Absolute -‐ k-‐2, 3-‐8, 9-‐12 achievement measures and readiness measures. Hit all these levels, no accountability for K-‐2, needs to be standardized and developmentally appropriate. Extended performance tasks with project based learning, community exposure and internships, talked about HS but could be brought down grade wise. Progression of writing, creativity… etc. High expectations of reporting for all subgroups with high expectations. Including soft skills measurements -‐ curiosity, professional academic dispositions Portfolios/authentic assessment component evaluative measure -‐ observational protocols, not just about a test informal authentic measure. ACT/SAT college readiness benchmark -‐ common measure to college entrance. Accepted to college. Growth and absolute measures was a discussion and climate object/subject fear of gaming

35
GREENVILLE
Chart Paper Transcript Facilitator Notes Group 1 • Growth
•Diagnostic •Basic R’s – emphasize Reading •Dual Credit •Opportunity to Learn
1) Growth 2) Diagnostic -‐ actionable and usable 3) Basics Rs -‐ emphasize Reading 4) Dual Credit 5) Opportunity to Learn -‐ input measures A lot of performance, dual credit (CCR indicator), balance with OTL measure. Lot of time thinking about backwards design and meaningful long term, policies, changes to curriculum, daily operating procedures that must changed… a lot has to be done on the front end. What other industry in the world has stayed on the same schedule.
Group 2 • Content – absolute + growth measure • Skills & dispositions – work keys or others • Climate – teachers, students, parents, input • Opportunity – exposure to college/careers • College Readiness – matriculation, persistence, remediation Less is more
IDEAL SCA "Less is more" Content -‐ absolute and growth measure. recognized that there was a place for absolute, from the perspective of a parent. great if they are 8th grade and shows 2 years, but they are at a 5th grade level we need to know what to do. Skills + dispositions -‐ work keys or others, is the student going thru the system successfully and how do we measure those success points. Year after -‐ matriculation, persistence, and rumination. Climate -‐ teachers + students + parents input o how well a school is doing. Climate is the under foundation for so much of this, much of these measures won't work. and this is in the hands of staff. NM includes a 10 Qs that goes to teachers, parents, and students. Opportunity -‐ exposure to college and careers. What's exposure -‐ opportunities if the kids don't know there is an opportunity to have someone speak to them or visit a place, won't know what's avail to them. What is our accountability measure for career readiness.

36
Group 3 • Graduation Rates -‐ % of students participating/completing AP/IB/Dual Enrollment • Measure schools ability to produce opportunities to identify and explore college/career interests • Measures (static and growth) – Kindergarten Readiness, 3rd grade reading and math literacy, 8th grade pre-‐college assessment, gap measures
Philosophically, opportunity to allow every child to reach the most potential. What can you do to set an accountability system to drive that. Makes a school system that becomes all things for all kids. 1) graduation rates (started with end in mind) all kids by 10th grade be college and career ready. Opportunity to experience at least a college course for credit, % participation/completion of AP?IB/enrollment. 2) measure a schools systems ability to say what is your college/career passion and what's your roadmap to get there. What is your passion, virtual shadowing, getting in a class, or turning in for someone to look at. Identify a car roadmap to get there. 3) kindergarten, 3, 8 -‐ status and growth and college readiness at 8th grade (what are we going to do at the lower levels to remediate earlier to the maximum potential) 4)GAP measures
Group 4 • Measure of Readiness K-‐4 • Measure of Growth 2-‐8 • Measure of performance on EOCs (redesigned assessments) • Measure of performance on ACT/SAT/AP/ASVAB/COMPASS/WORKKEYS • Improvement of Subgroups • Project-‐based performance task •Participation AP/IB/DE • Subgroup Improvement • Teacher and Principal Evaluation • College Remediation Rates
Longitudinal study across all grade levels -‐ measures of performance on redesigned assessments. Redesigned to have feedback and be more performance driven. Room for improvement. A little more actionable. Evaluation of levels of improvement. Project-‐based performance task, success with project based learning. Participation in college experiences -‐ expanding dual enrollment career specific. Broaden and expand Teacher/principal evaluation piece -‐ remediation, matriculation, and persistence -‐ in a nice tidy number.

37
APPENDIX B – Stakeholder Feedback Survey Approximately one week after the stakeholder meetings, a survey was distributed to participants to gather feedback on their experiences. Out of 57 participants, 13 completed the feedback survey (response rate of 23%). The following pages present summaries of data to for each survey question.

38

39

40

41
APPENDIX C – Framework Indicators Defined
Indicator Definition
% of Students who fill out a FAFSA
Number of students who complete the Free Application for Federal Student Aid, a form that is submitted annually by prospective (and current) college students to determine eligibility for financial aid.
% of students completing a college application
Percentage of students who fill out an application for college admission, which generally consists of academic transcripts, letters of recommendation, and essay responses.
% of students who filled out a career plan Percentage of students who create a structured outline of career goals and the action steps required to meet their individual goals.
Absolute Scores State Standardized Tests: grades 3-‐ 8 (ELA, Math, Science, and Social Studies)
Student achievement results from state standardized tests, as benchmarked against performance standards.
College Acceptance Rates Percentage of students who are accepted into a college or university.
College Matriculation Rates Percentage of students who enroll into a college or university.
College Persistence Rates Percentage of students continuing college after their freshman year.
End of Course Exams: ELA, Math, Science, and Social Studies
Measures student acquisition of content knowledge at the end of a course of study.
Extended Performance Tasks Project that requires students to apply a wide range of skills to solve a complex problem.
Graduation Rates Percentage of students that successfully graduated high school by meeting state or local diploma requirements.
Growth Scores State Standardized Tests: grades 3-‐ 8 (ELA, Math, Science, and Social Studies)
Measures change in students’ scores on state achievement tests from one year to the next.
HS Exit Exams: ELA & Math Tests that students must pass to receive a diploma and graduate from high school.
HS Grades Summative classroom-‐based evaluation measures of student performance in individual courses often aggregated up to a 4-‐point scale.
Input measures on School Programs/Program Evaluation
May include an array of inputs and activities within a school building which the state deems important for students' opportunity to learn. This could include curriculum review for each subject area and other input metrics (e.g., student-‐to-‐computer ratio, average instructional time, access to tutoring services).

42
Indicator Definition
Input measures on Teacher Quality Reports on staff certification levels within a school building.
Metacognitive Assessment Students fill out a self-‐report survey regarding non-‐cognitive skills (e.g., time management, goal setting, persistence).
Participation in ACT/SAT Measures how many students are taking the ACT/SAT standardized test, which assesses a student's aptitude for college and is used for most college admissions.
Participation in Dual Enrollment
Measures how many students are accesses the Dual Enrollment program, which involves high school students taking college courses at a local institution of higher ed while they are still enrolled in high school.
Participation in IB/AP courses
Measures how many students are accessing the International Baccalaureate or Advanced Placement programs, which offer college-‐level curriculum and examination to high school students.
Percent Passing College Placement Exams/Remediation Rates
Postsecondary Institutions use assessment instruments in subjects like math and English to check the academic levels of entering students. These test scores are used to decide if a student is ready for entry-‐level credit bearing courses.
Performance in Dual Enrollment
Measures student achievement in a program which involves high school students taking college courses at a local institution of higher ed while they are still enrolled in high school.
Performance in IB/AP courses
Measures student achievement in International Baccalaureate or Advanced Placement programs, that offer college-‐level curriculum and examination to high school students.
Performance in Commercial Career Readiness Assessment (e.g., WorkKeys)
Measures student achievement on a job skills assessment which looks at common skills required for success in the workplace.
Performance on ACT/SAT Measures student performance on the ACT/SAT standardized test, which assesses a student's aptitude for college and is used for most college admissions.
Performance on military exams Measures student achievement on the Armed Services Vocational Aptitude Battery, which determines whether a student is qualified to enlist in the U.S. military.
Performance or growth of the lowest 25% Reports results for students who performed in the bottom 25% in the previous year's standardized tests.
Reporting on Subgroups Compares/Isolates student test results for African-‐American, Hispanic, Native American, special education, low income, and ELL students.
Self-‐Reported School Climate Results from a survey taken by staff, students, and parents in regards to the school's environment (i.e., physical, social, and academic).

43
APPENDIX D: Framework Criteria Categories and Essential Questions
Criteria Essential Question
Basic KSAs Does it assess the basic knowledge and skills students need to live, learn and work in the 21st century?
Higher Order Thinking Does it assess the critical thinking and complex problem solving skills students need to live, learn, and work in the 21st century?
Meaningful Does the measure have meaning or currency outside of the accountability system?
Clear Can the measure be clearly communicated and understood by the public?
High Needs Does it address students with the highest need?
Pathways Does the measure promote high aspirations, regardless of their future pathway? (college, career, military)
Feasible Is it feasible to implement this measure with fidelity at the state level? Political, administrative, technical
Whole School
Does it hold the whole school accountable? Does it define quality across the whole school building? (Curriculum, instruction, opportunities to learn, resources)
Aligned Does it promote alignment across the system?