An Analysis of Workforce Development Issues in the U.S ...
20
An Analysis of Workforce Development Issues in the U.S. Plastics Industry 1 1425 K Street NW, Suite 500, Washington, DC 20005 P 202.974.5200 | plasticsindustry.org Confidential ©2019 PLASTICS All rights reserved An Analysis of Workforce Development Issues in the U.S. Plastics Industry By Perc Pineda, PhD Chief Economist November 2019 (Revised) The views expressed in this PLASTICS White Paper are those of the author and not necessarily the views of the Plastics Industry Association. Please send comments to [email protected]
Transcript of An Analysis of Workforce Development Issues in the U.S ...

An Analysis of Workforce Development Issues in the U.S. Plastics Industry1
1425 K Street NW, Suite 500, Washington, DC 20005P 202.974.5200 | plasticsindustry.org
Confidential ©2019 PLASTICS All rights reserved
An Analysis of Workforce Development Issues in the U.S. Plastics Industry By Perc Pineda, PhD Chief Economist
November 2019 (Revised)
The views expressed in this PLASTICS White Paper are those of the author and not necessarily the views of the Plastics Industry Association. Please send comments to [email protected]
An Analysis of Workforce Development Issues in the U.S. Plastics Industry2
Executive SummaryThis paper analyzes the workforce development issues in the U.S. plastics industry. It begins by looking at the profile of the plastics workforce. Worker productivity in the U.S. plastics industry is analyzed and a pool of labor supply – U.S. veterans of foreign wars – is explored. Short-term and long-term recommendations for companies in the U.S. plastics industry are also presented.
In analyzing U.S. workforce development issues, it is important to be mindful of the following facts. First, the U.S. has an aging population coupled with falling birth rates. This means that new entrants into the labor market will grow at a slower pace than those retiring or leaving the workforce. Second, the U.S. educational curriculum is not in sync with the workforce of the future. As technology enhances manufacturing processes and the skills of workers are not updated, the skills gap will continue to widen. Third, advances in technology – which will continue to create new jobs/occupations that did not exist before – has intensified labor demand in the U.S. economy. Fourth, regional economic development plays a critical role in supporting continued labor market flexibility as new graduates are hesitant to move into the rural areas. Fifth, workers will respond positively to prospects of career advancement along with other economic incentives.
Wages in the plastics industry are competitive, which should be expected to generate interest from new entrants in the labor market. However, anecdotal evidence suggests information asymmetry contributes to labor supply missing labor demand, particularly for engineering jobs. Veterans as a pool of labor supply have their own challenges starting with their low unemployment rate– lower than the national average. Geographic shifts along with aging veterans are issues.
Workforce development is and will remain a dichotomous issue. It is national and macroeconomic, in scope, but the approach to the resolve the issue, particularly in the short-run, is local or industry focused, and therefore microeconomic. Hence, a previous workforce development initiative involving the plastics industry supply chain is reviewed in this paper.

An Analysis of Workforce Development Issues in the U.S. Plastics Industry3
Introduction
1 See Haralson, L.E. “What is Workforce Development” The Federal Reserve Bank of St. Louis April 1, 2010. https://www.stlouisfed.org/publications/bridges/spring-2010/what-is-workforce-development.
2 Assuming current U.S. immigration policy is unchanged. Latest data from the Migration Policy Institute show that the 81.9% of total U.S. immigrant population 2013 were in the 15-64 age group and the median age was 43.1. https://www.migrationpolicy.org/programs/data-hub/charts/age-profile-immigrants-over-time.
The purpose of this paper is to analyze the workforce development issue in the U.S. plastics industry. One can think of workforce development as a collection of processes that enable individuals to acquire knowledge, skills, and attitudes for gainful employment or improving current work performance. The process could cover any number of activities including updating the educational curriculum on one end to providing training for new and existing workers at the other. In between are a series of activities ranging from targeting labor clusters such as veterans, social civic recruitment (economic development groups and charitable organizations), job dissemination through state and local government labor agencies, tapping social media and electronic job boards, or setting up referral programs within companies that include financial incentives.
Haralson (2010), shares the same understanding of what workforce development means.1 The term encompasses a range of activities, policies and programs employed by governments to create, sustain and retain a viable workforce that can support current and future business and industry. However, because workforce development differs in meaning from one perspective to another, it is challenging to arrive at a consensus definition. Haralson (2010) argues that public and private social service providers approach workforce development from the perspective of sustainable economic security of the individual. Communities and economic developers approach workforce development to benefit the sustainable economic growth of a community or region. Unlike both social service providers and communities, employers focus on skills needed by their industry to remain competitive.
In analyzing workforce development issues, it is important to be mindful of some facts. First, the U.S. has an aging population coupled with falling birth rates. This means that new entrants into the labor market will grow at a slower pace than those retiring or leaving the workforce – all else equal.2 Second, the U.S. educational curriculum is not in sync with the workforce of the future. As technology enhances manufacturing processes and the skills of workers
are not updated, the skills gap will continue to widen. Third, advances in technology – which will continue to create new jobs/occupations that did not exist before – have intensified labor demand in the U.S. economy. Fourth, regional economic development plays a critical role in supporting continued labor market flexibility. New graduates are hesitant to move to rural areas and would rather remain in big cities. Fifth, workers will respond positively to prospects of career advancement along with other economic incentives.
The many uses of plastic materials and products in different industries are not projected to diminish any time soon. Consequently, the demand for labor in plastics manufacturing is expected to continue.
However, the shortage of skilled workers for the plastics industry in the U.S. is a serious issue. This poses a threat to the industry’s longevity particularly as plastics manufacturing becomes more technologically enhanced. The U.S. plastics industry needs to confront this issue with both short-term and long-term approaches. In the short-term, a steady supply of labor is critical – highlighted in recent years with production rates having been ramped up due to higher demand. In the long-term, the viability of a career in plastics manufacturing needs to be positioned – front and center – to ensure there remains a steady supply of labor.
Workforce development is and will remain a dichotomous issue. It is national and macroeconomic, in scope, but the approach to resolve the issue, particularly in the short run, is local or industry focused, and therefore microeconomic. Work development initiatives are nothing new – national and state level programs have been implemented for decades. However, skilled worker shortages continue to be a problem in U.S. manufacturing. In this paper, a previous workforce development initiative involving the plastics industry supply chain is reviewed. Finally, a long-term workforce development approach that can be implemented by U.S. plastics industry firms to ensure a sustained supply of skilled workers, is discussed.
An Analysis of Workforce Development Issues in the U.S. Plastics Industry4
U.S. Plastics Industry Jobs Profile
3 Median wages vary by State. Data on plastics occupation and average wages by State can be download from Plastics Workforce Resource from https://www.plasticsindustry.org/data/industry-data.
What are the issues surrounding workforce development in the U.S. plastics industry? Is it simply a skills gap – a lack of qualified workers, an ongoing issue facing the manufacturing sector – resulting in unfilled positions? Are wages in the U.S. plastics industry competitive? To answer these questions, this section explores the types of occupations in the U.S. plastics industry including wages and demographics.3 A snapshot of employment opportunities in the plastics industry (Box 1) shows occupations expected to grow between 2016-2026. Companies are currently experiencing a lack of qualified workers for the positions identified in Box 1.
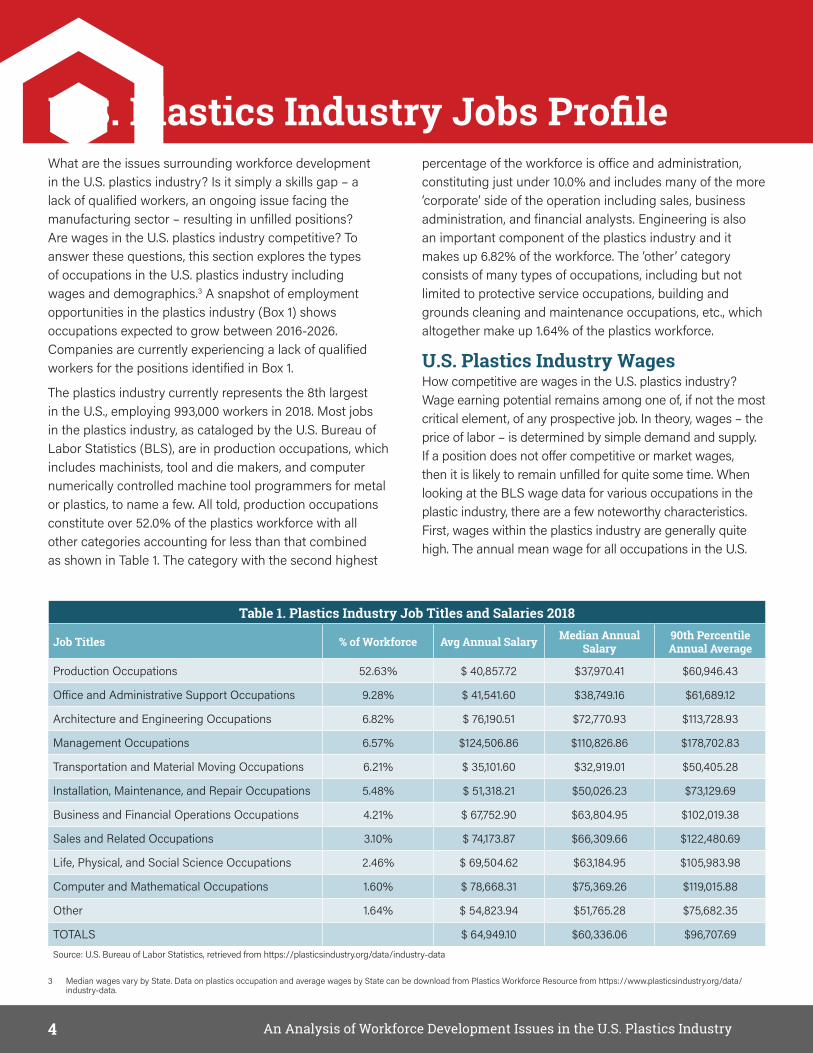
The plastics industry currently represents the 8th largest in the U.S., employing 993,000 workers in 2018. Most jobs in the plastics industry, as cataloged by the U.S. Bureau of Labor Statistics (BLS), are in production occupations, which includes machinists, tool and die makers, and computer numerically controlled machine tool programmers for metal or plastics, to name a few. All told, production occupations constitute over 52.0% of the plastics workforce with all other categories accounting for less than that combined as shown in Table 1. The category with the second highest
percentage of the workforce is office and administration, constituting just under 10.0% and includes many of the more ‘corporate’ side of the operation including sales, business administration, and financial analysts. Engineering is also an important component of the plastics industry and it makes up 6.82% of the workforce. The ‘other’ category consists of many types of occupations, including but not limited to protective service occupations, building and grounds cleaning and maintenance occupations, etc., which altogether make up 1.64% of the plastics workforce.
U.S. Plastics Industry WagesHow competitive are wages in the U.S. plastics industry? Wage earning potential remains among one of, if not the most critical element, of any prospective job. In theory, wages – the price of labor – is determined by simple demand and supply. If a position does not offer competitive or market wages, then it is likely to remain unfilled for quite some time. When looking at the BLS wage data for various occupations in the plastic industry, there are a few noteworthy characteristics. First, wages within the plastics industry are generally quite high. The annual mean wage for all occupations in the U.S.
Table 1. Plastics Industry Job Titles and Salaries 2018
Job Titles % of Workforce Avg Annual Salary Median Annual Salary
90th Percentile Annual Average
Production Occupations 52.63% $ 40,857.72 $37,970.41 $60,946.43
Office and Administrative Support Occupations 9.28% $ 41,541.60 $38,749.16 $61,689.12
Architecture and Engineering Occupations 6.82% $ 76,190.51 $72,770.93 $113,728.93
Management Occupations 6.57% $124,506.86 $110,826.86 $178,702.83
Transportation and Material Moving Occupations 6.21% $ 35,101.60 $32,919.01 $50,405.28
Installation, Maintenance, and Repair Occupations 5.48% $ 51,318.21 $50,026.23 $73,129.69
Business and Financial Operations Occupations 4.21% $ 67,752.90 $63,804.95 $102,019.38
Sales and Related Occupations 3.10% $ 74,173.87 $66,309.66 $122,480.69
Life, Physical, and Social Science Occupations 2.46% $ 69,504.62 $63,184.95 $105,983.98
Computer and Mathematical Occupations 1.60% $ 78,668.31 $75,369.26 $119,015.88
Other 1.64% $ 54,823.94 $51,765.28 $75,682.35
TOTALS $ 64,949.10 $60,336.06 $96,707.69Source: U.S. Bureau of Labor Statistics, retrieved from https://plasticsindustry.org/data/industry-data

5 An Analysis of Workforce Development Issues in the U.S. Plastics Industry
Box 1. Plastics Workforce Snapshot
Average Annual Wage in U.S. in All Industries (w/High School Diploma or Equivalent)
Average Annual Wage in Plastics (w/High School Diploma or Equivalent)
Opportunities in the U.S. Plastics Industry AVERAGE ANNUAL JOB OPENINGS*
There are thousands of job openings in the U.S. plastics industry.
*AVERAGE ANNUAL JOB OPENINGS FROM 2016–2026 FOR SELECTED OCCUPATIONS.
**VARIES BY STATE.
SOURCE: U.S. BUREAU OF LABOR STATISTICS, PLASTICS SIZE & IMPACT REPORT 2019 LEARN MORE: PLASTICSINDUSTRY.ORG/INDUSTRY-DATA
ENGINEERS
71,500
MACHINISTS
40,900
PRODUCTION WORKERS
99,300
MACHINE OPERATORS
14,500
MECHANICS
33,100Aside from engineering positions, many job openings in plastics don’t
require a bachelor’s degree, with companies providing on-the-job training.
WAGESWages for plastics workers routinely outpace national averages.
$35,256 $41,699
men72.3%
women27.7%
PLA
STIC
S IN
DUSTRY GENDER BREAKDO
WN
Growth opportunities in plastics for women.
National 90th Percentile Wage by Job Type in Plastics**
(Currently in Demand)
(18% higher than wages nationally)
ENGINEERS $100K+
MACHINISTS $43K+
PRODUCTION WORKERS $39K+
MACHINE OPERATORS $40K+
MECHANICS$52K+
ENGINEERS $136K+
MACHINISTS $63K+
PRODUCTION WORKERS $54K+
MACHINE OPERATORS $58K+
MECHANICS $70K+
Produced by
That’s approximately 145,000 potential job
openings in plastics product manufacturing in
the next 5–10 years.
Engineers (paid the highest median salary in the U.S. plastics
industry) comprise just 6.8% of plastics industry workforce—but engineering jobs in plastics are
poised to grow by 8.7% annually between 2016 and 2026.
Graduates with degrees in plastics engineering should
expect a robust job market when they graduate regardless
of economic conditions.
WORKFORCE22.3% of the plastic product manufacturing workforce is
aged 55 and older
9.6% of the plastics product manufacturing workforce is
aged 16 to 24 years
National Median Wage by Job Type in Plastics** (Currently in Demand)
19360PLAS_WorkforceInfographic_Poster.indd 119360PLAS_WorkforceInfographic_Poster.indd 1 11/15/19 4:50 PM11/15/19 4:50 PM

6 An Analysis of Workforce Development Issues in the U.S. Plastics Industry
was $51,960 in 2018. It is nearly $10,000 more in the plastics industry. However, considering that those within the legal and management occupations make substantially more than other categories and therefore skew the data toward the $63,000 average salary, an additional calculation must be conducted. Leaving out those two occupations, plastics has an average salary of $54,483.40 for all other occupations, still $2,523.40 above the national level.
Wages in the U.S. plastics industry are competitive. However, because of demographic realities, workforce development is an issue that needs to be addressed on an ongoing basis.
DemographicsAge is yet another key factor when conducting a macro-analysis of the plastics labor force. Many countries face an aging population and the U.S. is no exception. Based on the Census Bureau’s Longitudinal Employer- Household Dynamics program, the ratio of the employment-population of those older than 65 years old rose from 12% in the mid-90s to 18% in the mid-2010s. In the plastics industry while those 65 years and older make up just 3%, the more concerning number is that workers in the 45-64 years old age range represent 42% of the plastics and rubber products manufacturing labor force as shown in Figure 1. This is troublesome for the industry since these workers will be within the age of retirement sometime in the next decade. The concern is compounded by low numbers of young employees, such as 16-24 years old, as they only account for 11% of the workforce. This highlights the need for the plastics industry to attract younger workers – for continuity of labor supply. However, for the younger and more mobile workers, there are popular destination cities. Box 2 shows where millennial workers are moving.
65+3%
55 to 6421%
45 to 5421%
35 to 4420%
25 to 3424%
20 to 2410%
16 to 191%
Figure 1. Plastics and Rubber Products Manufacturing Workers by Age
Source: U.S. Bureau of Labor Statistics
Millennial Boomtown
RankCity Final
ScorePopulation
Change
1 San Francisco, CA 89 16.20%2 Denver, CO 80.6 18.70%3 Austin, TX 80 17.50%4 Nashville, TN 76.4 11.40%5 San Jose, CA 74.7 13.30%6 Raleigh, NC 69.8 12.70%7 Portland, OR 69.5 11.30%8 Seattle, WA 65.1 14.40%9 Oklahoma City, OK 59.4 8.20%10 Dallas, TX 57.4 9.40%
Source: Blumberg, Yoni. “This Map Shows Where Millennials Are Moving for Job Opportunities and Rising Wages.” CNBC, CNBC, 24 Oct. 2018, www.cnbc.com/2018/10/24/this-map-shows-where-millennials-are-moving- for-jobs-and-rising-wages.html.
Box 2. Where are young millennial workers moving?MagnifyMoney, a personal finance service, created a scale with multiple metrics in order to piece together where millennials are moving to in the U.S. and why. As reported by CNBC, the scale included data points such as wage, participation in the workforce, and unemployment rates, among others, in order to place each destination on a scale of 1-100 with a score of 100 being the most desired destination. The data looked at was from between 2011 and 2016.
Their findings have important implications for the U.S. plastics industry both in areas that are target spots for millennial workers, and those which are not. Half of the top 10 cities noted in the article are located within the 10 states with the most U.S. plastics industry concentration, including two – Austin and Dallas – within Texas, and two – San Francisco and San Jose – within California. These two states alone represent 14.8% of the U.S. plastics industry, which is good news since it means much of the top millennial talent is targeting cities within regions of many plastics companies.
On the flip side of this coin, it also means that there is a systematic talent drain on young talent which drags them away from places like Ohio, Michigan, and Illinois, which represent the remaining three of the top five states in the U.S. plastics industry. The article notes that according to some surveys conducted of millennials, moving to these cities is potentially temporary due to high costs of living and higher taxes. Lower cost of living may therefore represent an opportunity for other states with a high percentage of the U.S. plastics industry to recruit younger talent in order to fill the growing age gap.
7 An Analysis of Workforce Development Issues in the U.S. Plastics Industry
The old parental advice to college graduates – “you move where the jobs are” – doesn’t seem to resonate with new entrants in the labor market. Rather, millennials have top destination cities in recent years which has caused labor supply bottlenecks to the plastics industry. The location of the job—whether urban or rural—is arguably one of the most important factors for potential employees, particularly millennials.
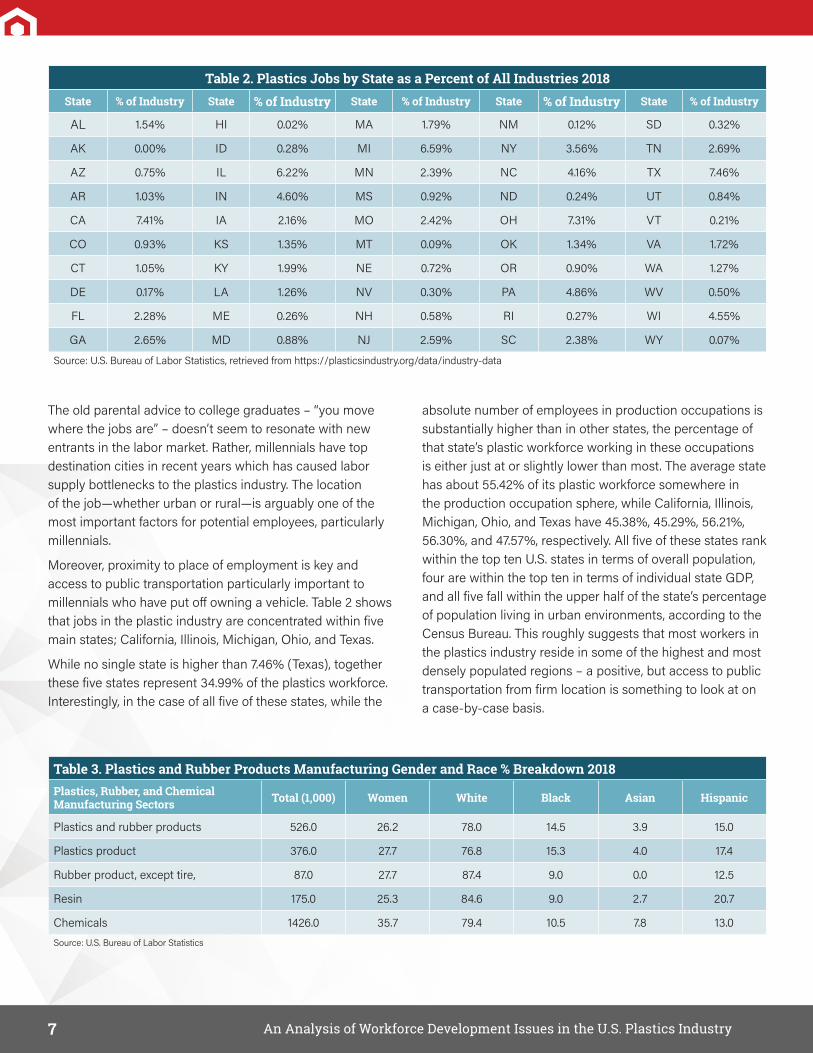
Moreover, proximity to place of employment is key and access to public transportation particularly important to millennials who have put off owning a vehicle. Table 2 shows that jobs in the plastic industry are concentrated within five main states; California, Illinois, Michigan, Ohio, and Texas.
While no single state is higher than 7.46% (Texas), together these five states represent 34.99% of the plastics workforce. Interestingly, in the case of all five of these states, while the
absolute number of employees in production occupations is substantially higher than in other states, the percentage of that state’s plastic workforce working in these occupations is either just at or slightly lower than most. The average state has about 55.42% of its plastic workforce somewhere in the production occupation sphere, while California, Illinois, Michigan, Ohio, and Texas have 45.38%, 45.29%, 56.21%, 56.30%, and 47.57%, respectively. All five of these states rank within the top ten U.S. states in terms of overall population, four are within the top ten in terms of individual state GDP, and all five fall within the upper half of the state’s percentage of population living in urban environments, according to the Census Bureau. This roughly suggests that most workers in the plastics industry reside in some of the highest and most densely populated regions – a positive, but access to public transportation from firm location is something to look at on a case-by-case basis.
Table 2. Plastics Jobs by State as a Percent of All Industries 2018State % of Industry State % of Industry State % of Industry State % of Industry State % of Industry
AL 1.54% HI 0.02% MA 1.79% NM 0.12% SD 0.32%
AK 0.00% ID 0.28% MI 6.59% NY 3.56% TN 2.69%
AZ 0.75% IL 6.22% MN 2.39% NC 4.16% TX 7.46%
AR 1.03% IN 4.60% MS 0.92% ND 0.24% UT 0.84%
CA 7.41% IA 2.16% MO 2.42% OH 7.31% VT 0.21%
CO 0.93% KS 1.35% MT 0.09% OK 1.34% VA 1.72%
CT 1.05% KY 1.99% NE 0.72% OR 0.90% WA 1.27%
DE 0.17% LA 1.26% NV 0.30% PA 4.86% WV 0.50%
FL 2.28% ME 0.26% NH 0.58% RI 0.27% WI 4.55%
GA 2.65% MD 0.88% NJ 2.59% SC 2.38% WY 0.07%
Source: U.S. Bureau of Labor Statistics, retrieved from https://plasticsindustry.org/data/industry-data
Table 3. Plastics and Rubber Products Manufacturing Gender and Race % Breakdown 2018Plastics, Rubber, and Chemical Manufacturing Sectors Total (1,000) Women White Black Asian Hispanic
Plastics and rubber products 526.0 26.2 78.0 14.5 3.9 15.0
Plastics product 376.0 27.7 76.8 15.3 4.0 17.4
Rubber product, except tire, 87.0 27.7 87.4 9.0 0.0 12.5
Resin 175.0 25.3 84.6 9.0 2.7 20.7
Chemicals 1426.0 35.7 79.4 10.5 7.8 13.0Source: U.S. Bureau of Labor Statistics

8 An Analysis of Workforce Development Issues in the U.S. Plastics Industry
The median age shifts slightly depending on which part of plastics industry is being looked at, but for the industry as a whole, the approximate median age is 42 – plastics products manufacturing is 43.1 years old, plastics and rubber manufacturing is 42, and resin, synthetic rubber and fibers, and filaments manufacturing is 43.3 years.
The gender and racial demographic data are among some of the most uneven in the plastics industry, specifically gender. Around 26% of the plastics and rubber products manufacturing workforce is female, and 78% of the workforce is white (see Table 3). The numbers are slightly better for chemicals manufacturing with 35% female, but is marginally worse racially, with 79.4% of that sector identifying as white. Within the U.S. plastics industry, the resin, synthetic rubber and fibers, and filaments manufacturing sector has the most skewed racial diversity,
with nearly 87.4% of the workers identifying as white. Within the plastics industry those who identify as Asians are represented the least, constituting only 3.9% of the workforce. These racial trends are on par with the rest of the U.S. workforce according to BLS data released in August of 2018. In the entire U.S. workforce, about 78% of workers are white, while black and Asian workers nationally represent about 13% and 6%, respectively. The plastics industry lies within these benchmarks. Unlike national trends however, the plastics industry has substantially lower rates of female workers in the industry, as the national average sits around 46.9% – nearly 20 points higher than that of the plastics industry. Gender is one major area where the plastics industry has room to improve. While greater racial diversity, especially for certain sectors, should be emphasized, companies should prioritize closing this gender disparity.

An Analysis of Workforce Development Issues in the U.S. Plastics Industry9
Labor Productivity and Labor Supply
4 See D. DeSilver “Most Americans unaware that as U.S. manufacturing jobs have disappeared, output has grown” July 24, 2017, http://www.pewresearch.org/author/ddesilver.
Up until 1969, employees working in manufacturing was 25.0% more than total non-farm employees. That started to decline to 20.0% in 1981, falling further to 15.0% in 1992 and to 9.0% in 2018 as shown in Figure 2. The reality is, as employment in manufacturing decreased, it has increased in other industries such as the service sector. The output of the U.S. plastics industry has been increasing and holding steady in recent years. In the second quarter this year, U.S. manufacturing output was about $6.4 trillion. The plastics and rubber portion of manufacturing output was $224.9 billion or 3.5% of total manufacturing output. That’s an 11.6% increase over 10 years despite the low levels of employment
in plastics manufacturing. As shown in Figure 3, plastics and rubber shipments rose faster than the increase in employees.
According to a Pew Research survey, most Americans know manufacturing jobs have declined, but only about a third know output has increased.4 This suggests that the U.S. plastics industry’s labor productivity increased through automation, digitalization, and the use of more technology in the production process. This further defines the labor demand of the plastics industry and raises the question of whether the skills gap is getting wider, which could only be narrowed through education and upgrading the skills of both new entrants to the labor market and the current workforce.
1993 201920172015201320112009200720052003200119991997199540
60
80
100
120
140
160
180
Shipments Employees
Figure 3. Plastics and Rubber Products Employees and Shipment(June 1993 - June 2019)Source: Federal Reserve Bank of St. Louis
Inde
x, J
une
2009
= 10
0
Figure 2. Manufacturing Employees as % of Total EmployeesSource: U.S. Bureau of Labor Statistics
1948 201820132008200319981993198819831978197319681963195819530%
5%
10%
15%
20%
25%
30%
35%

10 An Analysis of Workforce Development Issues in the U.S. Plastics Industry
Hiring TrendsLooking at the job openings and labor turnover data from the BLS, the manufacturing sector has produced a steady level of output despite challenges in labor supply. For example, in June 2019, there were an estimated 503,000 job openings in manufacturing. There were 324,000 total hires in manufacturing in the same month. That means that the manufacturing sector was only able to fill 64.0% of its total job openings. While one can argue that there are numerous reasons why the openings are not filled – and more importantly not filled in a short amount of time – the persistence of this phenomenon is symptomatic of structural labor market issues – in both the labor demand and supply sides of the equation.
If we look at data from a year ago, in June 2018, there were an estimated 475,000 total manufacturing job openings. The total hires were 370,000 or 77.9% – nearly 14% higher than the rate seen in June 2019. The difference could be the further tightening of the labor market over the past twelve-month period.
Since the plastics industry’s workforce consists of workers in both durable goods and nondurable goods sectors, looking at the breakdown provides valuable insight – it appears consistent with the overall manufacturing fill rate of 64.0%. In June 2019, the job-fill rates for durable goods and nondurable goods manufacturing were 61.1% and 69.9%, respectively.
Workforce Training Requirements and IncentivesEntry level education varies substantially depending on the position within the plastics industry. While more people in the U.S. are going to college, there remains a large majority
of people who do not pursue higher education, yet still demand employment. The plastics industry provides a great range of positions, many of which only need a high school diploma. Approximately 77.1% of the openings in plastics require less than a bachelor’s degree as a baseline. The typical entry level salary for a person with a high-school diploma or equivalent is $41,699, about 18% above the median salary for positions with the same entry level of
education in the U.S. It is worth noting that the lion’s share of jobs which demand only a high school diploma reside within production occupations. Instead of higher education, employers opt for those with either high school or post-secondary certifications as the primary entry-level education in favor of moderate or long-term on-the-job training to prepare their workforce in the production occupations.
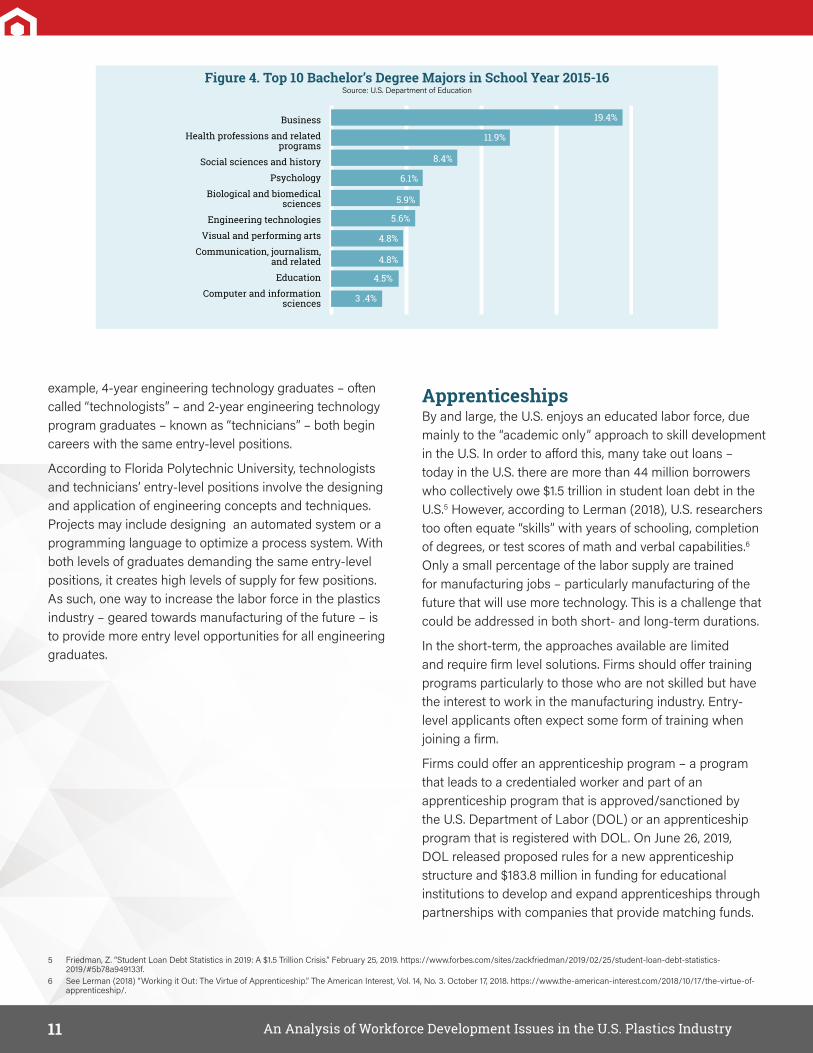
The latest data from the U.S. Department of Education, National Center for Education Statistics shows that of the total 1,920,718 bachelor’s degrees conferred by postsecondary institutions in the school year 2015-16, 19.4% were business majors (see Figure 4). Engineering graduates was a paltry 5.6%, and engineering technology graduates was a dismal 0.9%. Looking at the top 10 majors of college graduates, we can see that the U.S. plastics industry has plenty of talent to draw from with business degrees. But considering that plastics manufacturing processes are getting more and more specialized, the demand for engineers and those with engineering technologists are expected to increase. Unfortunately, engineering technology majors – highly relevant to plastics manufacturing – are ranked 22nd of top majors, and 0.9% of the total graduates in the school year 2015-16. There is anecdotal evidence that engineering graduates – after a long unproductive job search – end up working odd jobs in the transportation and services industry. It is unclear if these instances are symptomatic of a greater market coordination problem resulting from information asymmetries between labor supply and labor demand. Another possibility is the lack of entry level opportunities for engineering jobs in the plastics industry. For
Table 4. Manufacturing Openings and Hires – June 2019
Durable Goods Manufacturing
Nondurable Goods Manufacturing
Openings 319,000 183,000
Hires 195,000 128,000
Job-fill rate 61.1% 69.9%
Source: U.S. Bureau of Labor Statistics
For example, in June 2019, there were an estimated 503,000 job openings in manufacturing. There were 324,000 total hires in manufacturing in the same month.
11 An Analysis of Workforce Development Issues in the U.S. Plastics Industry
example, 4-year engineering technology graduates – often called “technologists” – and 2-year engineering technology program graduates – known as “technicians” – both begin careers with the same entry-level positions.
According to Florida Polytechnic University, technologists and technicians’ entry-level positions involve the designing and application of engineering concepts and techniques. Projects may include designing an automated system or a programming language to optimize a process system. With both levels of graduates demanding the same entry-level positions, it creates high levels of supply for few positions. As such, one way to increase the labor force in the plastics industry – geared towards manufacturing of the future – is to provide more entry level opportunities for all engineering graduates.
5 Friedman, Z. “Student Loan Debt Statistics in 2019: A $1.5 Trillion Crisis.” February 25, 2019. https://www.forbes.com/sites/zackfriedman/2019/02/25/student-loan-debt-statistics-2019/#5b78a949133f.
6 See Lerman (2018) “Working it Out: The Virtue of Apprenticeship.” The American Interest, Vol. 14, No. 3. October 17, 2018. https://www.the-american-interest.com/2018/10/17/the-virtue-of-apprenticeship/.
ApprenticeshipsBy and large, the U.S. enjoys an educated labor force, due mainly to the “academic only” approach to skill development in the U.S. In order to afford this, many take out loans – today in the U.S. there are more than 44 million borrowers who collectively owe $1.5 trillion in student loan debt in the U.S.5 However, according to Lerman (2018), U.S. researchers too often equate “skills” with years of schooling, completion of degrees, or test scores of math and verbal capabilities.6 Only a small percentage of the labor supply are trained for manufacturing jobs – particularly manufacturing of the future that will use more technology. This is a challenge that could be addressed in both short- and long-term durations.
In the short-term, the approaches available are limited and require firm level solutions. Firms should offer training programs particularly to those who are not skilled but have the interest to work in the manufacturing industry. Entry-level applicants often expect some form of training when joining a firm.
Firms could offer an apprenticeship program – a program that leads to a credentialed worker and part of an apprenticeship program that is approved/sanctioned by the U.S. Department of Labor (DOL) or an apprenticeship program that is registered with DOL. On June 26, 2019, DOL released proposed rules for a new apprenticeship structure and $183.8 million in funding for educational institutions to develop and expand apprenticeships through partnerships with companies that provide matching funds.
Figure 4. Top 10 Bachelor’s Degree Majors in School Year 2015-16Source: U.S. Department of Education
Business
Health professions and related programs
Social sciences and history
Psychology
Biological and biomedical sciences
Engineering technologies
Visual and performing arts
Communication, journalism, and related
Education
Computer and information sciences
19.4%
11.9%
8.4%
6.1%
5.9%
5.6%
4.8%
4.8%
4.5%
3 .4%

12 An Analysis of Workforce Development Issues in the U.S. Plastics Industry
The DOL added another $100 million in funding to expand apprenticeships.7
There are advantages to a DOL registered apprenticeship program, namely: paid work, work-based learning, mentorship, educational and instructional component, and an industry-recognized credential. There are administrative, organizational, and financial hurdles to high-quality apprenticeships. Box 3 lists the elements of a high-quality apprenticeship system. A high-quality apprenticeship system that provides an industry-recognized credential is essential for the longevity of labor supply of the industry. As Lerman (2018) argued:
“In the United States, evidence from surveys of more than 900 employers indicates that the overwhelming majority believe their apprenticeship programs are valuable and produce net gains. Nearly all sponsors reported that their apprenticeship program helps them meet their skill demands. Some 87% reported they would strongly recommend registered apprenticeships; an additional 11% recommended apprenticeship with some reservations. A recent U.S. study found 40-50% returns for two expensive apprenticeship programs.”8
7 U.S. government funding for apprenticeships have been historically low. The British budget for advertising its apprenticeship programs exceeds the entire U.S. budget for apprenticeship (See Lerman (2018). The Trump has been working on an industry-recognized system of apprenticeships, which would exist in parallel with the existing federally recognized apprenticeship program.
8 For the survey see Lerman R., Eyster, L., and Chambers, K. “The Benefits and Challenges of Registered Apprenticeship: The Sponsors’ Perspective.” The Urban Institute Center on Labor, Human Services, and Population. March 2009. https://www.urban.org/research/publication/benefits-and-challenges-registered- apprenticeship-sponsors-perspective.
While apprenticeship programs hold the promise of positive return on investment, companies might have reservations because when an apprentice leaves the firm and goes to a competitor it represents a negative return on investment. However, if companies have an apprenticeship program, and labor markets remain flexible, there will be fluidity in the movement of skilled labor supply from one firm to another as the supply of skilled and trained workers increases. Hence, the effect of skilled labor transfer within the industry is a net positive in the long run.
Tax IncentivesTax incentives are offered to companies relocating into some states. For example, New York is helping new and expanding businesses through tax-based incentives and innovative academic partnerships under the START-UP NY program. The program provides businesses the opportunity to operate tax-free for 10 years on or near eligible university or college campuses in New York State. Oklahoma is also using tax incentives to increase labor supply. Workers who relocate to Oklahoma receive tax and other credits (see Box 4).
Box 3. High-Quality Apprenticeship SystemA high-quality apprenticeship system requires several elements, including:
• Effective branding and broad marketing;
• Incentivizing direct marketing and organizing apprenticeships among private and public employers;
• Credible, recognized occupational standards with continuing research on changing requirements;
• Public funding for off-job quality instruction that includes teachers effective at helping apprentices prepare for and reflect on their work-based experiences;
• A system of credible end-point assessments of apprentices and programs;
• One or two certification bodies to audit programs and issue credentials;
• Simple systems enabling employers to create and track the progress of apprentices;
• Counseling and screening for prospective apprentices to insure they have the aptitude for, and interest in, the field;
• Training for the trainers/mentors of apprentices; and
• Research, evaluation and dissemination.
Source: Lerman (2018) “Working it Out: The Virtue of Apprenticeship.” The American Interest, Vol. 14, No. 3. October 17, 2018. https://www.the-american-interest.com/2018/10/17/the-virtue-of-apprenticeship/

13 An Analysis of Workforce Development Issues in the U.S. Plastics Industry
Box 4. Tax Incentives: A Tool to Increase Labor SupplyWe can learn from other industries using tax incentives to attract talent to a state. Offering tax incentives to companies relocating to a state are common. But how about tax incentives to workers moving into the state? Let’s take the case of Oklahoma. Aerospace companies hiring engineers in a variety of fields will receive a tax credit equal to 5.0% of the compensation paid to an engineer until January 1, 2026, or 10% if the engineer graduated from an Oklahoma college or university (up to $12,500 per employee per year), plus another credit of up to 50% of tuition reimbursement to an employee until January 1, 2016. Additionally, the engineer hired receives a tax credit of $5,000 per year until January 1, 2026.
In addition to a tax credit for aerospace engineers, vehicle manufacturing companies that manufacture or assemble motor vehicles hiring engineers that are newly employed in the vehicle manufacturing sector will receive a tax credit equal to 5% of the compensation paid to an engineer, and 10% if the engineer graduated from an Oklahoma college or university (up to $12,500 per employee per year), plus another credit of up to 50% of the tuition reimbursed to an employee.
Additionally, the engineer hired receives a tax credit of $5,000 per year for five years.Source: Oklahoma Department of Commerce

An Analysis of Workforce Development Issues in the U.S. Plastics Industry14
U.S. Veterans
Veterans are a potential labor source for the plastics industry. But how reliable is the veterans cohort as a source of workers and how many veterans can the manufacturing sector economy to tap? The answer depends on who you ask. If we look at BLS data, in 2018, the civilian noninstitutional population of veterans was estimated at 19.2 million. Based on the National Center for Veterans Analysis and Statistics of the U.S. Department of Veterans Affairs (VA), in 2018 veterans numbered 19,602,316. That number is estimated to decrease by 2.0% in 2019 – further declining 17.9% in 2028.
The age distribution of veterans paints a picture of an aging cohort. Those who are 65 years old and above are almost half (46.9%) of the total veterans’ population as shown in Figure 5. Those who are 20-34 years old represent 9.6% of veterans.
For companies employing veterans or thinking about tapping veterans as a pool of labor supply, it is worth noting where most of the veterans reside. According to the VA, 50% of veterans reside in 10 states listed in Table 5. Illinois ranked 10th – in the top 10 states in 2017 – but will not in 2027 and 2037, according to this forecast. Veterans are projected to move to the western and southern regions of the country.
Table 5. Top 10 States Where Veterans LiveRank 2017 2027 2037
1 California Texas Texas
2 Texas California Florida
3 Florida Florida California
4 Pennsylvania North Carolina North Carolina
5 New York Virginia Virginia
6 Ohio Georgia Georgia
7 North Carolina Pennsylvania Ohio
8 Virginia Ohio Pennsylvania
9 Georgia New York Washington
10 Illinois Washington New YorkSource: National Center for Veterans Analysis and Statistics
Based on BLS data, 326,000 veterans were unemployed in 2018, bringing the veterans’ unemployment rate to 3.5%. If we zero into Gulf War-era II veterans, last year the unemployment rate was 3.8%.
These numbers have declined dramatically over time as the U.S. economy turned around from the Great Recession. In 2010, following the end of the Great Recession, unemployment rates for all veterans was 8.7%, and 11.5% for Gulf-War era II veterans. Over 60% of working veterans worked in the private sector, according to the VA. Most
20-241.3%25-348.3%35-4410.4%
65<46.9%
<200.4%
Figure 5. Veterans Age Distribution 2018Source: U.S. Bureau of Labor Statistics
45 to 5414.0%
55 to 6418.6%
Figure 6. Occupations of Employed Veterans by Age Group (%)Source: National Center for Veterans Analysis and Statistics, August 2018
19.4
%
16.7
%
15.1%
17 to 29 30 to 39 40 to 49 50 to 59 60+
Management/Professional Production & Transportation Construction Service Sales and Office
21.6
%
20.1%
37.2
%
14.4
%
14.2
%
16.4
%
16.7
%
40%
16%
13% 14
.2%
15.8
%
36.7
%
19.5
%
14.2
%
12.9
% 15.8
%
38.5
%
18.3
%
11% 13
%
18.1%
15 An Analysis of Workforce Development Issues in the U.S. Plastics Industry
veterans are in management and professional occupations as shown in Figure 6. For those in the 40-49 age group, 40.0% are in management and professional occupations. The age groups with the highest percentage of veterans in production and transportation occupations are the 50-59 and 60 and older age groups. In the 17-29-year-old age group, management and professional occupations have the highest share (24.7%), followed by service (21.6%) and sales and office (20.1%) occupations.
Judging from these numbers alone, it might appear that as a source of potential workers, veterans do not provide a steady long-term labor supply for the U.S. plastics industry. The expected number of veterans are declining, and veteran unemployment rate has fallen – lower than the national civilian labor unemployment rate.
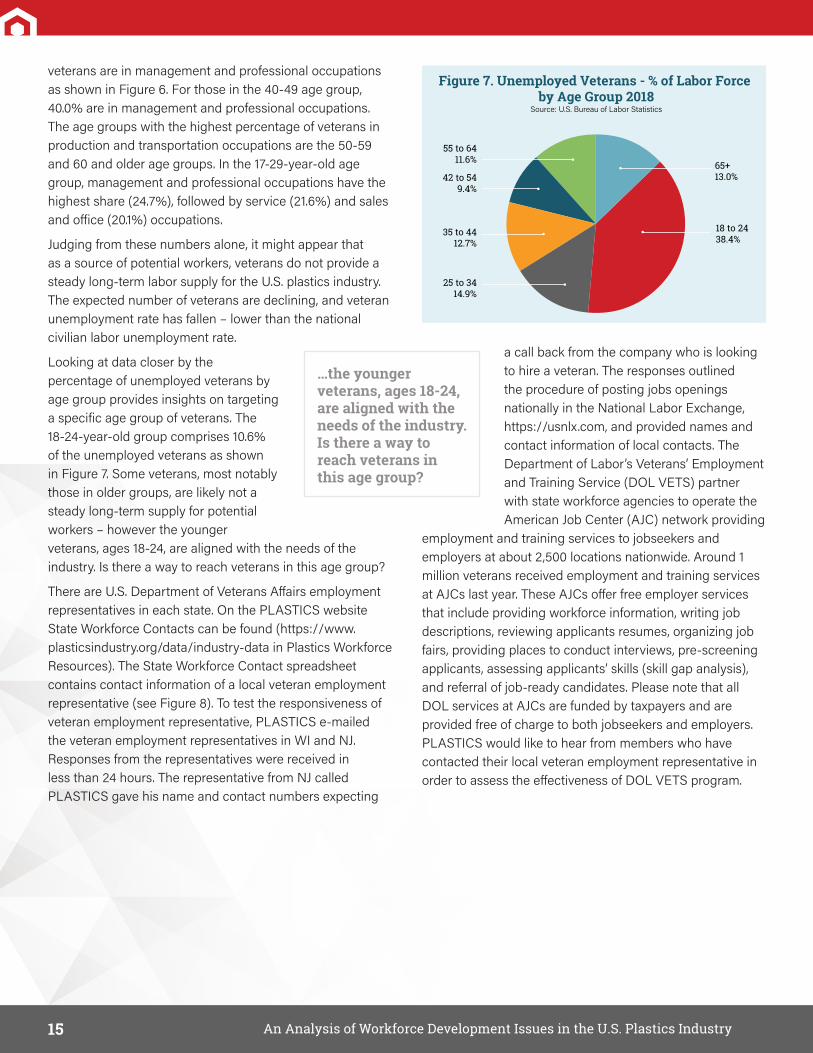
Looking at data closer by the percentage of unemployed veterans by age group provides insights on targeting a specific age group of veterans. The 18-24-year-old group comprises 10.6% of the unemployed veterans as shown in Figure 7. Some veterans, most notably those in older groups, are likely not a steady long-term supply for potential workers – however the younger veterans, ages 18-24, are aligned with the needs of the industry. Is there a way to reach veterans in this age group?
There are U.S. Department of Veterans Affairs employment representatives in each state. On the PLASTICS website State Workforce Contacts can be found (https://www.plasticsindustry.org/data/industry-data in Plastics Workforce Resources). The State Workforce Contact spreadsheet contains contact information of a local veteran employment representative (see Figure 8). To test the responsiveness of veteran employment representative, PLASTICS e-mailed the veteran employment representatives in WI and NJ. Responses from the representatives were received in less than 24 hours. The representative from NJ called PLASTICS gave his name and contact numbers expecting
a call back from the company who is looking to hire a veteran. The responses outlined the procedure of posting jobs openings nationally in the National Labor Exchange, https://usnlx.com, and provided names and contact information of local contacts. The Department of Labor’s Veterans’ Employment and Training Service (DOL VETS) partner with state workforce agencies to operate the American Job Center (AJC) network providing
employment and training services to jobseekers and employers at about 2,500 locations nationwide. Around 1 million veterans received employment and training services at AJCs last year. These AJCs offer free employer services that include providing workforce information, writing job descriptions, reviewing applicants resumes, organizing job fairs, providing places to conduct interviews, pre-screening applicants, assessing applicants’ skills (skill gap analysis), and referral of job-ready candidates. Please note that all DOL services at AJCs are funded by taxpayers and are provided free of charge to both jobseekers and employers. PLASTICS would like to hear from members who have contacted their local veteran employment representative in order to assess the effectiveness of DOL VETS program.
65+13.0%
35 to 4412.7%
55 to 6411.6%
Figure 7. Unemployed Veterans - % of Labor Force by Age Group 2018
Source: U.S. Bureau of Labor Statistics
42 to 549.4%
25 to 3414.9%
18 to 2438.4%
…the younger veterans, ages 18-24, are aligned with the needs of the industry. Is there a way to reach veterans in this age group?

16 An Analysis of Workforce Development Issues in the U.S. Plastics Industry
Figure 8. Veterans Contact on PLASTICS
An Analysis of Workforce Development Issues in the U.S. Plastics Industry17
Local Workforce Development Initiatives
9 For a detailed analysis and discussion of the outcomes of Cleveland’s experience in Workforce Development, see “Creating and Sustaining a Coherent Voice for Employers in Workforce Development: The Cleveland Experience” D. E. Berry, Workforce Intermediaries, Temple University Press (2004).
Last year, Ohio ranked second in plastics industry employment after California. PLASTICS estimates the number of Ohio employees at 74,200 in 2018. With the significant presence of plastics industry in Ohio, looking at previous efforts on workforce development in the state provide noteworthy observations particularly for initiatives that touched upon the plastics industry or its supply chain (see Table 6).
Workforce development initiatives are nothing new. Programs aimed at resolving the workforce development issue decades ago clearly did not resolve the problem. A case in point: the Jobs and Workforce Initiative (JWFI) in 1996 of the Greater Cleveland Growth Association, one of the nation’s largest metropolitan Chambers of Commerce.9 At that time, the economy was expanding, the labor markets were tight, so businesses came together to address labor shortages. Cleveland responded and actively engaged employers in workforce development. Founded and funded by the Cleveland Foundation, The George Fund Foundation, and Cleveland Tomorrow, the economic development arm of the chief executives from the region’s largest companies, the JWFI was well funded and organized, with buy-in from the business sector. The employers involved in JWFI recognized early on that workforce development efforts should be employer driven, regional in scope, and partnership based.
The first recommendation of JWFI – as summarized in Table 6 – was to respond to immediate occupational shortages. JWFI supported several new training programs based on the assumption that more cost-effective and larger scale training would be possible by aggregating demand for workers among companies. Second, to link workforce development to economic development, JWFI supported several initiatives that responded to the common workforce needs of cluster companies. For example, the WIRE-Net Machinist Training Initiative’s purpose was to increase the number of entry-level machinists in Northeast Ohio. According to Berry (2004), since the program’s inception in 1996, 213 trainees were enrolled, of which 140 graduated, and 115 were placed in jobs at 80 companies. However, it was unclear in the report over what period of time the 115 placements took place.
Third, to upgrade basic and technological skills of current, future, and transitional workforce, the workers were segmented accordingly. For incumbent workers the focus was on skills upgrading with major emphasis on basic literacy. For future workers, the training emphasized a better understanding of the skills required in the modern workplace and an awareness of career opportunities. For transitional workers, efforts were focused on building community capacity to address the welfare-to-work challenges confronting Cleveland. The JWFI provided financial support and collaborated with the county, the Regional Transit Authority, and the Solon Chamber of Commerce to develop a reverse commute program that linked inner city jobseekers with employment opportunities in the suburbs. Fourth, to create customer-oriented workforce development services, resources were used to benchmark other One Stop systems around the country, pay for consultants to assist in planning and design of the Cleveland-Cuyahoga County one stop system and assist with developing the technology plan for the local system. Last, building employer driven systems did not materialize. Local governments – Cleveland and Cuyahoga County – opted to create their own separate workforce systems.
The success of workforce development efforts such as those undertaken in Cleveland in 1996 hinge upon several factors. While public and private sector engagement and funding are critical components for workforce development initiatives, macroeconomic conditions will continue affecting labor markets. JWFI was well funded – close to $4 million of financial support to invest in specific initiatives. Public-private sector engagements ran high. However, the degree of employer engagement on skills-upgrading training programs would be lower when the economy is contracting, and the unemployment rate runs high. In fact, the Cleveland case study shows that as the labor market loosened, the economy slowed substantially and the labor shortage ceased to be an issue. The opposite problem emerged – jobs for dislocated workers.

18 An Analysis of Workforce Development Issues in the U.S. Plastics Industry
On a national level, there have been federal programs such as the Workforce Investment Act in 1998 promulgated to improve occupational skills.10 In a national survey of more than 160 local workforce system professionals, 43.0% indicated that their single most important challenge was engaging employers in their programs, and 66.0% said employers did not use their services because they do not meet employer needs.11
10 The Workforce Investment Act is a federal act that “provides workforce investment activities, through statewide and local workforce investment systems, that increase the employment, retention, and earnings of participants, and increase occupational skill attainment by participants, and, as a result, improve the quality of the workforce, reduce welfare dependency, and enhance the productivity and competitiveness of the Nation.” The Workforce Innovation and Opportunity Act (WIOA) is a United States public law that replaced the previous Workforce Investment Act of 1998 (WIA) as the primary federal workforce development legislation to bring about increased coordination among federal workforce development and related programs.
11 See Berry, D.E. “Creating and Sustaining a Coherent Voice for Employers in Workforce Development: The Cleveland Experience.” Workforce Intermediaries. Temple University Press, 2004.
Prior to the Workforce Investment Act in 1998, the Job Training Partnership Act of 1982 was enacted to establish federal assistance programs to prepare unskilled adults to enter into the labor force and to provide job training to economically disadvantaged and other individuals facing serious barriers to employment. However, the Bureau of National Affairs found that only 9% of firms surveyed had any involvement with the Job Training Partnership Act.
Table 6. Jobs and Workforce Initiatives Objectives and Actions – SummaryObjective Actions
Respond to immediate occupational shortages
Convened companies with similar worker needs and supported several training programs.
Link workforce development to economic development priorities
Supported training initiatives to address the needs of industry clusters, including polymers, metalworking, automotive manufacturing, etc.
Upgrade basic and technological skills of incumbent, future, and transitional workers
Segmented workers into incumbent, future, and transition elements to guide recommendations to address high-priority skills development needs.
Create customer workforce development services
Call for a One Stop workforce development system in Cuyahoga County to engage and serve both employers and residents.
Build employer driven systems City of Cleveland and Cuyahoga County opted to create their own separate workforce system.

An Analysis of Workforce Development Issues in the U.S. Plastics Industry19
ConclusionThe importance of workforce development initiatives tends to be procyclical—related to economic fluctuations. These initiatives are necessary when labor markets tighten as the economy expands. However, it is important not to lose sight that since the macroeconomy goes through a cycle, the labor shortage could emerge again, particularly given changing demographics. With an aging population and low rate of new labor entrants into the plastics industry, it is important to have a long-term approach to workforce development – especially for the U.S. plastics industry.
It has been 22 years since JWFI was implemented in Ohio and with significant changes in the economy, technology and labor markets, workforce development remains an issue. The recently proposed rules for a new apprenticeship structure and funding by the DOL support a national effort to enhance workforce development initiatives. A workforce development initiative must have components to address short-term labor issues. Responding to immediate occupational shortages is highly important.
Absent an industry-wide structured or organized program, organizations would need to leverage every available hiring option and network with community resources, schools, civic organizations, job boards, and others. Word-of-mouth marketing using information technology is another approach. A structured workforce initiative to address short-term labor shortages that’s not cost prohibitive, which companies can tap is the Department of Labor’s Veterans’ Employment and Training Service (DOL VETS). DOL VETS partner with state workforce agencies to operate the American Job Center (AJC) network of about 2,500 locations across the nation.
To ensure the U.S. plastics industry’s longevity, a long-term approach to workforce development needs to be in place. An information campaign focused on informing high school and college students that “U.S. Plastics Industry is Hiring” needs to be explored. Moreover, while an industry-wide apprenticeship program would be useful, it could be cost prohibitive. The ideal approach to ensure a steady supply for skilled workforce for the plastics industry is a program that leads to a credentialed worker approved or sanctioned by the DOL. Studies have shown that the industry benefits from an apprenticeship program – not just the firm. If 100 companies budget for an apprentice each year, that’s increasing labor supply by 100 for the industry – all else equal. The cost to the company could be limited to wages and the supervisor or mentor’s time. There is no controlling for resignations. However, an apprentice’s departure from one firm to another is replicated across the industry – it’s not unique to a firm nor a single occurrence – hence it supports labor market flexibility. As previously discussed, the net effect of skilled labor transfer within the industry is net positive in the long-term.
For questions, please contact Perc Pineda, PhD at [email protected] or 202.974.5232.

1425 K Street NW, Suite 500, Washington, DC 20005P 202.974.5200 | plasticsindustry.org