AN ANALYSIS OF THE VALUE CHAIN OF...
139
AN ANALYSIS OF THE VALUE CHAIN OF QUINOA Word count: 31.298 Korneel Merchiers Student number : 01205083 Promotor/ Supervisor: Prof. dr. Broos Maenhout Commissioner: Drs. Thuzar Linn Master’s Dissertation submitted to obtain the degree of : Master of Science in Business Engineering: Operations Management Academic year: 2016 - 2017
Transcript of AN ANALYSIS OF THE VALUE CHAIN OF...
AN ANALYSIS OF THE VALUE CHAIN
OF QUINOA
Word count: 31.298
Korneel Merchiers Student number : 01205083
Promotor/ Supervisor: Prof. dr. Broos Maenhout
Commissioner: Drs. Thuzar Linn
Master’s Dissertation submitted to obtain the degree of:
Master of Science in Business Engineering: Operations Management
Academic year: 2016 - 2017

CONFIDENTIALITY AGREEMENT I declare that the content of this Master’s Dissertation may be consulted and/or reproduced, provided that the source is referenced. Name student : Korneel Merchiers Signature


I
Abstract
Agriculture plays an important role in less developed countries. People need agriculture to be
able to feed themselves and survive. Besides this, agriculture is also responsible for the em-
ployment and revenues of a lot of local populations in these countries. Often, the productivity
of agriculture in less developed countries does not live up to its full potential. Links and pro-
portions in the value chain are not optimal and are often fragmented. In such less developed
countries, farmers face the problem of having to sell their products at too low prices. On the
other hand, too high prices are set for consumers. When applied to Quinoa, it is clear that all
these facets occur. When farmers discovered that quinoa could be cultivated on less nutritious
fields, the production started to grow. The last couple of years, the production of quinoa is re-
ally booming. This resulted in the year 2013 being named as “The international year of quinoa”.
Although Peru and Bolivia are among the poorest nations in Latin-America, more than half of
the global supply of quinoa is actually coming from these countries. It was in the early 2000s
that Western nations discovered Quinoa. Since then, the demand has risen and so has the price.
Peru and Bolivia’s gross domestic product have only benefited from this. A question that often
comes to mind is “How long can Peru and Bolivia depend on quinoa as the agent of their pros-
perity?”. Quinoa-growing farmers could no longer afford to eat the crops themselves because
the price tripled but is now again decreasing. Domestic consumption has dropped and people
that migrated to cities in search of a better life are returning to their arid homeland to grow
quinoa to export. Furthermore, farmers and ranchers associations are starting up to influence
rural development policies. These are focused on associating small producers to face national
and international markets, supporting training and capacity building. Besides these, there are
of course independent farmers, processors, exporters, retail stores and other organizations who
have linkages with each other and thus influence the value chain.
The concrete problem of my thesis involves the analysis of the value chain of quinoa from a
less developed country like Peru to a developed country like Belgium (or Europe in general). In
the literature, both Peru and Bolivia are considered because, as a neighbouring country of Peru,
Bolivia is also an important producer of quinoa in the world, just like Peru. The objective is to
identify the different stages in the value chain as well as the different actors in each stage, de-
scribe the deficiencies occurring in the value chain and look for future possibilities to enhance
II
and upgrade the critical parts of the value chain. In such a way, the impact the actors have in
the value chain and on each other is estimated based on their constraints and margins. Fur-
thermore, the influence on the value that is created by them and the total and final value that
is delivered to the customer willing to buy quinoa is assessed. Our research is mainly based on
available literature and our own findings. Since Peruvian companies were not really willing to
share their production quantities and corresponding prices, averages and approximations were
taken to be able to provide an estimate for the country as a whole. This allowed us to come up
with a reliable value chain and some recommendations for the future of the quinoa industry in
Peru.
III
Acknowledgements
I would first like to thank my master’s dissertation supervisor, professor Maenhout, for his ap-
propriate assistance and guidance during the research and writing. I would also like to thank
Inge Overmeer, Agriculture Manager at Solid International, for helping me getting into contact
with organizations in Peru and providing me with significant information and data. Further-
more, I would like to acknowledge my aunt for helping me with Spanish translations and the
Peruvians that provided me with information. Finally, I want to express my gratefulness to my
parents and grandparents for supporting and encouraging me throughout the process of re-
searching and writing this thesis. This accomplishment would not have been possible without
each of the above.

Contents
I Literature 1
1 Quinoa 3
1.1 Introduction . . . . . . . . . . . . . . . . . . . . . . . . . . . . . . . . . . . . . . . . . . 3
1.2 Social-Economic Context . . . . . . . . . . . . . . . . . . . . . . . . . . . . . . . . . . 3
1.2.1 Before 2000: Food Insecurity . . . . . . . . . . . . . . . . . . . . . . . . . . . . 3
1.2.2 Growth for the period 2000-2013 . . . . . . . . . . . . . . . . . . . . . . . . . . 5
1.2.3 Future . . . . . . . . . . . . . . . . . . . . . . . . . . . . . . . . . . . . . . . . . 9
1.3 Characteristics of the International Quinoa Trade . . . . . . . . . . . . . . . . . . . . 10
2 Methods of Value Chain Analysis 15
2.1 Theory of Value Chain Analysis . . . . . . . . . . . . . . . . . . . . . . . . . . . . . . . 15
2.1.1 Value Chain: Definitions . . . . . . . . . . . . . . . . . . . . . . . . . . . . . . . 15
2.1.2 Creating Value in a Supply Chain Environment . . . . . . . . . . . . . . . . . 16
2.1.3 Importance of Value Chain Analysis . . . . . . . . . . . . . . . . . . . . . . . . 18
2.1.4 Global Value Chains . . . . . . . . . . . . . . . . . . . . . . . . . . . . . . . . . 18
2.2 Methodology for Value Chain Analysis . . . . . . . . . . . . . . . . . . . . . . . . . . . 20
2.3 Value Chains in Agriculture . . . . . . . . . . . . . . . . . . . . . . . . . . . . . . . . . 21
2.3.1 Introduction . . . . . . . . . . . . . . . . . . . . . . . . . . . . . . . . . . . . . . 21
2.3.2 Value Chain concepts . . . . . . . . . . . . . . . . . . . . . . . . . . . . . . . . 21
2.3.3 Agricultural Value Chains and Food Security . . . . . . . . . . . . . . . . . . . 22
2.3.4 Value Chain Analysis to Achieve Nutrition Goals . . . . . . . . . . . . . . . . . 24
2.3.5 Global Value Chains in Agriculture . . . . . . . . . . . . . . . . . . . . . . . . . 25
2.4 Game Theory . . . . . . . . . . . . . . . . . . . . . . . . . . . . . . . . . . . . . . . . . 27
2.4.1 Introduction . . . . . . . . . . . . . . . . . . . . . . . . . . . . . . . . . . . . . . 27
2.4.2 Application of Game Theory in Agriculture . . . . . . . . . . . . . . . . . . . . 28
IV
CONTENTS V
2.5 Upgrading the Value Chain . . . . . . . . . . . . . . . . . . . . . . . . . . . . . . . . . 31
2.5.1 Introduction . . . . . . . . . . . . . . . . . . . . . . . . . . . . . . . . . . . . . . 31
2.5.2 "Future" Possibilities for Upgrading . . . . . . . . . . . . . . . . . . . . . . . . 33
II Case Study: Illustration 35
3 Examples of Value Chain Analysis 37
3.1 Introduction . . . . . . . . . . . . . . . . . . . . . . . . . . . . . . . . . . . . . . . . . . 37
3.2 The Coffee Value Chain . . . . . . . . . . . . . . . . . . . . . . . . . . . . . . . . . . . 38
3.2.1 Basic Coffee Supply Chain . . . . . . . . . . . . . . . . . . . . . . . . . . . . . . 38
3.2.2 Case Study: Coffee Value Chain from Nicaragua to Finland . . . . . . . . . . 39
3.3 The Cocoa Value Chain . . . . . . . . . . . . . . . . . . . . . . . . . . . . . . . . . . . . 44
III Case Study: An Analysis of the Value Chain of Quinoa 47
4 Socio-Economic Context 51
4.1 Introduction . . . . . . . . . . . . . . . . . . . . . . . . . . . . . . . . . . . . . . . . . . 51
4.2 Population and Education . . . . . . . . . . . . . . . . . . . . . . . . . . . . . . . . . . 52
4.3 Participation in Economic Activity . . . . . . . . . . . . . . . . . . . . . . . . . . . . . 52
4.4 Social Impact by Outsiders . . . . . . . . . . . . . . . . . . . . . . . . . . . . . . . . . 53
4.5 Prospects for the Future . . . . . . . . . . . . . . . . . . . . . . . . . . . . . . . . . . . 53
5 Characteristics of the Value Chain of Quinoa 57
5.1 Introduction . . . . . . . . . . . . . . . . . . . . . . . . . . . . . . . . . . . . . . . . . . 57
5.2 Stages of the Value Chain . . . . . . . . . . . . . . . . . . . . . . . . . . . . . . . . . . 59
5.2.1 Provision of Inputs . . . . . . . . . . . . . . . . . . . . . . . . . . . . . . . . . . 60
5.2.2 Primary Production . . . . . . . . . . . . . . . . . . . . . . . . . . . . . . . . . 61
5.2.3 Storage and Basic Processing . . . . . . . . . . . . . . . . . . . . . . . . . . . . 64
5.2.4 Industrialization . . . . . . . . . . . . . . . . . . . . . . . . . . . . . . . . . . . 64
5.2.5 Marketing . . . . . . . . . . . . . . . . . . . . . . . . . . . . . . . . . . . . . . . 65
5.2.6 Final Consumption . . . . . . . . . . . . . . . . . . . . . . . . . . . . . . . . . . 67
5.3 Multi-Stage Actors . . . . . . . . . . . . . . . . . . . . . . . . . . . . . . . . . . . . . . 68
5.3.1 COOPAIN . . . . . . . . . . . . . . . . . . . . . . . . . . . . . . . . . . . . . . . 69
5.3.2 Vinculos Agricolas . . . . . . . . . . . . . . . . . . . . . . . . . . . . . . . . . . 69
CONTENTS VI
5.3.3 De Guste Group SAC . . . . . . . . . . . . . . . . . . . . . . . . . . . . . . . . . 70
5.3.4 Avendaño Trading Company SAC . . . . . . . . . . . . . . . . . . . . . . . . . 70
5.3.5 Alisur SAC . . . . . . . . . . . . . . . . . . . . . . . . . . . . . . . . . . . . . . . 71
5.3.6 The Government . . . . . . . . . . . . . . . . . . . . . . . . . . . . . . . . . . . 71
5.3.7 Solid International - Solid Food Peru/Europe . . . . . . . . . . . . . . . . . . 71
5.4 Indirect Actors . . . . . . . . . . . . . . . . . . . . . . . . . . . . . . . . . . . . . . . . . 73
6 Analysis of the Value Chain of Quinoa 75
6.1 Assessing the Value . . . . . . . . . . . . . . . . . . . . . . . . . . . . . . . . . . . . . . 75
6.1.1 Introduction . . . . . . . . . . . . . . . . . . . . . . . . . . . . . . . . . . . . . . 75
6.1.2 Qualitative Analysis . . . . . . . . . . . . . . . . . . . . . . . . . . . . . . . . . 75
6.1.3 Quantitative Analysis . . . . . . . . . . . . . . . . . . . . . . . . . . . . . . . . . 80
6.2 Upgrading the Value Chain of Quinoa . . . . . . . . . . . . . . . . . . . . . . . . . . . 85
6.2.1 Introduction . . . . . . . . . . . . . . . . . . . . . . . . . . . . . . . . . . . . . . 85
6.2.2 Improvement Guidelines . . . . . . . . . . . . . . . . . . . . . . . . . . . . . . 85
6.2.3 Challenges . . . . . . . . . . . . . . . . . . . . . . . . . . . . . . . . . . . . . . . 86
6.2.4 Future Possibilities . . . . . . . . . . . . . . . . . . . . . . . . . . . . . . . . . . 88
7 Conclusion 91
Bibliography 93
Appendices 99
A Worldwide Production and Distribution of Quinoa 100
B Distribution and Production in Peru 101
C Export of Quinoa from Peru to Europe: Value and Quantity 103
D Example of a Value Chain: The Furniture Industry 105
E Participation of Nicaragua in Global Value Chains 107
F The Position of Peru and Bolivia 109
F.1 Human Development Index: Components and Trends . . . . . . . . . . . . . . . . . 109
F.1.1 Definitions . . . . . . . . . . . . . . . . . . . . . . . . . . . . . . . . . . . . . . . 109

CONTENTS VII
F.1.2 Interpretation . . . . . . . . . . . . . . . . . . . . . . . . . . . . . . . . . . . . . 110
F.2 Poverty in Bolivia and Peru . . . . . . . . . . . . . . . . . . . . . . . . . . . . . . . . . 111
F.2.1 Introduction . . . . . . . . . . . . . . . . . . . . . . . . . . . . . . . . . . . . . . 111
F.2.2 Population Trends, Health Outcomes and Education Achievements . . . . . 111
F.2.3 Interpretation . . . . . . . . . . . . . . . . . . . . . . . . . . . . . . . . . . . . . 112
F.3 National Income and Composition of Resources . . . . . . . . . . . . . . . . . . . . . 113
F.4 Employment Rates and Labour Productivity . . . . . . . . . . . . . . . . . . . . . . . 113
F.4.1 Definitions . . . . . . . . . . . . . . . . . . . . . . . . . . . . . . . . . . . . . . . 113
F.4.2 Interpretation . . . . . . . . . . . . . . . . . . . . . . . . . . . . . . . . . . . . . 114
F.5 International Integration . . . . . . . . . . . . . . . . . . . . . . . . . . . . . . . . . . 115
F.5.1 Definitions . . . . . . . . . . . . . . . . . . . . . . . . . . . . . . . . . . . . . . . 115
F.5.2 Interpretation . . . . . . . . . . . . . . . . . . . . . . . . . . . . . . . . . . . . . 115
List of Tables
1.1 The evolution of export and production (in metric tons) and the associated prices
($/kg) in Peru. Reprinted from (Vinculos Agricolas, nd). . . . . . . . . . . . . . . . . 13
3.1 Consumer prices (€/kg) of conventional and Fair Trade coffee in Finland based on
purchases in one retail chain for the years 2006-2009. Copied from (Valkila et al.,
2010). . . . . . . . . . . . . . . . . . . . . . . . . . . . . . . . . . . . . . . . . . . . . . . 42
4.1 Population and education in Peru: Region of Ayacucho and Lima. Copied from
(Censos nacionales de población y de vivienda, 2008). . . . . . . . . . . . . . . . . . 54
4.2 Participation in Economic Activity. Copied from (Censos nacionales de población
y de vivienda, 2008). . . . . . . . . . . . . . . . . . . . . . . . . . . . . . . . . . . . . . 55
5.1 Main components of the value chain of quinoa. Reprinted from (Salcedo et al.,
2013) based on data from (IDEPRO, 2012)(as cited by (Salcedo et al., 2013)). . . . . 58
5.2 Harvested area, production and yield for different regions in Peru. Reprinted from
(Cenagro, 2012)(as cited by (Hatch et al., 2015)). . . . . . . . . . . . . . . . . . . . . . 63
5.3 The Net Export Volume (kg) and Price per kg ($/kg) for five exporters of quinoa in
Peru. . . . . . . . . . . . . . . . . . . . . . . . . . . . . . . . . . . . . . . . . . . . . . . 68
6.1 The price for producers (Farm Price), for Peruvian consumers, for export, for in-
termediaries and for European consumers in $/kg for the period 2007-2016. Based
on an aggregation of data from (Vinculos Agricolas, nd), (Fallis, 2013), (Hatch
et al., 2015) and (Bio-Planet, nd). . . . . . . . . . . . . . . . . . . . . . . . . . . . . . . 83
6.2 Margins for farmers, processors/exporters, intermediaries and wholesalers/retailers
in % for the period 2007-2016. . . . . . . . . . . . . . . . . . . . . . . . . . . . . . . . 84
VIII

LIST OF TABLES IX
C.1 The Import Value and Quantity of Quinoa from Peru to Different European Coun-
tries for the period 2012 - 2016. Retrieved from (European Commission, nd). . . . . 104
F.1 Human Development Index and components for 2014. . . . . . . . . . . . . . . . . 117
F.2 Human Development Index for 1990-2014 and the average annual HDI growth
per country for this period. . . . . . . . . . . . . . . . . . . . . . . . . . . . . . . . . . 118
F.3 Poverty indices for Bolivia and Peru in 2008 and 2012 respectively. . . . . . . . . . . 119
F.4 Poverty indices for Peru from 2008 to 2012. . . . . . . . . . . . . . . . . . . . . . . . . 119
F.5 Population trends, mortality rates, literacy rate and secondary education rate for
Belgium, Peru and Bolivia. . . . . . . . . . . . . . . . . . . . . . . . . . . . . . . . . . . 120
F.6 National income and composition of resources. . . . . . . . . . . . . . . . . . . . . . 121
F.7 Employment rates and labour productivity in Belgium, Bolivia and Peru. . . . . . . 122
F.8 International integration of Belgium, Peru and Bolivia. . . . . . . . . . . . . . . . . . 123

List of Figures
1.1 Cultivated Area (in ha) in Peru and Bolivia for the period 2000-2015. Based on an
aggregation of data from (Jacobsen, 2011); (Hatch et al., 2015); (Fallis, 2013) and
(Documento conjunto ALADI - FAO, 2014). Note that the cultivated area for Peru
in 2015 is an estimation. . . . . . . . . . . . . . . . . . . . . . . . . . . . . . . . . . . . 6
1.2 Production (in tons) in Peru and Bolivia for the period 2000-2015. Based on an
aggregation of data from (Jacobsen, 2011); (Hatch et al., 2015); (Fallis, 2013) and
(Documento conjunto ALADI - FAO, 2014). . . . . . . . . . . . . . . . . . . . . . . . . 7
1.3 Yield (in ton/ha) in Peru and Bolivia for the period 2000-2015. Based on an ag-
gregation of data from (Jacobsen, 2011); (Hatch et al., 2015); (Fallis, 2013) and
(Documento conjunto ALADI - FAO, 2014). Note that the yield for Peru in 2015 is
based on the estimation of the cultivated area. . . . . . . . . . . . . . . . . . . . . . . 8
1.4 Production and export of quinoa in Bolivia and Peru. Based on an aggregation
of data from (Jacobsen, 2011); (Hatch et al., 2015); (Fallis, 2013) and (Documento
conjunto ALADI - FAO, 2014). . . . . . . . . . . . . . . . . . . . . . . . . . . . . . . . . 9
1.5 Global world exports in quinoa (2012). Reprinted from (Comtrade and LAIA, nd)(as
cited by (Salcedo et al., 2013)). Note: LAIA = Latin American Integration Associa-
tion; UE = EU = European Union . . . . . . . . . . . . . . . . . . . . . . . . . . . . . . 12
1.6 Exports (tons) and the related export price ($/kg) of quinoa from Peru: 2000-2016.
Based on an aggregation of data from [LAIA](as cited by (Salcedo et al., 2013)) and
(Vinculos Agricolas, nd). . . . . . . . . . . . . . . . . . . . . . . . . . . . . . . . . . . . 12
1.7 Main Exporting Countries towards the European Union for the period 2011-2015.
Reprinted from (CBI - Centre for the Promotion of Imports from developing coun-
tries, nd). . . . . . . . . . . . . . . . . . . . . . . . . . . . . . . . . . . . . . . . . . . . . 13
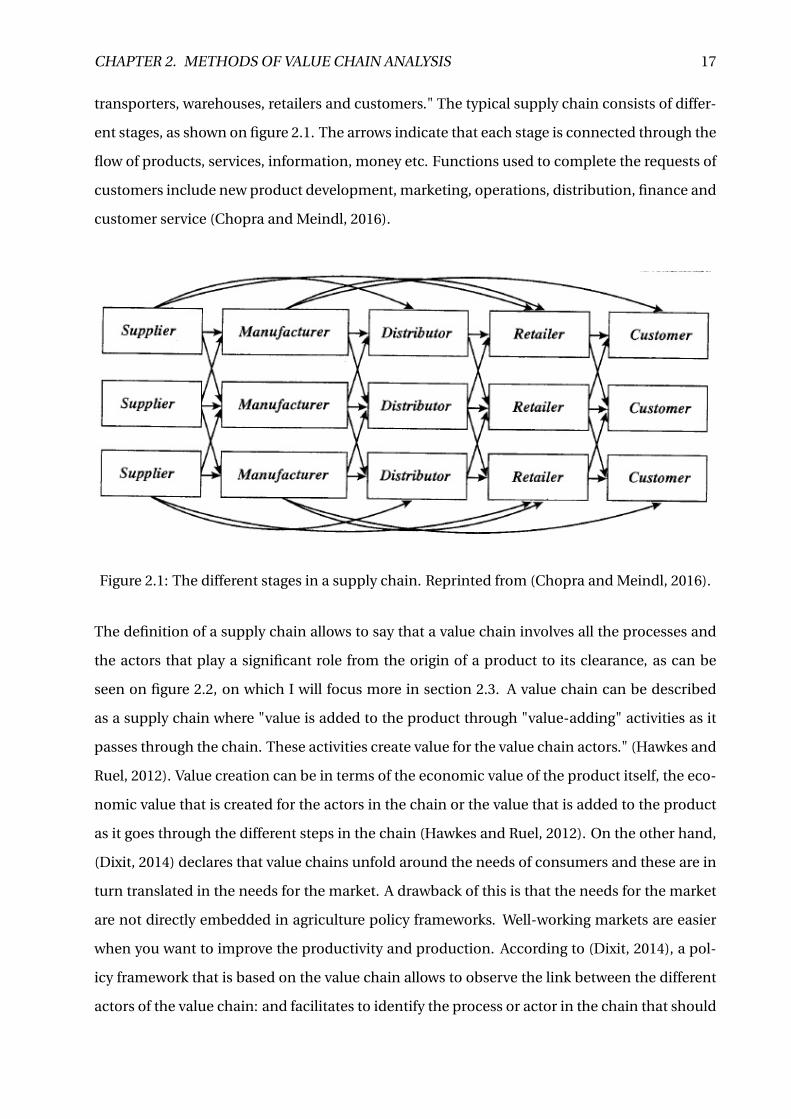
2.1 The different stages in a supply chain. Reprinted from (Chopra and Meindl, 2016). 17
X

LIST OF FIGURES XI
2.2 A simplified representation of a food supply chain. Reprinted from (Hawkes and
Ruel, 2012). . . . . . . . . . . . . . . . . . . . . . . . . . . . . . . . . . . . . . . . . . . . 22
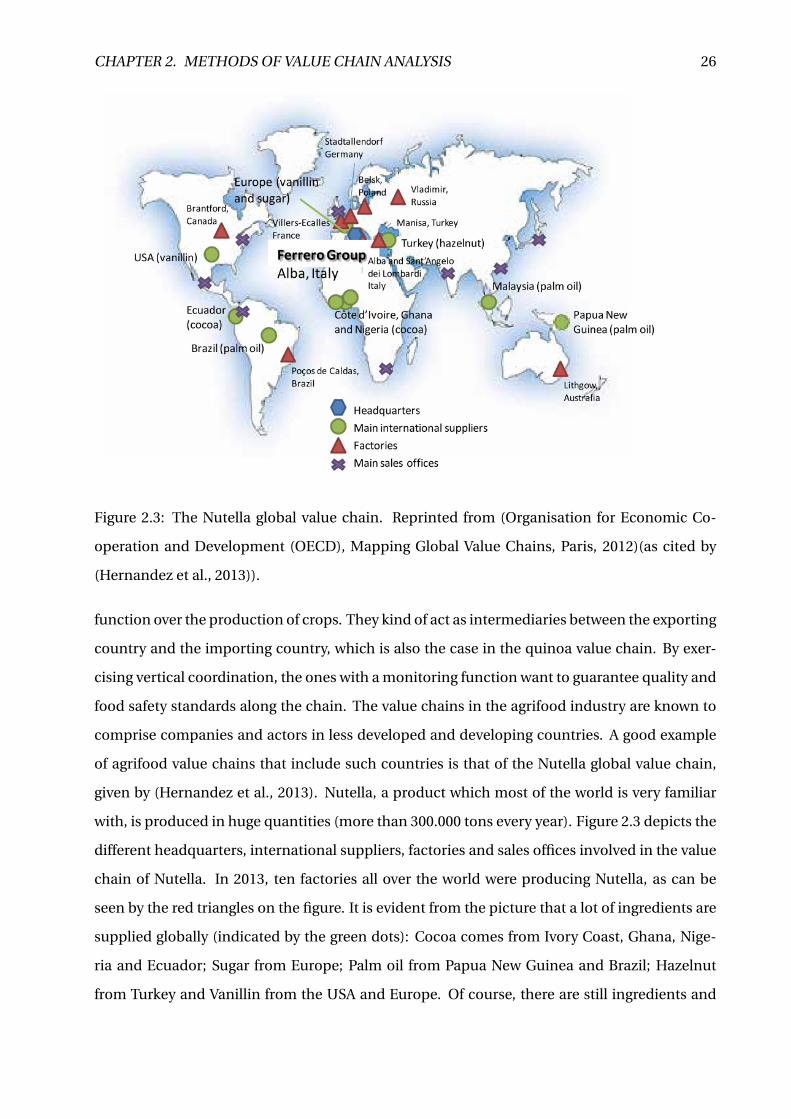
2.3 The Nutella global value chain. Reprinted from (Organisation for Economic Co-
operation and Development (OECD), Mapping Global Value Chains, Paris, 2012)(as
cited by (Hernandez et al., 2013)). . . . . . . . . . . . . . . . . . . . . . . . . . . . . . 26
3.1 The basic coffee supply chain. Reprinted from (Gilbert, 2008). . . . . . . . . . . . . 39
3.2 The marketing chain of coffee from Nicaragua to Finland. Reprinted from (Valkila
et al., 2010). . . . . . . . . . . . . . . . . . . . . . . . . . . . . . . . . . . . . . . . . . . 44
3.3 The cocoa-chocolate supply chain. Reprinted from (Gilbert, 2008). . . . . . . . . . 45
5.1 Simple Representation of the Value Chain of Quinoa in Peru. Based on the Value
Chain as depicted by (Salcedo et al., 2013). . . . . . . . . . . . . . . . . . . . . . . . . 59
5.2 Simple Structure of the Value Chain of Quinoa based on (Hatch et al., 2015) and
(Salcedo et al., 2013). . . . . . . . . . . . . . . . . . . . . . . . . . . . . . . . . . . . . . 59
5.3 The value chain of quinoa as considered in our case study. . . . . . . . . . . . . . . 74
6.1 Gross Marketing Margins (in %) for the different stages in the value chain for the
period 2013-2016. . . . . . . . . . . . . . . . . . . . . . . . . . . . . . . . . . . . . . . . 84
A.1 Overview of the worldwide production and distribution of quinoa. Reprinted
from (FAO et al., 2011)(as cited by (Ruiz et al., 2014)). . . . . . . . . . . . . . . . . . . 100
B.1 Volume of quinoa production in metric tons for Peru in 2013 and 2014. Reprinted
from (Ministerio de Agricultura y Riego, 2014)(as cited by (Hatch et al., 2015)). . . . 101
B.2 Cultivated surface used for quinoa production in Peru in 2013 and 2014. Reprinted
from (Ministerio de Agricultura y Riego, 2014)(as cited by (Hatch et al., 2015)). . . . 102
D.1 The forestry, timber and furniture value chain. Reprinted from (Kaplinsky and
Morris, 2002). . . . . . . . . . . . . . . . . . . . . . . . . . . . . . . . . . . . . . . . . . 106
E.1 Nicaragua: Curve of value added stages in the global apparel value chain. Reprinted
from (Frederick, 2010)(as cited by (Hernandez et al., 2013)). . . . . . . . . . . . . . . 108


Part I
Literature
1

2
Chapter 1
Quinoa
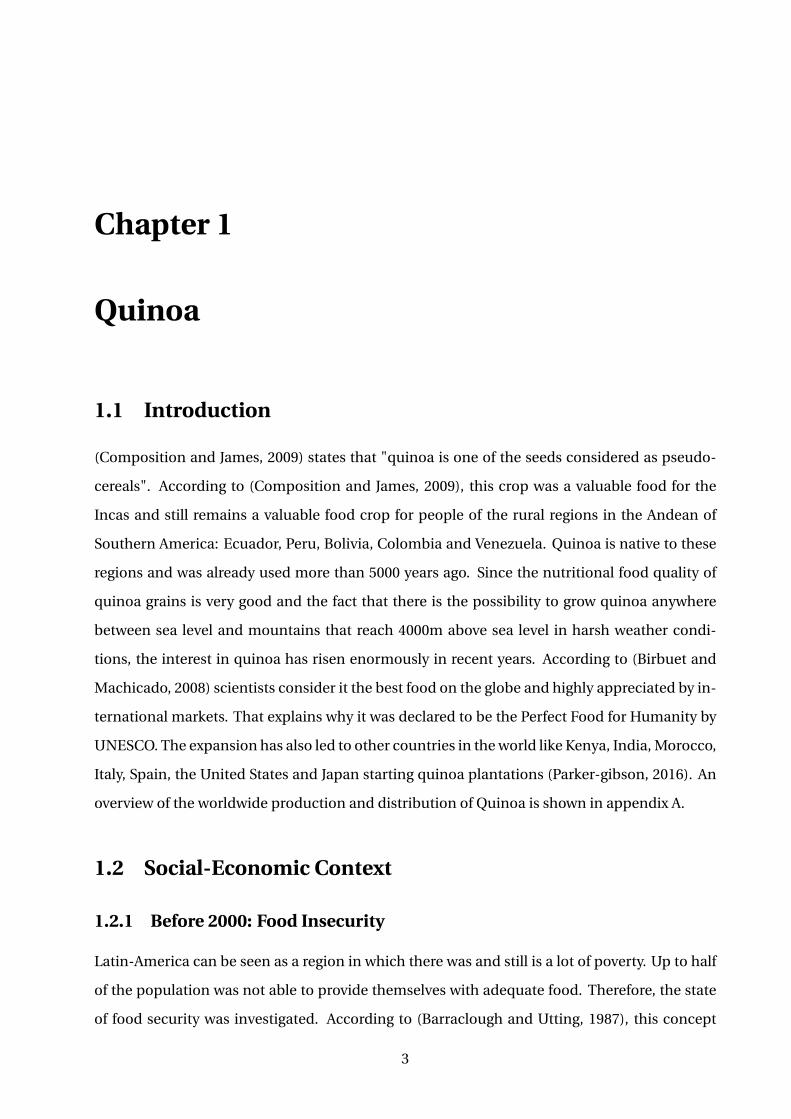
1.1 Introduction
(Composition and James, 2009) states that "quinoa is one of the seeds considered as pseudo-
cereals". According to (Composition and James, 2009), this crop was a valuable food for the
Incas and still remains a valuable food crop for people of the rural regions in the Andean of
Southern America: Ecuador, Peru, Bolivia, Colombia and Venezuela. Quinoa is native to these
regions and was already used more than 5000 years ago. Since the nutritional food quality of
quinoa grains is very good and the fact that there is the possibility to grow quinoa anywhere
between sea level and mountains that reach 4000m above sea level in harsh weather condi-
tions, the interest in quinoa has risen enormously in recent years. According to (Birbuet and
Machicado, 2008) scientists consider it the best food on the globe and highly appreciated by in-
ternational markets. That explains why it was declared to be the Perfect Food for Humanity by
UNESCO. The expansion has also led to other countries in the world like Kenya, India, Morocco,
Italy, Spain, the United States and Japan starting quinoa plantations (Parker-gibson, 2016). An
overview of the worldwide production and distribution of Quinoa is shown in appendix A.
1.2 Social-Economic Context
1.2.1 Before 2000: Food Insecurity
Latin-America can be seen as a region in which there was and still is a lot of poverty. Up to half
of the population was not able to provide themselves with adequate food. Therefore, the state
of food security was investigated. According to (Barraclough and Utting, 1987), this concept
3
CHAPTER 1. QUINOA 4
assures that the supply and distribution of food is competent in quality as well as in quantity
by meeting the nutritional needs of several different social groups. It ensures that market de-
mands are met without severe shortages or brutal shifts in prices.
Food security in Bolivia and Peru caused the rural population to be self-sufficient in several
products because they were getting more and more support from public investments in ex-
pertise, machinery and capacity to grow production. Efforts to assure Bolivia and Peru to be
partly independent on imports did not lead to the desired result as new facilities were used
at only a small fraction of their capacity. This caused the products in Bolivia and Peru to be
more expensive than imports and extra subsidies for the processing enterprises being neces-
sary. Therefore, dependency on food imports increased in the early 1980s, mainly in the cities,
while peasants still relied on their own production. This, together with the poor transporta-
tion possibilities available, left the food system pretty vulnerable. The poor industrial base of
the countries caused its food system to be even more reliant on imports and a self-governing
food system inaccessible. To solve this problem on the one hand, an effective food strategy
focussed on the agricultural sector in terms of agricultural investments and services as well as
on economic and social policies (e.g. trade, exchange rates, health, education, infrastructure,
etc.) should be installed. On the other hand, focus on the agricultural sector calls for enor-
mous shifts in power relationships and asks for small farmers to organize themselves in greater
democratic farmer associations. Such organizations are looking to provide farmers with several
services regarding marketing, processing, agro-industrial production, etc. but also designing
and executing policies and programs in order to improve the food security systems.
(Barraclough and Utting, 1987) insist that people that have to cope with food insecurity can
only improve their situation by organizing themselves in local farmer associations and force
their governments to imply food strategies that are nationally-oriented. In this respect, there
was a high need for farmers to cooperate and re-organize in associations to stimulate farmer’s
production and employment but also to be able to have an influence on political issues. They
should aim for "policies to generate more employment, better working conditions, improved
education and health services, and access to adequate food at prices they can afford" (Barr-
aclough and Utting, 1987). Besides this, they should also try to collaborate with other Latin
American countries having to cope with similar problems and these problems would persist

CHAPTER 1. QUINOA 5
if they did not try to change anything. With the establishment of the national quinoa growers
association (ANAPQUI) in 1983, the production for the international market had begun (Jacob-
sen, 2011).
According to (Janvry and Sadoulet, 2000), Latin American countries still had high rates of rural
poverty because of the highly unequal distribution of income, both between sectors and within
the rural sector, during the 1990s, despite relatively high income levels among developing coun-
tries and a lot of intentions to turn things around. Appendix F illustrates and interprets several
facts and figures regarding the poverty and development in Peru and Bolivia in recent years
as well as information about Belgium to show the significant differences between the coun-
tries. In the late 1990s, they were convinced that people leaving the countryside to go to urban
areas was something that could help the rural poverty. Thereby, (Janvry and Sadoulet, 2000) ex-
plained that an increase in the productivity of certain assets, which is affected by technological
changes, could help against the rural poverty in 2 manners: Directly because the technologi-
cal innovation will raise the welfare of poor farmers and indirectly through the influence that
technological change can have on the price of food for the consumers, on the employment and
wage rates in the agricultural but also other sectors and on foreign exchange contributions.
The best way to implement this technological change to reduce the poverty of farmers is by
initiatives that seek complementarity in interventions that are specified per region and by or-
ganizing in associations. An approach that is regionally-focused and involves local farmers is
necessary if technology is to be used to reduce poverty. And this is what farmers of quinoa
also opted to do: They wanted to implement the technological innovation in the production of
quinoa because they knew the value and important nutritional qualities of quinoa.
1.2.2 Growth for the period 2000-2013
Despite the exceptional characteristics that it always had, it was only since the beginning of the
21st century that the demand for quinoa started to grow enormously. This had several impor-
tant reasons:
1. According to (Dreibus, 2016)(as cited by (Parker-gibson, 2016)) the rising interest in ve-
gan, vegetarian and gluten-free diets played an important role. The world started to dis-
cover celiac disease which resulted in an increase in demand for grains without gluten
CHAPTER 1. QUINOA 6
(Birbuet and Machicado, 2008).
2. The accelerated increase of the demand of high-quality organic products and the growth
of the market of fair trade products (Birbuet and Machicado, 2008).
3. Several countries adopted the food efficiency programs that were supported by the Food
and Agriculture Organization of the United Nations (FAO) (Birbuet and Machicado, 2008).
4. People discovered that quinoa could be used as a source of food in areas that have to cope
with food insecurity (Ruiz et al., 2014)(as cited by (Parker-gibson, 2016)).
Issues
When looking specifically at Bolivia and Peru, although both countries’ production of quinoa
increased over the last 20 years because of an enlarged production area, they had a limited
capacity of quinoa production available in the beginning and were not able to fulfil the huge
increases in demand immediately. Figures 1.1, 1.2 and 1.3 show the enormous increase in culti-
vated area and production for the considered period. A reason for the continuous higher yield
in Peru than in Bolivia may be the social-economic gap that persists between the two countries,
as is discussed in chapter 4 and appendix F.
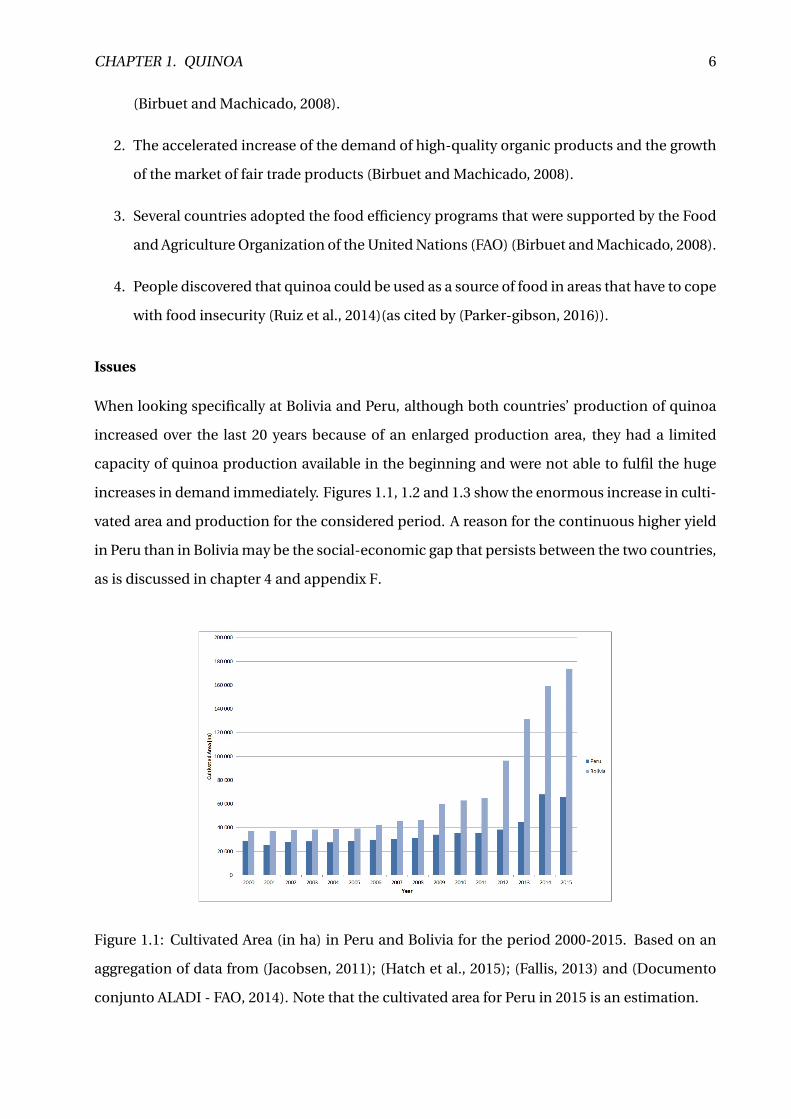
Figure 1.1: Cultivated Area (in ha) in Peru and Bolivia for the period 2000-2015. Based on an
aggregation of data from (Jacobsen, 2011); (Hatch et al., 2015); (Fallis, 2013) and (Documento
conjunto ALADI - FAO, 2014). Note that the cultivated area for Peru in 2015 is an estimation.

CHAPTER 1. QUINOA 7
Figure 1.2: Production (in tons) in Peru and Bolivia for the period 2000-2015. Based on an
aggregation of data from (Jacobsen, 2011); (Hatch et al., 2015); (Fallis, 2013) and (Documento
conjunto ALADI - FAO, 2014).
(Jacobsen, 2011) states that the main problem of the agricultural sector was situated at the grain
processing link of the chain, until the early 2000s. The yearly processing capacity of quinoa in
Bolivia was only one third of the actual production of quinoa for one year. This led to a big loss
of the product itself. Half of the bigger quinoa-producing companies of the sector in Bolivia,
who were responsible for four fifth of quinoa exports, agreed to implement a subversive tech-
nological change to try to overcome the deficits. The technological innovation played a crucial
role in the processing of quinoa and this was the fundamental basis for a development program
called the "Quinoa Alliance". This united the main quinoa-producing companies and producer
associations of the sector.
The government’s interest in quinoa as a commodity of priority to increase the income of the
country increased the importance of the production of quinoa even more according to (Jacob-
sen, 2011). The socio-economic circumstances were very bad (We would like to refer to Ap-
pendix F for a broad elaboration on the socio-economic conditions in Peru and Bolivia in recent
years) and together with the area increase in the first years of the 21st century, the yield had to
cope with an enormous decrease. Another problem caused by the area increase is the destruc-
tion of the vegetation cover leading to an acceleration of erosion [FAUTAPO, 2008](as cited by
(Jacobsen, 2011)). Although the drop in yield, the prices kept increasing leading to an expanded
CHAPTER 1. QUINOA 8
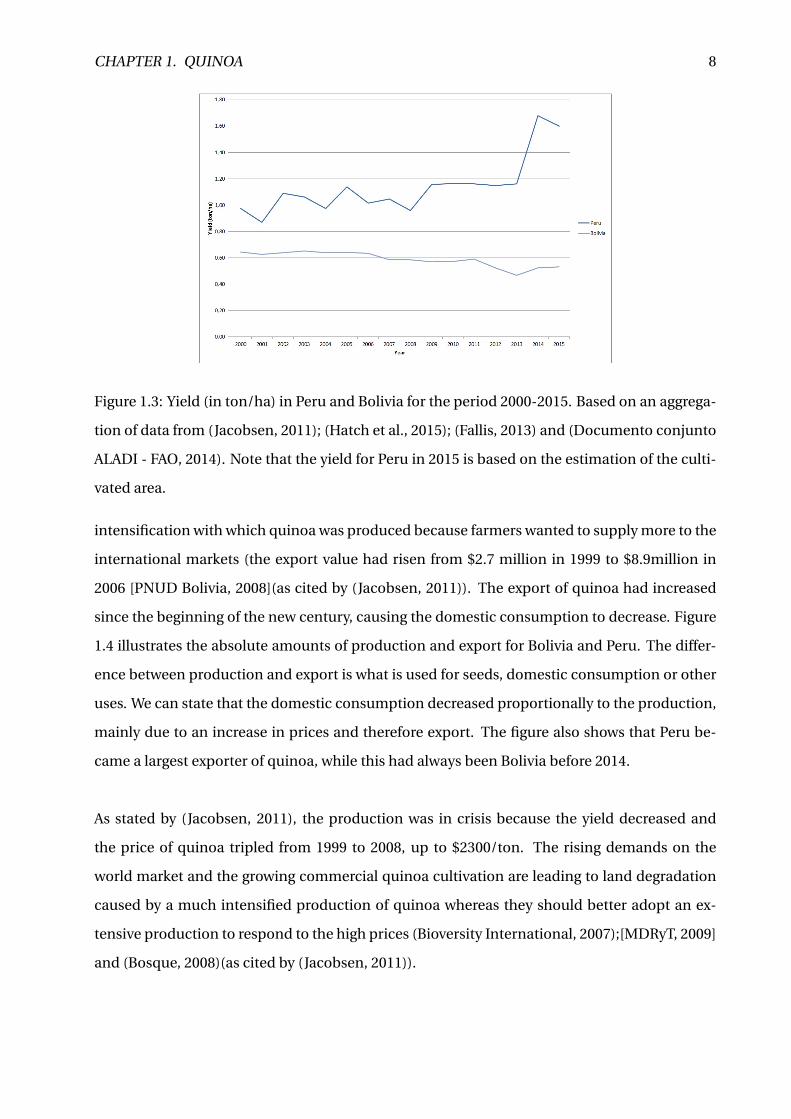
Figure 1.3: Yield (in ton/ha) in Peru and Bolivia for the period 2000-2015. Based on an aggrega-
tion of data from (Jacobsen, 2011); (Hatch et al., 2015); (Fallis, 2013) and (Documento conjunto
ALADI - FAO, 2014). Note that the yield for Peru in 2015 is based on the estimation of the culti-
vated area.
intensification with which quinoa was produced because farmers wanted to supply more to the
international markets (the export value had risen from $2.7 million in 1999 to $8.9million in
2006 [PNUD Bolivia, 2008](as cited by (Jacobsen, 2011)). The export of quinoa had increased
since the beginning of the new century, causing the domestic consumption to decrease. Figure
1.4 illustrates the absolute amounts of production and export for Bolivia and Peru. The differ-
ence between production and export is what is used for seeds, domestic consumption or other
uses. We can state that the domestic consumption decreased proportionally to the production,
mainly due to an increase in prices and therefore export. The figure also shows that Peru be-
came a largest exporter of quinoa, while this had always been Bolivia before 2014.
As stated by (Jacobsen, 2011), the production was in crisis because the yield decreased and
the price of quinoa tripled from 1999 to 2008, up to $2300/ton. The rising demands on the
world market and the growing commercial quinoa cultivation are leading to land degradation
caused by a much intensified production of quinoa whereas they should better adopt an ex-
tensive production to respond to the high prices (Bioversity International, 2007);[MDRyT, 2009]
and (Bosque, 2008)(as cited by (Jacobsen, 2011)).

CHAPTER 1. QUINOA 9
Figure 1.4: Production and export of quinoa in Bolivia and Peru. Based on an aggregation of
data from (Jacobsen, 2011); (Hatch et al., 2015); (Fallis, 2013) and (Documento conjunto ALADI
- FAO, 2014).
Possible Solutions
Since quinoa is a product that can be cultivated in several different agro-climatic conditions
in the Andes (Jacobsen, 2003)(as cited by (Jacobsen, 2011)), a production outside the region
would decrease the enormous pressure on the soil in vulnerable regions and bolster the market
worldwide and thereby benefit others in the world because of its huge market potential (Jacob-
sen, 2003)(as cited by(Jacobsen, 2011)).
As stated earlier, farmers are no longer consuming their own production of quinoa but partic-
ularly grow it to export because the price is too high to keep it. With the money they earn from
selling it, they can buy much more other products with a lower value. Figure 1.4 illustrates the
decrease in consumption of own production towards 2010 (pink dots). (Jacobsen, 2011) indi-
cates that the consumption of quinoa in Bolivia amounts to only 2kg per person per year and
the consumption of rice or pasta has risen to more than 25kg per person per year, whereas in
Peru, a person consumes more than 20kg per year.
1.2.3 Future
Right now, some believe quinoa has already lived up to its full potential in the highlands of
Peru and Bolivia. After the international year of quinoa, production (as can be seen on figure
CHAPTER 1. QUINOA 10
1.2, especially for Peru) as well as prices reached its peak in 2014. Producers could get up to
€6/kg for organic quinoa. Due to its flexibility and high potential, people started to cultivate
quinoa in the lowlands, in the north of Peru, along the coast, closer to bigger cities. Since the
yield realized in these parts of the country are a lot higher (4 000 kg/ha compared to 1 000
kg/ha in the highlands) thanks to better weather conditions and use of pesticides, the total
production started to increase enormously. Everywhere in the country new quinoa farmers
were popping up like daisies. Furthermore, the United States, Canada, European countries etc.
all started small plantations of quinoa to cultivate their own quinoa in order to reduce import
and transportation costs. These factors all led to a drop in price and loss of markets for the
Peruvian and Bolivian farmers.
1.3 Characteristics of the International Quinoa Trade
In this section, we will elaborate on the characteristics of the international trade of quinoa. The
main goal is to identify the actors of the value chain (e.g. importers and exporters) and give a
clear overview of the market access conditions and the essential elements of global supply and
demand for quinoa on which our case study can be based. Research for this section is mainly
based on (Salcedo et al., 2013)’s paper about "International Quinoa Trade".
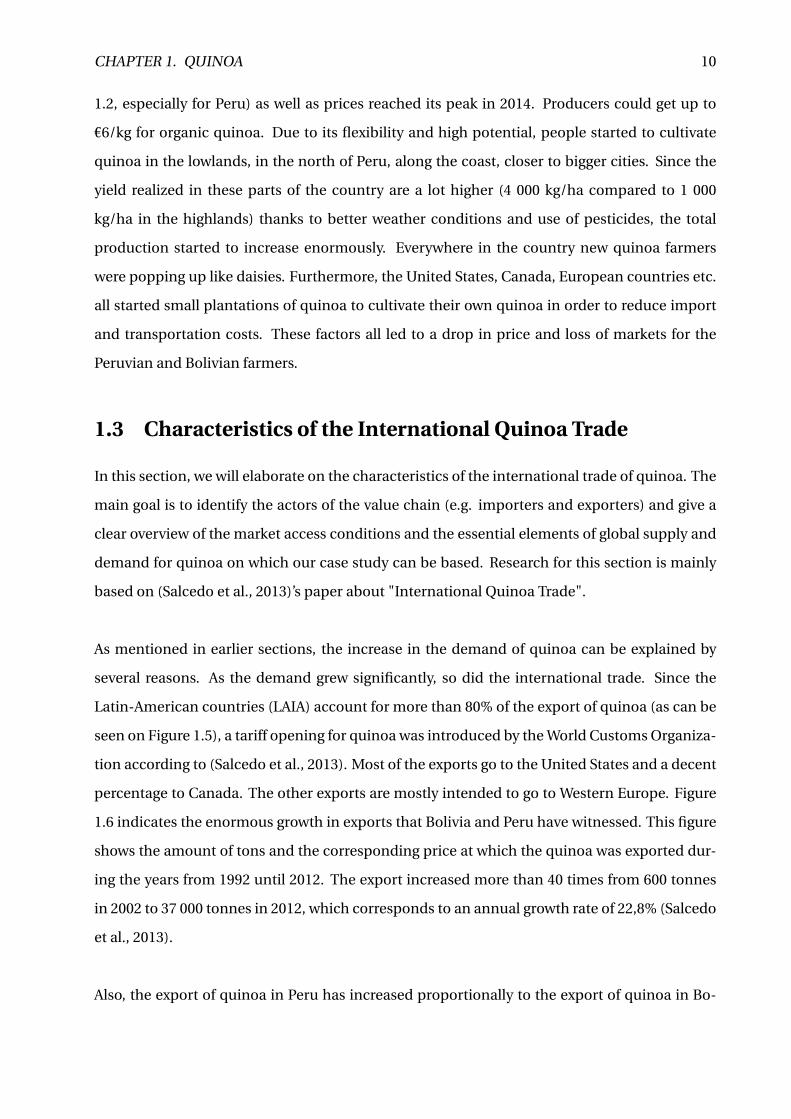
As mentioned in earlier sections, the increase in the demand of quinoa can be explained by
several reasons. As the demand grew significantly, so did the international trade. Since the
Latin-American countries (LAIA) account for more than 80% of the export of quinoa (as can be
seen on Figure 1.5), a tariff opening for quinoa was introduced by the World Customs Organiza-
tion according to (Salcedo et al., 2013). Most of the exports go to the United States and a decent
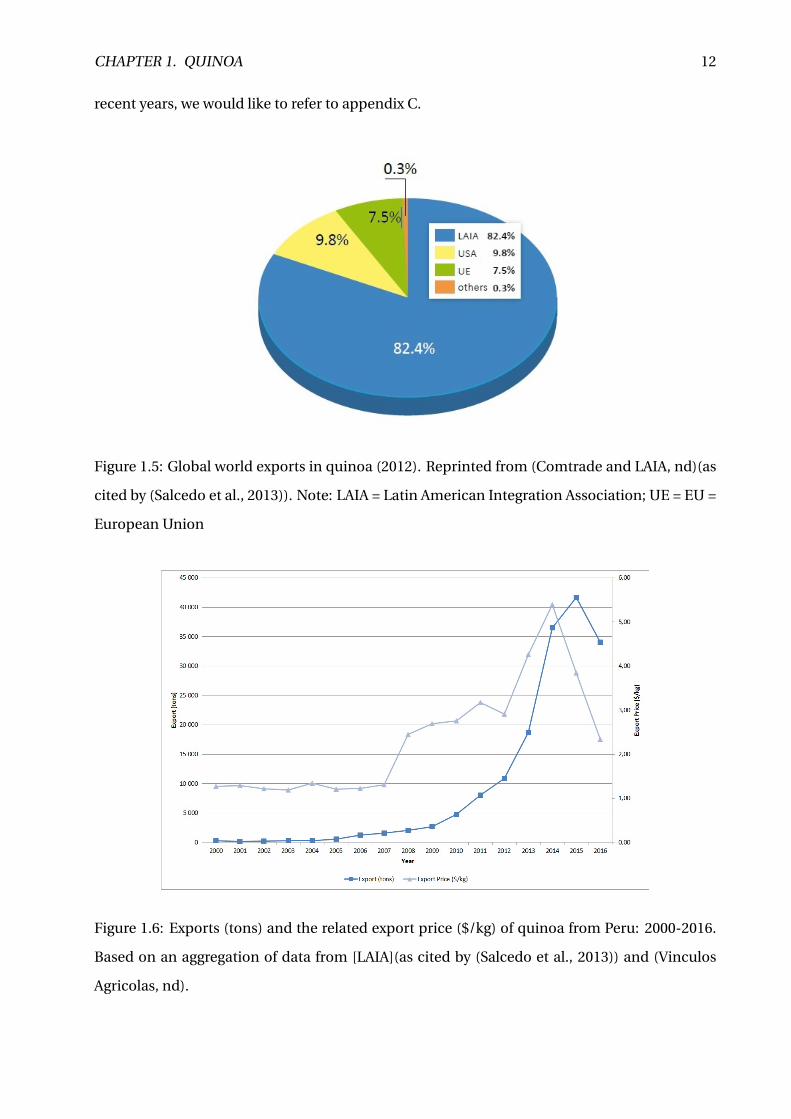
percentage to Canada. The other exports are mostly intended to go to Western Europe. Figure
1.6 indicates the enormous growth in exports that Bolivia and Peru have witnessed. This figure
shows the amount of tons and the corresponding price at which the quinoa was exported dur-
ing the years from 1992 until 2012. The export increased more than 40 times from 600 tonnes
in 2002 to 37 000 tonnes in 2012, which corresponds to an annual growth rate of 22,8% (Salcedo
et al., 2013).
Also, the export of quinoa in Peru has increased proportionally to the export of quinoa in Bo-

CHAPTER 1. QUINOA 11
livia. In the early 90s, Bolivia’s export accounted for 90% of the exports and Peru’s for 6%, while
around 2010, Peru’s export increased to 23% of the exports and Bolivia’s declined to 75% (Sal-
cedo et al., 2013). This is somewhat a vague measure given the fact that the production and
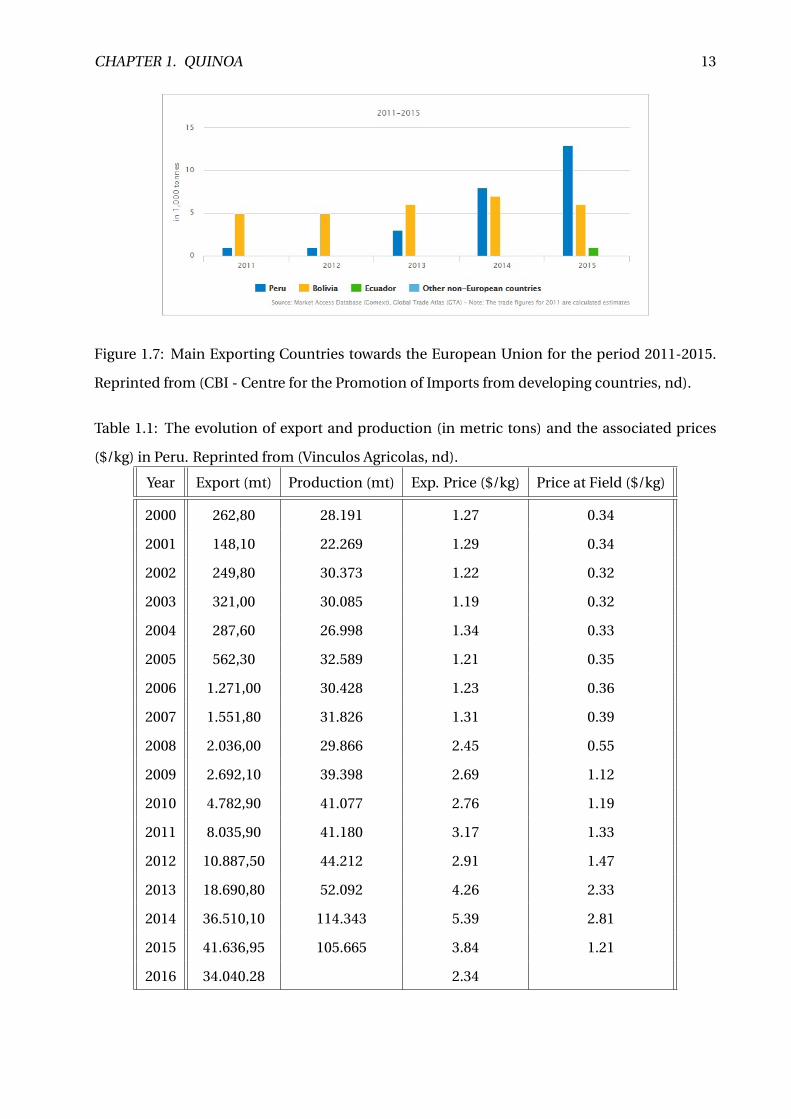
export volume in both countries has increased significantly over these periods. In recent years,
Peru is establishing itself more and more as one of the most important exporters of quinoa
while Bolivia is staggering. This remarkable turnaround is depicted in figure 1.7, which shows
the export of the main producing countries towards the European Union from 2011 until 2015.
Many say it is due to better infrastructure and more capital availability in Peru. An overview of
the production and export quantities and respective prices from 2000 until 2016 is given in table
1.3. It is clear that the production in Peru increased steadily in the beginning with a somewhat
higher rate from 2008 until 2013 to really boom in 2014 and 2015. The prices followed a similar
pattern until 2012 (as can be seen on figure 1.6). The enormous profitability of quinoa inspired
farmers and larger organizations in and around Lima, in the lowlands and along the coast in the
north of Peru to also start producing quinoa. This led to an excessive increase of the cultivated
area and the total production of Peru in 2014 and 2015, which is also shown on the figures in
appendix B. The yields, which are also discussed in section 5.2, were a lot higher in these places
than in the highlands due to better weather conditions, better infrastructure and equipment
and use of pesticides. On top of this, others such as the United States, Canada and European
countries started to establish quinoa plantations. This contributed to the steep decrease of the
price in 2015 and 2016 after it had reached its peak in 2014. The profit the farmers received
proportionally to the export prices was even lower than before. Furthermore, organizations are
losing their export markets to producers in export countries which causes expectations that ex-
ports as well as prices will further decrease relatively to production in the coming years.
Regarding the import, the United States has remained the biggest importer of quinoa with more
or less 55% of the imports. Due to European countries producing more and more quinoa do-
mestically in order to meet their own demand since a couple of years, they import less and new
countries such as Canada, Australia, Brazil and Israel are establishing as more important desti-
nation markets. Again, this should be taken with a grain of salt because the total export volume
has increased since the boom of the quinoa production due to the huge popularity of the grain
resulting from the consumer awareness of healthier diets, as can be seen in table 1.3. To have
an overview of the export quantities and values from Peru to different European countries in
CHAPTER 1. QUINOA 12
recent years, we would like to refer to appendix C.
Figure 1.5: Global world exports in quinoa (2012). Reprinted from (Comtrade and LAIA, nd)(as
cited by (Salcedo et al., 2013)). Note: LAIA = Latin American Integration Association; UE = EU =
European Union
Figure 1.6: Exports (tons) and the related export price ($/kg) of quinoa from Peru: 2000-2016.
Based on an aggregation of data from [LAIA](as cited by (Salcedo et al., 2013)) and (Vinculos
Agricolas, nd).
CHAPTER 1. QUINOA 13
Figure 1.7: Main Exporting Countries towards the European Union for the period 2011-2015.
Reprinted from (CBI - Centre for the Promotion of Imports from developing countries, nd).
Table 1.1: The evolution of export and production (in metric tons) and the associated prices
($/kg) in Peru. Reprinted from (Vinculos Agricolas, nd).
Year Export (mt) Production (mt) Exp. Price ($/kg) Price at Field ($/kg)
2000 262,80 28.191 1.27 0.34
2001 148,10 22.269 1.29 0.34
2002 249,80 30.373 1.22 0.32
2003 321,00 30.085 1.19 0.32
2004 287,60 26.998 1.34 0.33
2005 562,30 32.589 1.21 0.35
2006 1.271,00 30.428 1.23 0.36
2007 1.551,80 31.826 1.31 0.39
2008 2.036,00 29.866 2.45 0.55
2009 2.692,10 39.398 2.69 1.12
2010 4.782,90 41.077 2.76 1.19
2011 8.035,90 41.180 3.17 1.33
2012 10.887,50 44.212 2.91 1.47
2013 18.690,80 52.092 4.26 2.33
2014 36.510,10 114.343 5.39 2.81
2015 41.636,95 105.665 3.84 1.21
2016 34.040.28 2.34


Chapter 2
Methods of Value Chain Analysis
2.1 Theory of Value Chain Analysis
2.1.1 Value Chain: Definitions
(Kaplinsky and Morris, 2002) define the value chain as "the full range of activities which are
required to bring a product or service from conception through the different phases of produc-
tion, delivery to the final consumers and final disposal after use." A simple example is given in
appendix D, in which the value chain of the furniture industry is shortly described. The value
chains can be of a different type. Based on the idea of governance, (Gereffi and Korzeniewicz,
1994) (as cited by (Kaplinsky and Morris, 2002)) distinguish two types of value chains: Buyer-
driven chains and Producer-driven chains. Governance refers to the controlling and monitoring
of the implied rules and interactions between the different actors in the value chain by setting
parameters regarding products, processes and qualifications. It is important that these rules
and interactions carefully reflect the actors, activities, roles and functions and their relation-
ships with each other. When this governance role is played by a buyer at the top of the chain,
(Kaplinsky and Morris, 2002) categorize it as buyer-driven chains. Such chains are most present
in labour-intensive sectors such as the aforementioned furniture, but also clothing, electronics,
handicrafts etc. The second type, producer-driven chains, describe the governing role to be
played by the leading producer of the chain and are most likely to be present in capital- and
technology-intensive environments (e.g. software, heavy machinery, car industry, etc.). (Ger-
effi et al., 1999) (as cited by (Kaplinsky and Morris, 2002)) further state that the different kinds
of value chains are related with different kinds of production systems. (Kaplinsky and Morris,
15
CHAPTER 2. METHODS OF VALUE CHAIN ANALYSIS 16
2002) complement these findings by saying that value chains not only differ within and between
sectors, but also the international, national and local context is an important factor to take into
account.
According to (Donovan et al., 2015), there are several definitions of a value chain. In his paper
’Guides for Value Chain Development: A Comparative Review’, he distinguishes three defini-
tions of a value chain as follows:
1. A value chain can be interpreted based on the value adding activities that are performed
in every step from start to end product or service. In this definition, (Donovan et al.,
2015) emphasize that the development of the chain is focused on enhancing production
processes.
2. A second possibility to see a value chain is as a combination of actors that are linked to
each other by the activities they perform. (Donovan et al., 2015) report that the weakest
actors are mainly the core of the chain development.
3. Thirdly, (Donovan et al., 2015) state that a value chain can also be interpreted to fulfil the
market demand by regarding the value chain as a strategic network. These value chains
are developed over time as the goal is to form a decent value adding chain.
Obviously, these definitions are often interpreted in a combined matter. (Donovan et al., 2015)
also gives two possible definitions of value chain development, which he describes as "an ac-
tor/chain type that focuses on strengthening certain actors and improving relations between
smallholders and other actors in a chain; a business-environment type that focuses on improv-
ing the business environment in which chain actors operate." The goal of value chain devel-
opment is very diverse but mainly looks to enhance the chain by investigating the drawbacks
of actors and activities, looking at competitors and coming up with innovations to address the
drawbacks and improve the chain and process such that all actors benefit from it.
2.1.2 Creating Value in a Supply Chain Environment
The first thing (Hawkes and Ruel, 2012) stated is that a value chain starts with a supply chain:
(Chopra and Meindl, 2016) define a supply chain as "a system consisting of all parties involved,
directly or indirectly, in fulfilling a customer request. It includes manufacturers and suppliers,
CHAPTER 2. METHODS OF VALUE CHAIN ANALYSIS 17
transporters, warehouses, retailers and customers." The typical supply chain consists of differ-
ent stages, as shown on figure 2.1. The arrows indicate that each stage is connected through the
flow of products, services, information, money etc. Functions used to complete the requests of
customers include new product development, marketing, operations, distribution, finance and
customer service (Chopra and Meindl, 2016).
Figure 2.1: The different stages in a supply chain. Reprinted from (Chopra and Meindl, 2016).
The definition of a supply chain allows to say that a value chain involves all the processes and
the actors that play a significant role from the origin of a product to its clearance, as can be
seen on figure 2.2, on which I will focus more in section 2.3. A value chain can be described
as a supply chain where "value is added to the product through "value-adding" activities as it
passes through the chain. These activities create value for the value chain actors." (Hawkes and
Ruel, 2012). Value creation can be in terms of the economic value of the product itself, the eco-
nomic value that is created for the actors in the chain or the value that is added to the product
as it goes through the different steps in the chain (Hawkes and Ruel, 2012). On the other hand,
(Dixit, 2014) declares that value chains unfold around the needs of consumers and these are in
turn translated in the needs for the market. A drawback of this is that the needs for the market
are not directly embedded in agriculture policy frameworks. Well-working markets are easier
when you want to improve the productivity and production. According to (Dixit, 2014), a pol-
icy framework that is based on the value chain allows to observe the link between the different
actors of the value chain: and facilitates to identify the process or actor in the chain that should
CHAPTER 2. METHODS OF VALUE CHAIN ANALYSIS 18
be targeted for a potential value addition.
According to (Dixit, 2014), policy makers and international communities have recently been at-
tracted to global value chains. These value chains indicate a "production process that crosses
the border of the country where it is produced in order to create a decent end product. This in-
ternational environment for production and trade causes certain threats because it is not in line
with traditional trade and the mindset of investment policies" (Dixit, 2014). (Dixit, 2014) gives
the example of tariffs and other customs restrictions on trade that may not only harm foreign
supplies but also be a barrier to indigenous exports by levying fees and therefore increasing the
cost. Quinoa can be seen as a product that is part of such a global value chain since it is pro-
duced in Bolivia and Peru and exported to multiple markets across its borders. Global value
chains are described in more detail in section 2.1.4.
2.1.3 Importance of Value Chain Analysis
(Kaplinsky and Morris, 2002) mention the three main reasons why it is important to perform a
value chain analysis:
1. Competitiveness is extremely important due to the increased division of labour and the
global diffusion of the production components.
2. A detailed value chain analysis has the possibility to enhance the production processes
and thereby enter global markets.
3. A thorough understanding of the dynamic factors in the value chain facilitates entry in
the global markets and corresponding growth.
2.1.4 Global Value Chains
For their definition of global value chains, (Hernandez et al., 2013) start with a definition of a
value chain obtained from (Gereffi and Fernandez-Stark, 2016): "The full range of activities that
firms and workers do to bring a product from its conception to its end use and beyond." Accord-
ing to (Hernandez et al., 2013), this includes different activities such as the design, production,
marketing, distribution and support to the final consumer. Since these activities and actors are
not focused on one country and therefore located in several countries, the value chain is said to
CHAPTER 2. METHODS OF VALUE CHAIN ANALYSIS 19
be global.
It was in the beginning of the year 2000 that global value chains started to take off. This shows
similarities with the evolution of the quinoa grain. From the beginning of the new century, the
interest in quinoa rose enormously and started to expand beyond the borders of Bolivia and
Peru a couple of years later. (Hernandez et al., 2013) mention three factors responsible for the
raise of global value chains:
1. Production got more and more fragmented over several countries due to the increased
transport and infrastructure possibilities. Global value chains allow to portray the rela-
tionships of the fragmented activities and link them geographically.
2. Some countries are specialized in cultivating products that are used for production of
another good in a country that is specialized in the processing of the good. This good
may further be transferred to another country for consumption. (Hernandez et al., 2013)
state that countries are more and more specializing in processes and business functions
than in products, which leads to countries trying to position themselves in value chains.
Global value chains ease this transition process.
3. Global value chains establish networks of buyers and suppliers and allow to get a better
understanding of the controlling and monitoring structures. According to (Hernandez
et al., 2013), this is crucial to determine what influence policies have on actors and where
activities are performed.
These factors need to be taken into account in order to better understand how global value
chains operate and to be able to map a value chain like the one of quinoa. The value chain of
quinoa can be interpreted as being fragmented over producing and processing countries Peru
and Bolivia, where it is also consumed or from where it is transferred to other distributing and
consuming countries like the US, Canada, France, Spain, Germany, Australia etc. Networks of
producers, processors, exporters, wholesalers and retailers are established to deliver a quality
product to the customers. An example of a Latin-American country participating in global value
chains is given in appendix E.
CHAPTER 2. METHODS OF VALUE CHAIN ANALYSIS 20
2.2 Methodology for Value Chain Analysis
As mentioned earlier, (Kaplinsky and Morris, 2002) stated that value chains differ within and
between sectors. Thereby, the context in which they operate alters too. (Kaplinsky and Morris,
2002) ranked several issues and factors to focus on when analyzing a supply chain: A first and
far most important step is the understanding of the market. To be able to conduct a secure
value chain analysis, (Kaplinsky and Morris, 2002) outlined the following key aspects and steps
of value chain analysis:
1. The way a chain is looked at determines which relations and actions are to be the key
processes, functions, roles etc.
2. Mapping value chains is a second important consideration. This involves the determina-
tion of constraint, the selection of appropriate variables and the assignment of numbers
and values to the respective variables for each actor or step in the value chain. In the case
of quinoa in Peru and Bolivia, the main variables of importance are the produced, trans-
ported and exported quantities and corresponding prices. This is on which the case study
will focus.
3. Since more and more systems use the ’pull-principle’, the characteristics of the final stages
should get primary attention and should be clearly defined in order to recognize critical
factors such as a clear segmentation of the market, definition of critical success factors
(e.g. low cost, quality, differentiation etc.) and the rapid changing environment.
4. The way producers approach end markets, benchmarking the efficiency, controlling, mon-
itoring and upgrading value chains (Kaplinsky and Morris, 2002).
Not all but most of these aspects should be considered and utilized in a value chain analysis.
When we want to expand this analysis to broader horizons such as new international markets
like the one of quinoa, a global value chain analysis should be applied, like explained in section
2.1.4 above.

CHAPTER 2. METHODS OF VALUE CHAIN ANALYSIS 21
2.3 Value Chains in Agriculture
2.3.1 Introduction
As stated before, a lot of people in Southern American countries suffer from hunger and food
insecurity. (Hawkes and Ruel, 2012) indicate that these people are denied easy access to such
foods due to a limited availability, economic constraints, lack of knowledge and information,
and related lack of demand for nutritious foods. In their paper, they assume that agriculture
could partly solve this problem by providing aid to people that are at risk and by enhancing
the availability, affordability, acceptability and quality of the nutritious foods such as quinoa.
Installing development programs focused on the agricultural production and consumption by
small farmers is not sufficient to improve the nutrition. All what happens between production
and consumption has to be mapped. According to (Hawkes and Ruel, 2012), this can be done
by adopting several concepts, analysis and approaches regarding the value chain. The analy-
sis is concentrated on identifying the actors and its relationships and on the activities that are
performed throughout the value chain. Figure 2.2 clearly illustrates the different activities and
corresponding actors that are needed to achieve and enhance the concepts of food availability,
food affordability, food acceptability and food quality. There are also several alternative ap-
proaches to agricultural development that are used to encourage poor groups of people to be
part of more modern value chains. These approaches want to increase the return to the farmers
as a means of improving processes, products, functions, volume and coordination (Hawkes and
Ruel, 2012).
2.3.2 Value Chain concepts
Value chain concepts have the potential to influence both the supply and the demand of nu-
tritious foods such as quinoa. The analysis gives an indication of the availability, the price and
the quality of the foods together with the interference of the government. (Hawkes and Ruel,
2012) give an example of value chain analysis where it is used to identify the type of value that
products need to supply to enhance the demand and the acceptability of that product as well as
determining whether extra nutritional value changes the value perception and the willingness
to pay for consumers.

CHAPTER 2. METHODS OF VALUE CHAIN ANALYSIS 22
Figure 2.2: A simplified representation of a food supply chain. Reprinted from (Hawkes and
Ruel, 2012).
(Hawkes and Ruel, 2012) write that when the nutrition goals are clearly stated and solution-
oriented, the convenience of value chain concepts allows to accomplish the goals more easily.
In section 2.3.4, their view on how to apply value chain concepts to achieve nutrition goals is
illustrated.
2.3.3 Agricultural Value Chains and Food Security
Value chain analysis that is focused on achieving nutrition goals as mentioned in section 2.3.4
is very closely related to the agricultural value chain and the associated food security and there-
fore also to the value chain of quinoa. The concept of food insecurity is something Bolivia and
Peru already have to cope with since a long time, although not to the same extent recently. It
can be seen as the base, from which it all started, of the quinoa production. Since there was
CHAPTER 2. METHODS OF VALUE CHAIN ANALYSIS 23
and is food insecurity in Bolivia and Peru, people look for new products and strategies, mainly
situated in the agricultural sector, to overcome the problems. (Dixit, 2014) states that a value
chain perspective on the agricultural sector delivers guidelines to address certain constraints
and restrictions related to the development of the agricultural sector and the realisation of food
security objectives. Due to the increasing globalization and the increased acquisition and dis-
tribution channels, research of the value chains is becoming more important in agriculture.
Although (Dixit, 2014) argues that this is why agricultural value chains are more buyer-driven
instead of producer-driven, the value chain of quinoa is also producer-driven because the pro-
duction process is influenced by "foreign value that is added in domestic agricultural produc-
tion and exports" (Dixit, 2014).
(Dixit, 2014) states that a value chain-based policy framework can facilitate food security con-
siderations. He mentions ’food availability on the national market’, ’food accessibility for peo-
ple’ and ’food utilisation’ as the core aspects of assuring food security. The first aspect, food
availability, is in line with improving the agricultural productivity because a better productivity
assists its availability. Secondly, access to food is said to be the most important factor because it
supports people’s security. Food utilisation mainly focuses on achieving nutrition goals. (Dixit,
2014) is convinced that a policy framework would improve the whole value chain by imple-
menting extra investments for production systems and infrastructure for the market and for
distribution. This will in turn lead to an agricultural sector that is flexible and able to handle
possible issues in the future. According to (Dixit, 2014), a policy framework with multilateral
trade rules, installed under the World Trade Organisation (WTO), enhances the performance of
actions to achieve food security goals for example by decreasing tariffs and other barriers. First
of all, multilateral rules would restrict the extent to which the government subsidises farmers
who are considered to have a negative impact. Secondly, a reduction in tariffs and trade trans-
action costs would improve the access and utilisation factors of food security and therefore also
the value chain. Thirdly, (Dixit, 2014) states that the WTO would also like to provide predictable
access to supply and therefore retain its reliable source of food supply. It would install limits on
export for a certain product to prevent a shortage for this product. A last thing that WTO would
like to inaugurate are the multilateral rules on food safety and quality standards because they
are crucial for a good working value chain.

CHAPTER 2. METHODS OF VALUE CHAIN ANALYSIS 24
We can conclude that "upstream and downstream markets are the main avenues of value addi-
tion" (Dixit, 2014) in agriculture. (Dixit, 2014) states that markets are the drivers for outside ac-
tors to join the value chain. He is convinced that a value chain-based framework can empower
the authorities to acknowledge markets’ influence when there are more connections with the
private sector and when the agricultural value chains’ importance keeps increasing. This will
lead to governmental involvement in some of the activities in order to assist production and
productivity and create better functioning markets. This will further lead to an increasing and
growing agricultural sector that is supported by the government. When we look at quinoa in
this respect, the government is indeed trying to provide support for poor farmers, but larger
farmers and processors are still too often reaping the benefits away from the small farmers by
abusing their power towards the government or exporters.
2.3.4 Value Chain Analysis to Achieve Nutrition Goals
When looking more specifically to value chain analysis in the agricultural sector, the most com-
mon and important objective is related to nutrition goals. In this respect, (Hawkes and Ruel,
2012) investigate whether value chain concepts can help to achieve nutritional goals. They state
that adopting concepts of the value chain has the possibility to enhance the supply and demand
of nutritious foods, especially for the poor people. "Value chain concepts enable the potential
of assessing the availability, the price and the nutrient quality of foods in specific communities.
Thereby they indicate what an influence public interventions and policies have on the integra-
tion in the value chain." (Hawkes and Ruel, 2012). Since they embody the different steps in the
chain and recognize that the coordination among the actors enhances the ability of the sector
to create value, they are able to provide a framework for coordinating actions and actors and
for identifying and engaging the sectors that need to be involved. And this is very relevant to
the agricultural sector. Therefore, (Hawkes and Ruel, 2012) give a detailed overview of steps to
follow in order to achieve nutritional goals:
1. Starting from a clearly-stated and outcome-oriented nutrition goal is important.
2. Define the nutrition problem and identify the gaps in food and nutrients by targeting one
or more food value chains.
3. First create economic value for value chain actors. This will in turn lead to an increase in
value for nutrition. This is illustrated below.

CHAPTER 2. METHODS OF VALUE CHAIN ANALYSIS 25
4. It is important to search for comprehensive solutions that are adapted to the context.
"The search for solutions should take the whole value chain, including different sectors
and actors at different scales, into account, but the application of solutions should be
tailored to circumstance" (Hawkes and Ruel, 2012).
5. Focus on improving the coordination of the actors within the chain by intervening where
necessary and developing alliances between the actors involved.
6. Look for solutions that both add value for nutrition as well as for actors of the value chain.
7. Add value for consumers by offering new attributes and add value for producers by allow-
ing them to produce more or supply a larger market.
8. Aim attention at meeting, increasing and creating demand.
9. Develop a policy environment which gives incentives to the actors in the chain to value
nutrition.
An example of a project with explicit nutrition goals and related activities according to (Hawkes
and Ruel, 2012) is the "Enhancing of the bean value chain in Uganda". This is very similar to
the projects involving quinoa in Peru and Bolivia because it’s a project focused on improving
the production, marketing and consumption of beans in order to improve the living conditions
of the people. "In a value-chain framework, actions included research into increasing yields,
improving nutrient quality after harvest, understanding consumers’ preferences and demand,
increasing their awareness of the nutritional and health benefits of beans, and promoting bean
consumption" (Mazur et al., 2011)(as cited by (Hawkes and Ruel, 2012)).
2.3.5 Global Value Chains in Agriculture
Global value chains are not restricted to products or services in a manufacturing industry. (Her-
nandez et al., 2013) state that agriculture can be linked to the value chains of the downstream
activities, the so called "agrifood business". According to (Hernandez et al., 2013), it is becom-
ing more and more a trend to structure these downstream activities in global value chains.
These global value chains are said to be managed by processors and retailers who are part of
the chain. (Hernandez et al., 2013) mention supermarkets as an example of retailers who are
part of the chain and have contracts with importers as well as exporters to exert a monitoring
CHAPTER 2. METHODS OF VALUE CHAIN ANALYSIS 26
Figure 2.3: The Nutella global value chain. Reprinted from (Organisation for Economic Co-
operation and Development (OECD), Mapping Global Value Chains, Paris, 2012)(as cited by
(Hernandez et al., 2013)).
function over the production of crops. They kind of act as intermediaries between the exporting
country and the importing country, which is also the case in the quinoa value chain. By exer-
cising vertical coordination, the ones with a monitoring function want to guarantee quality and
food safety standards along the chain. The value chains in the agrifood industry are known to
comprise companies and actors in less developed and developing countries. A good example
of agrifood value chains that include such countries is that of the Nutella global value chain,
given by (Hernandez et al., 2013). Nutella, a product which most of the world is very familiar
with, is produced in huge quantities (more than 300.000 tons every year). Figure 2.3 depicts the
different headquarters, international suppliers, factories and sales offices involved in the value
chain of Nutella. In 2013, ten factories all over the world were producing Nutella, as can be
seen by the red triangles on the figure. It is evident from the picture that a lot of ingredients are
supplied globally (indicated by the green dots): Cocoa comes from Ivory Coast, Ghana, Nige-
ria and Ecuador; Sugar from Europe; Palm oil from Papua New Guinea and Brazil; Hazelnut
from Turkey and Vanillin from the USA and Europe. Of course, there are still ingredients and
CHAPTER 2. METHODS OF VALUE CHAIN ANALYSIS 27
attachments which are locally supplied (e.g. Milk). The main sales offices are indicated with
a purple cross and are located all over the world. Note that there are a lot more locations than
those shown on the figure. Nutella has positioned the factories in such a way that Nutella can be
easily supplied to the markets with the highest demand (think of Europe, North-America, Aus-
tralia and Brazil). Until now, Nutella isn’t that well known in Asia and therefore, no factories are
installed yet. We can conclude from this example that the value chains in the agrifood indus-
try are significantly focused internationally and involve ingredients produced in less developed
and developing countries such as cocoa from Central Africa. This value chain of Nutella has
several similarities with the quinoa value chain in such a way that quinoa is mainly cultivated
and processed in less developed countries (Bolivia, Peru) before it is transported to countries
with a higher demand (Europe, North-America). It is also different in such a way that all the
inputs for quinoa production are available in Peru. Producers or processors don’t need to get
inputs from other continents, which is the case for the production of Nutella.
2.4 Game Theory
2.4.1 Introduction
(Turocy et al., 2003) defines a game theory as "the formal study of decision-making where sev-
eral players must make choices that potentially affect the interests of the other players." It is
actually an inquiry of the degree of cooperation and competition or conflict between the differ-
ent parties involved in particular activities and interdependent on each other. Its strength lies
in the methodology it uses to structure and analyse problems of strategic choice (Turocy et al.,
2003). It is very important to have a list of the actors and their strategic options, taking into
account their preferences and actions/reactions. A game theory can be established if there is
competition between the actors of the considered value chain and outside value chain actors.
In reality, this competition is always imperfect. (Stiegert, 2008) defines imperfect competition
as the ability of a company to charge prices that are above marginal costs. It is a market situation
in which many sellers are present that sell heterogeneous products. Firms are expected to be
able to determine prices that result in ending up with significant margins and profits. The game
theory related to imperfect competition is referred to as the non-cooperative game theory.
CHAPTER 2. METHODS OF VALUE CHAIN ANALYSIS 28
2.4.2 Application of Game Theory in Agriculture
Since agriculture has to cope with a time lag between investment and pay-off (it can take up to
a year or more from seed to harvest and sale), price-taking principles and unexpected weather
conditions etc., uncertainly is said to be omnipresent in agriculture. Game theory models that
address the uncertainty and decision-making processes in agriculture need to be investigated:
On the one hand, this concerns long-term decisions regarding the location, the type of farm-
ing, the size of the farm, purchase or rental of land, materials and machines to invest in and
timing of investment, human capital and other resources (Agrawal and Heady, 1968). On the
other hand, short-term decisions need to be made such as when to sell, how long to store, the
kind of manure and the amount, whether other techniques are more useful etc. (Agrawal and
Heady, 1968). Another important factor that enforces uncertainty is of course the lack of knowl-
edge about the decisions and moves of competitors. (Agrawal and Heady, 1968) give some game
theories that can be applied in agriculture but they refer to the late 60s and are somewhat out-
dated. (Sexton et al., 1994) also examined game theories in agricultural markets and stated
that agricultural products are expensive to transport because they are bulky and perishable.
Therefore, the markets for raw agricultural products are actually geographical markets where
imperfect competition will certainly occur. It is said to be present in the international trade
of multiple agricultural products because trading agencies, the government and other author-
ities intervene in import and export to get control of the situation. According to (Sexton et al.,
1994), uncertainty or lack of information that causes asymmetries between the actors is an im-
portant source of strategic behaviour. As stated earlier and again confirmed by (Sexton et al.,
1994), informational asymmetries are omnipresent in agricultural markets. An example given
by (Sexton et al., 1994) mentions that processors may have more information regarding markets
overseas than farmers which gives them incentives to misuse these advantages. On the other
hand, farmers may have informational advantages regarding the characteristics and quality of
their crops.
The models established by (Sexton et al., 1994) include Principal-Agent Models, Auctions and
Collective Bargaining. All of these are more or less present in the quinoa industry. Collective
Bargaining is a method commonly used by the associations of farmers in order to negotiate
better prices with exporters etc. Auctions are sporadically present in the quinoa industry. They
can be used to boost the quinoa price enormously, although this can have a lot of negative
CHAPTER 2. METHODS OF VALUE CHAIN ANALYSIS 29
effects in the long term.
Principal-Agent Models
(Sexton et al., 1994) define Principal-Agent Models as models in which the principal is the entity
who hires the agent to perform some task. The principal may be a farmer who is looking for a
marketing firm to act as an agent and sell the farmer’s products. The agent may have an infor-
mational advantage in this case, as he is better informed about market conditions etc. Another
example is a processor who acts as a principal and is looking for a farmer to cultivate speci-
fied products. In this case, the farmers have an informational advantage because they have the
knowledge about productions costs and quality etc. This is not restricted to farmers and pro-
cessors but can also be applied in other parts of the value chain (e.g. An exporter can act as the
principal while retailing firms as the agents or vice versa). (Sexton et al., 1994) make a distinc-
tion between three models based on the information asymmetries between the actors. These
models are:
1. Moral hazard models: Models in which actions taken by the agents are executed without
the principal knowing or seeing it. It may be most relevant in agriculture when the proces-
sor acts as the principal and the farmer as the agent. This allows farmers to influence the
quality of products and reap more benefits for example. It is the processor’s responsibility
to be totally informed by means of contracts and financial terms.
2. Adverse selection models: Models in which the agents have secret knowledge which they
don’t want to share with the principal, already from before getting in contact. These mod-
els may result in the elimination of products of higher quality because of the inability to
recognize and reward quality and may lead to overage of low-quality products. Thereby, it
also provides motives for the government to intervene with certain quality standards and
certifications.
3. Vertical control: This kind of model includes contracts in which upstream entities (e.g.
Farmer) restrict the behaviour of downstream entities (e.g. Processor or exporter). These
contracts involve exclusive sales arrangements, fees, fixed quantities, bundling of goods,
etc. It is the goal of the farmer to select contractual tools appropriately in order to maxi-
mize his/her profit and propose them to the processors. These models can be found quite
often in the food retailing part of agriculture.

CHAPTER 2. METHODS OF VALUE CHAIN ANALYSIS 30
Auctions
Auctions are mainly used in case prices are fluctuating constantly, when fixed prices don’t work
accordingly (e.g. fish, eggs, fruits and vegetables) or when quality of a good is variable (e.g.
livestock, wool, used equipment). In order to thrive on a continuous basis and establish value,
many actors on both the selling side and the buying side are needed to facilitate the move-
ment towards a competitive market price that reflects true value. (Sexton et al., 1994) states
that monopoly’s (one supplier) and monopsony’s (one buyer) can also be favourable with re-
gard to auctions (e.g. governments can act as a monopolist for oil and mineral exploitations
but can also act as a monopsonist for public services and construction projects because they
are the one providing the capital to build these projects). The main reason for monopolists and
monopsonists to use auctions is asymmetry of information (Sexton et al., 1994). Since a mo-
nopolist is the only provider of a particular product, he is able to set take-it-or-leave-it prices
to maximize his own value when buyers know the value of the product. The other way around
counts for monopsonists.
Collective Bargaining
Collective bargaining normally occurs in a market where multiple buyers are present. How-
ever this market structure often evolves into a bilateral monopoly in which we have a single
seller and a single buyer negotiating with each other. (Sexton et al., 1994) mention two different
states in which collective bargaining can occur in agriculture. First of all, it can appear by means
of voluntary initiatives of farmers. Secondly, the government can force farmers to collectively
produce and market their products. The driver for collective bargaining is most likely the ability
to create more value by cooperating with the association than when working on their own. The
bargaining associations are said to be looking to arrange division of costs, quality premiums
and several discounts. This is something that often happens in the quinoa industry in South-
ern America, although people argue the trustworthiness of these associations. Too often, the
greatest players of the association reap most of the benefits and leave nothing for the smaller
players, whose working conditions are then even deteriorated.

CHAPTER 2. METHODS OF VALUE CHAIN ANALYSIS 31
2.5 Upgrading the Value Chain
2.5.1 Introduction
Since the demand market for quinoa keeps increasing and seems to be guaranteed for many
years to come, an amount sufficient to fulfil all this demand should be provided. An expansion
of the cultivated area and production together with stimulating public policies will be needed
to be able to contribute to the increase in internal and external consumption (Documento con-
junto ALADI - FAO, 2014). Even more important is the productivity and therefore yield per
hectare, which increased only very little from 2000 until 2012, because it can be seen as a direct
method to enhance the income level of farmers. An upgrade of the value chain seems manda-
tory in this respect. Upgrading a value chain refers to "actors gaining higher returns by joining
or moving between different stages of the value chain" (Hernandez et al., 2013). According to
(Hernandez et al., 2013), these returns can be obtained by:
1. Upgrading the product: Switching towards a product with a higher value or enhancing
the intrinsic value of a product through the steps outlined below.
2. Upgrading the process: Increasing the efficiency of machinery and systems. This is often
focused on installing new technologies.
3. Upgrading functionalities: Advance to other (higher) stages in the value chain that call for
more challenging skills.
4. Upgrading chains and sectors: Facilitating the entrance into newly established value chains
by exploiting the knowledge and skills available in the current chain.
When actors are looking to achieve economic development, a value chain analysis can help to
embed new actors in the value chain (1) and enhance the current position of actors that are
already present in the chain (2).
Embed New Actors in the Value Chain
(Hernandez et al., 2013) describe the actors in the first option as most likely being companies
in developing countries that are on the verge of joining global industries or companies that are
less developed and still at a considerable distance from joining such industries. By embedding
new actors in the chain, strengths, weaknesses, opportunities and threats for new actors can
CHAPTER 2. METHODS OF VALUE CHAIN ANALYSIS 32
be determined. (Hernandez et al., 2013) mention examples such as the Aid for Trade initiative
led by the Organization for Economic Cooperation and Development (OECD) and the World
Trade Organization (WTO) that uses global value chain analysis to identify and reduce threats
for companies in developing countries on the verge of joining global industries. The second
example given by (Hernandez et al., 2013) points out to country-specific agencies focused on
development that try to govern the situation and come up with new initiatives that can serve
as guidelines. These guidelines for companies in developing countries can help to upgrade the
value chain and therefore create more value for the actors involved (Barrientos et al., 2011);
(Fernandez-Stark et al., 2012); (Humphrey and Navas-Alemán, 2010); (Meyer-Stamer and Wal-
tring, 2006) (as cited by (Hernandez et al., 2013)).
Enhance the Current Position of Actors in the Chain
The second option, enhancing the position of actors already present in the chain, entails a
global value chain analysis to decompose the total industry in her most important actors and
activities. This, likewise the first option, enables to identify strengths, weaknesses, opportu-
nities and threats of the activities already present in the chain (Gereffi and Fernandez-Stark,
2016) (as cited by (Hernandez et al., 2013)). On top of this, guidelines for agencies etc. can be
derived from a thorough global value chain analysis. (Hernandez et al., 2013) give the example
of the governments of Chile and Costa Rica using a global value chain analysis to construct rules
and policies that facilitate exploiting opportunities and thereby upgrade the value chain. The
economic development agency CORFO in Chile uses a global value chain analysis to improve
the value created in the offshore services industry. This helped the company to assess the in-
dustry’s potential at a global level, identify the country’s position and look for opportunities in
specific industries that are in line with the country’s potential (Hernandez et al., 2013). In Costa
Rica, the Foreign Trade Ministry uses global value chains to investigate four sectors that are be-
coming more and more important. This comprises the medical devices sector, the electronics
sector, the aerospace sector and the offshore services sector. Again, the goal involves assess-
ing the sector at a global level, looking whether there are significant changes, identifying the
country’s position and looking for opportunities to exploit in order to upgrade the value chain
(Hernandez et al., 2013).
CHAPTER 2. METHODS OF VALUE CHAIN ANALYSIS 33
2.5.2 "Future" Possibilities for Upgrading
Leveraging Local Resources
Although most of the companies in Latin American countries have not been able to enhance
the added value and are restricted to the lower half of the value chains, there are possibilities
for these countries by leveraging the wealth and experience of the natural resources that they
have available in order to supply higher value products for export (Hernandez et al., 2013). An
example of where knowledge is created to enhance the value chain concerns the cattle industry
in Uruguay. This sector counts more than 12 million cattle, while the population of Uruguay is
only quite more than 3 million. It is no secret that therefore, beef is the main export product
of Uruguay. The problem with this sector, comparable to that of quinoa, is its vulnerability for
health and food safety issues (Hernandez et al., 2013). In the year 2000, Uruguay wasn’t allowed
to export to Europe and the United States due to severe foot-and-mouth disease. This led to an
enormous loss of revenues and a serious economic drawback for Uruguay. A collaboration of
producers, local governments, transport staff, the private sector, IT companies and the central
government wanted to solve this problem by installing a tracking system in cattle to prevent
and detect the source of such diseases or other problems early enough. Until 2013, it was "the
only tracking system in the world with real-time monitoring of 100% of the national cattle herd"
(Hernandez et al., 2013). Chips are inserted in a calf’s ear at birth which work as a tracker and
allow to stay updated with information concerning that specific cow (e.g. when a cow is sold
to a butchery). Thanks to successful installment of this tracking system, Uruguay is able to
take advantage of its skills, knowledge and experience present in this sector by offering this
system to countries that face comparable problems (Hernandez et al., 2013). By exporting the
system to Colombia, Uruguay established an important role in the value chain of cattle across
its own borders. The system is more and more evolving into a system that can be used in other
industries than the cattle industry and therefore offers an enormous competitive advantage
for Uruguay, since strict food safety standards must be met in every country (Hernandez et al.,
2013). This clearly illustrates how a country can upgrade its value chain by leveraging its local
resources into a global value chain.
CHAPTER 2. METHODS OF VALUE CHAIN ANALYSIS 34
Workforce Development
(Gereffi et al., 2011)(as cited by (Hernandez et al., 2013)) state that skills and workforce develop-
ment are crucial elements for enhancing the value in global value chains. In order to maintain
and upgrade their position in a global value chain, countries have to align their development
policies with international labor requirements. People who possess the knowledge, skills and
expertise are needed to continuously being able to adapt to changes in demand. Several Latin
American countries developed their own systems to improve its global value chain.
(Local) Innovation Systems
Although there still exists a gap between the requirements of the sector and the skills available,
local innovation systems are able to provide a basis for upgrading value chains by enhancing
the skills, knowledge and expertise of the actors present in the chain. In both Workforce De-
velopment and Local Innovation Systems, a large diversity of stakeholders has to be present:
Private firms, public and private educational institutions, government, NGOs, associations etc.
(Hernandez et al., 2013). Even of more importance is the way these stakeholders cooperate and
collaborate in order to improve the global value chain.
In order to achieve appropriate innovation, strong networks that integrate the required re-
sources and capabilities need to be established with other actors. By doing so, actors are able
to get the necessary resources and expertise they lack. The effectiveness of an established net-
work strongly depends on the capacity of the actors to exchange information and resources,
defined by (Spielman et al., 2009) as the network’s navigability. In a complex environment, the
social outcome is said to be the result of individual actions determined by actions of others,
interactions between actors and institutional organizations that influence the actions.
Part II
Case Study: Illustration
35

Chapter 3
Examples of Value Chain Analysis
3.1 Introduction
In this chapter, two examples of value chains of products in less developed or developing coun-
tries, that will act as representatives for the description of the quinoa value chain, will be dis-
cussed: First of all the coffee value chain in section 3.2, which is not very complex and has a
focus on the processing phase. Around the turn of the century, the prices of coffee everywhere
in the world were very low due to multinational companies that were responsible for the pro-
cessing phase. The concentration on the processing phase allowed them to capture value away
from the local farmers. The kind of monopoly that existed for these multinational companies
faded away with years passing by and the market is said to be almost fully competitive right now
according to (Gilbert, 2008). (Gilbert, 2008) argues that the lower price was due to the fact that
only part of the final price is attributable to unprocessed coffee. The other part mainly consists
of processing and distribution costs, most likely attributable to the consumers.
The second value chain that is discussed in section 3.3 is that of cocoa. This chain is more com-
plex because the final product, chocolate, requires more different input products and has a lot
more possible applications. Thereby, the prices did not have to cope with significant decreases
but the price of cocoa has remained steady over time. (Gilbert, 2008) states that the market of
cocoa is, like the coffee market nowadays, almost fully competitive. Similar to coffee, where
only a part is attributable to unprocessed coffee, the remainder is induced by the consumers.
Both products are traded on terminal markets around the world. Terminal markets are orga-
37

CHAPTER 3. EXAMPLES OF VALUE CHAIN ANALYSIS 38
nized markets where agricultural products are distributed and sold. Since only a small amount
of coffee and cocoa goes to these markets, it is left out of the value chains on figures 3.1 and 3.3.
However, terminal markets are important instruments to measure the value of coffee and co-
coa because they make a distinction between production markets and retail markets (Gilbert,
2008): On the one hand, processors may buy coffee at a pre-arranged price from foreign coun-
tries while they do not have to be familiar with the prices of coffee in the concerning country.
On the other hand, exporters sell their coffee to processors at a fixed price without taking the
retail price into account. This is complicated by the fact that there is an increasing trend of ver-
tical integration between the exporters and the processors of coffee and cocoa. "The quantity
of coffee beans that processors might want to buy from farmers based on producer prices and
the terminal market price may differ from the quantity they might want to process, given the
terminal market and retail prices" (Gilbert, 2008). A second advantage of terminal markets is
that processors may restrict their supply to increase retail prices which encourages exporters to
directly sell to the terminal market and increase their sales. This eliminates monopolies from
the market. (Gilbert, 2008) states that processors and exporters will be allowed to make quan-
tity decisions most of the time, but they are not allowed to come up with price objectives when
entering the market.
3.2 The Coffee Value Chain
3.2.1 Basic Coffee Supply Chain
Coffee is mainly produced by small and large farmers in Latin America and Africa. These are
represented by ’Farmers’ in figure 3.1. So-called green coffee (i.e. unprocessed coffee) goes
from these farmers to the processors, which are most likely local traders or cooperatives in case
of small farmers. For further processing, the coffee is transported from these local traders to
independent exporters or exporting processors (indicated as ’roasters’ in the figure). They may
transfer it to independent roasters who spray-dry or freeze-dry the coffee before it goes to re-
tailers or they may sell it directly to retailers to be sold as such. The final product may be roasted
coffee in the form of beans or grounded, or soluble (instant) coffee (Gilbert, 2008). As said in
the Introduction, the processing phase is the one most intensified. According to (Gilbert, 2008),
branding is the most prominent cause of this intensification. Since there are many different cof-
fee species, processors can rely on the wishes of customers in specific regions to decide which

CHAPTER 3. EXAMPLES OF VALUE CHAIN ANALYSIS 39
kind of tastes to supply from the wide variety of possibilities. According to (Sutton, 1991)(as
cited by (Gilbert, 2008)), branding of the different types of coffee leads to the establishment of
barriers to market entry. A specific case study of the coffee value chain from Nicaraguan Fair
Trade farmers to Finnish Consumers is outlined below.
Figure 3.1: The basic coffee supply chain. Reprinted from (Gilbert, 2008).
3.2.2 Case Study: Coffee Value Chain from Nicaragua to Finland
This section illustrates the value chain of Fair Trade coffee from the cultivation in Nicaragua
until the consumption in Finland for the period 2005-2009 as described by (Valkila et al., 2010).
Valkila’s research is mainly focused on two retail chains containing data on coffee sales and on
the prices established by producers and consumers for different types of coffee.
First of all, a lot of coffee in Europe comes from Latin-America. Nicaragua was seen as a poor,
undeveloped country relying on the production of coffee to get some revenues. It focuses on
producing Fair Trade coffee while Finland is one of the main consumers of coffee in the world
according to (Valkila et al., 2010). The fact that farmers are often in a subordinate position in
poor countries compared to farmers in rich, developed countries led to the rise of Fair Trade
products and in particular Fair Trade coffee. (Bacon et al., 2008); (Kilian et al., 2006); (Mendoza
and Bastiaensen, 2003); (Zehner, 2002)(as cited by (Valkila et al., 2010)) state that the price re-
tailers ask for Fair Trade products is a lot higher than the price they actually have to pay for it to
the producers. This gap is still increasing, causing so-called transnational corporations in the

CHAPTER 3. EXAMPLES OF VALUE CHAIN ANALYSIS 40
consuming countries to be able to get more revenues and power and at the same time causing
farmers to get a smaller amount of the retail price and therefore become poorer (Daviron and
Ponte, 2005); (Ponte and Gibbon, 2005); (Talbot, 1997) (as cited by (Valkila et al., 2010)). On
the other hand, Fair Trade is also seen as a means to protect against too low or changing coffee
prices.
Recently, several actions were undertaken to take into account the social responsibility and
the environmental sustainability of the coffee production and trade (Valkila et al., 2010). This
is necessary due to the social injustice created by the heterogeneous production of coffee as
mentioned by (Valkila et al., 2010). Coffee can be produced by small farmers, often character-
ized by poor working conditions, or by larger organizations who have more possibilities than
small farmers due to their wealthiness. An option to reduce the poor working conditions cited
by (Valkila et al., 2010) entails the regulation of coffee prices so as to increase the price farmers
would receive. However, this is not a guarantee for an improved working environment and
sufficient wages. The coffee price is determined by the mechanism of supply and demand
and affected by several other factors such as weather, exchange rates, consumer patterns, en-
ergy prices, economic and technological growth, policies etc., making prices very sensitive to
changes (McCalla, 2009)(as cited by (Valkila et al., 2010)). Fair Trade coffee is said to be focused
on coffee produced by small farmers and sets a minimum price such that these farmers get suf-
ficient revenues to build for the future and improve working conditions. On top of this, Fair
Trade products are supposed to be purchased by consumers with a sense of social awareness.
Such consumers are ethically oriented and buy the product because they keep in mind their so-
cial contribution. The price is not the main purpose of buying the product, it is the underlying
way of thinking that is the driver of purchasing a Fair Trade product. Therefore, the consumers
of Fair Trade coffee are willing to pay a higher price if they are assured that the small farmers
in Nicaragua get an acceptable return. Increasing the price of Fair Trade coffee would first in-
crease the revenues of the retailer and in turn also increase the revenues of the farmers, which
opens perspectives for future growth for the farmers, as mentioned earlier in this paragraph.
In their research, (Valkila et al., 2010) compared four kinds of conventional coffees with two
kinds of Fair Trade coffees. The coffees were all first transported to Finland before being roasted
and wrapped up in packages to be sold by retailers. According to (Valkila et al., 2010), the value
CHAPTER 3. EXAMPLES OF VALUE CHAIN ANALYSIS 41
of the sales of the two Fair Trade coffees was only 1.3% of all the sales present in the data, while
the value of the sales of the four conventional coffees amounted to 91.3% of the sales in the data.
Obviously, products that are scarcer are expected to be more expensive than products that are
available in large quantities. Table 3.2.2 below shows the evolution of the prices of conventional
and Fair Trade coffee for the period January 2006 until June 2009. It is clear that Fair Trade coffee
is always around 50% higher than conventional coffee, mainly due to the ethical value added as
outlined above. The data collected by (Valkila et al., 2010) suggested that consumers preferred
to buy cheaper coffees instead of more expensive ones like the Fair Trade coffee, except when
people are committed to social awareness in the world and Southern America in particular. Al-
though there are fluctuations in the price of coffee, Fair Trade coffee never gets really cheap due
to the settlement of a Fair Trade minimum price. If the market price is greater than this mini-
mum price, then an extra premium, the so-called ’social premium’ is added to the market price
to make the distinction between conventional and Fair Trade coffee. On the other hand, if the
market price is smaller, then the minimum price, the set floor price, is applied. How the price
is distributed to retailers, cooperatives and farmers depends on the quality, the market prices,
costs for the different actors etc. In the following paragraph, an example of the distribution of
the price in case a cooperative offers both conventional and Fair Trade coffee is given.
According to (Valkila et al., 2010), back in 2006, a cooperative (An organization that brings to-
gether several farmers to act as a larger entity) sold 40% of its coffee as Fair Trade coffee for
around €2,62/kg (Note that this price is significantly lower than the consumer price depicted
in table 3.2.2). This was the minimum price a cooperative received before the price increased
steadily over the years. The social premium amounted to €0,10/kg or 4% of €2,62/kg. This so-
cial premium was merely used to improve working conditions in the cooperative. The price
the cooperative charged for conventional coffee was €2,38/kg. 60% of the coffee was sold as
conventional coffee. The average price of the coffee sales of the cooperative equals €2,44/kg
(= 40% x €2,52/kg + 60% x €2,38/kg), not taking the Fair Trade social premium into account.
The farmers that were part of the cooperative were required to pay several costs, such as export
costs, processing costs, administrative costs etc. which amounted to €0,58/kg. This resulted
in €1,86/kg being the price farmers received per kg coffee (= €2,44/kg - €0,58/kg). It is allowed
to state that farmers receive an amount that is actually only 70% of the price cooperatives re-
ceive. When calculating the average consumer price for 2006 (40% x €7,42/kg + 60% x €4,79/kg
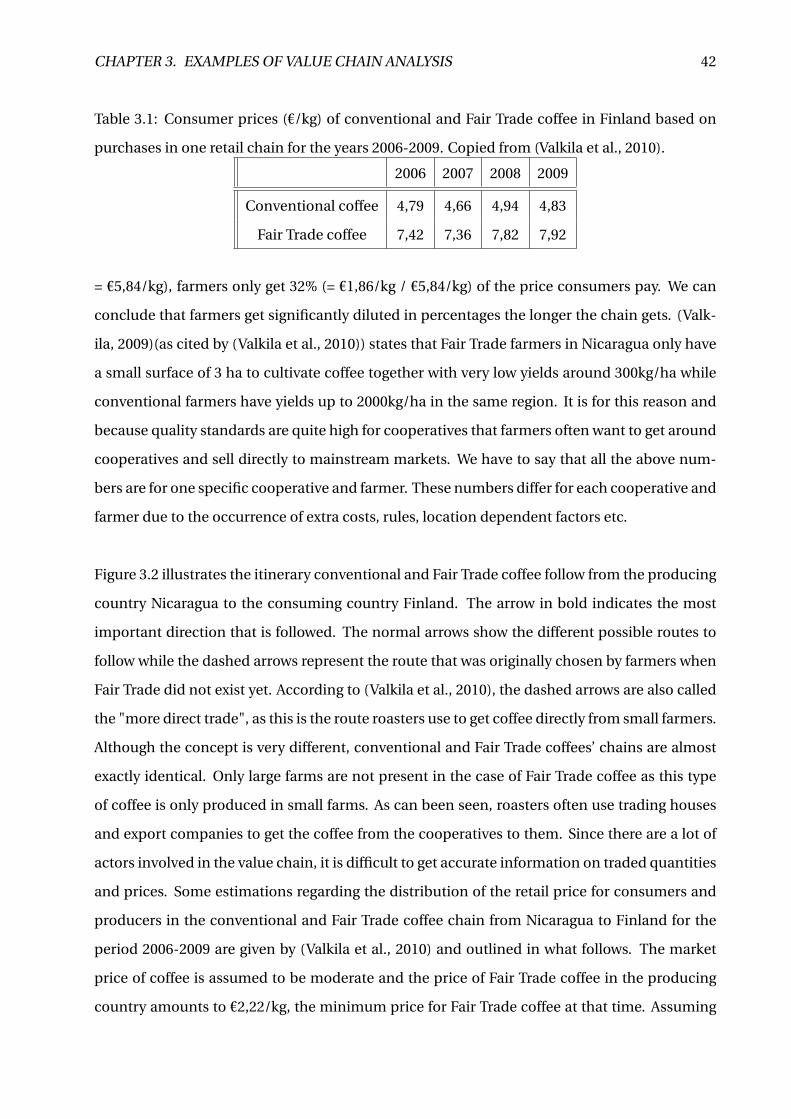
CHAPTER 3. EXAMPLES OF VALUE CHAIN ANALYSIS 42
Table 3.1: Consumer prices (€/kg) of conventional and Fair Trade coffee in Finland based on
purchases in one retail chain for the years 2006-2009. Copied from (Valkila et al., 2010).
2006 2007 2008 2009
Conventional coffee 4,79 4,66 4,94 4,83
Fair Trade coffee 7,42 7,36 7,82 7,92
= €5,84/kg), farmers only get 32% (= €1,86/kg / €5,84/kg) of the price consumers pay. We can
conclude that farmers get significantly diluted in percentages the longer the chain gets. (Valk-
ila, 2009)(as cited by (Valkila et al., 2010)) states that Fair Trade farmers in Nicaragua only have
a small surface of 3 ha to cultivate coffee together with very low yields around 300kg/ha while
conventional farmers have yields up to 2000kg/ha in the same region. It is for this reason and
because quality standards are quite high for cooperatives that farmers often want to get around
cooperatives and sell directly to mainstream markets. We have to say that all the above num-
bers are for one specific cooperative and farmer. These numbers differ for each cooperative and
farmer due to the occurrence of extra costs, rules, location dependent factors etc.
Figure 3.2 illustrates the itinerary conventional and Fair Trade coffee follow from the producing
country Nicaragua to the consuming country Finland. The arrow in bold indicates the most
important direction that is followed. The normal arrows show the different possible routes to
follow while the dashed arrows represent the route that was originally chosen by farmers when
Fair Trade did not exist yet. According to (Valkila et al., 2010), the dashed arrows are also called
the "more direct trade", as this is the route roasters use to get coffee directly from small farmers.
Although the concept is very different, conventional and Fair Trade coffees’ chains are almost
exactly identical. Only large farms are not present in the case of Fair Trade coffee as this type
of coffee is only produced in small farms. As can been seen, roasters often use trading houses
and export companies to get the coffee from the cooperatives to them. Since there are a lot of
actors involved in the value chain, it is difficult to get accurate information on traded quantities
and prices. Some estimations regarding the distribution of the retail price for consumers and
producers in the conventional and Fair Trade coffee chain from Nicaragua to Finland for the
period 2006-2009 are given by (Valkila et al., 2010) and outlined in what follows. The market
price of coffee is assumed to be moderate and the price of Fair Trade coffee in the producing
country amounts to €2,22/kg, the minimum price for Fair Trade coffee at that time. Assuming
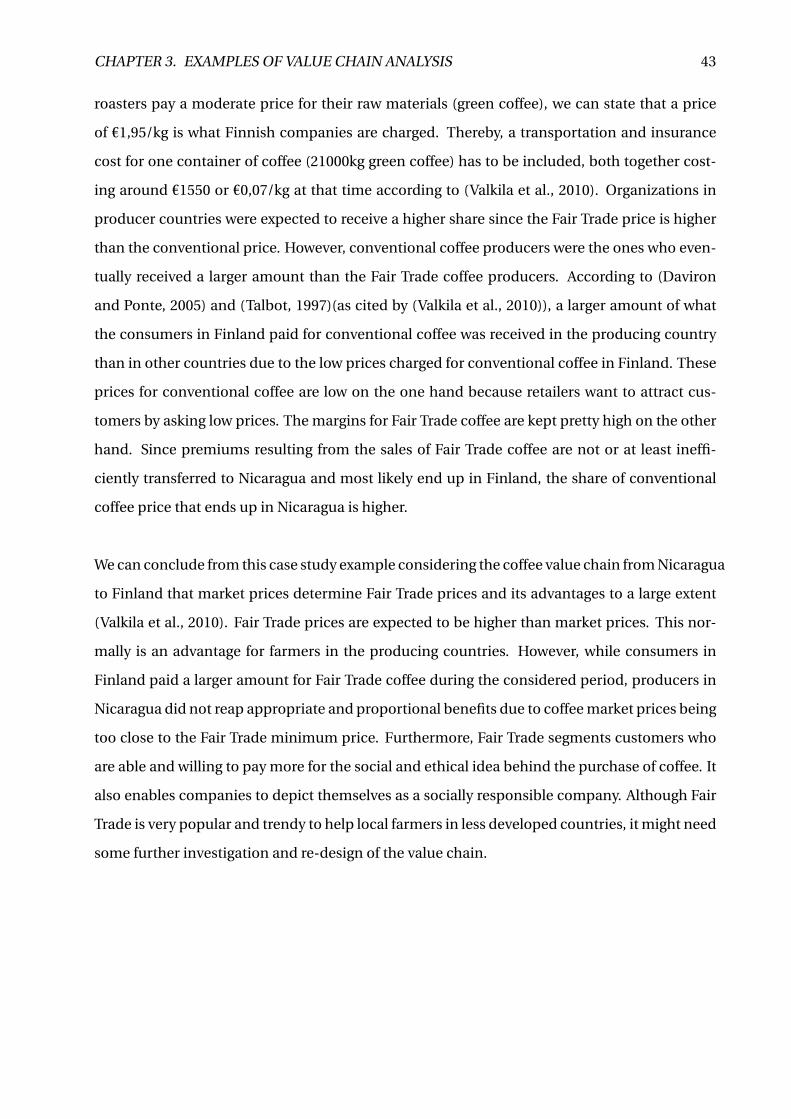
CHAPTER 3. EXAMPLES OF VALUE CHAIN ANALYSIS 43
roasters pay a moderate price for their raw materials (green coffee), we can state that a price
of €1,95/kg is what Finnish companies are charged. Thereby, a transportation and insurance
cost for one container of coffee (21000kg green coffee) has to be included, both together cost-
ing around €1550 or €0,07/kg at that time according to (Valkila et al., 2010). Organizations in
producer countries were expected to receive a higher share since the Fair Trade price is higher
than the conventional price. However, conventional coffee producers were the ones who even-
tually received a larger amount than the Fair Trade coffee producers. According to (Daviron
and Ponte, 2005) and (Talbot, 1997)(as cited by (Valkila et al., 2010)), a larger amount of what
the consumers in Finland paid for conventional coffee was received in the producing country
than in other countries due to the low prices charged for conventional coffee in Finland. These
prices for conventional coffee are low on the one hand because retailers want to attract cus-
tomers by asking low prices. The margins for Fair Trade coffee are kept pretty high on the other
hand. Since premiums resulting from the sales of Fair Trade coffee are not or at least ineffi-
ciently transferred to Nicaragua and most likely end up in Finland, the share of conventional
coffee price that ends up in Nicaragua is higher.
We can conclude from this case study example considering the coffee value chain from Nicaragua
to Finland that market prices determine Fair Trade prices and its advantages to a large extent
(Valkila et al., 2010). Fair Trade prices are expected to be higher than market prices. This nor-
mally is an advantage for farmers in the producing countries. However, while consumers in
Finland paid a larger amount for Fair Trade coffee during the considered period, producers in
Nicaragua did not reap appropriate and proportional benefits due to coffee market prices being
too close to the Fair Trade minimum price. Furthermore, Fair Trade segments customers who
are able and willing to pay more for the social and ethical idea behind the purchase of coffee. It
also enables companies to depict themselves as a socially responsible company. Although Fair
Trade is very popular and trendy to help local farmers in less developed countries, it might need
some further investigation and re-design of the value chain.
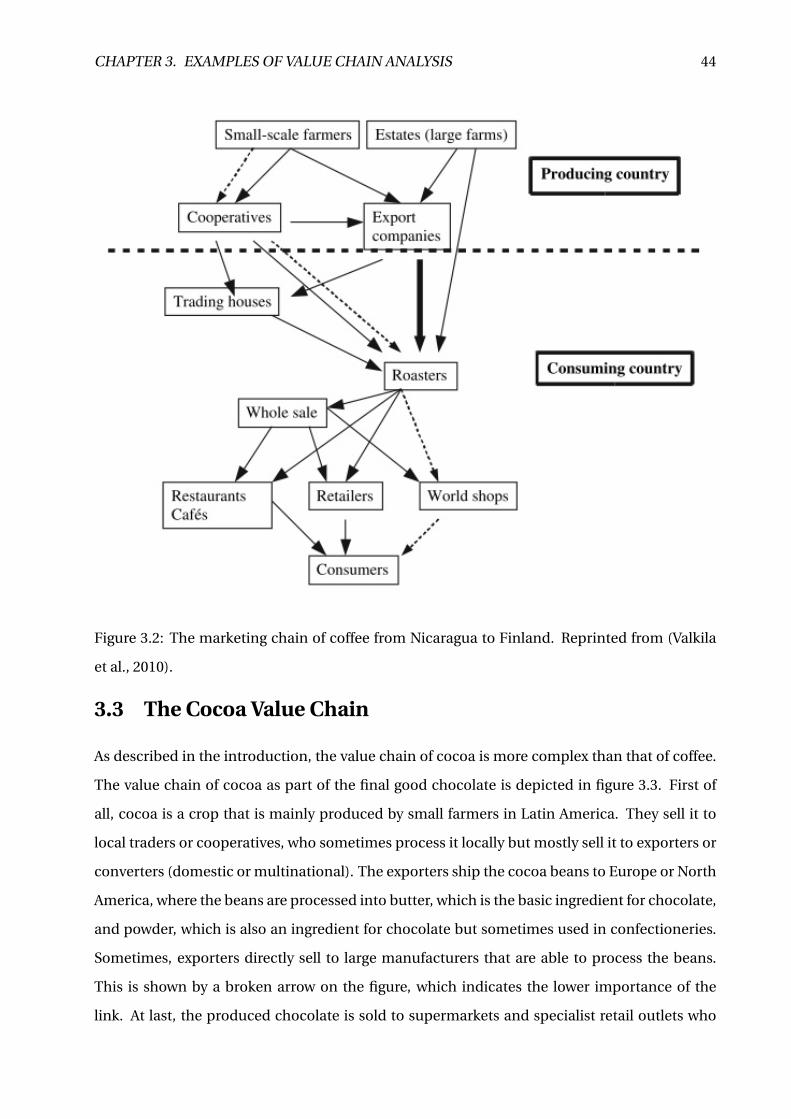
CHAPTER 3. EXAMPLES OF VALUE CHAIN ANALYSIS 44
Figure 3.2: The marketing chain of coffee from Nicaragua to Finland. Reprinted from (Valkila
et al., 2010).
3.3 The Cocoa Value Chain
As described in the introduction, the value chain of cocoa is more complex than that of coffee.
The value chain of cocoa as part of the final good chocolate is depicted in figure 3.3. First of
all, cocoa is a crop that is mainly produced by small farmers in Latin America. They sell it to
local traders or cooperatives, who sometimes process it locally but mostly sell it to exporters or
converters (domestic or multinational). The exporters ship the cocoa beans to Europe or North
America, where the beans are processed into butter, which is the basic ingredient for chocolate,
and powder, which is also an ingredient for chocolate but sometimes used in confectioneries.
Sometimes, exporters directly sell to large manufacturers that are able to process the beans.
This is shown by a broken arrow on the figure, which indicates the lower importance of the
link. At last, the produced chocolate is sold to supermarkets and specialist retail outlets who
CHAPTER 3. EXAMPLES OF VALUE CHAIN ANALYSIS 45
sell it to the public. The complexity of the cocoa-chocolate value chain lies in the fact that
cocoa is only one of three ingredients necessary for the production of chocolate. As indicated
on the figure, dairies such as milk, and sugar are the other required ingredients. The supply
chain of chocolate is therefore disposed of three supply chains that are in relationships with
each other. (Gilbert, 2008) mentions that cocoa farmers may see themselves as crucial actors
for the chocolate manufacturers, while chocolate manufacturers see the cocoa farmers as just a
supplier of one of their ingredients. This allows (Gilbert, 2008) to state that the cocoa-chocolate
value chain is more dubious and dependent on factors than the coffee value chain.
Figure 3.3: The cocoa-chocolate supply chain. Reprinted from (Gilbert, 2008).

Part III
Case Study: An Analysis of the Value Chain
of Quinoa
47

48

49
Introduction
This case study presents the different stages in the value chain of quinoa from Peru to Bel-
gium/Europe. First of all, an investigation of the social-economic context was done for two
specific regions in Peru: Puno and Ayacucho. These regions are the most important for quinoa
production and, especially Ayacucho, also the most dependent on quinoa production. After the
analysis of the current situation, some future insights on quinoa production are given to con-
clude this chapter. Secondly, the characteristics of the value chain are described: what does the
chain look like, what are the different stages of the value chain, what are the constraints every
stage has to cope with, which prices are paid, which actors have multiple roles, which stages
do they cover, an elaboration on the actors etc. Since most of the companies are not easily ac-
cessible and not willing to share their private information with the public, an estimation of the
impacts by the different actors in all the stages is done. This is based on information for Peru
in general and information or data we were able to gather through interviews with a Belgian
wholesaler and importer and Peruvian processors/exporters. In chapter 6, the relationships
between the actors are assessed based on the constraints and margins discussed in each stage.
This made us conduct a qualitative as well as a quantitative analysis in which we evaluate the
power of the different stages in the value chain of quinoa. Finally, insights and possibilities for
upgrading the current value chain are given.

50
Chapter 4
Socio-Economic Context
4.1 Introduction
A broad explanation of the socio-economic situation of Peru and Bolivia in recent years is given
in appendix F. This is representative for the case study being discussed in the following sections
because the main farmers, processors and exporters presented in this case study are located
near Ayacucho, the capital city of the Huamanga Province which lies in the Ayacucho Region
and Puno, the capital city of the Puno Region and Puno Province. Both cities have similar char-
acteristics: They are situated more than 2500 meters above sea level and around 150.000 people
are living in the cities. These regions in Peru are known for their high poverty rate, especially
Ayacucho, which has one of the highest in the whole country. Since it is comparable to the sit-
uation in Bolivia, Bolivia is included in this part of the case study as a means of reference. The
capital of Peru, Lima, scores slightly better in terms of poverty and development. Lima offers
a lot more possibilities for trade and export. This explains why most processors and storage
holders are located in Lima. This is also the case for the processors and storage holders in our
case study. To give an idea of the current poverty and socio-economic situation in Ayacucho as
well as Puno, the position of Ayacucho and Lima compared to each other and the rest of Peru
is discussed below by means of several tables. Note that this data is from 2007 and that some
changes have occurred since then.
51

CHAPTER 4. SOCIO-ECONOMIC CONTEXT 52
4.2 Population and Education
Table 4.5 shows absolute numbers of the population in Peru in general, in the Ayacucho region
and the region of Lima. The table makes a distinction between people living in rural areas
and people living in urban areas. The education part of the table shows that there still is a
huge difference between men and women in the society and also makes a distinction between
the urban and the rural population. Since 42% of the people in the region of Ayacucho live
in rural areas compared to 24% in the rest of Peru, we can state that agriculture is one of the
most important sources of income for the people in this region. When looking at the illiteracy
of the population of Peru, it seems that a lot more women are illiterate compared to men. This
illustrates the huge gap that still exists between the two genders, especially in the region of
Ayacucho. The percentage of illiterate, uneducated people in the region of Ayacucho is 10%
higher than in the rest of Peru. Both show the severe poverty that is present in this region.
4.3 Participation in Economic Activity
The second table (Table 4.5) entails the participation to economic activities by people of age
14 and older. The poverty of the Ayacucho region is again illustrated by its lower percentage
of population that is economically active compared to the rest of Peru (49,4% versus 54,1%).
The percentage of economically active population is the highest in Lima (58%). A lot of the
population in Ayacucho that is economically active (29%) is employed in agriculture and fishing
activities while this is only 12,9% for Peru in total. As was shown in the previous table, most
of the economically active people are men, not only in Ayacucho. Another notable measure
shows that relatively the double of the population in Ayacucho works in hunting and forestry
compared to the rest of Peru (46% versus 23%). This is only 3,8% in Lima, where more people
work in manufacturing industries (13,2%). In Ayacucho, this only amounts to 3,8%. Other facets
that indicate the severe poverty in the region of Ayacucho relatively to the rest of Peru are the
limited availability of electricity, television, computers, use of gas, primitive use of materials for
building houses and extensive use of firewood.
CHAPTER 4. SOCIO-ECONOMIC CONTEXT 53
4.4 Social Impact by Outsiders
The severe poverty present in some regions in Peru (especially the region of Ayacucho) was
one of the main reasons why organizations such as Solid Food International (Elaborated and
explained in the following sections) want to work with small farmers. They feel that having a
social impact nowadays is very important, not only for its own relationships and profits but
also to create a better world in general. By focussing on small farmers living in poor conditions,
such organizations want to help them out of the severe poverty. Several ways of doing so are
enumerated below and provide an indication for the construction of the value chain:
1. Linking farmers from poor regions with processors and storage holders in Lima.
2. Making sure farmers get a sufficient return on their sales.
3. Optimizing the cultivation process for the farmers and the processing steps for the pro-
cessors.
4.5 Prospects for the Future
It seems obvious that consumption as a food will remain the most important source of demand
for quinoa in years to come. However, niche markets such as the cosmetics, medicinal and
pharmaceutics industry in which quinoa’s nutritional values are used will also thrive demand
and contribute to the expansion of quinoa cultivation in Peru and Bolivia.
Since the demand of quinoa is still increasing and more and more exceeding borders world-
wide, the production as well as the cultivated area of quinoa in Peru will continue to increase,
certainly in Ayacucho and Puno, where quinoa is the major source of income for the poor farm-
ers. According to (Documento conjunto ALADI - FAO, 2014), Peruvian authorities and the Min-
istry of Agriculture and Foreign Trade have stated that the goal is to expand the cultivated area
to 100 000 hectares in the next years. Furthermore, the authorities are looking to encourage
the local production and consumption of quinoa to stimulate the combined demand because
more than 75% of the production is exported. If we are to believe the predictions of the authori-
ties, cultivation and production of quinoa will continue to flourish which will lead to significant
benefits for the local population in Peru, despite the recent drop in prices and new plantations
of quinoa starting up overseas.
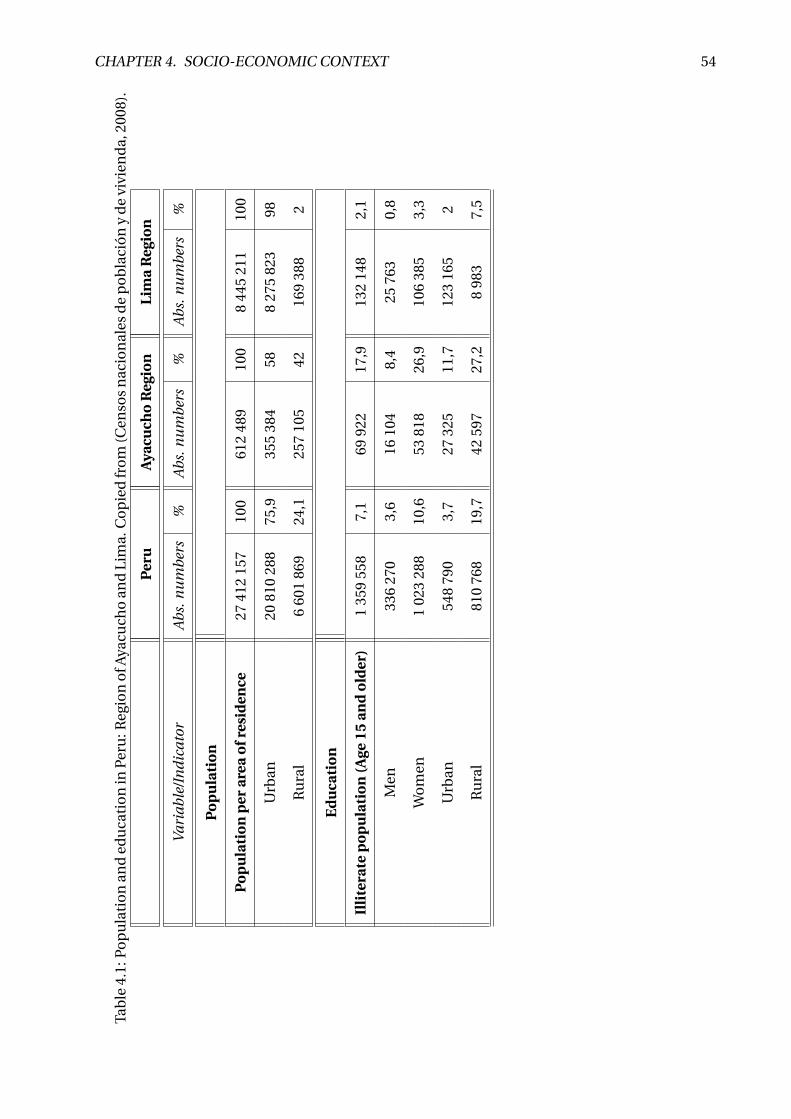
CHAPTER 4. SOCIO-ECONOMIC CONTEXT 54
Tab
le4.
1:Po
pu
lati
on
and
edu
cati
on
inPe
ru:R
egio
no
fAya
cuch
oan
dLi
ma.
Co
pie
dfr
om
(Cen
sos
nac
ion
ales
de
po
bla
ció
ny
de
vivi
end
a,20
08).
Per
uA
yacu
cho
Reg
ion
Lim
aR
egio
n
Var
iabl
e/In
dic
ator
Abs
.nu
mbe
rs%
Abs
.nu
mbe
rs%
Abs
.nu
mbe
rs%
Po
pu
lati
on
Po
pu
lati
on
per
area
ofr
esid
ence
2741
215
710
061
248
910
08
445
211
100
Urb
an20
810
288
75,9
355
384
588
275
823
98
Ru
ral
660
186
924
,125
710
542
169
388
2
Ed
uca
tio
n
Illi
tera
tep
op
ula
tio
n(A
ge15
and
old
er)
135
955
87,
169
922
17,9
132
148
2,1
Men
336
270
3,6
1610
48,
425
763
0,8
Wo
men
102
328
810
,653
818
26,9
106
385
3,3
Urb
an54
879
03,
727
325
11,7
123
165
2
Ru
ral
810
768
19,7
4259
727
,28
983
7,5

CHAPTER 4. SOCIO-ECONOMIC CONTEXT 55
Tab
le4.
2:Pa
rtic
ipat
ion
inE
con
om
icA
ctiv
ity.
Co
pie
dfr
om
(Cen
sos
nac
ion
ales
de
po
bla
ció
ny
de
vivi
end
a,20
08).
Per
uA
yacu
cho
Reg
ion
Lim
aR
egio
n
Var
iabl
e/In
dic
ator
Abs
.nu
mbe
rs%
Abs
.nu
mbe
rs%
Abs
.nu
mbe
rs%
Par
tici
pat
ion
inE
con
om
icA
ctiv
ity
(14
and
old
er)
Eco
no
mic
ally
Act
ive
Po
pu
lati
on
(EA
P)
1063
788
020
016
73
744
947
EPA
acti
vity
rate
54,1
49,4
58
Men
71,2
66,9
71,8
Wo
men
37,7
32,6
45,2
EPA
acco
rdin
gto
mai
no
ccu
pat
ion
1016
361
410
019
117
310
03
611
300
100
Agr
icu
ltu
ralA
ctiv
itie
s
and
Fis
hin
g1
311
748
12,9
5503
328
,860
080
1,7
No
n-q
ual
ified
wo
rk,s
ervi
ces,
paw
n,
(str
eet)
ven
do
rs,a
nd
rela
ted
259
043
025
,551
950
27,2
732
414
20,3
EPA
acco
rdin
gto
eco
no
mic
acti
vity
1016
361
410
019
117
310
03
611
300
100
Agr
icu
ltu
re,l
ives
tock
,
hu
nti
ng
and
fore
stry
234
249
323
8798
646
137
829
3,8
Man
ufa
ctu
rin
gin
du
stri
es94
395
49,
37
342
3,8
477
799
13,2

Chapter 5
Characteristics of the Value Chain of Quinoa
5.1 Introduction
As mentioned before and again confirmed by (Salcedo et al., 2013) in their paper about the
international trade of quinoa, peasant producers aka small farmers are the ones who are re-
sponsible for most of the production of quinoa. This makes the supply of quinoa very much
spread out over the different producing countries. (Salcedo et al., 2013) estimate that there are
70 000 small farmers in Bolivia and 100 000 in Peru, which results in an average growth of 1
hectare per farmer. He assumes this is very important data to better understand the market
channels that are installed to bring quinoa to the numerous local, regional and export markets.
Although the structure of the several kinds of quinoa is identical and adjusted to the relatively
small volumes that are produced by each farmer, not only its quality and physical characteris-
tics can be very different but also the channels responsible for the quinoa flow may somewhat
differ provided the final destination of the product. The main components of the value chain of
quinoa are shown in table 5.1. A simple representation of the different stages of the value chain,
incorporating these components, is depicted in figure 5.1. Each stage is outlined below in more
detail.
Since quinoa is not consumed immediately after harvest, (Salcedo et al., 2013) state that mar-
keting and distribution also comprise several actors of the value chain of quinoa: These are so-
called processors, people involved in drying, dehulling and saponin removal of the grain, which
can be described as preliminary processes before being consumed or transported. Due to the
increase in demand, particularly from international markets, quinoa adopted higher standards
57
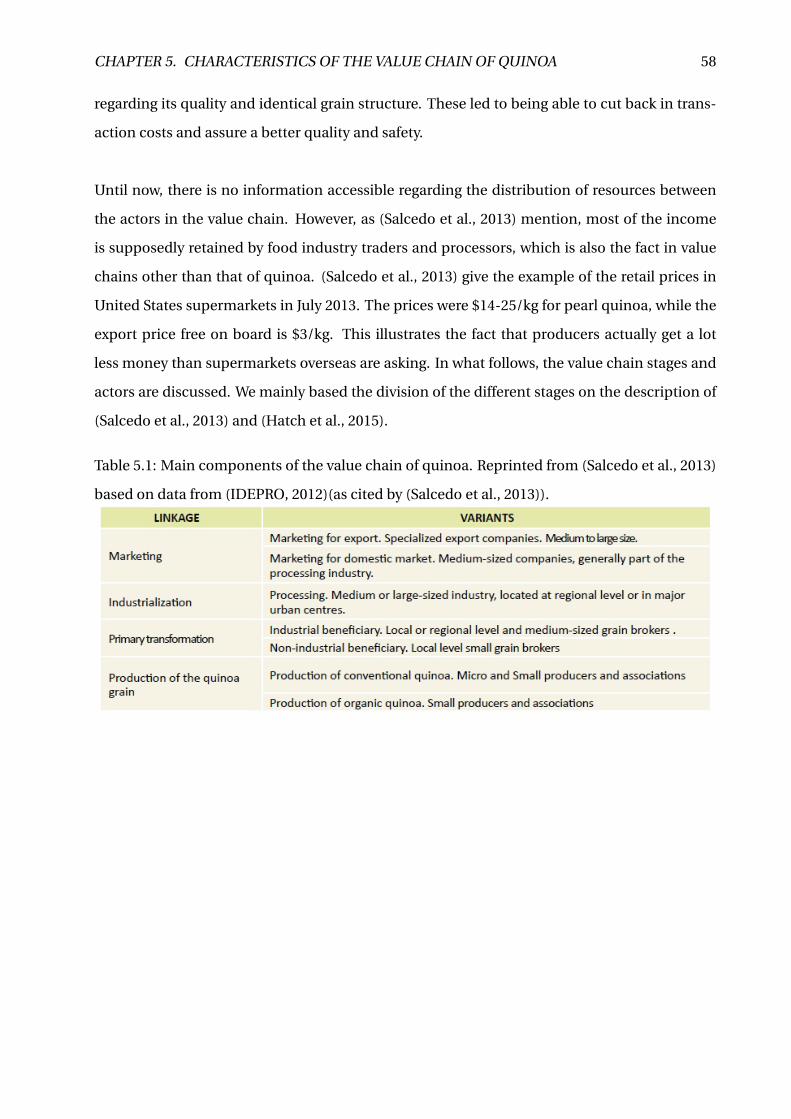
CHAPTER 5. CHARACTERISTICS OF THE VALUE CHAIN OF QUINOA 58
regarding its quality and identical grain structure. These led to being able to cut back in trans-
action costs and assure a better quality and safety.
Until now, there is no information accessible regarding the distribution of resources between
the actors in the value chain. However, as (Salcedo et al., 2013) mention, most of the income
is supposedly retained by food industry traders and processors, which is also the fact in value
chains other than that of quinoa. (Salcedo et al., 2013) give the example of the retail prices in
United States supermarkets in July 2013. The prices were $14-25/kg for pearl quinoa, while the
export price free on board is $3/kg. This illustrates the fact that producers actually get a lot
less money than supermarkets overseas are asking. In what follows, the value chain stages and
actors are discussed. We mainly based the division of the different stages on the description of
(Salcedo et al., 2013) and (Hatch et al., 2015).
Table 5.1: Main components of the value chain of quinoa. Reprinted from (Salcedo et al., 2013)
based on data from (IDEPRO, 2012)(as cited by (Salcedo et al., 2013)).
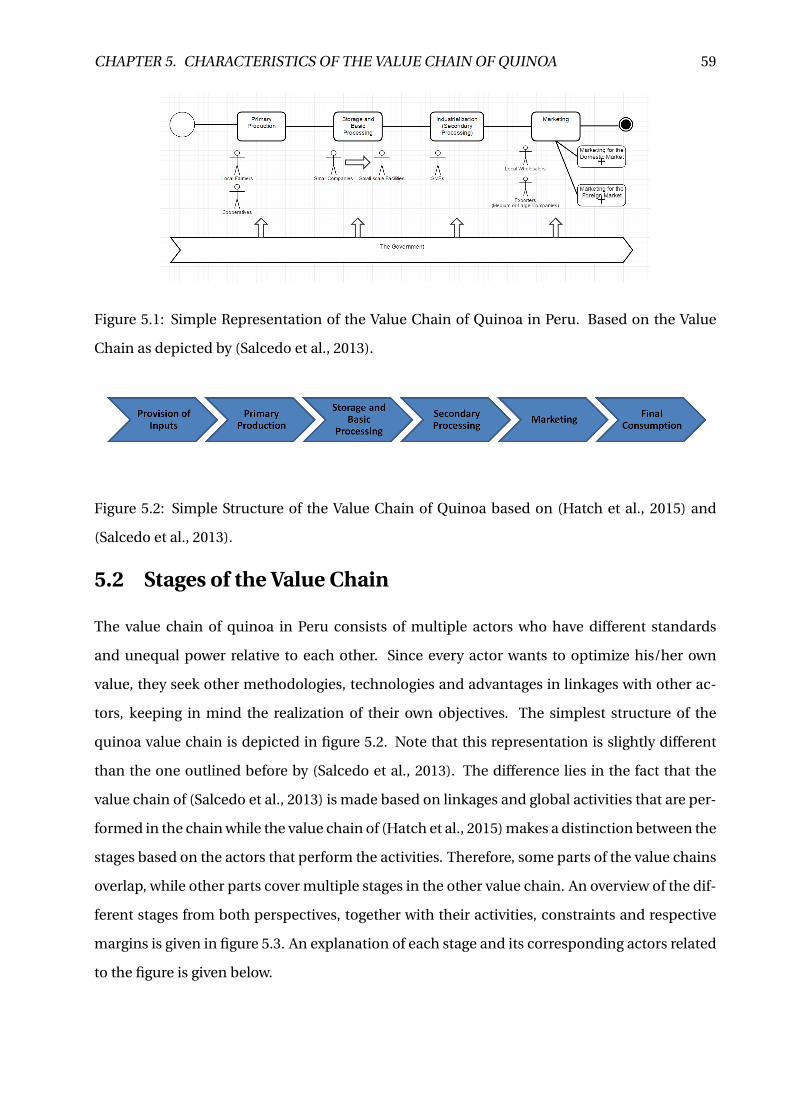
CHAPTER 5. CHARACTERISTICS OF THE VALUE CHAIN OF QUINOA 59
Figure 5.1: Simple Representation of the Value Chain of Quinoa in Peru. Based on the Value
Chain as depicted by (Salcedo et al., 2013).
Figure 5.2: Simple Structure of the Value Chain of Quinoa based on (Hatch et al., 2015) and
(Salcedo et al., 2013).
5.2 Stages of the Value Chain
The value chain of quinoa in Peru consists of multiple actors who have different standards
and unequal power relative to each other. Since every actor wants to optimize his/her own
value, they seek other methodologies, technologies and advantages in linkages with other ac-
tors, keeping in mind the realization of their own objectives. The simplest structure of the
quinoa value chain is depicted in figure 5.2. Note that this representation is slightly different
than the one outlined before by (Salcedo et al., 2013). The difference lies in the fact that the
value chain of (Salcedo et al., 2013) is made based on linkages and global activities that are per-
formed in the chain while the value chain of (Hatch et al., 2015) makes a distinction between the
stages based on the actors that perform the activities. Therefore, some parts of the value chains
overlap, while other parts cover multiple stages in the other value chain. An overview of the dif-
ferent stages from both perspectives, together with their activities, constraints and respective
margins is given in figure 5.3. An explanation of each stage and its corresponding actors related
to the figure is given below.

CHAPTER 5. CHARACTERISTICS OF THE VALUE CHAIN OF QUINOA 60
5.2.1 Provision of Inputs
Farmers or producers, processors and storage holders of quinoa all have to be provided with
several different utilities and raw materials before being able to successfully conduct their ac-
tivities. The provision of inputs sets out the preliminary step in the value chain as can be seen
in figure 5.3. However, it can be taken together with the primary production step because pro-
ducers have to make sure they have the necessary inputs available.
The first thing the small farmers need is a piece of land. This can be rented from larger farm-
ers/landowners or associations or can be of their own. In Peru, it is often the case that large
farmers/landowners divide their land in small parts so as to provide small farmers with land
which they can use to grow whatever kind of crop they want. In return, the small farmers pay
a monthly or annual fee to the landowners. Sometimes, the small farmers are associated to the
landowners, which facilitates the process for later stage actors (e.g. processors). Secondly, many
quinoa seeds and fertilizers are necessary to cultivate quinoa on a large scale. These seeds can
be provided by seeders (directly or indirectly through external organizations) or by producers
themselves from previous harvests. In Puno, the main source of seeds is from own production
of a previous harvest (around 90%), while the remaining 10% is acquired from seeders (Hatch
et al., 2015). Fertilizers can be chemical or natural. In the lowlands, a lot of chemical fertilizers
are used to boost the production, while in the highlands and especially Puno, only natural fer-
tilizers are applied on the grains. Thirdly, equipment to sow and fertilize the seeds and harvest
the crops as well as warehouses to store raw materials and harvested quinoa are fundamental
for the producers, the processors and the storage holders. Most large farmers, processors and
storage holders have their own equipment available, some partly use other equipment for spe-
cific processes and some have to borrow all the equipment. According to (Hatch et al., 2015), in
the case of Puno, all the machines of the producers are rented. Sometimes, producers receive
financing from the local municipality for the rent of machinery and equipment. Furthermore,
since innovation is very important in this sector, research for new opportunities need to be con-
ducted. This occurs indirectly through universities and investigation and development funds
established by the government. The information is most likely provided to independent agri-
cultural development organizations which transfer the information towards the farmers and
producers. The information generated by innovation techniques can also be used to foresee
training and technical assistance for the farmers. Technical assistance and training go hand in
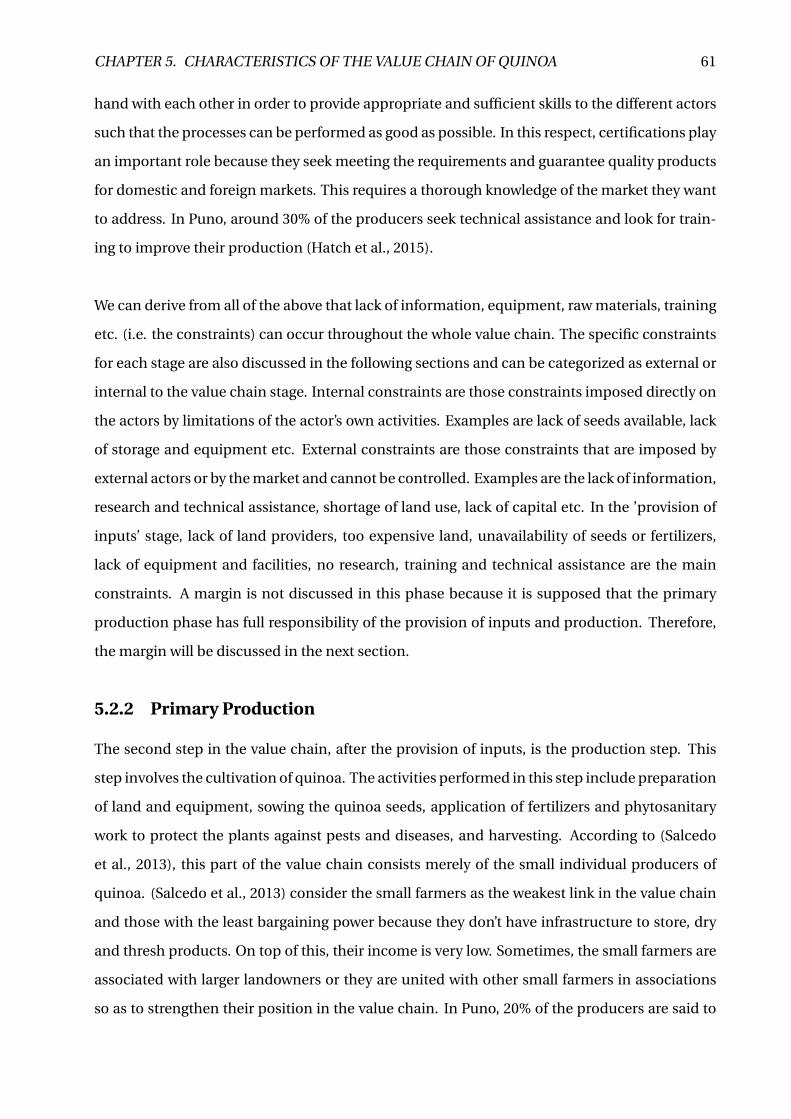
CHAPTER 5. CHARACTERISTICS OF THE VALUE CHAIN OF QUINOA 61
hand with each other in order to provide appropriate and sufficient skills to the different actors
such that the processes can be performed as good as possible. In this respect, certifications play
an important role because they seek meeting the requirements and guarantee quality products
for domestic and foreign markets. This requires a thorough knowledge of the market they want
to address. In Puno, around 30% of the producers seek technical assistance and look for train-
ing to improve their production (Hatch et al., 2015).
We can derive from all of the above that lack of information, equipment, raw materials, training
etc. (i.e. the constraints) can occur throughout the whole value chain. The specific constraints
for each stage are also discussed in the following sections and can be categorized as external or
internal to the value chain stage. Internal constraints are those constraints imposed directly on
the actors by limitations of the actor’s own activities. Examples are lack of seeds available, lack
of storage and equipment etc. External constraints are those constraints that are imposed by
external actors or by the market and cannot be controlled. Examples are the lack of information,
research and technical assistance, shortage of land use, lack of capital etc. In the ’provision of
inputs’ stage, lack of land providers, too expensive land, unavailability of seeds or fertilizers,
lack of equipment and facilities, no research, training and technical assistance are the main
constraints. A margin is not discussed in this phase because it is supposed that the primary
production phase has full responsibility of the provision of inputs and production. Therefore,
the margin will be discussed in the next section.
5.2.2 Primary Production
The second step in the value chain, after the provision of inputs, is the production step. This
step involves the cultivation of quinoa. The activities performed in this step include preparation
of land and equipment, sowing the quinoa seeds, application of fertilizers and phytosanitary
work to protect the plants against pests and diseases, and harvesting. According to (Salcedo
et al., 2013), this part of the value chain consists merely of the small individual producers of
quinoa. (Salcedo et al., 2013) consider the small farmers as the weakest link in the value chain
and those with the least bargaining power because they don’t have infrastructure to store, dry
and thresh products. On top of this, their income is very low. Sometimes, the small farmers are
associated with larger landowners or they are united with other small farmers in associations
so as to strengthen their position in the value chain. In Puno, 20% of the producers are said to

CHAPTER 5. CHARACTERISTICS OF THE VALUE CHAIN OF QUINOA 62
be part of an association. (Hatch et al., 2015) states that 2% of the production of the farmers in
Puno is used as seeds in the next years, own consumption ranges from 5% to 22%, around 30% is
stored for later sale and half of the production is sold immediately after harvest, depending on
the farmers’ intentions. Figure 5.3 includes a light blue double arrow going from the producers
to the framework with organizations that include processors and exporters because these or-
ganizations perform the activities normally performed by processors as well as exporters. This
indicates the interrelationships both groups and is further explained in section 5.3 ’Multi-stage
actors’. The dark blue arrow coming from the framework of intermediaries expresses the re-
lationships that intermediaries in foreign countries build with primary producers in order to
have an economic and a social impact on the small farmers. Obviously, they also have con-
tracts with processors and exporters but by establishing a relationship with the farmers, they
try to help the farmers to defend their rights and create social awareness among the people not
only in Peru, but also in Europe and other continents, depending on the resident country of the
organization. Therefore, a specific reference from the intermediaries to the primary producers
was made on the figure. These intermediaries can be regarded as the importers of quinoa in
foreign countries. An example of such a company is Solid Food Europe, which is described later
in section 5.3.7.
Constraints primary producers have to cope with include the shortage of land use due to lots
being too expensive to buy or rent or too many lots already taken, lack of training, technical as-
sistance, information exchange, research and innovation, lack of storage and equipment, lack
of certifications to assure quality, inability to sell at fair prices, transportation difficulties. These
are external constraints. The internal constraints for primary producers comprise the unavail-
ability of seeds, pests or diseases of seeds or plants and bad fertilization of seeds. The area har-
vested by farmers in the region of Puno amounted to 32 261 ha in 2014, while the production for
that year was 36 158 ton. This resulted in a yield of 1 121 kg/ha. This is slightly less than the yield
generated in Ayacucho in 2014 (1 341 kg/ha), where harvested area (7 696 ha) and production
(10 323 ton) are a lot lower. The region of Puno can be regarded as the most important region
of production of quinoa in Peru with a total of 61 425 production units in 2014. This adds up
to 82% of the total production units in Peru (Hatch et al., 2015). Based on the previous figures
and the fact that 5% of the total production units are located in Ayacucho, the absolute number
of production units in Ayacucho is 3 745. An overview of the harvested area, the production
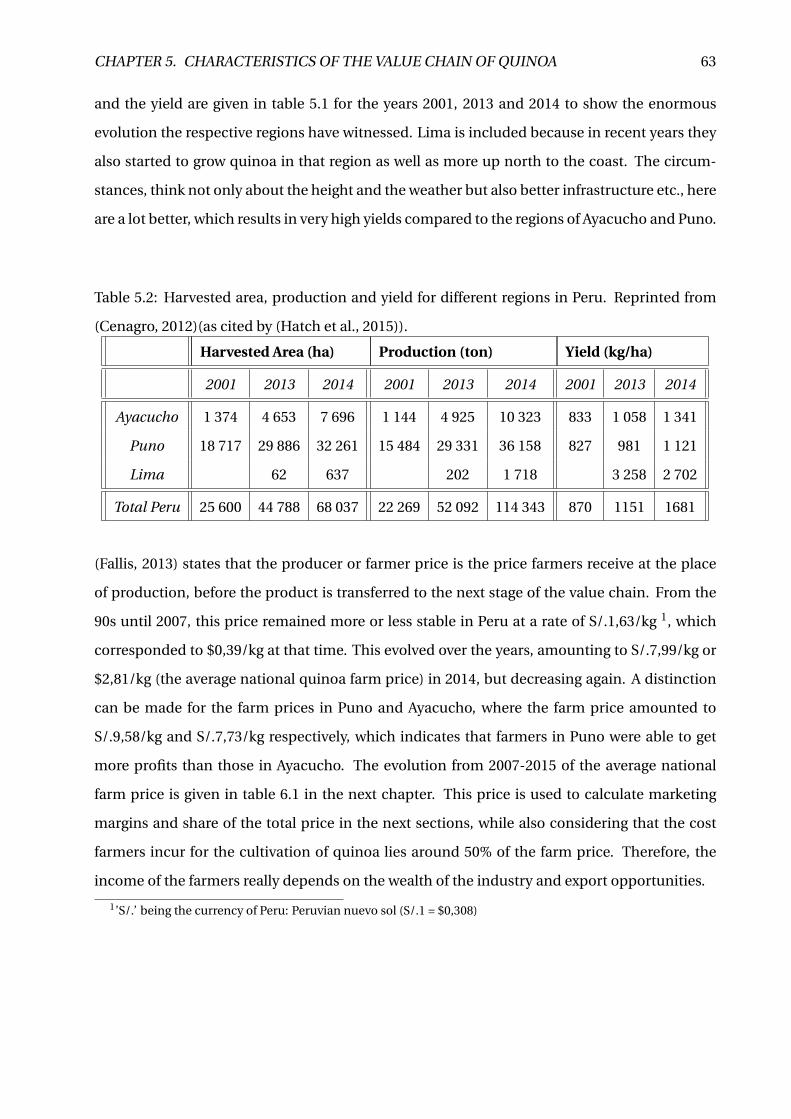
CHAPTER 5. CHARACTERISTICS OF THE VALUE CHAIN OF QUINOA 63
and the yield are given in table 5.1 for the years 2001, 2013 and 2014 to show the enormous
evolution the respective regions have witnessed. Lima is included because in recent years they
also started to grow quinoa in that region as well as more up north to the coast. The circum-
stances, think not only about the height and the weather but also better infrastructure etc., here
are a lot better, which results in very high yields compared to the regions of Ayacucho and Puno.
Table 5.2: Harvested area, production and yield for different regions in Peru. Reprinted from
(Cenagro, 2012)(as cited by (Hatch et al., 2015)).
Harvested Area (ha) Production (ton) Yield (kg/ha)
2001 2013 2014 2001 2013 2014 2001 2013 2014
Ayacucho 1 374 4 653 7 696 1 144 4 925 10 323 833 1 058 1 341
Puno 18 717 29 886 32 261 15 484 29 331 36 158 827 981 1 121
Lima 62 637 202 1 718 3 258 2 702
Total Peru 25 600 44 788 68 037 22 269 52 092 114 343 870 1151 1681
(Fallis, 2013) states that the producer or farmer price is the price farmers receive at the place
of production, before the product is transferred to the next stage of the value chain. From the
90s until 2007, this price remained more or less stable in Peru at a rate of S/.1,63/kg 1, which
corresponded to $0,39/kg at that time. This evolved over the years, amounting to S/.7,99/kg or
$2,81/kg (the average national quinoa farm price) in 2014, but decreasing again. A distinction
can be made for the farm prices in Puno and Ayacucho, where the farm price amounted to
S/.9,58/kg and S/.7,73/kg respectively, which indicates that farmers in Puno were able to get
more profits than those in Ayacucho. The evolution from 2007-2015 of the average national
farm price is given in table 6.1 in the next chapter. This price is used to calculate marketing
margins and share of the total price in the next sections, while also considering that the cost
farmers incur for the cultivation of quinoa lies around 50% of the farm price. Therefore, the
income of the farmers really depends on the wealth of the industry and export opportunities.
1’S/.’ being the currency of Peru: Peruvian nuevo sol (S/.1 = $0,308)

CHAPTER 5. CHARACTERISTICS OF THE VALUE CHAIN OF QUINOA 64
5.2.3 Storage and Basic Processing
In this stage, the quinoa grain is collected and goes through processes such as cleaning, dry-
ing, separating the edible part of the grain from the chaff around it (i.e. threshing), selection
and storage. These activities can be done by the farmers that executed the primary produc-
tion phase but according to (Salcedo et al., 2013), this stage often comprises small companies
(farmers/processors) that are united in cooperatives and associations. These are the ones that
form so-called joined forces. As depicted on figure 5.3, there is some kind of overlap between
the two kinds of representations, indicating that the storage and basic processing phase can in-
clude primary producers as well as processors. Small-scale facilities are formed to enhance the
processes of cleaning, drying and threshing. The places where the quinoa is stored are mostly
close to the field of production. Once the product is finished, it is ready to be transported for
further processing or export to regional and international markets. In the case of Puno, quinoa
is collected by a specific type of collectors and brought to processors that are located in the clos-
est city. This can also be done by the processor himself. In some very rare cases, retailers and
wholesalers from nearby cities act as the collectors and the processors from where the quinoa
is further distributed for domestic export and consumption.
External constraints with which actors in this stage of the value chain have to cope include
asymmetries in price and information with farmers as well as with further processors, exporters
or intermediaries, infrastructure problems (e.g. bad roads on which quinoa needs to be trans-
ported from farmer to processor), lack of storage facilities and equipment, lack of certifications
to assure quality standards, limited technical assistance and training, inefficiencies in linkages
with farmers or exporters and limited availability of capital. Internal constraints for the storage
holders and processors are lack of storage space, outdated equipment, limited technology and
too few improvement and innovation possibilities available at the plant.
5.2.4 Industrialization
The next stage is the industrialization stage as indicated by (Salcedo et al., 2013). This stage
overlaps with the processing and exporting phases that were distinguished by (Hatch et al.,
2015) (Figure 5.3). The main activities performed in this stage are the collection, extraction
and preparation of organic or conventional quinoa for the market. Quite often, this phase is
covered by the same company as the previous phase and therefore can be considered together
CHAPTER 5. CHARACTERISTICS OF THE VALUE CHAIN OF QUINOA 65
(see section 5.3 ’Multi-stage actors’). According to (Hatch et al., 2015), 85%-90% of the quinoa
that is commercialized is sold as bulk, the remainder is sold as pearls, flakes, flour and pop-
corn. Exceptionally, it can be used in biscuits, bread, cakes, juices, energy bars and delicacies.
The product is then sold to either regional or international markets. The most important actors
in this stage are small and medium-sized enterprises, including some cooperatives and asso-
ciations. In the region of Puno, there are 11 exporting companies that distribute to either the
domestic market or the international market. The average export prices for the period 2007-
2016 in Peru are given in column 4 of table 6.1.
Constraints in this stage of the value chain are very similar to those described in the previ-
ous stage since this stage may include multi-stage covering actors. However, exporters also
may have to deal with a lack of diversification markets to export quinoa to, transportation dif-
ficulties, lack of certifications to be allowed to export to several countries, implications by the
government, limitations of importing countries etc. which are all external constraints.
5.2.5 Marketing
The marketing phase in the value chain as described by (Salcedo et al., 2013) involves exporters,
intermediaries (cfr. importers) and wholesalers or retailers who buy organic or conventional
quinoa from the processors. This is illustrated on figure 5.3, where it is clear that the ’Market-
ing’ stage partly overlaps ’exporters’ and totally overlaps ’intermediaries’, ’wholesalers/retailers’
and ’final consumption’. In most cases, as well in the case of the multi-stage actors described
below, the quinoa is distributed either domestically or internationally. In our case study, we fo-
cus on marketing for the foreign market, as we want to analyse the chain from introduction in
Peru to consumption in Belgium/Europe. Constraints that can occur in this stage of the value
chain comprise mostly external constraints: The absence or shortage of a market, the enormous
transportation costs that may have to be incurred when quinoa has to be transported overseas,
lack of capital, lack of competition may lead to oligopolies or monopolies, asymmetries in price
and information, several kinds of fees, inability to meet quality standards and certifications that
assure the standards, licenses that allow to sell the quinoa, wholesalers or retailers that are dif-
ficult to get to, distribution systems that are incomplete etc. Internal constraints can be the lack
of storage space or insufficient facilities.

CHAPTER 5. CHARACTERISTICS OF THE VALUE CHAIN OF QUINOA 66
Marketing for the Domestic Market
The domestic market consists merely of local markets in neighbouring villages of the small pro-
ducers. They go there on a weekly basis and sell their products to most often rural populations
who live in the small villages. Wholesalers that have close relationships with processors and
storage holders provide quinoa for regional, bigger markets and stores in or close to urban cen-
tres. (Salcedo et al., 2013) state that when the processing facilities are also located in an urban
centre, grain brokers can directly address processors to buy quinoa from them. Column 3 in
table 6.1 contains the Peruvian consumer price in $/kg for the period 2007-2016. This is the
average price people pay for average quinoa. The data until 2014 is obtained from (Hatch et al.,
2015) while for 2015 and 2016, an estimation was made based on the current consumer price in
Peru.
Marketing for the Foreign Market
According to (Salcedo et al., 2013), higher standards, not only of the way quinoa is presented,
but also regarding its uniformity and safety, must be met when quinoa is intended to be ex-
ported to markets outside of Peru. Therefore, organic quinoa is the type of quinoa that is most
used for export because it is certified and easily goes through specialized marketing channels
which have direct linkages with importers at the final destination. The exporters of Peru put
the quinoa in containers at the harbour in Lima, from where it is shipped towards Europe. Ex-
porters have an appropriate administrative structure and sufficient financial support available
to satisfy the relatively high standards implied by international trade agencies. Besides these,
some cooperatives of farmers and several associations also export to foreign markets. They
may be assisted by public institutions or NGO’s in order to guide them in the process of selling
quinoa to foreign markets. On the other end of the freight transport overseas are the (Euro-
pean) importers. These are normally medium or large companies located in the country or a
neighbouring country of the destination market. Examples of such companies responsible for
the import of quinoa from Peru and Bolivia and acting as intermediaries are Solid Food (an
organization working together with local farmers (see further) looking to import quinoa from
Peru, while also helping the local population, and selling to wholesalers/retailers in Europe),
DO-IT (Dutch Organic International Trade; can be regarded as a real trader of the quinoa prod-
uct) and Markal, a French company importing, packaging and distributing quinoa and other
foods. They make sure the quinoa gets transported from the importing quay to the wholesalers

CHAPTER 5. CHARACTERISTICS OF THE VALUE CHAIN OF QUINOA 67
and retailers, ready to be sold for final consumption. Solid Food, for example, delivers quinoa
to Bio-Planet where it is sold for €10-13/kg. Bio-Planet acts, just like other stores and super-
markets, as wholesaler/retailer in the value chain, purchasing the quinoa from the importers
and selling it to customers, who are the final consumers. Figure 5.3 on the one hand mentions
DO-IT, Markal and Solid Food as intermediaries, with the dark blue arrow indicating that they
also try to have an impact on the local population by establishing close relationships with lo-
cal farmers and processors. On the other hand, the figure describes Bio-Planet, Delhaize, Lidl,
Oxfam and Aldi as wholesalers and retailers being the next stage in the value chain and the last
step towards the final consumers. For the intermediary prices in the fifth column of table 6.1,
(Bio-Planet, nd) provided us with figures for a mediocre type of quinoa. Unfortunately, since
no data was available for the intermediary price before 2009, we made an estimation of these
prices and found that it lied between $3/kg and $4/kg. Therefore, we can state that margins that
will be calculated based on this price are an estimation of the reality and are mainly used to be
able to have an idea of the prevailing relationships and ratios.
5.2.6 Final Consumption
The final consumer is the one who buys the quinoa in supermarkets, in small shops, on the lo-
cal, provincial or regional markets, from exporters or on fairs. The price paid by the consumers
in countries like Belgium nowadays ranges from €8/kg for Aldi’s own label quinoa to €13/kg for
organic fair trade quinoa (Quitho by Solid: €12,90/kg for red quinoa) while the price consumers
in Peru pay ranges from $3-8/kg. This difference is mainly due to the extra transportation costs
incurred and the margin that intermediaries in importing countries are taking on quinoa. The
third column of table 6.1 includes the Peruvian consumer price of quinoa. Note that this differs
largely from region to region and from store to store. Therefore, for the years 2015 and 2016,
the average is calculated based on information from different stores in different regions. For
the years 2007-2014, we were able to gather this information from (Vinculos Agricolas, nd). The
last column in table 6.1 contains the data for the European consumer price in $/kg for the pe-
riod 2013-2016. These prices were provided by (Bio-Planet, nd). Although their database did
not allow to provide consumer prices before 2013, we estimated the consumer prices before
2013 and found that it fluctuated between $5/kg in 2007 and $7/kg in 2012.
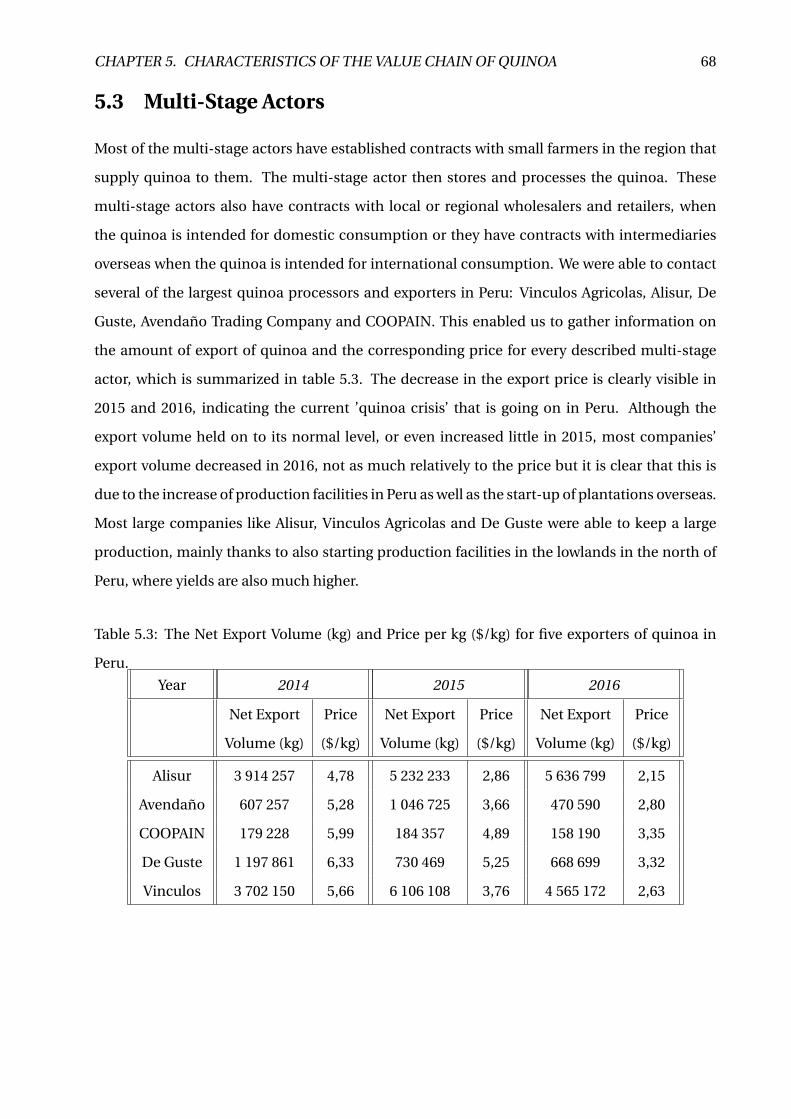
CHAPTER 5. CHARACTERISTICS OF THE VALUE CHAIN OF QUINOA 68
5.3 Multi-Stage Actors
Most of the multi-stage actors have established contracts with small farmers in the region that
supply quinoa to them. The multi-stage actor then stores and processes the quinoa. These
multi-stage actors also have contracts with local or regional wholesalers and retailers, when
the quinoa is intended for domestic consumption or they have contracts with intermediaries
overseas when the quinoa is intended for international consumption. We were able to contact
several of the largest quinoa processors and exporters in Peru: Vinculos Agricolas, Alisur, De
Guste, Avendaño Trading Company and COOPAIN. This enabled us to gather information on
the amount of export of quinoa and the corresponding price for every described multi-stage
actor, which is summarized in table 5.3. The decrease in the export price is clearly visible in
2015 and 2016, indicating the current ’quinoa crisis’ that is going on in Peru. Although the
export volume held on to its normal level, or even increased little in 2015, most companies’
export volume decreased in 2016, not as much relatively to the price but it is clear that this is
due to the increase of production facilities in Peru as well as the start-up of plantations overseas.
Most large companies like Alisur, Vinculos Agricolas and De Guste were able to keep a large
production, mainly thanks to also starting production facilities in the lowlands in the north of
Peru, where yields are also much higher.
Table 5.3: The Net Export Volume (kg) and Price per kg ($/kg) for five exporters of quinoa in
Peru.
Year 2014 2015 2016
Net Export
Volume (kg)
Price
($/kg)
Net Export
Volume (kg)
Price
($/kg)
Net Export
Volume (kg)
Price
($/kg)
Alisur 3 914 257 4,78 5 232 233 2,86 5 636 799 2,15
Avendaño 607 257 5,28 1 046 725 3,66 470 590 2,80
COOPAIN 179 228 5,99 184 357 4,89 158 190 3,35
De Guste 1 197 861 6,33 730 469 5,25 668 699 3,32
Vinculos 3 702 150 5,66 6 106 108 3,76 4 565 172 2,63
CHAPTER 5. CHARACTERISTICS OF THE VALUE CHAIN OF QUINOA 69
5.3.1 COOPAIN
An example of a multi-stage actor given by (Hatch et al., 2015) is the COOPAIN (Cooperativa
Agroindustrial Cabana Ltda). COOPAIN is located in Puno and has very close relationships
with small farmers in the region of Puno. Its network consists of more than 500 members who
grow an average of 1.7 ha of quinoa with an average yield of 3.5 ton/year. The producers sell
72% of their production to COOPAIN, use 25% for self-consumption and 3% is used as seed
the next year. 60% of what COOPAIN buys from producers is destined for direct exports, 30%
goes to companies in Lima for further processing and only 10% stays in the Cusco region or
goes to restaurants. We can state that COOPAIN mainly covers the processing phases as well as
the exporting phase. Thereby, it offers training, technical assistance and equipment to primary
producers. Important note with respect to exporting is that the cooperative possesses several
certifications that allow to export organic and Fair Trade quinoa to the United States, France,
Germany and the Netherlands. COOPAIN can be regarded as a small company, but compared to
other companies, the impact of the drop in prices is only slightly reflected in its export volume.
5.3.2 Vinculos Agricolas
As part of a larger company, Gandules, initially a pepper producer located in the north of Peru
which now collects and processes all kinds of crops, Vinculos Agricolas was able to get some
piece of land from Gandules to cultivate quinoa in the lowlands back in 2013. Vinculos Agri-
colas has also built a network with farmers but different from COOPAIN, Vinculos has con-
tracts with large landowners (thanks to the good relationships of Gandules with the landown-
ers). These landowners most likely have around 1 000 acres at their disposal and divide it in
many small lots of 20 acres that the small farmers can use to cultivate whatever they want.
Vinculos has contracts with these landowners to buy quinoa, which some of the small farmers
cultivate, from them. Vinculos currently has 1 500 ha of land available for the production of
quinoa in the north of Peru (Vinculos Agricolas, nd). Together with well-developed equipment,
a plant that is equipped with technology and a good-working relationship with landowners and
associations of small farmers, organic and conventional quinoa is made according to the high-
est global quality standards (Vinculos Agricolas is a BRC-certified plant). After processing, the
quinoa is then stored in its warehouse in Chiclayo, more than 700km away from Lima. Since
prices of quinoa were very high in 2013, the fact that it needed to be transported to Lima for
distribution afterwards did not pose any limits to the benefits of the company. When prices
CHAPTER 5. CHARACTERISTICS OF THE VALUE CHAIN OF QUINOA 70
started to decrease 2 years ago, the logistic and transportation costs were getting too high to be
able to still be profitable. By consequence, Vinculos is looking to move their plant to Lima in
order to reduce logistic and transportation costs and regain benefits, despite the lower price of
quinoa. After the quinoa is transported to Lima, it is exported to the domestic market or the
foreign market. In case of export to the foreign market, it ends up at intermediaries. These are
the ones who actually have the strongest impact on the price and therefore capture a significant
proportion of benefits away. From these intermediaries, it is then sold to wholesalers such as
Costco and retailers such as Lidl. Vinculos was het largest exporter of quinoa in 2015, but due to
the ’crisis’, it lost a significant part of its share to Alisur. However, Vinculos remained the second
largest exporter of quinoa in 2016.
5.3.3 De Guste Group SAC
De Guste Group acts as a processor and exporter located in Juliaca, a city in the region of Puno.
The quinoa is collected from the farmers in the highlands in Puno and brought to the city of Ju-
liaca to be processed. Being the owner of their own land and plant enables De Guste to manage
every element of their supply chain from seeding through harvesting, storage and processing
until the export (De Guste Group, nd). Each step in the process is said to be under strict control
to assure the quality standards for exporting to foreign markets. Compared to 2014, De Guste
had to deal with a decline of almost 50% in the export volume, despite staying one of the com-
panies with the highest selling price per kg, as can be seen in table 5.3. This illustrates the high
quality grain they provide, although it was at the expense of its export volume.
5.3.4 Avendaño Trading Company SAC
Avendaño Trading Company is another company that covers the processing and exporting stages.
By having plants both in Puno and Lima, it is well-suited to fulfil these activities cost-effectively.
Different from the above mentioned companies, Avendaño is said to be exporting mostly to
Southern American countries. This can be declared by the fact that Avendaño is still a young
and dynamic company and it might be difficult to already get all the certifications for exporting
towards the United States or Europe. 2015 was a very good year for Avendaño, which saw their
export almost double, but the general bad trend in the export of quinoa was also translated in
their figures in 2016.

CHAPTER 5. CHARACTERISTICS OF THE VALUE CHAIN OF QUINOA 71
5.3.5 Alisur SAC
Alisur is also a company whose main activities are the production and processing of vegetables
and grains for domestic and international markets (Alisur, nd). Indicated by itself, Alisur acts
as growers, wholesalers, distributors, importers and exporters in the value chain. To be able to
perform all these activities, Alisur has four facilities spread over the country: One in the north,
one in Lima, one in Ayacucho and one in Cusco. The proximity of the plants to the fields of
production allows Alisur to significantly reduce transportation and logistic costs. Their mission
is to become the most important exporter of quinoa, which they achieved in 2016. They get
a low price for the large volumes they export, especially with the recent drop of the price, as
indicated in table 5.3. When they are able to come up with some innovations and keep up the
current excellent work, they will continue to remain the largest and most important exporter of
quinoa in the future.
5.3.6 The Government
Although the government plays an important role for some organizations because it enables
them to get a significant amount of financing and more bargaining power towards other links in
the value chain, most processors and exporters have a direct connection with large landowners
and small farmers. Therefore, the government does not play any direct role in our case study.
Since the government influences actors by means of indirect actions, rules and regulations, it
can be classified under the indirect actors in the value chain of quinoa.
5.3.7 Solid International - Solid Food Peru/Europe
Solid International is a development organization created in 2000, with the purpose of transfer-
ring business knowledge and know-how to underprivileged people worldwide in order to help
improve their living conditions in a sustainable way (Solid Food, nd). They state that they make
use of a hybrid model where profits from commercial activities are used to finance local non-
profit and social projects. The objective is to achieve long-term financial autonomy, which is
why Solid has started multiple small- and large-scale projects. In 2004, Solid decided to focus
its efforts on Ayacucho, one of the poorest regions in Peru. In 2006, Solid Food Peru was estab-
lished there to accommodate the various local organizations, one of which became Solid Food
Peru. In collaboration with Solid Food Europe, Solid Food Peru sells organic Peruvian quinoa
CHAPTER 5. CHARACTERISTICS OF THE VALUE CHAIN OF QUINOA 72
on the European market under brand names from retailers, but also under their own label. With
the proceeds from this, Solid Food Peru provides training on agricultural and commercial issues
to many farmers and their families while at the same time, new investments can be made.
Solid Peru and Solid Europe can together be regarded as a multi-stage actor as well. On the one
hand, Solid Peru acts in Peru and performs multi-stage activities from interacting with farmers
to processing and export to foreign markets. Therefore, it is included as processors/exporters
in the producing country in figure 5.3. Solid Europe on the other hand, is responsible for all the
activities related to sales, i.e. it actually acts as a trader like DO-IT, except from the fact that it
buys from Solid Food Peru and not from other exporters in Peru. Solid Food Europe is depicted
on figure 5.3 as intermediary in the consuming country and their collaboration with Solid Food
Peru is shown by means of the double arrow that connects both. Solid Food Europe then im-
ports the quinoa into Europe and sells it in bulk or packaged to traders, catering- and food ser-
vices, wholesalers and retailers (e.g. Bio-Planet, Colruyt, Delhaize etc.). As mentioned before,
the overall goal of Solid is to help the population who is living in poor conditions in Ayacucho
(Peru). In this regard, it wants to have an impact on a socio-economic level and make sure the
local population can rely on their own income. The dark blue arrow on figure 5.3 illustrates the
impact Solid wants to have on local farmers. By providing assistance and guiding them in their
production process, Solid wants to help the local population as well as boost the production of
quinoa in that specific region. In this respect, it has close contacts and collaborates with small
local farmers and processors in the region of Ayacucho. One fourth of the profits generated by
Solid are used to build social projects for the population. Until last year, Solid bought quinoa
from the farmers to sell it to processors in Peru like Vinculos Agricolas and De Guste. How-
ever, Solid discovered it would benefit themselves and farmers more if they could immediately
export to Europe and sell to wholesalers and retailers there. This allows them to skip a stage
in the value chain and provide quinoa to wholesalers and retailers in Belgium/Europe at more
affordable prices while at the same time also generating more profits for the farmers and them-
selves. (Solid Food, nd) describes its own operations as follows: "Through a reliable and sound
local organization from the fields in Peru to the supermarkets in Europe, Solid is able to install
a durable, intensive and long-term collaboration with the small farmers.". We can conclude
that Solid thrives on their vertical integration, durable trade and traceability that allow them to
execute their activities in the best possible way (Solid Food, nd).
CHAPTER 5. CHARACTERISTICS OF THE VALUE CHAIN OF QUINOA 73
5.4 Indirect Actors
Indirect actors can be of different kinds, depending on the stage in the value chain they sup-
ply and the kind of service/product they provide. Those regarded as suppliers of inputs for
the production stage are the ones that deliver seeds, fertilizers, technical assistance and train-
ing, machinery for sowing and harvesting, climate information, financing for expanding their
production etc. Supplies for the processing and exporting phase mainly involve research and
technology, certification provisions and proposals, equipment and machinery for the different
processing steps, financing for extending the market potential and the facilities used for pro-
cessing. Another indirect actor already mentioned in a previous section is the government.
They all influence the value chain and its actors in an indirect manner by offering one or more
services throughout the whole chain. Since the list of such organizations is very long, they are
not included in our case study, nor in the value chain depicted in figure 5.3.
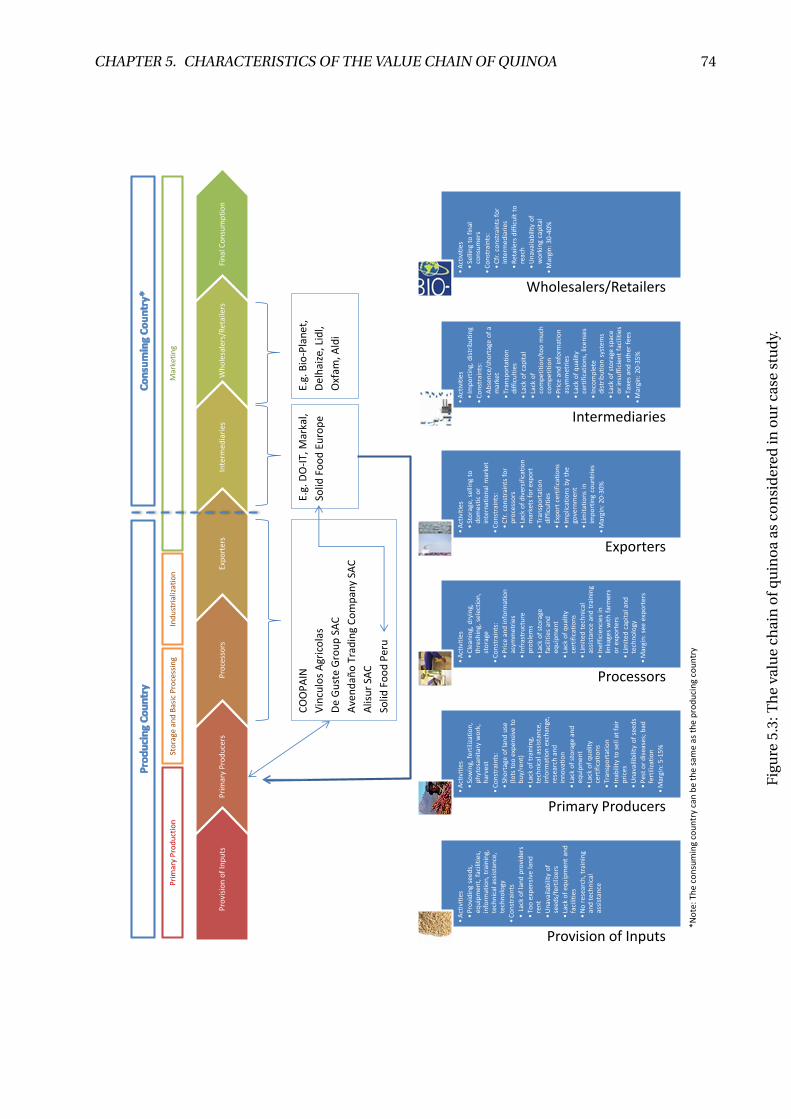
CHAPTER 5. CHARACTERISTICS OF THE VALUE CHAIN OF QUINOA 74
Provision of Inputs
•A
ctiv
itie
s
•P
rovi
din
g se
ed
s,
equ
ipm
ent,
fac
iliti
es,
info
rmat
ion
, tr
ain
ing,
te
chn
ical
ass
ista
nce
, te
chn
olo
gy
•C
on
stra
ints
• L
ack
of
lan
d p
rovi
der
s
•To
o e
xpen
sive
lan
d
ren
t
•U
nav
aila
bili
ty o
f se
ed
s/fe
rtili
zers
•La
ck o
f eq
uip
men
t an
d
faci
litie
s
•N
o r
esea
rch
, tra
inin
g an
d t
ech
nic
al
assi
stan
ce
Primary Producers
•A
ctiv
itie
s
•So
win
g, f
erti
lizat
ion
, p
hyt
osa
nit
ary
wo
rk,
har
vest
•C
on
stra
ints
:
•Sh
ort
age
of
lan
d u
se
(lo
ts t
oo
exp
ensi
ve t
o
bu
y/re
nt)
•La
ck o
f tr
ain
ing,
te
chn
ical
ass
ista
nce
, in
form
atio
n e
xch
ange
, re
sear
ch a
nd
in
no
vati
on
•La
ck o
f st
ora
ge a
nd
eq
uip
men
t
•La
ck o
f q
ual
ity
cert
ific
atio
ns
•Tr
ansp
ort
atio
n
•In
abili
ty t
o s
ell a
t fa
ir
pri
ces
•U
nav
ailib
ility
of
see
ds
•P
est
or
dis
ease
s; b
ad
fert
iliza
tio
n
•M
argi
n:
5-1
5%
Processors
•A
ctiv
itie
s
•C
lean
ing,
dry
ing,
th
resh
ing,
sel
ecti
on
, st
ora
ge
•C
on
stra
ints
:
•P
rice
an
d in
form
atio
n
asym
met
ries
•In
fras
tru
ctu
re
pro
ble
ms
•La
ck o
f st
ora
ge
faci
litie
s an
d
equ
ipm
ent
•La
ck o
f q
ual
ity
cert
ific
atio
ns
•Li
mit
ed t
ech
nic
al
assi
stan
ce a
nd
tra
inin
g
•In
effi
cien
cies
in
linka
ges
wit
h f
arm
ers
or
exp
ort
ers
•Li
mit
ed c
apit
al a
nd
te
chn
olo
gy
•M
argi
n:
see
exp
ort
ers
Exporters
•A
ctiv
itie
s
•St
ora
ge,
selli
ng
to
do
mes
tic
or
inte
rnat
ion
al m
arke
t
•C
on
stra
ints
:
•C
fr. c
on
stra
ints
fo
r p
roce
sso
rs
•La
ck o
f d
iver
sifi
cati
on
m
arke
ts f
or
exp
ort
•Tr
ansp
ort
atio
n
dif
ficu
ltie
s
•Ex
po
rt c
erti
fica
tio
ns
•Im
plic
atio
ns
by
the
gove
rnm
ent
•Li
mit
atio
ns
in
imp
ort
ing
cou
ntr
ies
•M
argi
n:
20-3
0%
Intermediaries
•A
ctiv
itie
s
•Im
po
rtin
g, d
istr
ibu
tin
g
•C
on
stra
ints
:
•A
bse
nce
/sh
ort
age
of
a m
arke
t
•Tr
ansp
ort
atio
n
dif
ficu
ltie
s
•La
ck o
f ca
pit
al
•La
ck o
f co
mp
etit
ion
/to
o m
uch
co
mp
etit
ion
•P
rice
an
d in
form
atio
n
asym
met
ries
•La
ck o
f q
ual
ity
cert
ific
atio
ns,
lice
nse
s
•In
com
ple
te
dis
trib
uti
on
sys
tem
s
•La
ck o
f st
ora
ge s
pac
e o
r in
suff
icie
nt
faci
litie
s
•Ta
xes
and
oth
er f
ees
•M
argi
n:
20-3
5%
Wholesalers/Retailers
•A
ctiv
itie
s
•Se
llin
g to
fin
al
con
sum
ers
•C
on
stra
ints
:
•C
fr. c
on
stra
ints
fo
r in
term
edia
ries
•R
etai
lers
dif
ficu
lt t
o
reac
h
•U
nav
aila
bili
ty o
f w
ork
ing
cap
ital
•M
argi
n:
30
-40
%
Pro
visi
on
of
Inp
uts
P
rim
ary
Pro
du
cers
P
roce
sso
rs
Exp
ort
ers
Inte
rmed
iari
es
Wh
ole
sale
rs/R
etai
lers
Fi
nal
Co
nsu
mp
tio
n
*No
te: T
he
con
sum
ing
cou
ntr
y ca
n b
e th
e sa
me
as t
he
pro
du
cin
g co
un
try
CO
OP
AIN
Vin
culo
s A
gric
ola
s
De
Gu
ste
Gro
up
SA
C
Ave
nd
año
Tra
din
g C
om
pan
y SA
C
Alis
ur
SAC
Solid
Fo
od
Per
u
E.g.
Bio
-Pla
net
,
Del
hai
ze, L
idl,
Oxf
am, A
ldi
E.g.
DO
-IT,
Mar
kal,
Solid
Fo
od
Eu
rop
e
Pri
mar
y P
rod
uct
ion
Sto
rage
an
d B
asic
Pro
cess
ing
Ind
ust
rial
izat
ion
M
arke
tin
g
Fig
ure
5.3:
Th
eva
lue
chai
no
fqu
ino
aas
con
sid
ered
ino
ur
case
stu
dy.
Chapter 6
Analysis of the Value Chain of Quinoa
6.1 Assessing the Value
6.1.1 Introduction
Since we did not have enough respondents to be able to fully assess the influence of each actor
in the value chain on the other actors, a qualitative assessment of the different stages was made
based on the activities performed and the corresponding constraints present in each stage. In
addition, a quantitative analysis of the different prices per stage was made to determine the
relationships and the power of the actors relative to each other in monetary terms based on the
marketing margin and the percentage of the total value created. As mentioned before, this is
mainly an estimation because it is based on averages and approximations.
6.1.2 Qualitative Analysis
Based on the activities performed by each stage and the constraints related to executing these
activities, a qualitative analysis can be carried out. This is similar to a SWOT-analysis where all
the strengths, weaknesses, opportunities and threats of the whole value chain are described.
The opportunities and threats for the future are also discussed later in section 6.2 ’Upgrading
the Value Chain of Quinoa’ as challenges and future possibilities. The main activities and con-
straints present in every step of the value chain are described in the bottom half of figure 5.3
and constitute the foundation and most important elements of the analysis.
75

CHAPTER 6. ANALYSIS OF THE VALUE CHAIN OF QUINOA 76
Strengths and Opportunities
Before addressing its weaknesses and threats, the strengths and opportunities of the quinoa
value chain are quickly mentioned:
1. Strengths related to the primary producers encompass the following:
(a) Obviously, the most prevalent strengths of the first stages of the value chain of quinoa
are, as described by (Hatch et al., 2015), its nutritional value and its suitability to dif-
ferent types of (even more or less infertile) soils and climates for harvest. On the
one hand, this is very advantageous for people from all parts of the world because in
principle, everybody can grow quinoa, no matter where and no matter in which cli-
mate they live. However, the yield will differ. On the other hand, this may cause the
producers, processors and exporters in Peru to lose their markets abroad and hav-
ing to cope with overproduction. The fact that they are momentarily even expanding
their plantations and production facilities confirms that they believe that quinoa ex-
port to foreign countries will continue to grow. The negative effect of losing markets
and overproduction, if it ever occurs, may then be even bigger.
(b) Quinoa’s multidimensionality (nutritional as well as medicinal and cosmetic pur-
pose), genetic variety and organic or ecological production are factors that boosted
the consumer perception over the years (Hatch et al., 2015).
(c) Furthermore, production costs for farmers are said to be around 50% of the average
national farm price, which is assumed to be quite low relative to other products’
production costs. This means that farmers can retain the other 50% as pure profits
for food and other basic needs.
According to (Hatch et al., 2015), these comprise the most important strengths of the pro-
ductive chain.
2. When considering the organizations that act as processors and exporters, we can state
that the remuneration these companies get is more or less pro rata their efforts to the
contribution of the created value of the final quinoa product. In this respect, exporters
can use their knowledge of the international market to adapt margins between the na-
tional and international prices in their own favour. According to (Fallis, 2013), this is the
CHAPTER 6. ANALYSIS OF THE VALUE CHAIN OF QUINOA 77
link in the value chain with the most possibilities and resources for adaptations and en-
hancements.
3. Finally, the intermediaries can be seen as the most powerful link in the value chain. As im-
porters, they have an enormous impact on the final consumption price of quinoa. Since
there are only a few companies importing and providing quinoa in the destination coun-
tries, they exercise an oligopoly and are able to ask very high prices.
When looking, as outsiders, at the linkages in the value chain, the value chain looks like a
smooth flow of products and services downstream and remunerations upstream. However, this
is not always the case. Therefore, the weaknesses and threats present in the value chain, as
opposed to the strengths and opportunities, are discussed below.
Weaknesses and Threats
There are a lot of weaknesses and deficiencies present in the current chain that badly influence
either the productivity and efficiency of the actors or the value that is delivered to the cus-
tomers. In general, deficiencies can be with regard to the price settings of the different actors,
the way actors fulfil their role, the structure of the value chain and the different activities and
operations performed in the value chain (i.e. harvesting, processing, export, distribution). The
main weaknesses present in the producer’s stage of the value chain are outlined below:
1. When investigating the producers, it is immediately clear that they may have to deal with
a lack of quality seeds to cultivate high quality crops that are conform the high export
standards. The lack of quality standards and certifications with respect to the seeds il-
lustrates that there is a shortage of bonding between actors of the same stage. Lonely
farmers are not able to arrange higher standards and certifications because they simply
do not have the power to do so. Grouping together would enable the organizations to
negotiate better quality standards and more certifications which would eliminate the low
yield production currently present in most of the regions of Peru.
2. To be able to increase quality and reach the standards and certifications, producers of
course need to be supported by a sufficient amount of technology and knowledge. How-
ever, most of the producers do not have the technology and the knowledge available to
boost their cultivation process.

CHAPTER 6. ANALYSIS OF THE VALUE CHAIN OF QUINOA 78
3. Another factor that thrives the deficiency in the chain is the fact that it rains quite often in
the highlands of Peru, fields are sometimes overrun with water and no irrigation systems
are present. An irrigation system that drains the redundant amount of water would be
very helpful. The large amounts of rain and sometimes very rough weather conditions
in the highlands cause the farmers to have a very low yield, obviously depending on how
generous the weathering was during the harvesting season.
4. On top of this, a lot of farmers do not legally possess or use land on which they are allowed
to cultivate quinoa. A cooperation with other farmers would bolster each farmer’s own
development and that of the industry, but until now, most farmers are not confident that
it will really benefit them.
5. Moreover, there is a lack of training and technical assistance which serves as guidance
for the producers and processors towards more efficient and effective production and
processing.
Taking the drawbacks into account, as described before, it is a very good thing for farmers to
unite in organizations such that their bargaining power increases towards other linkages in the
value chain. The farmers would be able to stimulate and help each other to set and reach higher
goals. Thereby, the government is willing to support such cooperation in order to promote and
brisk up the quinoa industry. However, the encouragement of the government and other orga-
nizations to cooperate and associate did not manage to convince the farmers and the ones that
already exist show only little commitment.
The lack of quality, certifications, technology, knowledge, training and technical assistance is
said to be due to the inability to generate finances, which is an indirect consequence of the un-
favourable socio-economic conditions producers still have to cope with on the one hand and
the heterogeneity of the actors in the value chain on the other hand. We would like to refer to ap-
pendix F for a broad description of the socio-economic circumstances of Peru relative to Bolivia
and Belgium. Although Peru’s socio-economic conditions have evolved positively over time,
there still are some misconceptions and limitations in the quinoa industry and value chain.
Furthermore, the heterogeneity of producers is portrayed by their different levels of resources,
access to markets, technological development, infrastructure etc. relative to each other. This
clearly influences the competitiveness and the power the producers are able to generate. Obvi-
CHAPTER 6. ANALYSIS OF THE VALUE CHAIN OF QUINOA 79
ously, it is related to the limited amount of time and money that is invested in research, devel-
opment and innovation. Again, these are aspects that could and can be achieved more easily
when producers and processors are associated and in a close relationship with each other. The
availability of much more resources thanks to the combination of several actors would raise the
ability to accomplish more investments in respective domains. All the factors described indi-
cate that most primary producers still have to cope with primitiveness with regard to technical
assistance, training, facilities, equipment, research, technology and knowledge on the one hand
and that they are reluctant towards cooperation and association on the other hand. This causes
farmers to remain in their existing position, given the fact that quinoa is actually a complemen-
tary product of their income (Fallis, 2013). They constitute that link in the chain that undergoes
the power and the will of other stage actors of the value chain: The bargaining power of the
primary producers is very small relatively to the other stages.
In addition to the limited bargaining power of the producers, price and information exchange
between actors and stages largely differs from region to region and from actor to actor. In-
sufficient technology, large distance between actors, bad infrastructure and poverty all restrict
actors to communicate with each other in an efficient manner. This can cause actors to lack
necessary information regarding their production and prices of quinoa. As a result, the insecu-
rity and negative unexpected circumstances come into play in this case. Predetermined prices
or quantities may differ at the moment of trade due to the above mentioned factors, leading
to dissatisfaction among the involved actors. Also, this may lead to exploitation of actors who
do not possess the technology, who are located in remote areas, who do not have sufficient
communication services etc. Often, large landowners, organizations that cover the processing
and exporting stage, and especially intermediaries in foreign countries are regarded as those
being able to exploit such a situation. They generally possess the necessary technology, have
the resources available for further development, are situated in metropolitan centres etc. Those
are all factors that contribute to their strong position in the value chain, at the expense of the
weakest link in the chain, namely the producers. We can state that the price and information
asymmetries between different stage actors in the value chain (cfr. described as constraints in
earlier sections) make the relationships in the value chain more fragile and difficult to maintain.
Concerning the subdivision of the consumer price, our investigation learned that exporters and
importers are the ones who increase the prices the most significantly and therefore reap the
CHAPTER 6. ANALYSIS OF THE VALUE CHAIN OF QUINOA 80
largest share of the total consumer price away compared to producers who only get a small
share of the final consumer price. This is further illustrated in section 6.1.3 ’Quantitative Anal-
ysis’.
We can conclude from the above that there are two very important weaknesses in the value
chain: The low bargaining power of the farmers on the one hand, which is related to the lack of
association between producers and the lack of financing opportunities present, and the large
share of the price that is taken away by the intermediaries in foreign countries relative to the
proportion of work and added value they put into the value chain of quinoa. Although it is
difficult to really assess the value and the relationships between the stage actors in monetary
terms, we tried to do so in the section below.
6.1.3 Quantitative Analysis
To be able to conduct a quantitative analysis that allows us to assess the impact the actors of
each stage have based on the share from the total consumer price the actor receives, we firstly
collected the prices of each stage and calculated the margins every stage was able to generate
over the years as well as the share of the total each stage receives. By considering the prices of
the different stages relative to each other, each actor’s function and impact in the whole value
chain can be distinguished more easily.
An important measure that we used for quantitatively assessing the impact is the marketing
margin, also called farm-retail price by (Agriculture and Consumer Protection, nd). A market-
ing margin as used in our case study can be defined as the difference between the buying cost
and the selling price in each stage, which is the actual gross marketing margin. Marketing costs
are not taken into account because we were not able to obtain these from different stage actors.
The gross marketing margin is equivalent to the difference between the selling price of stage y
and the selling price of stage y-1 because the selling price of the previous stage is the same as the
buying cost of the current stage. The gross marketing margin for the farmers for example is the
difference between the price at which they can sell the quinoa to the processors and the price
they have to pay for seeds, rent of equipment and land etc., relative to the final consumption
price. (Agriculture and Consumer Protection, nd) state that the longer the chain gets, the higher
the marketing costs will be and the lower the net marketing margin for each stage. Calculating
CHAPTER 6. ANALYSIS OF THE VALUE CHAIN OF QUINOA 81
the gross marketing margin for each stage will show the added value in terms of money, which
is actually a misrepresentation of the real value that is added but a good representation of the
unfairness present in the value chain due to the large margins taken by later-stage actors.
We obtained the farm prices, Peruvian consumer prices and export prices from an aggregation
of data from (Fallis, 2013), (Vinculos Agricolas, nd) and (Hatch et al., 2015) and the intermedi-
ary and European consumer prices from (Bio-Planet, nd) for the period 2007-2016. A list of the
prices is given in table 6.1. We can immediately observe from table 6.1 that the farm price has
always remained very low relatively to the consumer and export price. We assumed that pro-
cessing and exporting are performed by one and the same company. Therefore, both stages are
considered together and have one selling price, which is the export price. The corresponding
gross marketing margins are calculated based on this export price. As mentioned in the respec-
tive sections, price estimations were made for the intermediary price before 2009 and for the
European consumer price before 2013. Furthermore, since we were not able to get the specific
marketing costs of the farmers, we assumed the costs for the farmers to be 50% on average, as
mentioned before. The expectations about the margins are that when the quinoa is exported
to foreign countries, later stage actors like intermediaries and wholesalers/retailers will be the
ones with the highest margins. An appropriate and fair compensation for every stage actor
would be something around 20% when the chain consists of 5 stages. Note that everything is
expressed in $/kg because this is the standard used by Peruvian companies. Besides this, we
also have to take into account that the discussed data is based on averages and estimations.
Therefore, the margins are approximations used to illustrate the current relationships in the
value chain and get a global view of the bottlenecks in the chain. We can define the formula for
the margin and its parameters as follows:
GM My = (Py −Py−1)/Pc
GM My Gross Marketing Margin stage y ($/kg)
Py Price stage y ($/kg)
Py−1 Price stage y-1 ($/kg)
Pc Final Consumer Price ($/kg)
This formula and the prices in table 6.1 allow to calculate the gross marketing margins, which
are given in table 6.2. Figure 6.1 depicts the margins for the different stages but only considers
the data from 2013 until 2016 because this is the most representative for the current relation-

CHAPTER 6. ANALYSIS OF THE VALUE CHAIN OF QUINOA 82
ships. Table 6.2 and figure 6.1 clearly show that the farmers get the smallest percentage of the
total consumer price. The margin for the farmers over the past years lies between 5% and 15%
in the worst case scenario and the best case scenario respectively. We can see that their margin
was higher when the production of quinoa was really booming on foreign markets, i.e. from
2011-2014. The sharp drop in the farm and export prices in 2015 resulted in very small margins
for the farmers, causing those who are really dependent on quinoa to get into a precarious sit-
uation. This is conform our expectations. In addition, processors and exporters seem to have a
remuneration pro rata their added value to the product. Their margin ranges between 20% and
30% with some outliers like the 10% in 2016. This outlier shows the loss of a significant amount
of profits to the intermediaries in 2016, which is mainly due to the steep drop of the export price
during that year. The main cause of the decline of those prices in 2016 is the overproduction
and the fact that a lot of projects to cultivate quinoa are starting up in foreign countries, which
leads to consumers in foreign countries preferring to buy the local ’cheaper’ quinoa above the
imported ’more expensive’ organic or Fair Trade quinoa from Peru. It causes Peru to lose mar-
kets and forces it to lower its prices which in turn results in the loss of income for exporters,
processors and farmers. This can also be regarded as one of the biggest threats for the future of
the quinoa industry in Peru.
The largest part seems to be taken away by wholesalers and retailers, although intermediaries’
percentage is again increasing in the last couple of years, approaching the percentage of the
wholesalers and retailers. The margin for the intermediaries generally lies between 20% and
30% but increased to above 30% in 2015 and 2016. This indicates the large proportion interme-
diaries are realizing on the final price. Table 6.2 displays the range of the wholesalers/retailers,
which is even larger than that of the intermediaries and amounts to 30% to 40% and even 43%
in 2016. When looking at the Peruvian consumer price and comparing it with the export price,
we can observe that both prices fluctuate around each other. Most of the time, the average
Peruvian consumer price was the highest. Given the fact that the export price may be a refer-
ence for companies to set their price and the fact that the export price may also refer to export
to other regions in Peru, it is obvious that the Peruvian consumer price is slightly higher than
the export price. However, especially in 2013, the export price was higher than the Peruvian
consumer price, mainly due to the enormous demand from foreign markets which caused the
export price to increase. This led to Peruvians being encouraged to export and use their income
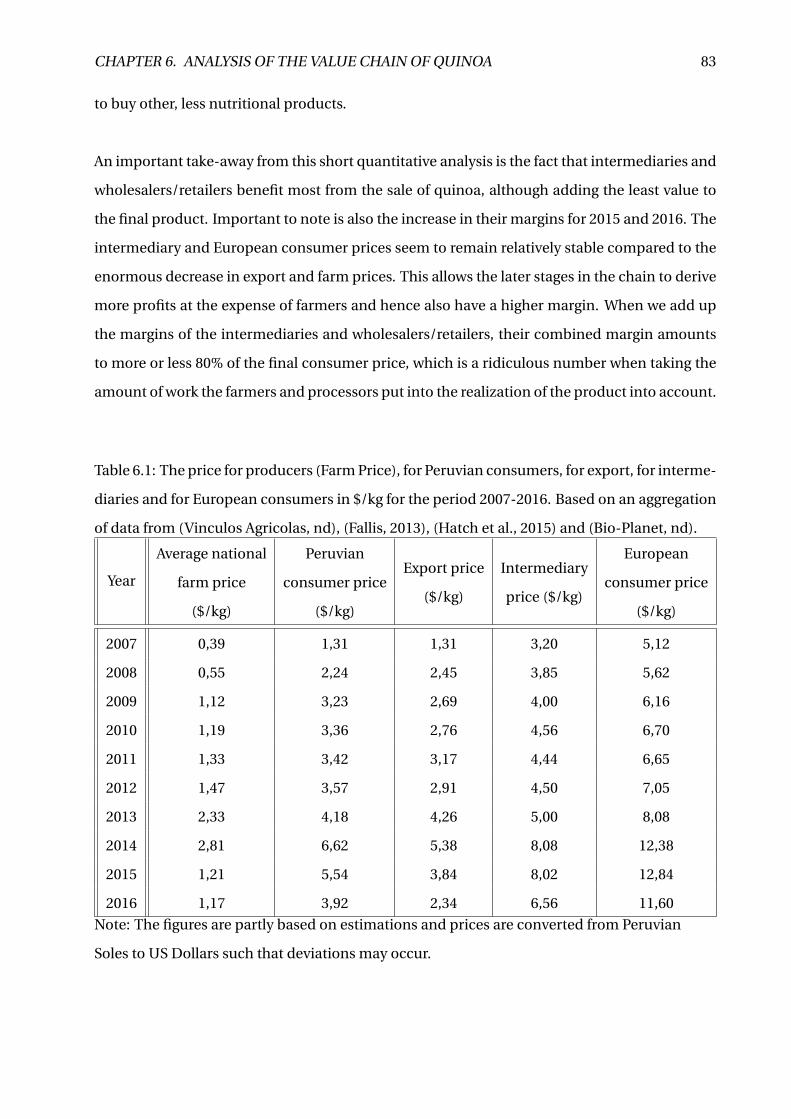
CHAPTER 6. ANALYSIS OF THE VALUE CHAIN OF QUINOA 83
to buy other, less nutritional products.
An important take-away from this short quantitative analysis is the fact that intermediaries and
wholesalers/retailers benefit most from the sale of quinoa, although adding the least value to
the final product. Important to note is also the increase in their margins for 2015 and 2016. The
intermediary and European consumer prices seem to remain relatively stable compared to the
enormous decrease in export and farm prices. This allows the later stages in the chain to derive
more profits at the expense of farmers and hence also have a higher margin. When we add up
the margins of the intermediaries and wholesalers/retailers, their combined margin amounts
to more or less 80% of the final consumer price, which is a ridiculous number when taking the
amount of work the farmers and processors put into the realization of the product into account.
Table 6.1: The price for producers (Farm Price), for Peruvian consumers, for export, for interme-
diaries and for European consumers in $/kg for the period 2007-2016. Based on an aggregation
of data from (Vinculos Agricolas, nd), (Fallis, 2013), (Hatch et al., 2015) and (Bio-Planet, nd).
Year
Average national
farm price
($/kg)
Peruvian
consumer price
($/kg)
Export price
($/kg)
Intermediary
price ($/kg)
European
consumer price
($/kg)
2007 0,39 1,31 1,31 3,20 5,12
2008 0,55 2,24 2,45 3,85 5,62
2009 1,12 3,23 2,69 4,00 6,16
2010 1,19 3,36 2,76 4,56 6,70
2011 1,33 3,42 3,17 4,44 6,65
2012 1,47 3,57 2,91 4,50 7,05
2013 2,33 4,18 4,26 5,00 8,08
2014 2,81 6,62 5,38 8,08 12,38
2015 1,21 5,54 3,84 8,02 12,84
2016 1,17 3,92 2,34 6,56 11,60
Note: The figures are partly based on estimations and prices are converted from Peruvian
Soles to US Dollars such that deviations may occur.

CHAPTER 6. ANALYSIS OF THE VALUE CHAIN OF QUINOA 84
Table 6.2: Margins for farmers, processors/exporters, intermediaries and wholesalers/retailers
in % for the period 2007-2016.
Year
Gross Marketing
Margin farmers
(%)
Gross Marketing
Margin processors/
exporters (%)
Gross Marketing
Margin
intermediaries (%)
Gross Marketing
Margin wholesalers/
retailers (%)
2007 3,81 17,97 36,91 37,50
2008 4,89 33,81 24,91 31,49
2009 9,09 25,49 21,27 35,06
2010 8,88 23,43 26,87 31,94
2011 10,00 27,67 19,10 33,23
2012 10,43 20,43 22,55 36,17
2013 14,42 23,89 9,16 38,12
2014 11,35 20,76 21,81 34,73
2015 4,71 20,48 32,55 37,54
2016 5,04 10,09 36,38 43,45
Figure 6.1: Gross Marketing Margins (in %) for the different stages in the value chain for the
period 2013-2016.

CHAPTER 6. ANALYSIS OF THE VALUE CHAIN OF QUINOA 85
6.2 Upgrading the Value Chain of Quinoa
6.2.1 Introduction
Since more and more projects for cultivating quinoa are starting up in importing countries (Eu-
rope, USA, Canada), the external demand (from outside Peru) is diminishing. This leads to an
overproduction which in turn leads to a decrease in the price which negatively influences the
whole value chain but mainly the farmers, since their share of the final consumption price is
then even lower. Anyway, people are convinced that quinoa will again live up to its full potential
in the coming years as demand will continue to grow, maybe having new regions to export to.
Prices are expected to remain quite low, like they are right now. To fulfil this growing expected
demand, the current cultivation and production methods of quinoa and thus the productivity
(yield per hectare) will need to be revamped. When they will be able to upgrade and improve
the installed processes, small farmers will also get to experience the benefits of more efficient
processes and their margins and corresponding profits will increase. Another possibility for
farmers to increase their profits may lie in the association of the farmers into one larger organi-
zation. The unification of farmers into one large association would guarantee a larger influence
of the stage of the primary producers on the other stages which would see their margins and
thus their profits rise. Therefore, in this section we focus on upgrading the value chain in terms
of an enhanced distribution of the final consumer price to whom it belongs.
6.2.2 Improvement Guidelines
An enumeration of guidelines for improving the current situation of the stages involving pro-
cessors and exporters, based on recommendations by (Salcedo et al., 2013), is outlined below:
1. Support from public institutions and the government is essential for the formation of co-
operatives and associations to become more attractive for local farmers. By providing
assistance, associations can get really involved in the primary production and storage
and basic processing steps in the value chain that are needed before the industrialization
step. This would enhance the position of the small farmers in the value chain.
2. A second option is to introduce programs that focus on productivity and improving the
farmers’ position towards the processors such that they can exert more influence on the
processors and increase their own benefits.
CHAPTER 6. ANALYSIS OF THE VALUE CHAIN OF QUINOA 86
3. Thirdly, programs implemented by the government that can help increasing the domestic
consumption of quinoa should be closely related to certain mechanisms of direct public
purchase from cooperatives and associations. In this regard, several steps in the value
chain are skipped and the length of the marketing part of the chain is reduced.
4. Furthermore, research has to be done on quinoa cultivation projects that are starting up
in other parts of the world. This will allow Peru and Bolivia to have a better image of
the worldwide production such that they can respond by looking for new production ap-
proaches or adopt the (better) techniques present in other countries.
5. Last but not least, further investigation with respect to the value chain and the optimiza-
tion of harvesting and other activities is required to be able to address the institutional
and governmental requirements and the implementation of standards etc. that are nec-
essary for export to Europe and the US.
If actors are able to execute the guidelines effectively and continuously look for innovations to
improve the situation that is prevailing at that moment, the quinoa industry in Peru will be able
to thrive for much more years. In this respect, there are several challenges that are in line with
these guidelines and which the value chain may entail, as described in what follows.
6.2.3 Challenges
If the goal really is to target small farmers and enhance their position in the value chain as well
as reduce the enormous margins of the later-stage actors, specific and convenient standards
and arrangements will be necessary in order to unite the farmers and re-boost the demand for
quinoa. According to our insights derived from investigating the value chain and research done
by (Salcedo et al., 2013), several challenges or possible gateways can be identified:
1. Productivity enhancement and incorporation of innovations in quality and management
of the product. This also involves encouraging actors to make use of technical assistance,
training and technological transfer programs (Salcedo et al., 2013).
2. Higher levels of standardization and uniformity should be admired. This can be done by
ameliorating research systems and allowing the government to settle more certifications.
Very important in this respect is that the value of the product may not decrease.

CHAPTER 6. ANALYSIS OF THE VALUE CHAIN OF QUINOA 87
3. Stimulating farmers to unite in associations in order to induce scale effects of operations
covering the whole value chain of quinoa. By uniting themselves in associations, their
power relatively towards other actors in the chain will increase and will enable them to
generate a larger net margin. (Documento conjunto ALADI - FAO, 2014) confirms this by
stating that "it is advisable for producers to perform associative activities because it helps
to reduce the number of processors present in the value chain which in turn causes a
decrease in transaction costs and enables access to a greater proportion of the value that
is generated along the chain".
4. Minimizing losses in the basic processing and storage step of the chain by enhancing the
facilities (drying, threshing, saponin removal). If associations of farmers also covered the
storage and processing step, they would be able to exert greater bargaining power in their
relationship with the other links in the value chain (Salcedo et al., 2013). This may result
in significant advantages for small farmers that are part of such an association.
5. Looking for innovations with regard to the use of quinoa in order to be able to increase
supply without the risk of overproduction. This also involves research for entering new
markets and responding appropriately to fulfil new types of market demand.
6. Strengthen the awareness and knowledge of the product on new international markets
besides the ones where export is already directed to by advertising and putting the em-
phasis on nutritional characteristics and ethical and cultural values.
7. Aligning supply and demand with respect to the price by monitoring domestic and inter-
national markets.
8. Reassuring the in recent years declined domestic consumption of quinoa by installing
and maintaining public procedures and social programs (e.g. incorporating quinoa in
catering services of companies, schools, hospitals, municipalities etc.).
9. By promoting quinoa in other southern American countries where it has not yet been
developed or in other new regions that are capable of developing the crop, the demand
for quinoa can be stimulated enormously. For this, cooperation and coordination mech-
anisms will be necessary between Peru and the involved countries of the newly tapped
regions. In this regard, (Documento conjunto ALADI - FAO, 2014) states that synergies
and associations that enhance this process may be established.

CHAPTER 6. ANALYSIS OF THE VALUE CHAIN OF QUINOA 88
(Salcedo et al., 2013) state that an implementation of such policies and procedures would cer-
tainly require participation of and interaction between the various actors in the value chain.
Furthermore, a profitable and ethically efficient quinoa production is dependent on consis-
tency over time in order to be of any influence. Lastly, it is important that researchers and
participators of the value chain are aware whether their are deficiencies and weaknesses and
where they are situated in the chain such that they can prevent worse cases and take action to
strengthen the chain when necessary.
6.2.4 Future Possibilities
Since the growth in regional quinoa production in Peru and Bolivia was mainly a consequence
of the growing external demand from Europe, the United States and Canada, the new projects
being developed not only pose a barrier because less quinoa will be exported at lower prices,
they are also an opportunity for current farmers, processors and exporters in Peru to optimize
their processes in order to increase productivity and efficiency. By increasing their productivity
and efficiency by means of seed quality, product management, training, technical assistance
and technology, actors will manage to decrease the costs for producing and processing quinoa,
again leading to higher benefits. According to (Documento conjunto ALADI - FAO, 2014), the
product has passed its phase of international market penetration and is now in a more mature
stage where demand is mitigated. This could be the perfect moment to try quinoa for different
purposes on different markets. Research that investigates the multiple possible new markets
in depth is necessary in this regard. First of all, quinoa has enormous opportunities with re-
gard to its nutritional value because it can be used for multiple diets and other preparation-
and consumption-related activities. (Documento conjunto ALADI - FAO, 2014) elaborate that
quinoa can not only be used for nutritional purposes, but also for medicinal, chemical and
pharmaceutical and cosmetic purposes. In the medicinal and pharmaceutical industry, it can
be of significant influence for people suffering from diabetes thanks to a high fiber content and
easily digestible carbohydrates and it can also be of influence for people suffering from dis-
orders due to celiac disease mainly thanks to its high amount of vitamin content, mineral salts
and magnesium (Thompson, 2011) and (Zeballos et al., 2012)(as cited by (Documento conjunto
ALADI - FAO, 2014)). According to (Documento conjunto ALADI - FAO, 2014), the establish-
ment on international markets and the expansion of the quinoa production caused its multi-
functionality to catch the eye of researchers. It is now a matter of time to expand the research
CHAPTER 6. ANALYSIS OF THE VALUE CHAIN OF QUINOA 89
on its multi-functionalities and come up with innovations that will help the quinoa production
and price relive to its full potential. If people are able to do so, a large prospective new market
will come to life. From the moment it will get more integrated in these sectors, the probability
that demand will grow yet again is considerable. Thereby, as mentioned in the previous section
in point 3, uniting in associations can be very beneficial for producers and this will only benefit
the whole value chain. In this regard, (Documento conjunto ALADI - FAO, 2014) adds that "sup-
port policies are required to aid producers’ organizations to have better processing facilities and
equipment. By consequence, their trading conditions would be enhanced with the other stages
in the value chain", allowing them to exert more bargaining power. These support policies are
mainly public policies with norms, strategies and institutional actions such as investments that
are expected and required to exert a significant impact on the quinoa industry by contributing
to its development.
Another possibility for future development includes the strategy that was introduced by Solid
Food and also partly by COOPAIN. As mentioned in section 5.3.7 and 5.3.1, they did a take-over
of multiple activities (i.e. processing and exporting in the producing country and importing
into the consuming country in the case of Solid and the activities performed in the produc-
ing country in the case of COOPAIN) and established close relationships with local farmers in
order to provide them guidance and management for their production (e.g. organic and Fair
Trade). Furthermore, they stimulate farmers to unite in associations, provide technical assis-
tance, training and certifications for producers and they invest in research, knowledge and fu-
ture projects on a regular basis. Investment in research and knowledge, by means of involving
educational institutions etc., is something that they need to keep doing and improve in order to
remain successful and really have an influence on the long-term. By taking over the processing
and exporting steps in the value chain, they act as intermediate station between the farmers
and the wholesalers/retailers in the destination markets. It allowed both companies to increase
their own profits while at the same time increasing the benefits for local farmers, both socially
and economically, with whom they have contracts. This shows that the function that Solid and
COOPAIN fulfil in the value chain really has a twofold impact and should stimulate other people
and companies to follow their footsteps: Improving their own operations while simultaneously
improving those of others who live in uncertain conditions, resulting in more benefits for all the
parties involved.


Chapter 7
Conclusion
First of all, the available literature on the quinoa industry together with our investigation al-
lowed us to observe trends in the prosperity of Peru, its quinoa production and prices and its
ability to depend on quinoa as driving force for their future development. Although the grow-
ing demand on international markets was considered to be the main factor driving the devel-
opment of quinoa production until 2014 according to (Salcedo et al., 2013), the industry had to
cope with noticeable setbacks in price as well as in production. The quinoa price and produc-
tion quantity have witnessed enormous peaks in the last decade, followed by the recent drop in
price and a significant amount of overproduction. The boom of the quinoa industry has been
the basis of the income of most of the farmers in Peru. In this respect, we can say that the recent
’crisis’ caused farmers to lose a large part of their income, both in absolute values and relative
to actors of other stages.
Secondly, our research resulted in the identification of the different stages and corresponding
actors of the value chain of quinoa. When researching the value chain and looking for deficien-
cies and weaknesses, it became clear that primary producers can be seen as the weakest link in
the value chain. The fact that the margins intermediaries in foreign export countries are getting
have increased relatively while the prices have dropped, allows to assert that they are taking the
benefits away from the farmers. Our qualitative analysis further examined this aspect in detail
and came to the conclusion that the two biggest issues the value chain has to cope with include
the low bargaining power of the farmers, related to the lack of association between the farmers
and the lack of financing available, on the one hand and the large share of the price that is taken
away by later-stage actors in the foreign destination markets on the other hand. This has been
91

CHAPTER 7. CONCLUSION 92
confirmed in our illustrative quantitative analysis.
Furthermore, we can declare that the quinoa peak is over now and that prices are expected to
remain quite stable in the coming years. If producers are able to enhance their power in the
value chain by means of organizing in associations and producing for other than only nutri-
tional purposes, we believe that the production will be able to remain stable or can even grow
again. Since it is known that quinoa is a multi-functional product of which the real potential is
still to be discovered, significant research, knowledge, training and assistance on the following
aspects will be fundamental for future success: New nutritional and health aspirations, quinoa
in the medicinal, chemical and pharmaceutical industry, cosmetic properties of quinoa and the
introduction of quinoa in new diets, catering services of schools, hospitals etc. but also the abil-
ity to obtain certifications and quality standards will be key if Peru will want to keep thriving on
the quinoa industry for many more years.
Finally, to be able to carry out research and innovation for further development of the quinoa
industry, support from public policies and international organizations will be necessary. They
should focus on enhancing the bargaining power of small producers by encouraging them to as-
sociate, provide them with sufficient facilities, equipment, technology and other infrastructure
such that they are able to protect themselves against poverty. Otherwise, there is the risk that
the economic prosperity and benefits of high quinoa prices may never reimburse small produc-
ers appropriately. On top of this, they should also aim to stimulate demand by promoting the
multi-functionality of quinoa in other parts of the world. All the above mentioned aspects will
also help to reduce the large margins taken away by later-stage actors and thus result in a more
stable value chain. Based on all our investigations, we are convinced that the quinoa industry
still has a bright future ahead and will continue to be the basis of prosperity for Peru for many
more years.
Bibliography
Agrawal, R. C. and Heady, E. O. (1968). Applications of Game Theory Models in Agriculture.
Agriculture and Consumer Protection (n.d.). Agricultural and food marketing management. Re-
trieved April 20, 2017, from http://www.fao.org/docrep/004/W3240E/W3240E12.htm.
Alisur (n.d.). Alisur. Retrieved April 15, 2017, from http://www.alisur.net/index.php.
Bacon, C. M., Méndez, V. E., and Fox, J. A. (2008). Cultivating sustainable coffee: persistent para-
doxes. Confronting the Coffee Crisis: Fair Trade, Sustainable Livelihoods and Ecosystems in
Mexico and Central America. MIT Press, Cambridge, MA, pages 337–372.
Barraclough, S. and Utting, P. (1987). Food Security Trends and Prospects in Latin America.
10(August).
Barrientos, S., Gereffi, G., and Rossi, A. (2011). Economic and social upgrading in global pro-
duction networks: A new paradigm for a changing world. International Labour Review,
150(3-4):319–340.
Bio-Planet (n.d.). Bio-Planet.
Bioversity International (2007). Annual Report 2006.
Birbuet, J. C. and Machicado, C. G. (2008). Technologycal Progress in the Quinoa Sector.
(November):1–24.
Bosque, H. (2008). Diagnotico en tierras altas de bolivia, el marco de la temática de la “recu-
peración de suelos y sistemas tradicionales de producción” en tierras comunitarieas de
origen. Viceministerio de Tierras, La Paz.
Buenrostro, E., Stezano, F., Casalet, M., Oliver, R., Abelanda, L., et al. (2011). Evolución y com-
plejidad en el desarrollo de encadenamientos productivos en méxico: los desafíos de la
93

BIBLIOGRAPHY 94
construcción del cluster aeroespacial en querétaro. Technical report, Naciones Unidas
Comisión Económica para América Latina y el Caribe (CEPAL).
CBI - Centre for the Promotion of Imports from developing countries (n.d.). Exporting Quinoa
to Europe. Retrieved April 10, 2017, from https://www.cbi.eu/market-information/
grains-pulses/quinoa-grains/europe/.
Cenagro, T. (2012). Censo Nacional Agropecuario. Boletín02, MINAGRI.
Censos nacionales de población y de vivienda (2008). Sociodemográfico del Perú, Perfil.
Chopra, S. and Meindl, P. (2016). Supply Chain Management: Strategy, Planning and Operation.
Composition, W. and James, L. E. A. (2009). Chapter 1 - Quinoa (Chenopodium quinoa Willd.):
Composition, Chemistry, Nutritional, and Functional Properties, volume 58. Elsevier Inc.,
1 edition.
Daviron, B. and Ponte, S. (2005). The coffee paradox: Global markets, commodity trade and the
elusive promise of development. Zed books.
De Guste Group (n.d.). De guste: The company. Retrieved April 14, 2017, from http:
//deguste.com.pe/en/our-company/about-us/.
Dixit, D. (2014). Agricultural Value Chains and Food Security. Journal of World Trade, 48(5):967–
81.
Documento conjunto ALADI - FAO (2014). Tendencias y Perspectivas del Comercio Internacional
de Quinua. Santiago.
Donovan, J., Franzel, S., Cunha, M., Gyau, A., and Mithöfer, D. (2015). Guides for value chain
development: A comparative review. Journal of Agribusiness in Developing and Emerging
Economies, 5(1):2–23.
Dreibus, T. (2016). Quinoa Rides the ’Superfoods’ Wave. Re-
trieved March 16, 2016, from http://www.wsj.com/articles/
quinoa-rides-the-superfoods-gluten-free-waves-1404926555.
European Commission (n.d.). Market access database. Retrieved April 10, 2017, from http:
//madb.europa.eu/madb/statistical_form.htm.

BIBLIOGRAPHY 95
Fallis, A. (2013). Anális de la Cadena de Valor en el Sector de la Quinua en Perú, volume 53.
Journal of Chemical Information and Modeling.
FAO, I., IMF, O., and UNCTAD, W. (2011). the world bank, the wto, ifpri and the un hltf (2011).
Price Volatility in Food and Agricultural Markets: Policy Responses. Rome, FAO.
Fernandez-Stark, K., Bamber, P., and Gereffi, G. (2012). Upgrading in global value chains: Ad-
dressing the skills challenge in developing countries. Background Paper. Paris: OECD.
Frederick, S. E. (2010). Development and application of a value chain research approach to
understand and evaluate internal and external factors and relationships affecting economic
competitiveness in the textile value chain. North Carolina State University.
Gereffi, G. et al. (1999). A commodity chains framework for analyzing global industries. Institute
of Development Studies, 8(12):1–9.
Gereffi, G. and Fernandez-Stark, K. (2016). Global value chain analysis: a primer.
Gereffi, G., Fernandez-Stark, K., and Psilos, P. (2011). Skills for upgrading: Workforce develop-
ment and global value chains in developing countries. Duke University: Center on Global-
ization, Governance and Competitiveness (Duke CGGC), RTI International.
Gereffi, G. and Korzeniewicz, M. (1994). Commodity chains and global capitalism. Number 149.
ABC-CLIO.
Gilbert, C. L. (2008). Value chain analysis and market power in commodity processing with
application to the cocoa and coffee sectors. Commodity market review, 2007:5.
Giuliani, E., Pietrobelli, C., and Rabellotti, R. (2005). Upgrading in global value chains: lessons
from latin american clusters. World development, 33(4):549–573.
Hatch, D. N., M Vila, F., Núñez, M., Vila, F., Risi, J. R., W Pacheco, M., Rojas, W., Pacheco, M.,
Anzola, E., Buainain, A., et al. (2015). El mercado y la producción de quinua en el perú.
Technical report, IICA, Lima (Perú).
Hawkes, C. and Ruel, M. T. (2012). Reshaping Agriculture for Nutrition and Health.
Hernandez, R. A., Martinez-Piva, J. M., and Mulder, N. (2013). Global Value Chains and World
Trade: Prospects and challenges for Latin America, volume 1.
BIBLIOGRAPHY 96
Humphrey, J. and Navas-Alemán, L. (2010). Value chains, donor interventions and poverty re-
duction: A review of donor practice. IDS Research Reports, 2010(63):1–106.
IDEPRO (2012). Vision, mision y valores. Retrieved November 20, 2016 from http://www.
idepro.org/vision.asp.
Jacobsen, S.-E. (2003). The worldwide potential for quinoa (chenopodium quinoa willd.). Food
reviews international, 19(1-2):167–177.
Jacobsen, S. E. (2011). The Situation for Quinoa and Its Production in Southern Bolivia: From
Economic Success to Environmental Disaster. Journal of Agronomy and Crop Science,
197(5):390–399.
Janvry, A. D. and Sadoulet, E. (2000). Rural poverty in Latin America Determinants and exit
paths. 25:389–409.
Kaplinsky, R. and Morris, M. (2002). A Handbook for Value Chain Research. (September).
Kilian, B., Jones, C., Pratt, L., and Villalobos, A. (2006). Is sustainable agriculture a viable strategy
to improve farm income in central america? a case study on coffee. Journal of Business
Research, 59(3):322–330.
Mazur, R., Musoke, H. K., Nakimbugwe, D., and Ugen, M. (2011). Enhancing nutritional value
and marketability of beans through research and strengthening key value-chain. 2020 con-
ference note 1.
McCalla, A. F. (2009). World food prices: Causes and consequences. Canadian Journal of Agri-
cultural Economics/Revue canadienne d’agroeconomie, 57(1):23–34.
Mendoza, R. and Bastiaensen, J. (2003). Fair trade and the coffee crisis in the nicaraguan
segovias. Small Enterprise Development, 14(2):36–46.
Meyer-Stamer, J. and Waltring, F. (2006). Value chain analysis and ‘making markets work for the
poor’(m4p): Poverty reduction through value chain promotion. Eschborn, German Agency
for Technical Cooperation (GTZ).
Ministerio de Agricultura y Riego (2014).
BIBLIOGRAPHY 97
Parker-gibson, N. (2016). Quinoa : Catalyst or Catastrophe ? Commodity of the Quarter.
6505(February).
Ponte, S. and Gibbon, P. (2005). Quality standards, conventions and the governance of global
value chains. Economy and society, 34(1):1–31.
Ruiz, K. B., Biondi, S., Oses, R., Acuna-Rodriguez, I. S., Antognoni, F., Martinez-Mosqueira, E. A.,
Coulibaly, A., Canahua-Murillo, A., Pinto, M., Zurita-Silva, A., Bazile, D., Jacobsen, S., and
Molina-Montenegro, M. A. (2014). Quinoa biodiversity and sustainability for food security
under climate change: A review. Agronomy for Sustainable Development, 34(2):349–359.
Salcedo, S., Furche, C., Ekaterina, K., Rabczuk, P., Jara, B., Fernández, D., and Correa, F. (2013).
International Quinoa Trade. pages 316–329.
Sexton, R. J. et al. (1994). A survey of noncooperative game theory with reference to agricultural
markets: Part 2. potential applications in agriculture. Review of Marketing and Agricultural
Economics, 62(2):183–200.
Solid Food (n.d.). Solid Food. Retrieved March 25, 2017, from http://www.solidfood.eu/.
Spielman, D. J., Ekboir, J., and Davis, K. (2009). Technology in Society The art and science of
innovation systems inquiry : Applications to Sub-Saharan African agriculture. Technology
in Society, 31(4):399–405.
Stiegert, K. W. (2008). Imperfect competition, agriculture and development. Commodity market
review, 2007:35.
Sutton, J. (1991). Sunk costs and market structure: Price competition, advertising, and the evo-
lution of concentration. MIT press.
Talbot, J. M. (1997). Where does your coffee dollar go?: The division of income and surplus along
the coffee commodity chain. Studies in comparative international development, 32(1):56–
91.
Thompson, T. (2011). Case problem: questions regarding the acceptability of buckwheat, ama-
ranth, quinoa, and oats from a patient with celiac disease. Journal of the Academy of Nu-
trition and Dietetics, 101(5):586–587.

BIBLIOGRAPHY 98
Turocy, T. L., Stengel, B. V., and von Stengel, B. (2003). Game Theory. Encyclopedia of Informa-
tion Systems, pages 403 – 420.
Valkila, J. (2009). Fair trade organic coffee production in nicaragua—sustainable development
or a poverty trap? Ecological Economics, 68(12):3018–3025.
Valkila, J., Haaparanta, P., and Niemi, N. (2010). Empowering coffee traders? the coffee value
chain from nicaraguan fair trade farmers to finnish consumers. Journal of Business Ethics,
97(2):257–270.
Vinculos Agricolas (n.d.). Vinculos agricolas. Retrieved April 14, 2017, from http://www.
vinculosagricolas.com/index-eng.html.
Zeballos, V. F., Ellis, H. J., Šuligoj, T., Herencia, L. I., and Ciclitira, P. J. (2012). Variable activation
of immune response by quinoa (chenopodium quinoa willd.) prolamins in celiac disease.
The American journal of clinical nutrition, 96(2):337–344.
Zehner, D. C. (2002). An economic assessment of ‘fair trade’in coffee. Chazen Web Journal of
International Business, 21.
Appendices
99
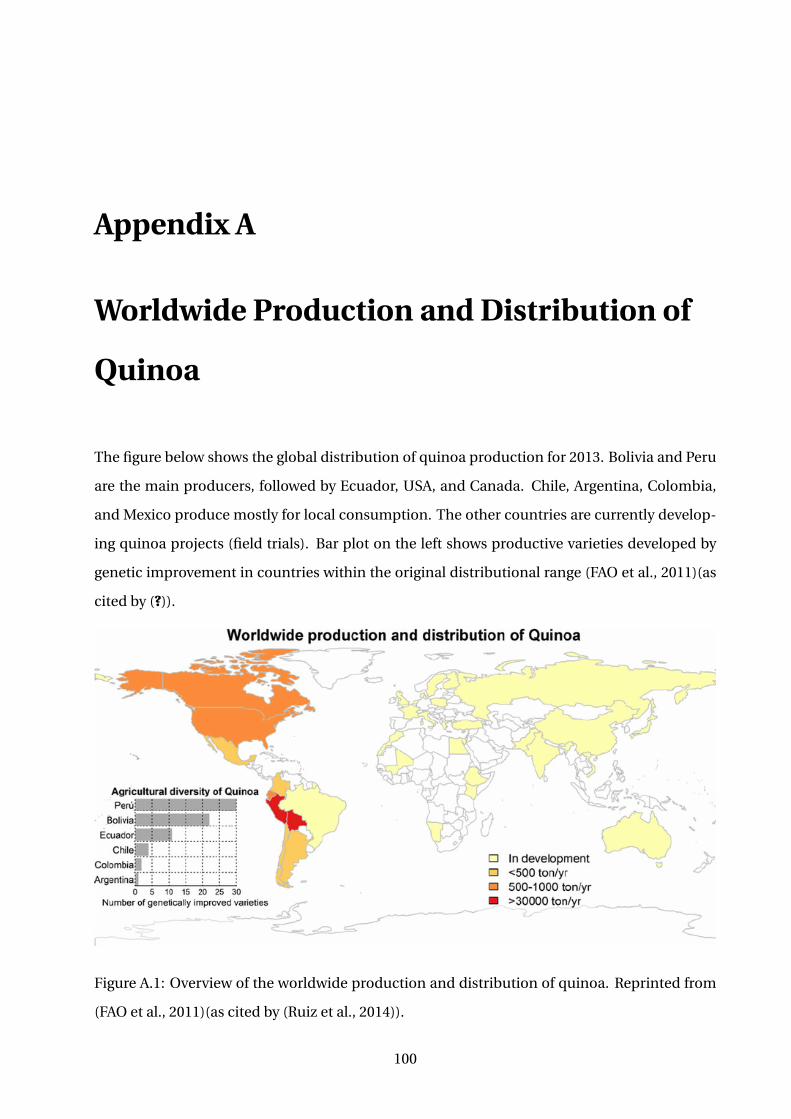
Appendix A
Worldwide Production and Distribution of
Quinoa
The figure below shows the global distribution of quinoa production for 2013. Bolivia and Peru
are the main producers, followed by Ecuador, USA, and Canada. Chile, Argentina, Colombia,
and Mexico produce mostly for local consumption. The other countries are currently develop-
ing quinoa projects (field trials). Bar plot on the left shows productive varieties developed by
genetic improvement in countries within the original distributional range (FAO et al., 2011)(as
cited by (?)).
Figure A.1: Overview of the worldwide production and distribution of quinoa. Reprinted from
(FAO et al., 2011)(as cited by (Ruiz et al., 2014)).
100

Appendix B
Distribution and Production in Peru
The figures outlined in this section show the distribution of the cultivated surface and the
amount of quinoa production in Peru for the years 2013 and 2014. An increase in both pro-
duction volume and cultivated area can be noticed, especially along the coast and in lowlands.
Figure B.1: Volume of quinoa production in metric tons for Peru in 2013 and 2014. Reprinted
from (Ministerio de Agricultura y Riego, 2014)(as cited by (Hatch et al., 2015)).
101
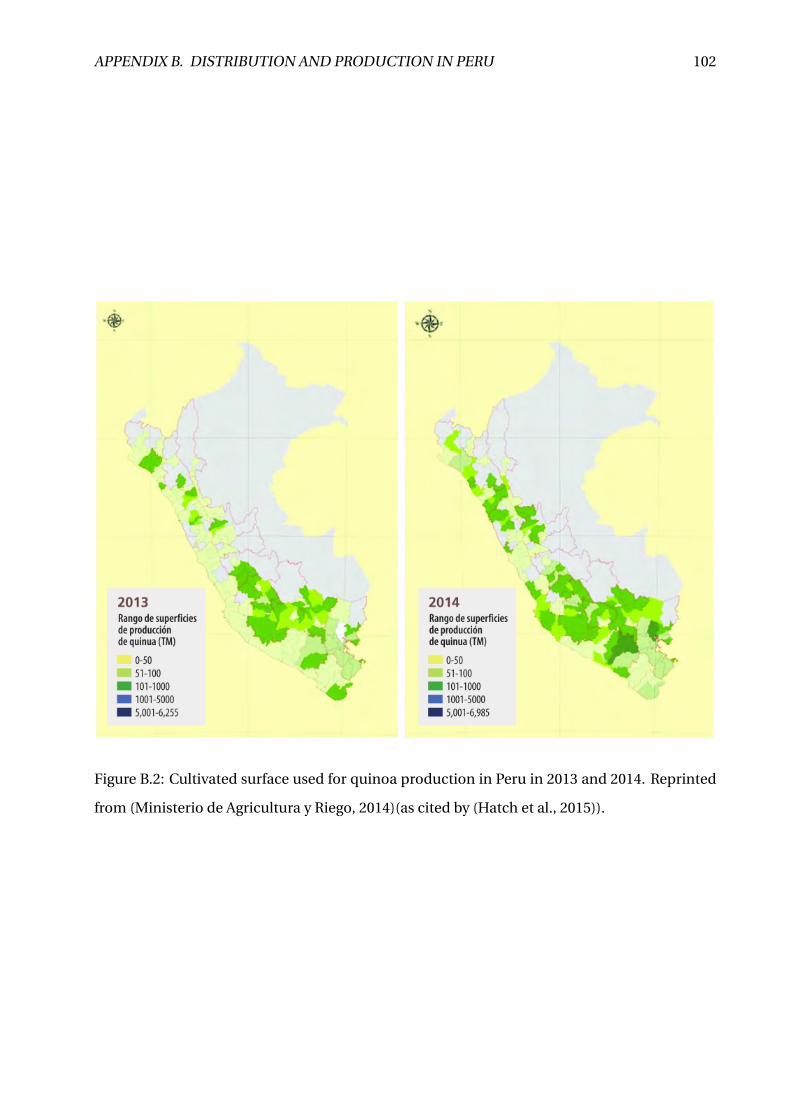
APPENDIX B. DISTRIBUTION AND PRODUCTION IN PERU 102
Figure B.2: Cultivated surface used for quinoa production in Peru in 2013 and 2014. Reprinted
from (Ministerio de Agricultura y Riego, 2014)(as cited by (Hatch et al., 2015)).

Appendix C
Export of Quinoa from Peru to Europe:
Value and Quantity
Exports of quinoa out of Peru towards Europe only started in 2012. The figure gives an indica-
tion of the value and quantity of quinoa that was imported in Europe since that time. We notice
increases in almost all countries for every year. This data was retrieved from the website of the
European Commission.
103
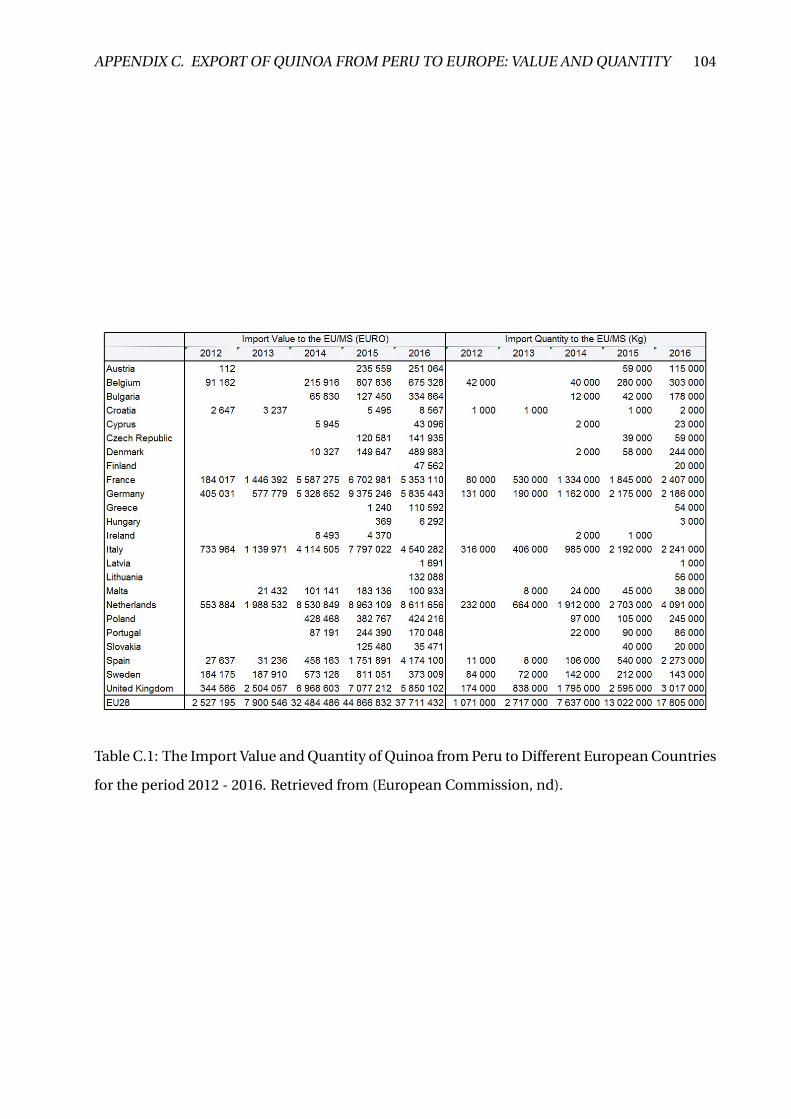
APPENDIX C. EXPORT OF QUINOA FROM PERU TO EUROPE: VALUE AND QUANTITY 104
Table C.1: The Import Value and Quantity of Quinoa from Peru to Different European Countries
for the period 2012 - 2016. Retrieved from (European Commission, nd).

Appendix D
Example of a Value Chain: The Furniture
Industry
Figure D.1 depicts the value chain of the furniture industry. It starts with the supply of seed
inputs, chemicals, machinery, water and extension services (e.g. Information and knowledge)
for the forestry sector. Logs pass to the sawmill sector to be sawn into smaller pieces. This sector
is very dependent on machinery, which is its primary input. After this step, sawn timber moves
to the furniture manufacturers who are also very dependent on machinery. They obtain other
inputs from adhesives, upholstery and paint industries and also draw on design and branding
skills from the service sector. Depending on which market is served, the furniture then passes
through various intermediary stages until it reaches the final consumer. The final consumers
entrust the furniture for recycling. This simple example is a start to understanding that there
is value created in every step of the value chain. As the product moves through the chain, its
value is enhanced until it reaches the customer. Additionally, intermediary actors such as the
forestry sector, the sawmill sector and the furniture sector may unfold in many more different
value chains (e.g. from the forestry to the mining or pulp and paper sector; from the sawmill
sector to domestic/foreign stockholders or to the building and construction industry).
105

APPENDIX D. EXAMPLE OF A VALUE CHAIN: THE FURNITURE INDUSTRY 106
Figure D.1: The forestry, timber and furniture value chain. Reprinted from (Kaplinsky and Mor-
ris, 2002).
Appendix E
Participation of Nicaragua in Global Value
Chains
(Hernandez et al., 2013) provide an example of the production of apparel in Nicaragua to show
that Latin American countries play a significant and valuable role in the global network. Al-
though a lot of countries are involved in the agricultural sector, companies in Latin American
countries have not only entered global value chains in agriculture, but some are also present
in the aerospace sector and offshore business services (Fernandez-Stark et al., 2012); (Giuliani
et al., 2005); (Buenrostro et al., 2011) (as cited by (Hernandez et al., 2013)). Furthermore, an
example of a country that plays an important role in the global apparel manufacturing value
chain is Nicaragua. The value chain is depicted on figure E.1, on which we can clearly distin-
guish the following phases: R&D; Design; Purchasing; Production cut-make-trim; Distribution;
Marketing; Services.
Nicaragua is mainly involved in the so-called "low-value cut-make-trim stage of the apparel
value chain" (Hernandez et al., 2013). Although Nicaragua can still be regarded as a regional
supplier, its market share has increased firmly since 2004 and especially in certain segments
in the United States, one of its most important countries for export. According to (Hernandez
et al., 2013), foreign-owned firms are the ones most present in the apparel industry. A lot of
these companies are crucial actors in global value chains. By using and exploiting the close
relationships with the other actors in the value chain, companies in a global network are able to
supply complete deals to customers. Nicaragua’s focus lies on production services for apparel,
which is a difficult segment if you want to upgrade the value chain or want to climb the ladder in
107
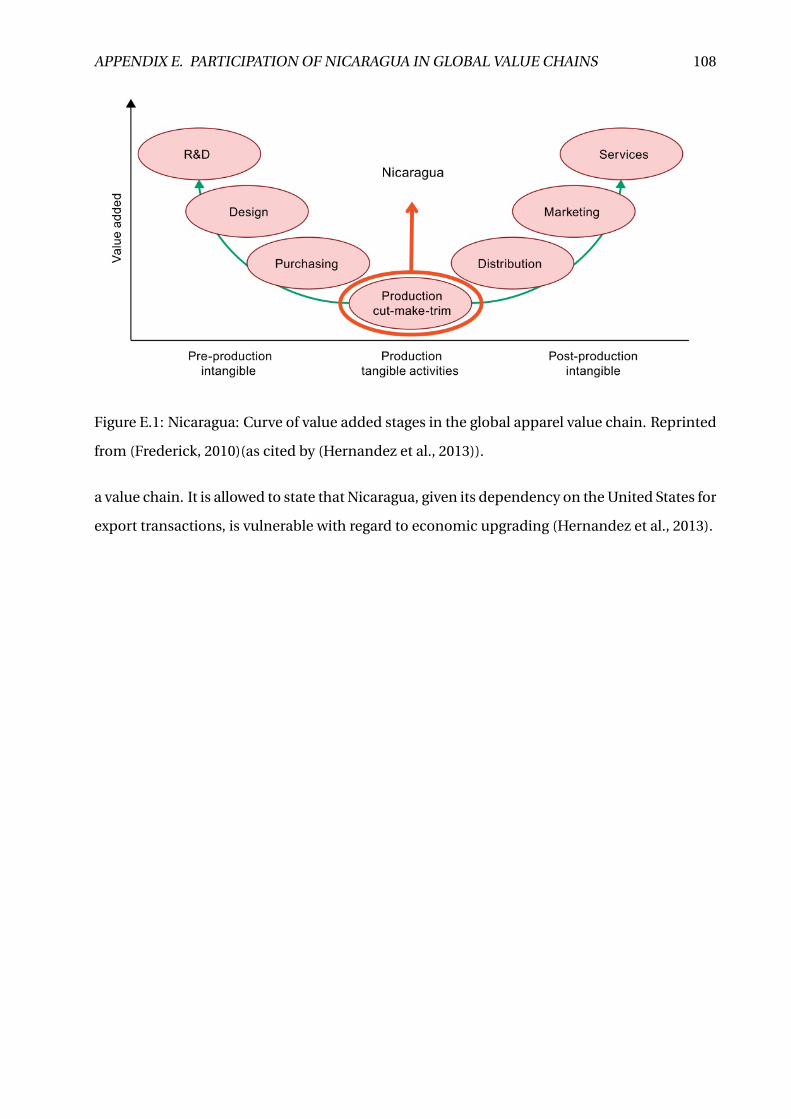
APPENDIX E. PARTICIPATION OF NICARAGUA IN GLOBAL VALUE CHAINS 108
Figure E.1: Nicaragua: Curve of value added stages in the global apparel value chain. Reprinted
from (Frederick, 2010)(as cited by (Hernandez et al., 2013)).
a value chain. It is allowed to state that Nicaragua, given its dependency on the United States for
export transactions, is vulnerable with regard to economic upgrading (Hernandez et al., 2013).

Appendix F
The Position of Peru and Bolivia
This part illustrates the position of quinoa-producing countries Peru and Bolivia relatively to
each other and to an average European country: Belgium. The following tables show the de-
gree of development of a country by means of the Human Development Index (HDI) and its
components. The data was provided by (Solid Food, nd).
F.1 Human Development Index: Components and Trends
F.1.1 Definitions
Table F.1 depicts multiple facets that represent the development of countries:
- Human Development Index: A composite index that measures the average achievement in
three basic dimensions of human development: A long and healthy life, knowledge and a de-
cent standard of living.
- Life expectancy at birth: Number of years a newborn infant could expect to live if prevailing
patterns of age-specific mortality rates at the time of birth stay the same throughout the infant’s
life.
- Expected years of schooling: Numbers of years of schooling that a child of school entrance age
can expect to receive if prevailing patterns of age-specific enrollment rates persist throughout
the child’s life.
- Mean years of schooling: Average number of years of education received by people ages 25
and older, converted from education attainment levels using official durations of each level.
- Gross National Income (GNI) per capita: Aggregate income of an economy generated by its
production and its ownership of factors of production, less the incomes paid for the use of fac-
109
APPENDIX F. THE POSITION OF PERU AND BOLIVIA 110
tors of production owned by the rest of the world, converted to international dollars using PPP
(Purchasing Power Parity) rates, divided by midyear population.
F.1.2 Interpretation
From table F.1, we can conclude that Belgium’s life expectancy, education, income and devel-
opment is significantly higher than that of Peru and Bolivia. Peru’s measures are mediocre but
still a lot higher than Bolivia. The life expectancy in Bolivia is 12 years lower than that of Bel-
gium, which is an indication of poor living conditions. The gross national income per capita
also shows huge differences between the countries: Belgium’s GNI is 4 times that of Peru and
8 times that of Bolivia. We can state that Belgium is a country with very high human develop-
ment, Peru is part of the countries with high development mainly due to the development of
multiple international markets in and around the capital Lima in recent years. Countries with
similar rankings are Algeria and Albania. Bolivia is a country with medium human develop-
ment, like Vietnam or Kyrgyzstan. Note that these are figures for 2014. The evolution of the HDI
for different years is depicted in table F.2, as well as the average growth of HDI over time. The
Average Annual HDI Growth is the smoothed annualized growth of the HDI in a given period,
calculated as the annual compound growth rate. It is clear that the HDI for Belgium is signifi-
cantly higher than that of Peru. The difference with Bolivia is even greater. Thereby, the increase
from 1990 to 2000 is the biggest for every country. The increase for Peru and Bolivia is bigger for
the period 2000-2010 compared to a very small increase for Belgium in that period. This indi-
cates the unrealized potential of Peru and Bolivia, while Belgium seems to have reached its full
potential. This is confirmed by the second part of this table. The average annual HDI growth
shows that the increase in Peru and Bolivia, although it isn’t that big as in the period 1990-2000,
is still significantly higher than the one of Belgium for the period 2000-2014.
APPENDIX F. THE POSITION OF PERU AND BOLIVIA 111
F.2 Poverty in Bolivia and Peru
F.2.1 Introduction
When taking a deeper look into Bolivia and Peru, we can state that Bolivia is a lot poorer than
Peru. Table F.3 shows the population below the national poverty line: This is the percentage of
the population living below the national poverty line, which is the line deemed appropriate for
a country by its authorities. National estimates are based on population-weighted subgroup
estimates from household surveys. The second statistic shows the population in severe multi-
dimensional poverty: This is the percentage of the population that is poor regarding multiple
aspects (money, health, electricity, clean water, work, education) adjusted by the intensity of
the deprivations and having a high deprivation score. The changes of these figures in Peru over
the period 2008-2012 are displayed in table F.4. As can be seen from the table, the poverty has
been reduced in Peru in recent years, although there still is a significant amount of the popu-
lation that lives in poor conditions. The data is derived from HDRO calculations based on data
on household deprivations in education, health and living standards from various household
surveys.
F.2.2 Population Trends, Health Outcomes and Education Achievements
The poverty of Peru and especially Bolivia is also illustrated by table F.5, which depicts the pop-
ulation trends, mortality rates and educational achievements (e.g. Literacy rate and secondary
education rate) and table, which shows the national income and its composition of resources
(Gross domestic product (GDP), annual growth of expenditures for the general government and
the consumer price index). Table F.5 has included the following characteristics statistics:
- Total population: De facto population in a country, area or region as of July 1st.
- Population average annual growth: Average annual exponential growth rate for the specified
period.
- Median age: Age that divides the population distribution into two equal parts—that is, 50 per-
cent of the population is above that age and 50 percent is below it.
- Adult mortality rate: Probability that a 15-year-old will die before reaching the age of 60, ex-
pressed per 1,000 people.
- Adult literacy rate: Percentage of the population ages 15 and older who can, with understand-
APPENDIX F. THE POSITION OF PERU AND BOLIVIA 112
ing, both read and write a short simple statement on their everyday life.
Table F.6 involves the following variables:
- Gross Domestic Product (GDP) per capita: This is the GDP in a particular period divided by
the total population for the same period.
- Gross domestic product (GDP): Sum of gross value added by all resident producers in the econ-
omy plus any product taxes and minus any subsidies not included in the value of the products,
expressed in 2011 international dollars using purchasing power parity (PPP) rates.
- General government consumption expenditure: All government current expenditures for pur-
chases of goods and services (including compensation of employees and most expenditures on
national defence and security but excluding government military expenditures that are part of
government capital formation), expressed as a percentage of GDP.
- Consumer price index: Index that reflects changes in the cost to the average consumer of ac-
quiring a basket of goods and services that may be fixed or changed at specified intervals, such
as yearly.
F.2.3 Interpretation
From the tables, we can conclude that Peru is able to maintain the average annual growth in
the considered periods (2000-2005 and 2010-2015). Its population is also expected to keep in-
creasing. The relative increase of the population is a lot bigger in Peru and Bolivia compared to
Belgium. It is clear that the median age in Belgium is a lot higher than that in Peru and almost
twice as high as that in Bolivia. This is yet another indicator of the poor conditions in which
people of Peru and especially Bolivia have to live. Thereby, the adult mortality rates are higher
in Peru and extremely high in Bolivia. Not mentioned in the table is malnutrition: It does not
occur in Belgium but the numbers in Peru and Bolivia are pretty high: (18,4% and 27,2% respec-
tively). Malaria also causes a lot of deaths in these countries. Obviously, poverty goes together
with the restrictions in terms of education. As we can derive from the table, the literacy rate In
Peru and Bolivia is only slightly more than 90% in 2013. We have to note that the literacy rate
for the youth with ages 15-24 (not included in the table) is significantly higher (98,7% for Peru
and 99,2% for Bolivia), which indicates an improvement for the future.

APPENDIX F. THE POSITION OF PERU AND BOLIVIA 113
F.3 National Income and Composition of Resources
The GDP per capita gives a better representation than the total GDP because it is taken rela-
tively to the population. Belgium has the highest GDP per capita, which is 4 times as big as that
of Peru and 8 times as big as that of Bolivia. This is again an indication of the poverty in Peru and
especially in Bolivia. The annual growth of expenditures assigned for the general government
consumption are a lot higher in Bolivia and Peru than in Belgium but its total is still a lot lower.
Figures that are not included in the table are tax income, credit to domestic customers and ex-
ternal debt stock. The tax incomes generated by the Belgian government are a lot higher than in
Peru and Bolivia. The credit given to various domestic sectors is much higher in Belgium. An-
other remarkable variable is the fact that Belgium doesn’t seem to have any external debt stock,
while Peru and Bolivia have quite a lot. This is the debt owed to non-residents repayable in
foreign currency, goods or services, expressed as a percentage of gross national income (GNI).
The consumer price index for all countries has increased relative to 2010, but remarkably the
cost for the average consumer of acquiring a basket of goods and services in Bolivia and Peru
has increased a lot. This also shows that there are sustainable developments going on in these
countries, which may be a positive sign for the future.
F.4 Employment Rates and Labour Productivity
F.4.1 Definitions
Table F.7 depicts the employment rates in agriculture, in services, the % of vulnerable em-
ployment, the unemployment rate and the labour productivity (output per worker and hours
worked per week). Figures included in the table are:
- Labour force participation rate: Percentage of a country’s working-age population that en-
gages actively in the labour market, either by working or looking for work. It provides an indi-
cation of the relative size of the supply of labour available to engage in the production of goods
and services.
- Employment in agriculture: Share of total employment that is employed in agriculture.
- Employment in services: Share of total employment that is employed in services.
- Vulnerable employment: Percentage of employed people engaged as unpaid family workers
APPENDIX F. THE POSITION OF PERU AND BOLIVIA 114
and own-account workers.
- Unemployment rate: Percentage of the labour force population ages 15 and older that is not
in paid employment or self-employed but is available for work and has taken steps to seek paid
employment or self-employment.
- Youth unemployment rate: Percentage of the labour force population ages 15–24 that is not
in paid employment or self-employed but is available for work and has taken steps to seek paid
employment or self-employment.
- Output per worker: Output per unit of labour input, expressed as GDP per person engaged, in
2005 international dollars using purchasing power parity rates.
- Hours worked per week: The number of hours that employed people (wage and salaried work-
ers as well as self-employed workers) work per week.
F.4.2 Interpretation
A variable that is not given in the table is the employment to population ratio. This ratio for
2013 states that 73% of the population in Peru (older than 15) is employed, while in Belgium
this in only 49%. The labour force participation rate, the first in the table, gives the same con-
clusion: Relatively, a lot more people are employed in Peru and Bolivia compared to Belgium,
especially in agriculture. However, in Belgium, there is relatively more labour force with ter-
tiary education (not given in table): 41,3% compared to 15,7% in Peru and Bolivia. From 1990
to 2012, employment in services has increased in Belgium and agriculture has decreased. The
contrary happened in Peru and Bolivia: There is a lot more employment in agriculture in recent
years. The amount of vulnerable employment is also a lot higher in these countries. The unem-
ployment rate seems to be higher in Belgium than in Peru and Bolivia and seems to comprise
a lot of youth. When looking at the youth not in school or employment (not given in table), the
percentage is higher in Peru than in Belgium (16,5% compared to 12,7%). This indicates that a
lot of youth in Belgium has a higher education, while in Peru this isn’t the case. The last metric
is the labour productivity: This is a lot higher in Belgium (4 times higher than in Peru and 8
times higher than in Bolivia) although in Peru, they work a lot more hours per week.
APPENDIX F. THE POSITION OF PERU AND BOLIVIA 115
F.5 International Integration
F.5.1 Definitions
The last metrics to determine the position of the Peru and Bolivia relative to Belgium are given
in table F.8 and can be explained as follows:
- Exports and imports: The sum of exports and imports of goods and services, expressed as a
percentage of gross domestic product (GDP). It is a basic indicator of openness to foreign trade
and economic integration and indicates the dependence of domestic producers on foreign de-
mand (exports) and of domestic consumers and producers on foreign supply (imports), relative
to the country’s economic size (GDP).
- Foreign direct investment, net inflows: Sum of equity capital, reinvestment of earnings, other
long-term capital and short-term capital, expressed as a percentage of GDP.
- Private capital flows: Net foreign direct investment and portfolio investment, expressed as a
percentage of GDP.
- Net migration rate: Ratio of the difference between the number of in-migrants and out-migrants
from a country to the average population, expressed per 1,000 people.
- Stock of immigrants: Ratio of the stock of immigrants into a country, expressed as a percentage
of the country’s population. The definition of immigrant varies across countries but generally
includes the stock of foreign-born people, the stock of foreign people (according to citizenship)
or a combination of the two.
- Internet users: People with access to the worldwide network.
F.5.2 Interpretation
We can derive from the table that the exports and imports of Belgium determine an enormous
part relative to the GDP of Belgium (164,2%). This is a lot more than Bolivia (81,4%) and Peru
(48,4%). The financial flows indicate that Belgium does not really invest much in foreign capital
since this percentage is negative. Bolivia and Peru do quite some foreign direct investments
but no private capital flows (Private capital flows are negative for all three countries). The net
migration rate and the stock of immigrants clearly illustrates that more people are migrating to
Belgium compared to people that are leaving Belgium, while this is not the case in Bolivia and
Peru. In Bolivia and Peru, more people are leaving the country than there are entering the coun-
APPENDIX F. THE POSITION OF PERU AND BOLIVIA 116
try. This causes a bigger stock of immigrants in Belgium, as can be seen in the table. Last but
not least, the number of internet users back in 2014 was already significantly higher in Belgium
than in Peru or Bolivia. This is another indication of the difference in development between
the countries: Belgium can be categorized as a country with very high human development,
Peru can be categorized as a country with high human development and Bolivia is still seen
as a country with medium human development. To give an illustration, this investigation in-
cludes all countries in the world such as very poor African countries. Relative to these countries,
Bolivia and Peru are doing quite good. However, there is still a lot of potential for improvement.
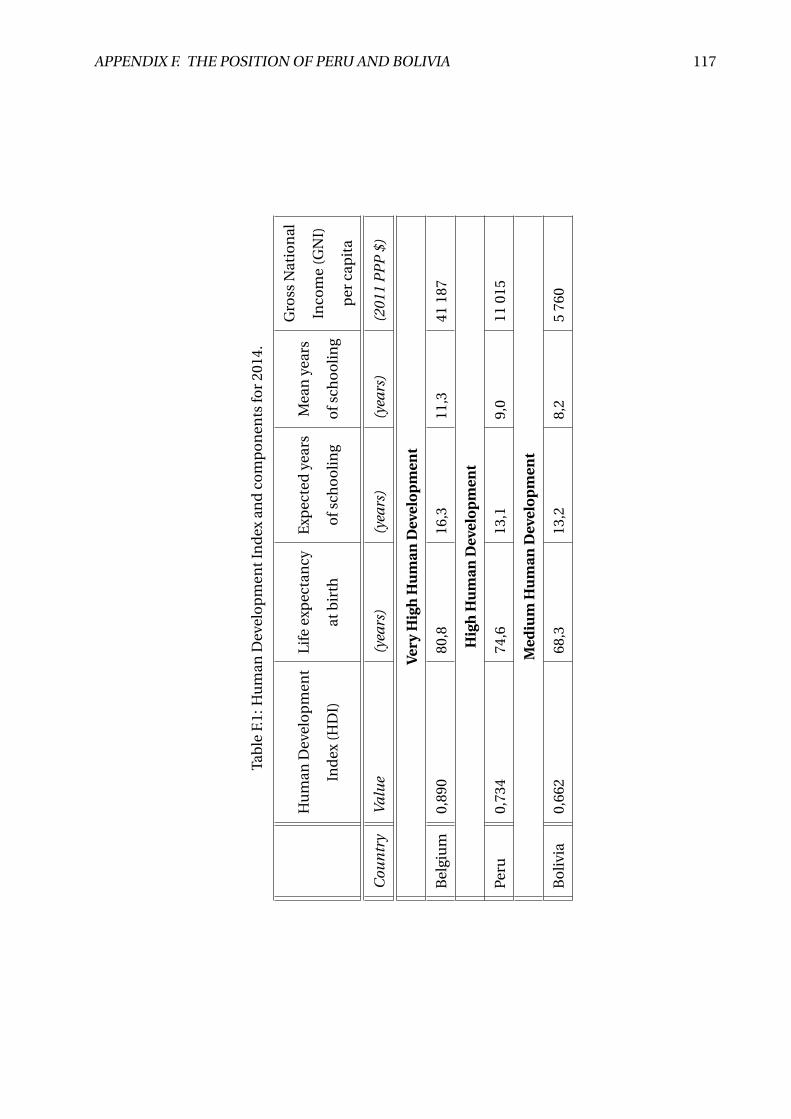
APPENDIX F. THE POSITION OF PERU AND BOLIVIA 117
Tab
leF.
1:H
um
anD
evel
op
men
tIn
dex
and
com
po
nen
tsfo
r20
14.
Hu
man
Dev
elo
pm
ent
Ind
ex(H
DI)
Life
exp
ecta
ncy
atb
irth
Exp
ecte
dye
ars
ofs
cho
oli
ng
Mea
nye
ars
ofs
cho
oli
ng
Gro
ssN
atio
nal
Inco
me
(GN
I)
per
cap
ita
Cou
ntr
yV
alu
e(y
ears
)(y
ears
)(y
ears
)(2
011
PP
P$)
Very
Hig
hH
um
anD
evel
op
men
t
Bel
giu
m0,
890
80,8
16,3
11,3
4118
7
Hig
hH
um
anD
evel
op
men
t
Peru
0,73
474
,613
,19,
011
015
Med
ium
Hu
man
Dev
elo
pm
ent
Bo
livi
a0,
662
68,3
13,2
8,2
576
0
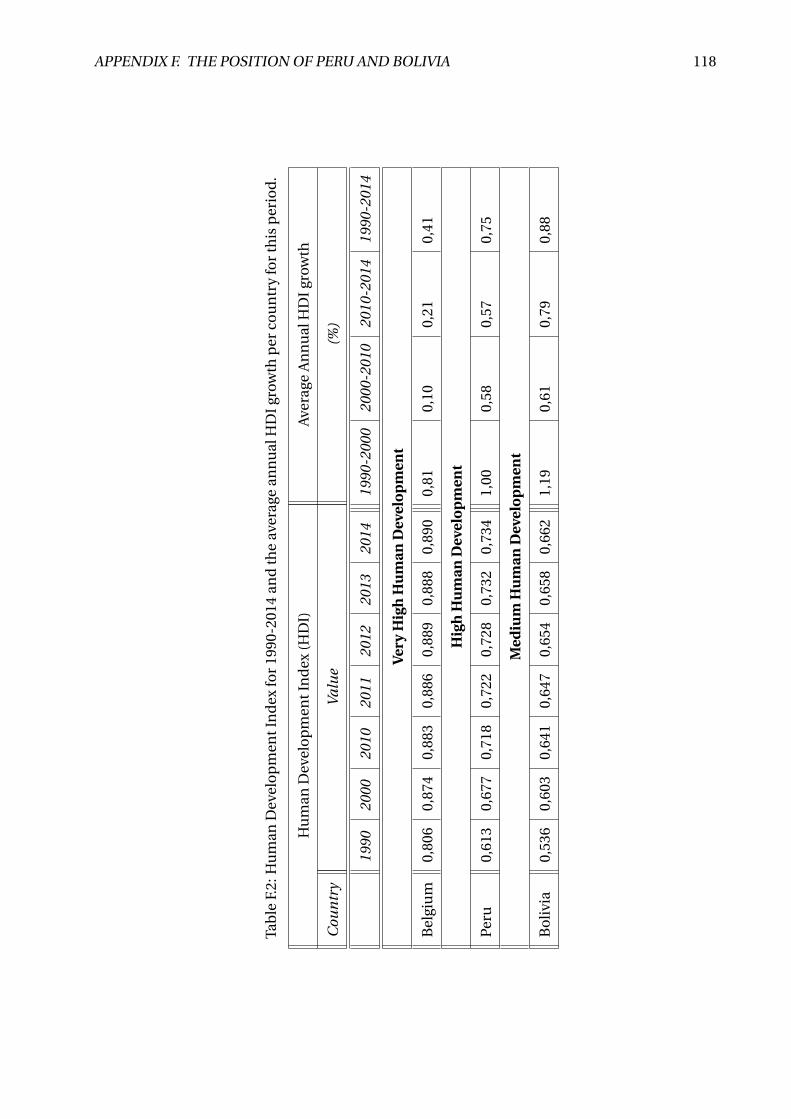
APPENDIX F. THE POSITION OF PERU AND BOLIVIA 118
Tab
leF.
2:H
um
anD
evel
op
men
tIn
dex
for
1990
-201
4an
dth
eav
erag
ean
nu
alH
DI
grow
thp
erco
un
try
for
this
per
iod
.
Hu
man
Dev
elo
pm
entI
nd
ex(H
DI)
Ave
rage
An
nu
alH
DI
grow
th
Cou
ntr
yV
alu
e(%
)
1990
2000
2010
2011
2012
2013
2014
1990
-200
020
00-2
010
2010
-201
419
90-2
014
Very
Hig
hH
um
anD
evel
op
men
t
Bel
giu
m0,
806
0,87
40,
883
0,88
60,
889
0,88
80,
890
0,81
0,10
0,21
0,41
Hig
hH
um
anD
evel
op
men
t
Peru
0,61
30,
677
0,71
80,
722
0,72
80,
732
0,73
41,
000,
580,
570,
75
Med
ium
Hu
man
Dev
elo
pm
ent
Bo
livi
a0,
536
0,60
30,
641
0,64
70,
654
0,65
80,
662
1,19
0,61
0,79
0,88
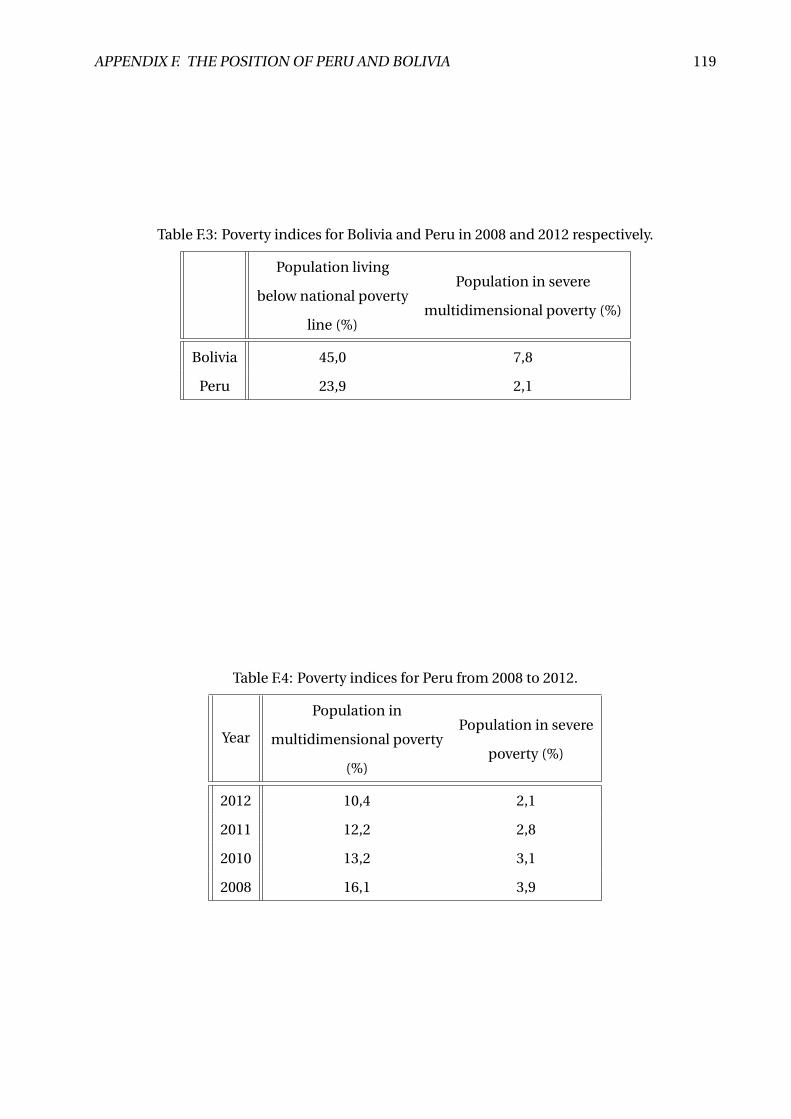
APPENDIX F. THE POSITION OF PERU AND BOLIVIA 119
Table F.3: Poverty indices for Bolivia and Peru in 2008 and 2012 respectively.
Population living
below national poverty
line (%)
Population in severe
multidimensional poverty (%)
Bolivia 45,0 7,8
Peru 23,9 2,1
Table F.4: Poverty indices for Peru from 2008 to 2012.
Year
Population in
multidimensional poverty
(%)
Population in severe
poverty (%)
2012 10,4 2,1
2011 12,2 2,8
2010 13,2 3,1
2008 16,1 3,9
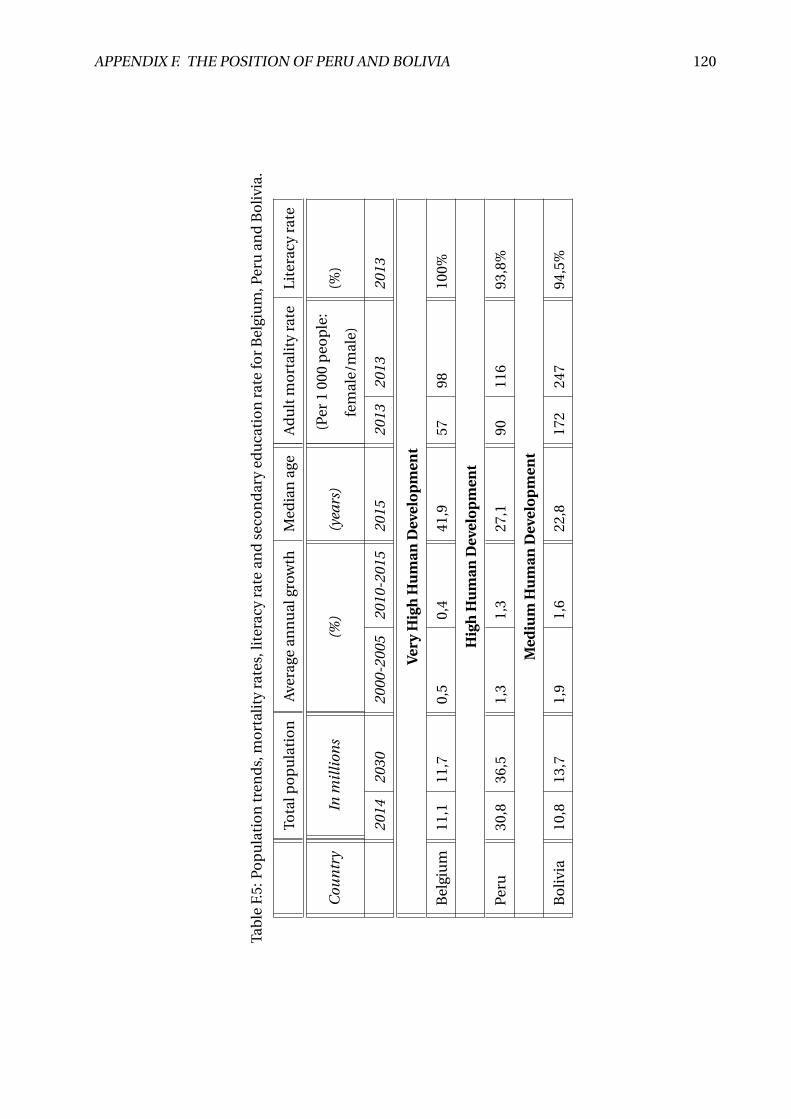
APPENDIX F. THE POSITION OF PERU AND BOLIVIA 120
Tab
leF.
5:Po
pu
lati
on
tren
ds,
mo
rtal
ity
rate
s,li
tera
cyra
tean
dse
con
dar
yed
uca
tio
nra
tefo
rB
elgi
um
,Per
uan
dB
oli
via.
Tota
lpo
pu
lati
on
Ave
rage
ann
ual
grow
thM
edia
nag
eA
du
ltm
ort
alit
yra
teLi
tera
cyra
te
Cou
ntr
yIn
mil
lion
s(%
)(y
ears
)(P
er1
000
peo
ple
:
fem
ale/
mal
e)(%
)
2014
2030
2000
-200
520
10-2
015
2015
2013
2013
2013
Very
Hig
hH
um
anD
evel
op
men
t
Bel
giu
m11
,111
,70,
50,
441
,957
9810
0%
Hig
hH
um
anD
evel
op
men
t
Peru
30,8
36,5
1,3
1,3
27,1
9011
693
,8%
Med
ium
Hu
man
Dev
elo
pm
ent
Bo
livi
a10
,813
,71,
91,
622
,817
224
794
,5%

APPENDIX F. THE POSITION OF PERU AND BOLIVIA 121
Tab
leF.
6:N
atio
nal
inco
me
and
com
po
siti
on
ofr
eso
urc
es.
Gro
ssD
om
esti
c
Pro
du
ct(G
DP
)
Gen
eral
Gov
ern
men
t
con
sum
pti
on
exp
end
itu
re
Co
nsu
mer
pri
ce
ind
ex
Cou
ntr
yP
erca
pit
a
(201
1P
PP
$)
Tota
l
(%of
GD
P)
Ave
rage
ann
ual
grow
th(%
)(2
010
=10
0)
2013
2005
-201
320
05-2
013
2013
Very
Hig
hH
um
anD
evel
op
men
t
Bel
giu
m40
607
24,4
1,1
108
Hig
hH
um
anD
evel
op
men
t
Peru
1139
611
,26,
711
0
Med
ium
Hu
man
Dev
elo
pm
ent
Bo
livi
a5
934
13,9
9,3
121

APPENDIX F. THE POSITION OF PERU AND BOLIVIA 122
Tab
leF.
7:E
mp
loym
entr
ates
and
lab
ou
rp
rod
uct
ivit
yin
Bel
giu
m,B
oli
via
and
Per
u.
Em
plo
ymen
tU
nem
plo
ymen
tLa
bo
ur
pro
du
ctiv
ity
Lab
ou
rfo
rce
par
tici
pat
ion
rate
Em
plo
ymen
tin
agri
cult
ure
Em
plo
ymen
t
inse
rvic
es
Vu
lner
able
emp
loym
ent
Tota
lYo
uth
Ou
tpu
tper
wo
rker
Ho
urs
wo
rked
per
wee
k
Cou
ntr
y(%
ages
15
and
old
er)
(%of
tota
l
emp
loym
ent)
(%of
labo
ur
forc
e)
(%of
you
th
labo
ur
forc
e)(2
011
PP
P$)
Per
emp
loye
d
per
son
)
2013
1990
2012
1990
2012
2008
-201
320
08-2
013
2008
-201
420
05-2
012
2003
-201
2
Very
Hig
hH
um
anD
evel
op
men
t
Bel
giu
m53
,33,
11,
265
,677
,110
,88,
423
,280
810
30,3
Hig
hH
um
anD
evel
op
men
t
Peru
76,2
1,2
25,8
71,5
56,8
46,3
4,0
8,8
1819
140
,2
Med
ium
Hu
man
Dev
elo
pm
ent
Bo
livi
a72
,51,
232
,173
,247
,954
,92,
76,
210
026
/
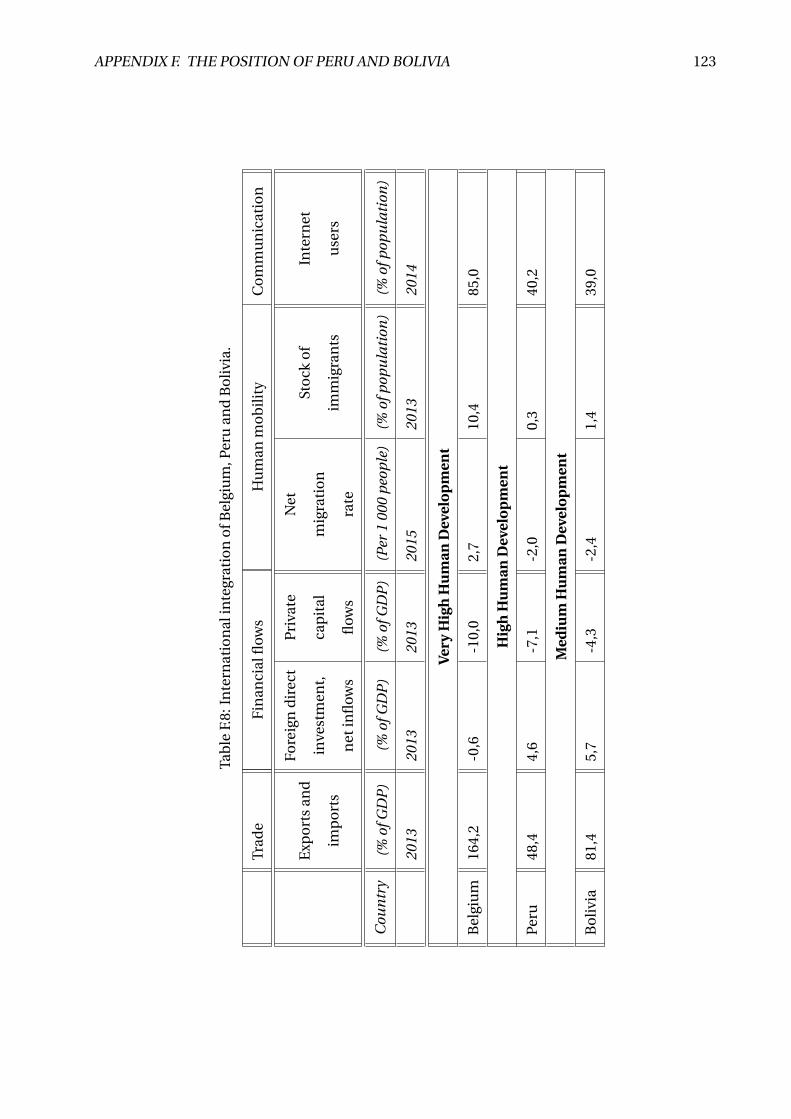
APPENDIX F. THE POSITION OF PERU AND BOLIVIA 123
Tab
leF.
8:In
tern
atio
nal
inte
grat
ion
ofB
elgi
um
,Per
uan
dB
oli
via.
Trad
eF
inan
cial
flow
sH
um
anm
ob
ilit
yC
om
mu
nic
atio
n
Exp
ort
san
d
imp
ort
s
Fore
ign
dir
ect
inve
stm
ent,
net
infl
ows
Pri
vate
cap
ital
flow
s
Net
mig
rati
on
rate
Sto
cko
f
imm
igra
nts
Inte
rnet
use
rs
Cou
ntr
y(%
ofG
DP
)(%
ofG
DP
)(%
ofG
DP
)(P
er1
000
peo
ple
)(%
ofp
opu
lati
on)
(%of
pop
ula
tion
)
2013
2013
2013
2015
2013
2014
Very
Hig
hH
um
anD
evel
op
men
t
Bel
giu
m16
4,2
-0,6
-10,
02,
710
,485
,0
Hig
hH
um
anD
evel
op
men
t
Peru
48,4
4,6
-7,1
-2,0
0,3
40,2
Med
ium
Hu
man
Dev
elo
pm
ent
Bo
livi
a81
,45,
7-4
,3-2
,41,
439
,0


![18F]FLUORO-N,N-DIMETHYLAMINOETHANOL AS …lib.ugent.be/fulltxt/RUG01/001/790/044/RUG01-001790044_2012_0001... · universiteit gent faculteit farmaceutische wetenschappen vakgroep](https://static.fdocuments.us/doc/165x107/5af4e91e7f8b9a190c8da930/18ffluoro-nn-dimethylaminoethanol-as-libugentbefulltxtrug01001790044rug01-00179004420120001universiteit.jpg)