The Euro imbalances and Financial Deregulation: A Post Keynesian ...
Upload
carlos-castanedaCategory
view
409download
2
AN ANALYSIS OF THE EFFECTS OF
FINANCIAL DEREGULATION ON THE RISK
PROFILE OF FINANCIAL INSTITUTIONS
A LOOK BACK AT THE FINANCIAL CRISIS OF 2008
Carlos Castaneda
Supervisor: Dr. Dale Carl
Major Research Paper
TED ROGERS SCHOOL OF MANAGEMENT RYERSON UNIVERSITY
Toronto, August 2013
This major research paper was written as part of the Master of Business Administration in Global Management at Ryerson University. Note that the views in this paper do not in any way reflect the views of the supervisor, nor those of Ryerson University. The theories and conclusions are the sole work of the author.

2
ACKNOWLEDGEMENT
First, I would like to thank my supervisor Dr. Dale E. Carl for the valuable feedback and
timely responses provided throughout the whole process. The quick response time and
constructive feedback helped keep me on track and ensured that I did not veer too far off topic. I
would also like to thank Jon H. Findreng, a fellow alumnus at Harvard University, whose
econometrics background was of great help during late night brainstorming sessions.

3
ABSTRACT
Since the end of World War II, financial markets have remained relatively stable, with the
exception of occasional corrections and quick recoveries. However, the golden era of financial
stability and accelerated growth came to a screeching halt in 2008, when financial markets
collapsed in a most dramatic fashion. Although there are many factors that contributed to the
systemic collapse of the financial markets, many economists believe that deregulation of financial
markets played a major role in the collapse. This paper focuses on three key policy changes that
profoundly affected the way banks operate in the United States. The first major policy change
occurred in 1986 when congress repealed Regulation Q, which until 1986 had imposed interest
rate ceilings on commercial banks and thrift institutions. The second event is the repeal of the
Glass-Steagall Act of 1933. The repeal marked a watershed moment that changed the financial
landscape and ushered an era of power-concentration and asset-conglomeration by the top 10
financial institutions in the United States. The third event focuses on the 2004 Securities and
Exchange Commission net capital rule amendment, which changed the way in which investment-
banks adjudicate risk and allowed financial institutions to increase their leverage to egregious
levels. This paper aim is to add to the literature and to encourage a candid dialogue on the events
that transpired in 2008. The final results of this paper are not conclusive and cannot, with a high
degree of certainty, assert that deregulation was the sole cause of the collapse. However, strong
evidence was found to support further research into the inverse relation between regulation and
risk.

4
Table of Contents 1 INTRODUCTION ................................................................................................................................................... 5 2 RESEARCH QUESTION ..................................................................................................................................... 7 2.1 SCOPE ................................................................................................................................................................... 7 2.2 RESEARCH QUESTION ............................................................................................................................... 7 2.3 GOALS AND OBJECTIVES ........................................................................................................................ 7 2.4 METHODOLOGY ............................................................................................................................................ 8 3 LITERATURE REVIEW ...................................................................................................................................... 9 3.1 HISTORY OF THE GLASS-STEAGALL ACT .................................................................................... 9 3.1.1 THE REINTERPRETATION OF SECTION 20 OF THE GLASS-STEAGALL ACT .. 11 3.1.2 THE REPEAL OF THE GLASS-STEAGALL ACT ................................................................... 12 3.1.3 IS THE GLASS-STEAGALL ACT JUSTIFIED? ........................................................................ 13 3.2 MORE DEREGULATION BY THE SECURITIES EXCHANGE COMMISSION .............. 16 3.3 LESS REGULATION – MORE RISK .................................................................................................... 17 3.4 THE MINSKY MOMENT .......................................................................................................................... 19 3.5 TOO BIG TO FAIL ....................................................................................................................................... 20 4 DATA ANALYSIS .............................................................................................................................................. 23 4.1 SECTION I ....................................................................................................................................................... 23 4.1.1 SECURITIES AND EXCHANGE COMMISSION 2004 NET CAPITAL RULE ............ 23 4.1.2 REGULATION Q ..................................................................................................................................... 26 4.1.3 A LOOK AT THE REPEAL OF THE GLASS-STEAGALL ACT ........................................ 29 4.1.3.1 DOES DEREGULATION INCREASE CONCENTRATION OF POWER? ............... 30 4.1.3.2 RISKS OF CONCENTRATION OF POWER ......................................................................... 32 4.2 SECTION II ...................................................................................................................................................... 34 4.2.1 THE MINSKY-KINDLEBERGER MODEL ................................................................................. 34 4.2.2 FINANCIAL CRISIS OF 2008 FROM A MINSKY PERSPECTIVE ................................... 35 4.2.3 CAN REGULATION PREVENT A MINSKY BUBBLE? ....................................................... 35 5 CONCLUSIONS ................................................................................................................................................... 37 6 REFLECTION ....................................................................................................................................................... 39 7 BIBLIOGRAPHY ................................................................................................................................................. 41
5
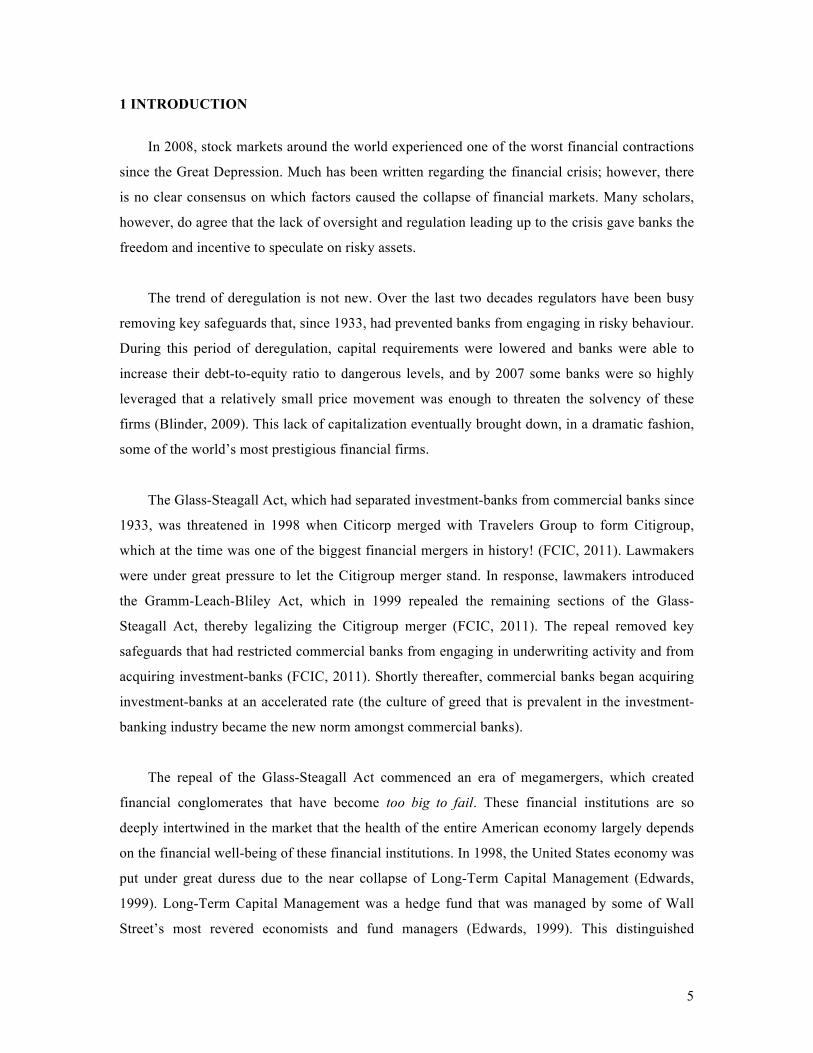
1 INTRODUCTION
In 2008, stock markets around the world experienced one of the worst financial contractions
since the Great Depression. Much has been written regarding the financial crisis; however, there
is no clear consensus on which factors caused the collapse of financial markets. Many scholars,
however, do agree that the lack of oversight and regulation leading up to the crisis gave banks the
freedom and incentive to speculate on risky assets.
The trend of deregulation is not new. Over the last two decades regulators have been busy
removing key safeguards that, since 1933, had prevented banks from engaging in risky behaviour.
During this period of deregulation, capital requirements were lowered and banks were able to
increase their debt-to-equity ratio to dangerous levels, and by 2007 some banks were so highly
leveraged that a relatively small price movement was enough to threaten the solvency of these
firms (Blinder, 2009). This lack of capitalization eventually brought down, in a dramatic fashion,
some of the world’s most prestigious financial firms.
The Glass-Steagall Act, which had separated investment-banks from commercial banks since
1933, was threatened in 1998 when Citicorp merged with Travelers Group to form Citigroup,
which at the time was one of the biggest financial mergers in history! (FCIC, 2011). Lawmakers
were under great pressure to let the Citigroup merger stand. In response, lawmakers introduced
the Gramm-Leach-Bliley Act, which in 1999 repealed the remaining sections of the Glass-
Steagall Act, thereby legalizing the Citigroup merger (FCIC, 2011). The repeal removed key
safeguards that had restricted commercial banks from engaging in underwriting activity and from
acquiring investment-banks (FCIC, 2011). Shortly thereafter, commercial banks began acquiring
investment-banks at an accelerated rate (the culture of greed that is prevalent in the investment-
banking industry became the new norm amongst commercial banks).
The repeal of the Glass-Steagall Act commenced an era of megamergers, which created
financial conglomerates that have become too big to fail. These financial institutions are so
deeply intertwined in the market that the health of the entire American economy largely depends
on the financial well-being of these financial institutions. In 1998, the United States economy was
put under great duress due to the near collapse of Long-Term Capital Management (Edwards,
1999). Long-Term Capital Management was a hedge fund that was managed by some of Wall
Street’s most revered economists and fund managers (Edwards, 1999). This distinguished

6
reputation allowed Long-Term Capital Management to gain access to cheap credit with fewer
restrictions than the average Wall Street firm (Edwards, 1999). However in 1998, Long-Term
Capital Management faced potential bankruptcy when they took a large position in the Russian
bond market, which defaulted on their debt obligation (Edwards, 1999). Long-Term Capital
Management’s investment strategy relied solely on the mathematical models of two Nobel-
laureates (Edwards, 1999). These models had proven to be statistically reliant; however, the
default of the Russian government broke down the predictability power of these models, and in
result Long-Term Capital Management incurred large losses, which they were not able cover.
The American markets began failing in response to the impending collapse of Long-Term
Capital Management, and the United States government was forced to act in order to prevent a
financial catastrophe (Edwards, 1999). The Federal Reserve of New York assembled a
consortium of 16 banks, all which had vested interest in the survival of Long-Term Capital, and
mediated a recapitalization program to save the firm (Edwards, 1999). The consortium agreed to
pledge $3.65 billion to recapitalize Long-Term Capital Management (Edwards, 1999).
Although the bail out of Long-Term Capital Management was not at the tax payers expense,
some critics worried that the actions of the Federal Reserve of New York set precedence for
future government bailouts, thereby creating moral hazards in the market (Dorgan, Harkin, &
Reid, 2000). The too big to fail concept gave banks reassurance that if they became big enough
and they got into trouble, they would be rescued by the US government. In 2008 the fear of moral
hazard materialized in the form a $700 billion quantitative easing program, which traded “cash
for trash.” The program was known as Troubled Asset Relief Program (TARP) (FCIC, 2011).
The lessons of the past have long been forgotten, and the government has ushered an era of
financial deregulation, which has been justified by neoclassic economic theories. The fields of
finance and econometrics have indeed advanced our understanding of the markets; however, our
animal spirits remain as greedy as ever. The regulatory role of the government remains an
important piece of the financial model, which ensures the safety and soundness of the markets.
Regardless of financial innovation and market sophistication, financial institutions, if left
unregulated, will continue to converge towards greater concentration of power. This trend
accelerated exponentially during the early 2000s; megamergers became the norm and gave rise to
bigger and more concentrated banks. Modern banks have become so large that they hold the
nation’s economic fate in their hands, a responsibility too great to be left to self-regulation.

7
2 RESEARCH QUESTION
2.1 SCOPE
The scope of this paper is on the American financial system and the regulatory framework
by which it is governed. This paper will examine 3 key policy changes and determine to which
degree they affected the financial markets in 2008. The 3 key events are; the repeal of the Glass-
Steagall Act, the phase-out of Regulation Q, and the amendment of the SEC 2004 net capital rule.
This paper will focus on whether the repeal or amendment of these rules had any significant
impact on the creation or propagation of the housing bubble and its subsequent collapse.
It is important to note that the focus of this paper is not to recommend the course of action
that regulators should take, rather the focus is to identify the effect of regulation, or lack thereof,
on the financial markets.
2.2 RESEARCH QUESTION
This paper aims to answer two central questions:
1. Whether there is a clear link between financial deregulation and an increase in risk?
2. And, which laws and regulations had the biggest impact on the risk profile of banks?
In order to answer these two central questions a review of available literature and an analysis
of market data will be carried out in order to establish a link between regulation and risk.
2.3 GOALS AND OBJECTIVES
The Goal of this paper is to analyze the causes of the financial crisis and to understand in
greater depth the factors of that led to one of the worst financial meltdowns in recent history. This
paper provides insight into the causality link between regulation and risk. The aim of this paper is
to explain in plain language the steps that led to the financial crash of 2008; it is important to
understand the causes of financial crises in order to prevent future crises.

8
2.4 METHODOLOGY
The primary approach of this paper is to provide an in-depth analysis of relevant literature
and provide a summary of what economist and politicians have said on the subject of financial
deregulation. The literature review provides a road map for understanding the role of deregulation
on the financial crisis of 2008. The second approach is an analysis of market data. This paper
examines the trends and patterns present in the data in order to answer the two central questions.
The first data analysis will be on the SEC 2004 net capital rule amendment. In order to
establish a link between the policy change and the risk profile of financial institution before and
after, the volatility (σ) and systemic risk (β) of 10 banks will be calculated. The observations will
be categorized into two periods: pre-policy change 1997-2004, and post-policy changes 2005-
2012. Systemic risk and volatility are expected to increase in the post-policy change period in
order to reflect the increased risk of higher levels of leverage. Two Canadian banks have been
chosen as a controlled group to compare banks that were not affected by the policy change. The
S&P 500 was chosen as the benchmark for all banks to keep comparisons on an even level.
However, the main limitation of this approach is that it does not distinguish between the different
types of risk that could affect the firm’s value. A regression model is suggested as a more
sophisticated approach, which can isolate the factors that affect a bank’s risk profile.
The theory of supply and demand for two interacting semi-perfect substitutes (banks and
thrifts) will be used to analyze the effects of Regulation Q on interest rates. The theory of supply
and demand provides an easy to understand framework for predicting the behaviour of two agents
in a closed system. However, the limitation of this approach is that the model oversimplifies how
a rational agent might respond to policy change and competition. Historical data is also provided
in order to assess the predictability power of supply and demand curves. The model shows that
the actions of one agent influence the actions of the competing agent. This interaction is modeled
in the supply and demand graphs.
Lastly the concentration of power predicted by the repeal of the Glass-Steagall Act will be
analyzed by comparing the percentage of assets held by the top 10 institutions over the last 15
years, and why concentration of assets present a risk for the entire economy. It is expected that a
steep increase in concentration of assets will be observed after the repeal of the Glass-Steagall
Act in 1999.

9
3 LITERATURE REVIEW
The financial crash of 2008 is one of the most important events in recent financial history. It
was a perfect storm of systemic risk and irrational exuberance. This paper focuses on the role that
regulation, or lack thereof, played in the meltdown of the financial markets.
3.1 HISTORY OF THE GLASS-STEAGALL ACT
In order to better understand the need for financial regulation it is necessary to understand
the history of the Glass-Steagall Act. The Glass-Steagall Act was drafted after the famous Pecora
trails in which Ferdinand Pecora was able to uncover the depth of corruption that plagued the
banking system during the 1920s (Crawford, 2011). Charles Mitchell, head of the National City
Bank, the second largest bank in the United States at the time, admitted to Pecora that traders
were given bonuses based on the riskiness of the investment; the higher the risk the higher the
bonus (Crawford, 2011). Mitchell also admitted to knowingly securitizing bad loans and selling
them to Latin American countries (Crawford, 2011).
Immediately after the Pecora trails the public became outraged at the level of greed and
corruption prevalent in Wall Street, and demanded stricter regulation of the financial markets. In
June of 1933, congress responded to public outcry with the enactment of the Glass-Steagall Act,
named after Senator Carter Glass and Congressman Henry Steagall (Crawford, 2011). The Glass-
Steagall Act, aside from imposing tough restrictions on financial companies, also created several
institutions that protect public interest, such as the Federal Deposit Insurance Corporation, which
insures clients deposits held in chartered banks (FCIC, 2011).
Bankers were not happy with the new restrictions and began lobbying against the Glass-
Steagall Act as soon as it was passed (FCIC, 2011). The Glass-Steagall Act was eventually
repealed in April of 1999 when Citicorp and Travelers Insurance Company merged to create
Citigroup (FCIC, 2011). This merger forced lawmakers to introduce the Gramm-Leach-Bliley
Act 1999 (FCIC, 2011). The Gramm-Leach-Bliley Act repealed the remaining sections of the
Glass-Steagall Act, which had forced banks to choose whether they wanted to be investment-
banks or commercial banks (FCIC, 2011). This merger was seen as a watershed moment on the
road to the financial crisis.

10
Senator Byron Dorgan, Democrat from North Dakota, warned against the repeal of the
Glass-Steagall Act. On November 1999, he gave the following warning to the House of
Representatives, “I think we will look back in 10 years' time and say we should not have done
this [repealed the Glass-Steagall Act] but we did because we forgot the lessons of the past, and
that that which is true in the 1930's is true in 2010. I wasn't around during the 1930's or the debate
over Glass-Steagall. But I was here in the early 1980's when it was decided to allow the
expansion of savings and loans. We have now decided in the name of modernization to forget the
lessons of the past, of safety and of soundness” (Labaton, 1999). Almost exactly 10 years after
the remarks of the Dakota senator the financial system suffered a major systemic collapse similar
in magnitude to the one of the 1930s.
Figure 1: Bank mergers between 1990 and 2009
Notes: The flow chart shows the mergers that took place between 1990 and 2009. It is evident that a trend towards concentration of power took place between these periods. The trend accelerates after the passage of the Gramm-Leach-Bliley Act 1999. Source: (Mother Jones, 2010)

11
Senator Paul Wellstone of Minnesota also warned about the dangers of repealing the Glass-
Steagall Act. He stated, “I rise in strong opposition to S. 900, the Financial Services
Modernization Act of 1999 [Gramm-Leach-Bliley Act]. S. 900 would aggravate a trend towards
economic concentration that endangers not only our economy, but also our democracy… This is
the wrong kind of modernization because it fails to put in place adequate regulatory safeguards
for these new financial giants the failure of which could jeopardize the entire economy. It’s the
wrong kind of modernization because taxpayers could be stuck with the bill if these
conglomerates become too big to fail” (Anonymous, 1999).
Figure 1 shows the mergers that took place between 1990 and 2009. It shows a clear trend
towards concentration of power that Senator Wellstone warned about in 1999. Senator Wellstone
and Senator Dorgan’s warnings regarding the dangers of repealing the Glass-Steagall act were
justified. 74 megamergers occurred between 1990 and 2005 and the top ten banks jumped from
owning 25 percent of the financial industry’s assets to over 55 percent (FCIC, 2011).
3.1.1 THE REINTERPRETATION OF SECTION 20 OF THE GLASS-STEAGALL ACT
In 1987, Section 20 of the Glass-Steagall Act, which was concerned primarily with the
separation of investment-banks and commercial banks, was reinterpreted to allow commercial
banks to engage in a small amount of underwriting (Barth, Brumbaugh Jr., & Wilcox, 2000;
Crawford, 2011).
Sec 20 After one year from the day of enactment of this Act, no member bank shall be affiliated in any manner described in section 2 (b) hereof with any corporation, association, business trust, or other similar organization engaged principally in the issue, flotation, underwriting, public sale, or distribution at wholesale or retail or through syndicate participation of stocks, bonds, debentures, notes, or other securities. (The Federal Reserve Bank of New York, 1933)
However, the phrase “engaged principally” was not defined in the bill and was therefore
open to interpretation. On December of 1986 the Federal Reserve reinterpreted the phrase
“engaged principally” to mean that banks were allowed to engage in a small amount of
underwriting (Barth, Brumbaugh Jr., & Wilcox, 2000). The Fed decided that commercial banks
could earn up to 5 percent of their gross revenue from underwriting activities (Barth, Brumbaugh
Jr., & Wilcox, 2000). This limit was raised once again 2 years later in 1987 to 10 percent and by
1997 banks were able to earn up to 25 percent of a their gross revenue from bank-ineligible

12
securities (Barth, Brumbaugh Jr., & Wilcox, 2000). The Gramm-Leach-Bliley Act of 1999
formalized the repeal of the Glass-Steagall Act and removed all remaining firewalls between
commercial banks and investment-banks.
3.1.2 THE REPEAL OF THE GLASS-STEAGALL ACT
Many economists agree that the trend of deregulation helped exacerbate the severity of the
financial markets. The repeal of the Glass-Steagall Act, which removed the barrier between
commercial banks and investment-banks, commenced an era of megamergers and increasingly
riskier behaviour. However, some economists argue that the repeal of the Glass-Steagall act was
necessary due to the threat of competition that shadow banks posed on traditional banks (FCIC,
2011).
During the 1970s increasing interest rates placed pressure on commercial banks to offer
higher interest rates; however, Regulation Q, from the Glass-Steagall Act, placed a ceiling on the
interest banks could pay on deposits and the amount of interest banks could charge on loans.
Regulation Q’s main purpose was to ensured that competition for deposits did not put upward
pressure on interest rates, thereby providing commercial banks with a cheap source of funds
(consumer deposits) by placing a ceiling on interest rates they could offer to customers (FCIC,
2011). However, shadow banks did not have such restrictions and were therefore able to offer
much more competitive rates (FCIC, 2011). The Glass-Steagall Act left commercial banks at a
competitive disadvantage in comparison to shadow banks. Consumers were attracted to the higher
interest rates offered by shadow banks, and commercial banks began to lose market share. By the
1990s shadow banking had surpassed commercial banking in deposits.
Figure 2 shows the declining market share that traditional banks are have been experiencing
since the 1960s. Shadow Banks have become more popular because they can offer higher returns;
however, this higher return comes at an increased risk cost. The loss of market share gave
commercial banks’ lobbyist justification to ask congress for the repeal the Glass-Steagall Act. In
1999, after a decade of financial deregulation, the Gramm-Leach-Bliley Act was passed (FCIC,
2011). The Gramm-Leach-Bliley Act repealed the remaining restrictions set in place by the
Glass-Steagall Act (FCIC, 2011). The main purpose of the Gramm-Leach-Bliley Act is to make
banks safer, more competitive and more useful to consumers by allowing commercial banks to
engage in underwriting activities (FCIC, 2011).

13
Figure 2: Shadow Banks vs. Traditional banks
Notes: Figure 2 shows the declining trend in customer deposits at commercial banks and the increasing popularity of shadow banks since 1945 to 2011. Chart compiled by author. Data source: (The Federal Reserve, 2013)
Those opposed to the act argued that the mixing of assets could lead to conflicts of interest
and moral hazard that could trigger a financial crash like the one of 1929. John Reed, former co-
CEO of Citigroup, acknowledged to the FCIC that, in hindsight, “the compartmentalization that
was created by Glass-Steagall would be a positive factor,” making less likely a “catastrophic
failure” of the financial system (FCIC, 2011).
3.1.3 IS THE GLASS-STEAGALL ACT JUSTIFIED?
In a report for the Congressional Research Services William D. Jackson evaluated the pros
and cons for preserving the Glass-Steagall Act. The excerpt below is taken from that report
(Jackson, 1987):
The case for preserving the Glass-Steagall Act includes the following arguments.
1. Conflicts of interest characterize the granting of credit -- lending -- and the use of credit -- investing -- by the same entity, which led to abuses that originally produced the Act.
2. Depository institutions possess enormous financial power, by virtue of their control of other people's money; its extent must be limited to
0%#
10%#
20%#
30%#
40%#
50%#
60%#
70%#
80%#
90%#
100%#1945#
1947#
1949#
1951#
1953#
1955#
1957#
1959#
1961#
1963#
1965#
1967#
1969#
1971#
1973#
1975#
1977#
1979#
1981#
1983#
1985#
1987#
1989#
1991#
1993#
1995#
1997#
1999#
2001#
2003#
2005#
2007#
2009#
2011#
Tradi2onal#banking#
Shadow#Banking#
14
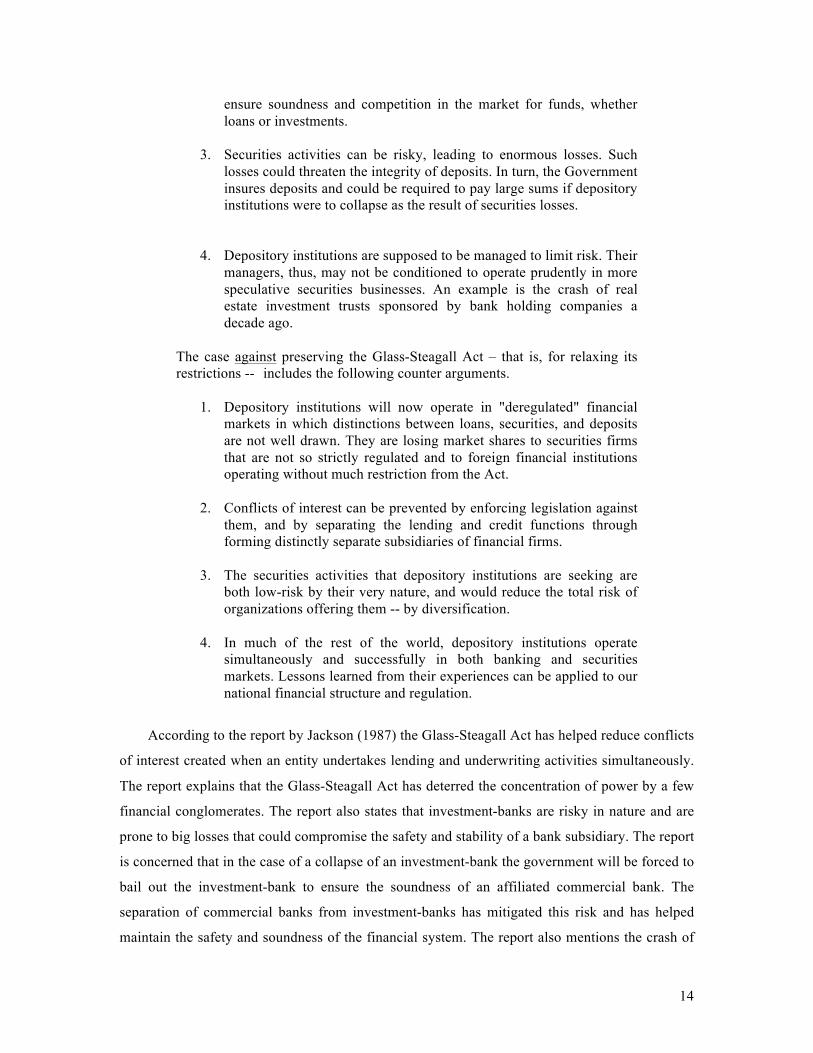
ensure soundness and competition in the market for funds, whether loans or investments.
3. Securities activities can be risky, leading to enormous losses. Such
losses could threaten the integrity of deposits. In turn, the Government insures deposits and could be required to pay large sums if depository institutions were to collapse as the result of securities losses.
4. Depository institutions are supposed to be managed to limit risk. Their managers, thus, may not be conditioned to operate prudently in more speculative securities businesses. An example is the crash of real estate investment trusts sponsored by bank holding companies a decade ago.
The case against preserving the Glass-Steagall Act – that is, for relaxing its restrictions -- includes the following counter arguments.
1. Depository institutions will now operate in "deregulated" financial markets in which distinctions between loans, securities, and deposits are not well drawn. They are losing market shares to securities firms that are not so strictly regulated and to foreign financial institutions operating without much restriction from the Act.
2. Conflicts of interest can be prevented by enforcing legislation against them, and by separating the lending and credit functions through forming distinctly separate subsidiaries of financial firms.
3. The securities activities that depository institutions are seeking are
both low-risk by their very nature, and would reduce the total risk of organizations offering them -- by diversification.
4. In much of the rest of the world, depository institutions operate simultaneously and successfully in both banking and securities markets. Lessons learned from their experiences can be applied to our national financial structure and regulation.
According to the report by Jackson (1987) the Glass-Steagall Act has helped reduce conflicts
of interest created when an entity undertakes lending and underwriting activities simultaneously.
The report explains that the Glass-Steagall Act has deterred the concentration of power by a few
financial conglomerates. The report also states that investment-banks are risky in nature and are
prone to big losses that could compromise the safety and stability of a bank subsidiary. The report
is concerned that in the case of a collapse of an investment-bank the government will be forced to
bail out the investment-bank to ensure the soundness of an affiliated commercial bank. The
separation of commercial banks from investment-banks has mitigated this risk and has helped
maintain the safety and soundness of the financial system. The report also mentions the crash of

15
the real estate investment trust that was sponsored by bank holding companies as an example of
what could happen if commercial banks and investment-banks are allowed to operate under the
same corporate umbrella.
The opposition quotes the loss of market share of commercial banks to shadow banks as the
main reason for repealing the act. The report argues that deregulation is needed to ensure
commercial banks remain competitive against deregulated entities. However, the report also
recommends that if the Glass-Steagall Act is repealed, new regulation should be drafted in order
to eliminate the resulting conflicts of interest. The report also states that the underwriting
activities that commercial banks seek are low-risk in nature and that total risk will be reduced by
means of diversification. Lastly, the report mentions that the American financial system could
learn from banks around the world that have implemented a system of bank holding companies.
However, Joseph Stiglitz Nobel-laureate, writes in an article for Vanity Fair, “[…] without
separation, if a company whose shares had been issued by an investment bank, with its strong
endorsement, got into trouble, wouldn't its commercial arm, if it had one, feel pressure to lend it
money, perhaps unwisely? An ensuing spiral of bad judgment is not hard to foresee” (Stiglitz,
2009). The separation of commercial banks and investment banks, by means of the Glass-Steagall
Act, has ensured that such conflict of interest did not arise. It was because of these financial
malpractices and conflicts of interest, uncovered by the Pecora trial, that the Glass-Steagall Act
was enacted in the first place (Crawford, 2011).
Stiglitz also argues that commercial banks, by their very nature, are designed to be low-risk
(Stiglitz, 2009). It is because of this assumption that the government is able to insure clients’
deposits at commercial banks because the of low probability of a bank failure. Investment-banks
on the other hand are high-risk and have traditionally managed rich people’s investments that are
able to sustain greater financial losses (Stiglitz, 2009). However, when the Glass-Steagall Act was
repealed, the investment banking culture of high-risk became the norm and commercial banks
started to take on bigger risks in pursuit of higher profits.
The main concern of the report, and that of many critics, is that the removal of the firewalls
that have separated commercial banks and investment-banks will create conflicts of interest and
moral hazards that haven’t been present since the Great Depression.

16
3.2 MORE DEREGULATION BY THE SECURITIES EXCHANGE COMMISSION
In 2004, the Securities and Exchange Commission (SEC) amended the way institutions
calculated net capital rule (Kwak, 2012). Some economists argue that this policy change was the
reason that leverage increased to 33:1, up from 12:1 (Blinder, 2009). However, it is not clear
whether this policy change by the SEC had any significant effect on the leverage levels of
investment-banks. The SEC changed the way that investment-banks could calculate their capital
requirements; however, it did not change the leverage restriction of investment-banks
(Anonymous2, 2012). Although it is technically correct that the SEC did not explicitly change the
leverage restrictions on investment banks, the SEC 2004 policy change implicitly allowed
investment-banks to increase their leverage (Kwak, 2012). The SEC 2004 amendment changed
the way that financial institutions calculated their capital requirement (Kwak, 2012). In essence,
institutions could use in-house mathematical models to calculate capital requirements to manage
their risk (Kwak, 2012).
Figure 3: Investment-Banks Leverage 1998-2007
Notes: Figure 3 shows that leverage levels did go up after the 2004 net capital rule change. The graph also shows that there was a trend towards more leverage. It is not known whether the SEC amended the net capital rule due to pressure from the financial community. Source: (Anonymous2, 2012)

17
The SEC net capital rule policy paragraph 15c3-1(c)(2)(vi) states that broker-dealers have to
take a “haircut” when calculating the net value of their assets (Net Capital Requirements for
Brokers or Dealers, 2004). The net capital rule is a form of risk management for broker-dealers.
The haircut is a discount method used by broker-dealers in order to reflect the riskiness of the
assets they hold. The size of the haircut depends on the riskiness of the investment, the riskier the
investment the bigger the haircut (Kwak, 2012). The haircuts ensure that broker-dealers have
enough capital to cover their liabilities and still have sufficient capital to remain solvent (Kwak,
2012). The purpose of this policy change was to increase the value of broker-dealer’s net capital,
without having to raise actual capital (Kwak, 2012). In essence, financial institutions had an
excess of capital after the policy change without actually having raised any new capital.
Nobel-laureate Joseph Stiglitz (2009), and economist Alan Blinder (2009), both agree that
the 2004 SEC change exacerbated the effects of the financial crisis of 2008. After the change
some investment-banks were leveraged as high as 30:1 (a 3 percent decrease in the market value
of their holdings could wipe out these institutions) (Blinder, 2009).
3.3 LESS REGULATION – MORE RISK
The economic turmoil of the 1970s and 1980s began a renaissance of neoclassical
economics. The theories of economist John Keynes (1936) were slowly replaced by the classical
theories of Adam Smith (1776) and neoclassical theories of Milton Freidman (Friedman &
Schwartz, 1963). The revolution of financial deregulation and financial innovation were
responsible for introducing highly complex, opaque, and illiquid financial instruments, such as
collateralized debt obligations (CDOs) and mortgage backed securities (MBSs), which set the
stage for one of the worst financial crises since the Great Depression (Crotty, 2009).
In 1990, banks were allowed to hold certain types of securities of off their balance sheets and
transfer them into Special Investment Vehicles (SIVs) (Crotty, 2009). These SIVs held risky
securities such as MBSs and CDOs (Crotty, 2009). SIVs, unlike the commercial banks that
originated them, did not require any capital reserves to support them (Crotty, 2009). This made
SIVs especially attractive for commercial banks because they could move their risky securities
into one these vehicles without restricting their capital. This ensured financial stability for

18
commercial banks, while SIVs were free to speculate on highly volatile financial instruments
(Crotty, 2009).
SIVs were structured to be separate from the commercial banks that created them in order to
avoid conflicts of interest (Crotty, 2009). Therefore, in theory at least, if an SIV got into trouble,
it did not compromise the stability of the originating bank. However, in reality SIVs were not
completely stand-alone from the originating bank. In order to provide SIVs access to cheap
sources of credit, commercial banks provided SIVs with guaranteed lines of credits that could be
used to provide emergency founding in case of financial trouble (Crotty, 2009). Therefore, in
reality, commercial banks were in fact responsible for the stability of these highly unstable SIVs,
which held highly opaque and complex assets such as CDOs.
Due to the high degree of complexity of CDOs the traditional mark-to-market model of
valuing assets did not work. Therefore, banks had to rely on mathematical models to price CDOs.
However, this mark-to-model approach can be easily manipulated; therefore, the price can also be
easily manipulated. During the financial crisis it became apparent that the financial institutions
that originated these financial instruments did not actually know the true fundamental value of
CDOs (Crotty, 2009).
Another issue with SIVs is that they suffered from maturity mismatch. SIVs borrowed from
the short-term commercial paper market to fund the purchase of long-term assets (Crotty, 2009).
This mismatch made SIVs vulnerable to credit-freeze because they need a constant flow of credit
to keep them afloat (Crotty, 2009). This became a problem during the credit crunch when trust
deteriorated in the markets and banks stopped lending to each other, liquidity had evaporated
overnight (FCIC, 2011).
These risky practices were allowed to continue for many years because there was no
regulation to stop them. The trend of deregulation allowed banks to take on bigger and bigger
risks and become more and more leveraged. The lack of regulation along with the boom in
financial innovation allowed bankers to spread the risk to all corners of the economy in a very
quick and efficient manner. The tearing down of the walls that divided the financial institution,
set up by the Glass-Steagall Act, supported a financial system that was morally hazardous and
financially unstable.
19
3.4 THE MINSKY MOMENT
During the 1970s there was a paradigm shift towards neoclassical economics, which assumes
that markets are efficient and that government intervention and regulation only impedes the
invisible hand of the market. However, the financial crisis of 2008, and new economic research,
once again popularized the theories of Keynes (1936) and Minsky (1992). Keynes and Minsky
both advocate government regulation in order to protect the safety and soundness of the financial
sector.
In order to understand the importance of government regulation of the financial markets, it is
important to understand the theories of Hyman Minsky (1992). Minsky was an economist during
a time when capitalism was the economic law. His view did not make Minsky popular amongst
his contemporaries from the Chicago School (Lahart, 2007). However, after the financial crisis of
2008, Minsky’s theories were once again relevant. Many economists have even dubbed the
current financial crisis the Minsky Moment.
Minsky’s theory contradicts the efficient market hypothesis, which is the reason most
mainstream economists had largely overlooked his work until the financial crisis of 2008. The
implications of an imperfect irrational market means that government intervention is necessary in
order to stabilize the financial system. This view is in stark contrast to Milton Friedman’s view
of unfettered capitalism (Friedman & Friedman, 1979).
Minsky posited in his paper, The Financial Instability Hypothesis, the following two arguments:
The first theorem of the financial instability hypothesis is that the economy has financing regimes under which it is stable, and financing regimes in which it is unstable. The second theorem of the financial instability hypothesis is that over periods of prolonged prosperity, the economy transits from financial relations that make for a stable system to financial relations that make for an unstable system (Minsky, 1992).
Minsky argues that in periods of financial prosperity investors fail to take into account risk.
Investors will borrow to invest thereby creating a bubble. According to Minsky, the financial
system is a viciously cycle that is fueled by positive price feedback; however, this system is not
sustainable, and prices eventually fall.

20
Figure 4: Case-Schiller Index of House Prices in the USA 1890-2000
Notes: Figure 4 shows the house values in the USA from 1890-2000. After adjusting for inflation, the index shows relatively stable and flat house prices. However, in the 2000s there is a steep unwarranted increase in house prices, a tell tale sign of a Minsky moment prompted by irrational exuberance and availability of cheap credit due to securitization. Source: (Anonymous3, 2006)
Figure 4 shows that housing prices remained relatively stagnant throughout the last century,
with the exception of price deflation during the great depression. However, in the late 1990s early
2000s there was an extensive spike in house prices. This is typical behaviour of a Minsky
moment; investors behave irrationally and begin to borrow money to invest, thereby pushing
price higher until an asset bubble is formed. According to Hyman Minsky, it is important to
regulate financial markets in order to restrict the severity of financial bubbles and promote
financial stability (Minsky, 1992). Prudent lending practices can limit the severity of a Minsky
moment.
3.5 TOO BIG TO FAIL
The term too big to fail entered the public zeitgeist after the near collapse of Long-Term
Capital Management. These are financial institutions so large that their collapse could trigger a
systemic collapse of the financial markets. Hence, the government has no choice but intervene if

21
one of these financial institutions were to get into trouble. However, government bailouts have
the adverse effect of creating moral hazard in the financial system. Moral hazard is created when
one party takes on risk and is allowed to reap the rewards; however, the costs are transferred to an
unrelated party. Therefore, too-big-to-fail institutions have an incentive to bet on riskier
investments in order to increase profits because they know the government will protect their
downside. If an investment produced losses so large that it could threaten the survival of a too-
big-to-fail financial institution, then the government is forced to intervene and infuse the
institution with cash in order to contain the problem and prevent a systemic collapse of the
financial markets. Therefore, the larger the financial institution, the greater the moral hazard
because the government is forced to limit any potential downside if it is big enough that it could
disrupt the financial markets.
This was the case with the collapse of Lehman Brothers. The market expected that the
government would bail out Lehman Brothers at the 11th hour. Harvey Miller, the bankruptcy
counsel for Lehman Brothers, told the FCIC that, “they [hedge funds] expected the Fed to save
Lehman, based on the Fed’s involvement in Long-Term Capital Management’s rescue. That’s
what history had proved to [the market]” (FCIC, 2011). Hedge funds were certain that the
government would rescue Lehman Brothers. Richard Fuld, final CEO of Lehman Brothers, was
so certain that the Fed would not let Lehman Brothers fail that he refused many offers from
several financial institutions that could have saved Lehman Brothers. Richard Fuld stated that he
felt the offers were too low and did not reflect the true value of the firm (Plumb & Wilchins,
2008). The government did not bail out Lehman Brothers and on September 2008 Lehman
Brothers filed for bankruptcy (FCIC, 2011).
The moral hazard issue was made even more pronounced by the actions of the Fed. Alan
Greenspan, former chair of the Federal Reserve, explicitly stated that the Fed’s policy on bubbles
was to let them run their course; however, in case of a bubble collapse the Fed will use all of the
tools at their disposal to stimulate economic growth (Greenspan, 2004). This was colloquially
known in the industry as the ‘Greenspan put’ because it allowed for unlimited upside while
protecting the downside (Anonymous4, 2011).
Although moral hazard is not the direct result of deregulation, lack of regulation has allowed
banks to become too big to fail and it has allowed banks to take on large amounts of risk. The

22
lack of regulatory oversight has allowed financial institution to behave recklessly and to take on
dangerous levels of risk.
The biggest hurdle regulators face after decades of deregulation is getting new regulations in
place to prevent these practices. According to Arthur Levitt, former chairman of the Securities
and Exchange Commission, anytime word got out that there was going to be new regulations
lobbyist pushed hard to stop it on its tracks (FCIC, 2011). Financial lobbyist would “harass”
members of the SEC and demand answers to complex questions and frequent appearances of SEC
members before congress in order to waste SEC members’ time and discourage them from
making regulations (FCIC, 2011).
Another issue of too-big-to-fail financial institution is the velocity at which they can spread
risk in the market. Figure 5 shows the rise in the subprime mortgage transactions that occurred
between 1996 and 2008. The breath and reach of financial institutions that had grown too big to
fail, allowed them to churn subprime mortgages faster in order to keep up with market demands.
By 2007, the subprime mortgage sector had dried up and panic ensued in the market (FCIC,
2011).
Figure 5: The Rise in Popularity of Subprime Mortgages
Note: Figure 5 depicts the size of the subprime mortgage market in the USA from 1996 to 2008. The Subprime market increased dramatically from 2000 to the peak of the collapse in 2007 when the market for subprime mortgages declines sharply. Source: (FCIC, 2011).

23
4 DATA ANALYSIS
The data analysis section has been broken into down into two sections. The first section will
examine the effects of 3 policy change on the riskiness profile of banks: SEC 2004 net capital
rule, Regulation Q, and the Gramm-Leach-Bliley Act. The second section will try to provide an
explanation for the observed behaviour during these three key events.
4.1 SECTION I
This section will look at three key events listed above and provide an empirical analysis
based on market data.
4.1.1 SECURITIES AND EXCHANGE COMMISSION 2004 NET CAPITAL RULE
Chart 1 compares the risk of 5 of the top bank holding companies in the United States to the
performance of 3 investment banks and 2 Canadian banks. The Canadian banks are used as a
controlled group to compare banks that were not affected by the SEC 2004 net capital rule policy
change. The Canadian banks betas (β) are observed to be significantly lower than their American
counterparts because, in order to maintain consistency for comparison purposes, the S&P 500 was
used a proxy for market risk rather than the S&P/TSX composite index, which would have been
more appropriate under normal circumstances. The chart uses beta (β) as a measure of systemic
risk and standard deviation (σ) as a measure of volatility of the stock. The chart is divided into
two periods: 1997-2004 (ex ante SEC 2004 net capital rule policy change), and 2005-2012 (ex
post SEC 2004 net capital rule policy change). The purpose of this graph is to measure if bank
holding companies did in fact become more risky after the SEC 2004 net capital rule policy
change. If banks took on more leverage after the 2004 net capital rule policy change, then it is
expected that the added leverage should increase the risk profile of the bank holding companies
and investment banks. Therefore, the beta of the financial institution is expected to be
significantly higher for the post ante period, with the exception of the controlled group, which
should remain relatively leveled
However, this method poses limitation due to the fact that it does not separate the different
factors that drive risk. Bank holding companies contain several different types of operations
under the same umbrella such as; traditional banks, insurance companies, and investment-banks.
The effects of the SEC 2004 net capital rule change might not be entirely reflected on the price of

24
Chart 1: Measure of Banks Beta and Volatility
Chart 1 measure monthly historical beta and volatility of banks changed between 1997-2004 and 2005-2012. Some of the banks behaved contrary to what was expected and reduced their risk profile between these two periods. Chart compiled by author. Data Source: Yahoo Finance Historical data source for Lehman Brothers and Merrill Lynch: Bloomberg Terminal
the stock if other operations of the bank holding company became less risky during the periods
observed. Similarly, the data might show biased results if other operations of the bank holding
company became riskier during the observed periods. If this is the case, then other division of the
bank holding company could skew of the expected results after the SEC policy change.
The observed volatility of the S&P500 remained the same for both the ex ante and post ante
periods; therefore, market volatility can be ruled out as the reason for increased (or decreased)
risk. Both periods chosen also experienced market bubble and relatively low interest rates.
Although the tech bubble and the financial crisis were fundamentally different, it can be assumed
that beta should have increased due to the volatility of the tech bubble and the near collapse of
Long-Term Capital Management.
Chart 1 gives conflicting results; while some banks’ beta did in fact increase significantly as
expected; Citigroup, Bank of America, and Wells Fargo. The remaining banks decreased in risk
over the same periods, Bank of New York, and JP Morgan. The results are also just as conflicting
for the investment banks. Both Lehman Brothers and Merrill Lynch showed increased risk, while
Goldman Sachs showed a decrease in risk over the two periods. The Canadian banks showed less
volatility and almost no increase in systemic risk. This was expected due to the fact that Canadian
banks were less leveraged than their American counter parts and because no significant policy
change affected the Canadian banks risk profile over the two periods observed.
However, a closer examination of the investment banks’ position reveals that Goldman
Sachs was the least leverage out of the three investment banks at the time of the financial crisis,
while Lehman Brothers and Merrill Lynch were leveraged as high as 30:1 during the same period
(see figure 3). This extra leverage amplified the losses of Lehman Brothers and Merrill Lynch
IndexS&P500 CITI BoA BNY JP3Morgan Wells3Fargo Lehman3Brothers Merril3Lynch Goldman3Sachs BNS BMO
β32005G2012 1.000 2.427 2.105 0.851 1.198 0.002 4.167 2.620 1.379 0.738 0.765β31997G2004 1.000 1.459 0.906 1.370 1.663 0.000 2.043 1.625 1.726 0.684 0.447σ32005G2012 0.047 0.169 0.158 0.071 0.090 0.007 0.186 0.172 0.098 0.051 0.067σ31997G2004 0.048 0.095 0.082 0.097 0.113 0.000 0.141 0.116 0.110 0.069 0.063
Bank3Holding3Companies IGBanks Canadian3BanksRisk
25
during the financial crisis, which led to the eventual collapse of Lehman brothers and the takeover
of Merrill Lynch (FCIC, 2011).
During the financial crisis, Lehman Brothers’ beta increased by a factor of 2 to 4.167 up
from 2.043. When comparing volatility of the investment banks it is evident that Lehman
Brothers and Merrill Lynch’s volatility is relatively higher than that of Goldman Sachs. The
volatility (σ) of Lehman Brothers increases as high as 0.186 during the post ante period, while the
volatility (σ) of Goldman Sachs decreased to 0.098, twice as low as Lehman Brothers’ volatility.
Goldman Sachs’ decrease in volatility could be attributed to the fact that it converted to a bank
holding company during the financial crisis in order to get access to TARP money offered by the
government (FCIC, 2011).
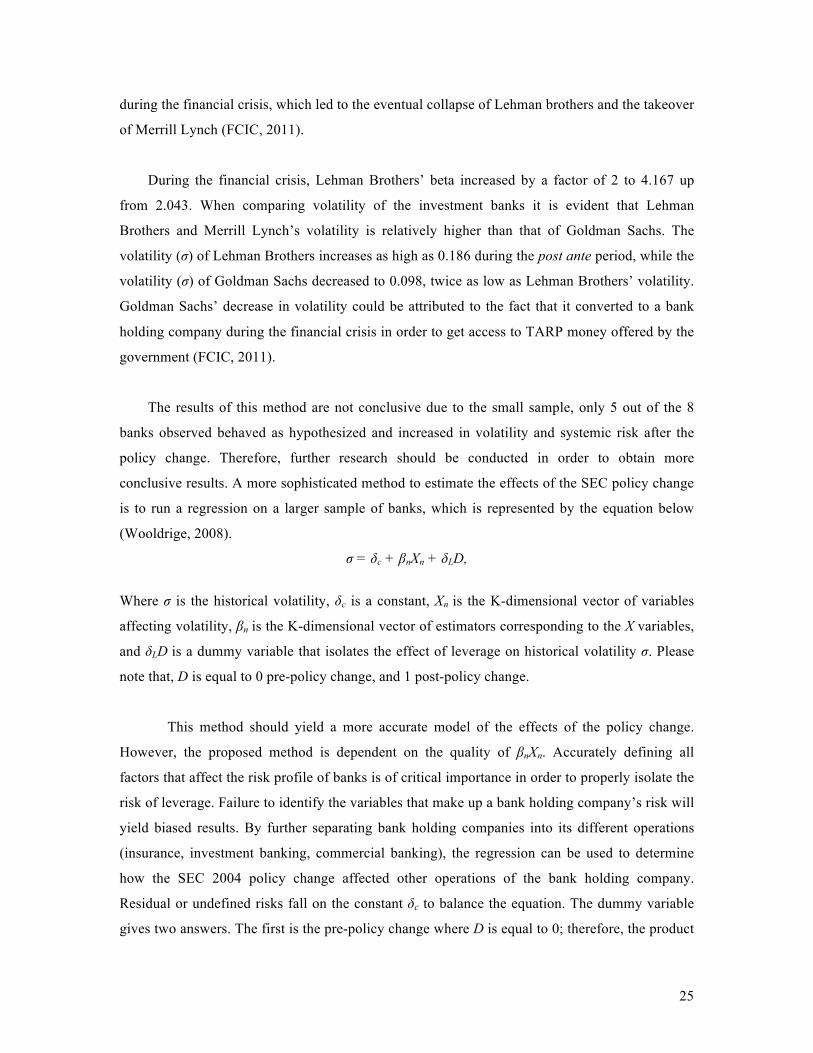
The results of this method are not conclusive due to the small sample, only 5 out of the 8
banks observed behaved as hypothesized and increased in volatility and systemic risk after the
policy change. Therefore, further research should be conducted in order to obtain more
conclusive results. A more sophisticated method to estimate the effects of the SEC policy change
is to run a regression on a larger sample of banks, which is represented by the equation below
(Wooldrige, 2008).
σ = δc + βnXn + δLD,
Where σ is the historical volatility, δc is a constant, Xn is the K-dimensional vector of variables
affecting volatility, βn is the K-dimensional vector of estimators corresponding to the X variables,
and δLD is a dummy variable that isolates the effect of leverage on historical volatility σ. Please
note that, D is equal to 0 pre-policy change, and 1 post-policy change.
This method should yield a more accurate model of the effects of the policy change.
However, the proposed method is dependent on the quality of βnXn. Accurately defining all
factors that affect the risk profile of banks is of critical importance in order to properly isolate the
risk of leverage. Failure to identify the variables that make up a bank holding company’s risk will
yield biased results. By further separating bank holding companies into its different operations
(insurance, investment banking, commercial banking), the regression can be used to determine
how the SEC 2004 policy change affected other operations of the bank holding company.
Residual or undefined risks fall on the constant δc to balance the equation. The dummy variable
gives two answers. The first is the pre-policy change where D is equal to 0; therefore, the product

26
of δLD will equal to 0. The second is the post-policy change in which D is equal to 1; therefore,
the product of δLD will yield the increase in risk that has not been observed in δc or βnXn.
4.1.2 REGULATION Q
Regulation Q was one of the first sections repealed from the Glass-Steagall Act (Gilbert,
1986). Many politicians argued that phasing out of Regulation Q would place upward pressure on
interest rates (Gilbert, 1986). However, due to the interest rate restrictions of Regulation Q,
commercial banks began to lose market share to shadow banks, which were not impeded by such
restrictions (FCIC, 2011). During the 1970s interest rates began to increase and commercial
banks were unable to offer competitive interest rates to attract and retain new deposits (see figure
2). Clients began transferring their money to shadow banks because of the higher yield they
offered (FCIC, 2011). Commercial banks had no choice but to appeal to congress to lift the
Regulation Q.
Figure 6: Interaction between Banks and Thrifts with an Interest Rate Ceiling
Banks Thrifts
Figure 6 shows the interaction between banks and thrift institutions and its effects on interest rates and the supply of money. The actions of banks are dependent on the actions of thrift institutions and vice-versa. Diagram replicated by author. Source: (Gilbert, 1986)

27
The failure of Regulation Q is that it had a static ceiling, which left commercial banks unable
to compete with the more flexible shadow banks (FCIC, 2011). Regulation Q was finally repealed
on March 1986 after a six-year phase out (Gilbert, 1986). This paper will examine the market
dynamics of commercial banks and thrifts in order to determine the effects of an interest rate
ceiling.
During the 1960s commercial banks were in direct competition with thrifts institutions,
which did not have an interest rate ceiling. Thrifts posed a threat of competition for commercial
banks because thrifts were able to offer higher interest rates than commercial banks. In 1966 the
government responded to this threat by placing an interest rate ceiling on thrifts (Gilbert, 1986).
R. Alton Gilbert offers an empirical analysis of the reason why Regulation Q failed and why it
was actually necessary to abolish it (Gilbert, 1986). Gilbert offers a graphic representation of the
interaction between commercial banks and thrift (Gilbert, 1986).
Figure 6 models the interaction between commercial banks and thrift institutions when there
is no interest rate ceiling in effect. Suppose that the system is in equilibrium and that banks offer
interest rate for deposits at rB0, which will yield money supply S(rT
0) and charge interest rate on
loans at C0. Dd0 represents demand for deposits when banks interest rate are rB
0, and DL0 represents
demand for loans when interest rate on deposits are at rB0. Similarly when thrifts institutions are in
equilibrium, they will offer interest rate rT0, which will yield money supply S(rB
0) and charge
interest rate on loans at M0 when the demand curve for loan is DL0. Dd
0 represents the demand for
deposits when interest rate for thrift is at rTo. In this scenario banks and thrifts are both in
equilibrium B0 and T0, respectively.
Although banks and thrifts are close substitutes, they are not perfect substitutes because each
specializes on different markets segments. Thrifts specialize on mortgage lending, while banks
specialize on consumer and business credit. This means that the demand curve for loans for each
institution does not depend on the actions of the other (Gilbert, 1986). The spread between Ddn
and DLn yields the return on capital for each institution (Gilbert, 1986).
Suppose that the system is not in complete equilibrium and interest rates of on deposits
are slightly higher for thrifts institutions than those of commercial banks, rB0 < rT
0. Banks are then
forced to respond by increasing interest rates offered on deposits to rB1, which will shift the
demand curve for deposits at banks to the right to Dd1. In order to maintain the interest rate spread

28
the same as before, the interest rate charged on loans will also need to increase to C1, which will
shift the demand curve for loans to DL1. Due to the fact that thrift and banks are close substitutes,
the actions of one will affect the actions of the other. If the banks raise interest rates to rB1 then the
supply curve of thrifts will shift to the left, S(rB1) because people will prefer to hold their money
in banks instead of thrift institutions due to the higher interest rate paid by bank on deposits. The
shift of the supply curve of thrift to S(rB1) will be followed by an increase of interest rate offered
on deposits to rT1 in order to attract new customers. This will shift the demand for deposits of
thrift to the right to Dd1, thereby automatically increasing interest rate charged on loans to M1. The
demand curve of deposits of banks will shifts to the left S(rT1) in response to thrifts increasing
their interest rate to rT1. This will have the effect of raising interest rates to rB
2 and the whole
process begins again. It becomes apparent that based on this model interest rates will continue to
increase indefinitely to rBn and rT
n if there is no interest rate ceiling in place. Policy makers, based
on this model, believed that the rise in interest rates was due to the interaction between
commercial banks and thrift institutions and decided to place an interest rate ceiling on thrifts
rather than raising the interest ceiling on banks (Gilbert, 1986).
However, the interest rate ceiling on thrifts institutions failed to achieve its desired result and
interest rates continued to climb (Gilbert, 1986) (see figure 7). Instead of lowering interest rates,
banks and thrifts were left unable to compete with shadow banks due to Regulation Q restrictions.
The shadow banking system began to grow in popularity due to their ability to pay higher interest
rates on deposits. The higher interest rates offered by shadow banks created an outflow of
deposits to shadow banks away from the traditional banking systems (see figure 2) whilst
Regulation Q failed to stop the rapid increase in interest rates (see figure 7).
The purpose of Regulation Q was to ensure cheap source of funds by reducing interest
expenses (interest rate offered on deposits) in order to increase banks’ profitability (the interest
rate spread between loans and deposits). However, imposing interest rate ceilings does not
prevent a rise of interest expenses (Gilbert, 1986). If the demand for credit increases interest rate
expenses will rise regardless of interest rate ceilings (Gilbert, 1986). There is little empirical
evidence to support the effectiveness of Regulation Q in maintaining interest rates at low levels.
Figure 7 shows that there was no significant increase in interest rates levels after the repeal of
Regulation Q. Figure 7 also shows that interest rates remained relatively high during the 1970s
and 1980s, and that therefore, the 1966 policy had little effect on interest rate levels.

29
Figure 7: Fed Fund Rate from 1970-2000
Chart shows that interest rates did not go up after 1986 as it was expected. Interest rates remained at stable levels. Chart compiled by author. Data Source: (The Ferderal Reserve Bank of New York, 2008)
Figure 7 shows historical data for the Fed fund rate from 1970 to 2000. Regulation Q was in
effect during the 1960s and 1970s and interest rates continued to rise to higher levels. However,
during the 1990s interests rates decreased and remained relatively stable, even after the repeal of
Regulation Q. The data analyzed does not support the theory that interest rate ceilings are
necessary to ensure the stability of the financial system. Therefore, it seems unlikely that
Regulation Q had much of an effect on the financial crisis of 2008.
4.1.3 A LOOK AT THE REPEAL OF THE GLASS-STEAGALL ACT
The Gramm-Leach-Bliley Act, which repealed the sections of the Glass-Steagall Act that
separated commercial banks and investment-banks, was passed in 1999 in response to the
Citigroup merger (FCIC, 2011). The repeal was a major regulatory change that had profound
impact on the financial landscape. Many economists believe that the repeal fostered an era of
asset concentration by the top 10 banks. This section will examine whether the repeal of the
Glass-Steagall act did in fact encouraged asset concentration.
0"
5"
10"
15"
20"
25"
1971(01(01"
1971(10(01"
1972(07(01"
1973(04(01"
1974(01(01"
1974(10(01"
1975(07(01"
1976(04(01"
1977(01(01"
1977(10(01"
1978(07(01"
1979(04(01"
1980(01(01"
1980(10(01"
1981(07(01"
1982(04(01"
1983(01(01"
1983(10(01"
1984(07(01"
1985(04(01"
1986(01(01"
1986(10(01"
1987(07(01"
1988(04(01"
1989(01(01"
1989(10(01"
1990(07(01"
1991(04(01"
1992(01(01"
1992(10(01"
1993(07(01"
1994(04(01"
1995(01(01"
1995(10(01"
1996(07(01"
1997(04(01"
1998(01(01"
1998(10(01"
1999(07(01"
2000(04(01"
Federal'Fund'Rate'
Federal"Fund"Rate"

30
4.1.3.1 DOES DEREGULATION INCREASE CONCENTRATION OF POWER?
Figure 8: Number of Mergers of Banks and Thrifts from 1994-2003
Notes: Figure 8 shows the number of mergers that took place between 1994 and 2003. The graph shows that the number of mergers peaked in 1998 a year before the Gramm-Leach-Bliley Act repealed the Glass-Steagall Act. The number of mergers diminishes after. More research needs to be done into why there is a decrease; however, a possible explanation is that the pool of desirable banks also decreased. There is also an cumulative effect, which over time increases the size of financial institutions. Chart compiled by author. Data Source: (Pilloff, 2004)
Figure 9: Total Assets Acquired through Mergers from 1994-2003
Notes: Figure 9 gives a better picture of the size of the mergers. Even though the absolute number of mergers may have decreased the graph shows a spike in total assets acquired in 1997. This spike is due to the Citicorp and Travelers Group merger. Chart compiled by author. Data source: (Pilloff, 2004)

31
Figures 8 and 9 show the number of mergers that took place between 1994 and 2003.
Although there seems to be a downward trend in the number of mergers year over year, the size
of the mergers remain relatively stable level year over year during the period observe, with the
exception of 1997, which shows a spike in assets acquired through M&A activities. During the
period observed, the industry’s share of assets of the top 10 banks increased to 46 percent up from
22 percent, and deposits held by the top 10 banks increased to 41 percent up from 19 percent
(Pilloff, 2004). Several factors have contributed to the widespread concentration of assets by a
few financial conglomerates. One of these factors was the easing of interstate banking restrictions
lifted by the Riegel-Neal Interstate Banking and Branching Efficiency Act of 1994 (Pilloff,
2004). This repeal allowed banks to acquire branches in states that were previously out of their
jurisdiction (Pilloff, 2004). The cumulative effect of mergers and acquisitions slowly increase the
market capitalization of the top 10 financial institutions in the United States. The Glass-Steagall
Act was seen as the last remaining barrier to complete market concentration and market
domination.
The repeal of the Glass-Steagall Act in 1999 is seen as an important moment that fueled
the financial crisis of 2008. The Glass-Steagall Act was the last firewall that separated
commercial banks from investment-banks. The enactment of the Gramm-Leach-Bliley Act in
1999 was in response to the merger of Citicorp and Travelers Group. The merger was a watershed
moment in the repeal of the Glass-Steagall Act. The merger was illegal at the time due to the fact
that the Glass-Steagall Act had not been repealed when the merger was approved (Cox, 1999).
Citicorp and Travelers Group formed a new bank holding company, Citigroup, which fell under
the jurisdiction of the Bank Holding Company Act (Cox, 1999). The Bank Holding Company Act
allowed the newly formed company up to two years to divest from its non-banking activities, and
an additional 3 one-year extensions, giving Citigroup a total of 5 years to divest (Cox, 1999). This
grace period was meant to allow newly formed bank holding companies enough time to shed non-
banking activities; however, Citigroup used this time to lobby congress to repeal the remaining
barriers of the Glass-Steagall Act, thus allowing the merger to stand (Cox, 1999).
The pressure and lobbying of the newly formed bank holding companies was seen as the
catalyst that pushed the Gramm-Leach-Bliley Act through. The passage of the Gramm-Leach-
Bliley Act was the final step in deregulating the financial markets and that brought down the
firewalls that had separated commercial banks and investment-banks since 1933. Banks were now
legally allowed to merge with insurance companies and investment-banks in a similar fashion as

32
in they had in the pre-Glass-Steagall period. Several Senators warned about the dangers of
allowing banks to participate in underwriting activities and warned that unregulated markets
would create a financial crisis similar to one experienced in the 1930s (Cox, 1999).
4.1.3.2 RISKS OF CONCENTRATION OF POWER
The debate whether concentration of power increases risk is still a hotly debated subject. The
reason for the repeal of the Glass-Steagall Act was to allow financial institution to grow larger by
means of mergers and acquisitions, and therefore, allow financial institutions greater economies
of scale. However, critics blame deregulation and concentration of power as the result of the
financial crisis. Do banks actually become more risky when they are allowed to compete with no
regulation and no size restrictions?
The data analyzed throughout this paper has shown some evidence to support the theory that
banks become riskier after financial deregulation (see chart 1). The data also shows that
regulation is effective in keeping banks from getting too large (see figure 1). It has already been
argued that concentration of power leads to moral hazard (see section 3.5).
Figure 10: Contagion of Securitization
Note: Figure 10 shows the size of the securitization market from 2000 to 2007. It shows that demand for Asset Back Securities grew exponentially from 2000 to 2007. This cold be due to a number of factors, financial innovation, technological advancement, concentration of power, moral hazard. Source: (A written testimony of Mark Zandi, 2010)

33
Figure 10 shows the exponential increase in Asset Backed Securities, which are highly
complex and opaque financial products. Issuers of Asset Backed Securities were initially unable
to value these financial instruments; however, they finally settled on a mark-to-model approach.
Issuers of these instruments relied heavily on credit rating agencies and mathematical models that
did not reflect the real risk of these financial instruments (Crotty, 2009). The mark-to-model
approach can be easily manipulated by changing the underlying assumptions to unrealistic levels
in order to obtain an optimistically biased value (Crotty, 2009).
Figure 10 shows the propagation of these financial instruments as the asset of choice for
many investors prior to the financial crisis. Financial institution, in pursuit of greater profits,
neglected to mitigate risks and failed to properly adjudicate loans and in the process created toxic
assets. The breadth and reach of the new financial conglomerates helped spread these toxic
financial instruments in the market with greater efficiency than ever before.
However, it is not necessarily the size of the financial institution that increases risk, it is the
speed and efficiency in which these financial conglomerates can transfer toxicity to the market
that is the problem. Financial markets around the world work as a set of closely interacting open
systems, which are highly susceptible to contagion. The breadth and reach of too-big-to-fail
financial conglomerates has increasing the speed of contagion, similar to the way airplanes can
increase the speed of contagion of communicable diseases R0 (R-naught) (Heffernan, Smith, &
Wahl, 2005).
Since the repeal of the Glass-Steagall Act the top 10 financial institutions have jumped from
owning 25 percent of the industry’s assets to over 55 percent (FCIC, 2011). From 1980 to 2003,
the number of financial institutions has decreased from approximately 16,000 branches to about
8,000 branches (Pilloff, 2004). Counter-intuitively, an observer might assume that a decrease in
of the number of financial institutions should also decrease the speed of contagion R0; however,
although the absolute number of financial institution has decrease the newly formed financial
institution are able to interact much more efficiently due to their increased size. Therefore,
concentration of assets increases the speed of R0 due to the efficiency in which financial
institutions are able to churn/securitize financial instruments.

34
Market concentration per se is risk neutral, it is when other factors are considered that
market concentration is said to be risky (see too big to fail section 3.5). The repeal of the Glass-
Steagall Act was the watershed moment that allowed concentration of assets by the top 10 banks.
4.2 SECTION II
This section will try to give an explanation for the observed behaviour in Section I. This
section will use behavioural economics to analyze the effect of deregulation.
4.2.1 THE MINSKY-KINDLEBERGER MODEL
The financial crisis has given new life to the works of Hyman Minsky (1992) and Charles
Kindleberger (Kindleberger & Aliber, 2000). Kindleberger theories are largely built on the works
of Hyman Minsky. Kindleberger identifies three types of bubbles in his book Manias, Panics and
Crashes (Kindleberger & Aliber, 2000). The first bubble is characterized by an accelerated
increase in prices, which is followed by an equally accelerated decline in price levels back to pre-
bubble levels (Kindleberger & Aliber, 2000). The second bubble is much more subtle and hard to
identify, even after it has occurred (Kindleberger & Aliber, 2000). This bubble is characterized by
an increase in prices, which may last for a while and then gradually decreases to back
fundamental levels (Kindleberger & Aliber, 2000). The third bubble and most dangerous bubble
is characterized by an extended increase in prices, which is followed by a gradual decline, and
finally by a sharp decline in price levels usually back to pre-bubble levels.
The financial crisis of 2008 experienced all three types of bubbles types (Rosser, Rosser, &
Gallegati, 2012); however, this paper will focus on the third bubble type and whether regulation
could have prevented this type of bubble from forming.
The third bubble type is characterized by 5 stages (Montler, 2008). The first stage is
displacement, which relates to a new investment opportunity that displaces profits in other sectors
(Montler, 2008). The displacement during the financial crisis was the financial innovation of
CDOs. The second stage is credit creation and the nurturing of a bubble, which relates to the
expansion of credit through monetary policy (Montler, 2008). During the early 2000s interest rate
were at historically low levels and credit was readily available. The third stage is Euphoria, this is
when the market receives positive feedback and investors begin to increase demand, which puts

35
upward pressure on the price level of the new the investment opportunity, at this stage risk is
rarely considered by investors (Montler, 2008). This phenomenon was experience in the early
2000s when the demand for CDOs inflated prices beyond their fundamental levels. The fourth
stage financial distress is when insiders become aware of the situation and begin to cash out. This
lowers the price levels and the leverage that has been built up over the first three stages becomes
a major issue (Montler, 2008). There was a relatively small price correction in 2007 leading up to
the crash of 2008. The final stage is revulsion, which is when investors are so scared by the
events that they refuse to invest and market prices falls below fundamental levels (Montler,
2008). All of the stages of the bubble type III of the Kindleberger-Minsky model were clearly
defined during the financial crisis of 2008.
Many economists have begun to take the theories of Hyman Minsky seriously after the
financial crisis of 2008. Kindleberger and Minsky provide a model that has great explanatory
power regarding the formation of bubbles.
4.2.2 FINANCIAL CRISIS OF 2008 FROM A MINSKY PERSPECTIVE
The stock market crash of 2008-2009 exhibited type III bubble patterns as explained by the
Kindleberger-Minsky model (Kindleberger & Aliber, 2000). The bubble reached a peak on
October of 2007 after a steady increase of asset prices (Rosser, Rosser, & Gallegati, 2012). This
gradual increased was followed by a relatively small price correction in 2007 (Rosser, Rosser, &
Gallegati, 2012). Eventually falling dramatically after the collapse of Lehman Brothers (Rosser,
Rosser, & Gallegati, 2012). It finally reached a bottom on March 2009, form which it has not
fully recovered (Rosser, Rosser, & Gallegati, 2012). The stock market crash of September 2008
played a crucial part in the decline of consumer consumption and GDP. This pattern observed
closely resembles the models of Minsky (1992) and Kindleberger (Kindleberger & Aliber, 2000).
4.2.3 CAN REGULATION PREVENT A MINSKY BUBBLE?
According to Barkley Rosser et al. (Rosser, Rosser, & Gallegati, 2012), it is possible to
restrain such bubble formation; however, it is a difficult to impose legislation to prevent financial
bubbles. Rosser gives two reasons that explain why imposing new legislation is so difficult
during a financial bubble (Rosser, Rosser, & Gallegati, 2012). The first reason is that financial

36
bubbles are not necessarily bad. The second reason is that it is hard to implement new legislation
due to the perceived increase in wealth that occurs during a boom phase.
Financial bubbles are often accompanied by major expansion of real investment (Rosser,
Rosser, & Gallegati, 2012). For instance, the dotcom bubble was accompanied by real investment
in fiber optics and other valuable infrastructure directly attributed to the dotcom bubble (Rosser,
Rosser, & Gallegati, 2012). Thus, it can be argued that bubbles can have positive impact on the
real economy. Therefore, the government needs to strike a balance between too little regulation
and too much regulation.
The second caveat is the difficulties of implementing anti-bubble legislation once a bubble
has begun (Rosser, Rosser, & Gallegati, 2012). During a financial bubble people’s perceived
wealth also increases. Any type of anti-bubble measures is seen as an impediment to wealth
creation and therefore susceptible to public backlash (Rosser, Rosser, & Gallegati, 2012).
The Minsky model predicts that a bubble is hard to contain once it forms. Investors become
more optimistic and begin to borrow money in order to invest (Minsky, 1992). This places
upward pressure on price levels, thereby feeding the bubble even further and price levels begin to
diverge from fundamental prices (Minsky, 1992). The leverage problem is exacerbated by the
availability of cheap credit (Minsky, 1992). Even in regulated markets it is hard to police against
relaxed credit. Financial institutions will usually find a way to get around regulation through
financial innovation (Rosser, Rosser, & Gallegati, 2012).
One of the main difficulties in creating anti-bubble legislation is that each bubble is different
and each bubble requires a unique set of legislation. Therefore, the government needs to be
careful against implementing broad anti-bubble legislation that could hamper economic growth in
unintended sectors (Rosser, Rosser, & Gallegati, 2012).

37
5 CONCLUSIONS
It is evident that the causes of the financial crisis of 2008 are complex and not fully
understood and there are valid arguments on both side of the issue of deregulation. This paper has
not found definitive proof that the financial crisis of 2008 was directly caused by the trend of
deregulation. However, there is strong evidence presented that deregulation did in fact played an
important role in the instability of the markets that led to the worst financial crisis since the Great
Depression.
This paper identified three key events that had the biggest impact on the financial crisis of
2008. The first event is the repeal of the Glass-Steagall Act, which allowed asset concentration
and the merging of commercial banks with investment-banks. The second event is the phase out
of Regulation Q in 1980, which removed interest rate ceilings imposed on commercial banks and
thrift institutions. The last event is the SEC 2004 net capital rule amendment, which increased the
leverage of investment-banks. Although the analysis did not yield conclusive results, there is
strong evidence that supports the link between financial deregulation and increase risk. Therefore,
more in-depth research needs to be carried out to conclusively establish a link between financial
deregulation and increased risk.
Mergers and Acquisition transactions increased significantly after the repeal of the Glass-
Steagall act. This led to a concentration of market assets by the top 10 American banks. The
Glass-Steagall Act was therefore successful in its purpose of preventing concentration of power.
Economist and politicians worried about the consequences of allowing market concentration.
Moral hazard is often cited as unintended consequence of allowing financial institutions to
become too large. A link between market size and risk profile cannot be clearly established due to
the complexity of variable involved.
Regulation Q showed little empirical evidence to support a need for interest rate ceiling.
During the 1970s interest rates continued to increase regardless of Regulation Q. An interest
ceiling actually had the opposite effect of its intended purpose and squeezed commercial banks’
profits. Moreover, after the phase out of Regulation Q in 1986, interest rate failed to experience
dramatic increases as policy makers had feared. Although market bubbles are fueled by the
availability of cheap credit (stimulated by low interest rates), interest rate ceilings on financial
institutions do not seem to affect market interest rate. Market interest rate act independently of

38
interest rate ceilings, thereby leaving regulated financials institutions unable to compete against
unregulated competitors. Therefore, there seems to be little empirical evidence to support an
interest rate ceiling.
Lastly, the SEC 2004 net capital rule policy change showed to be a significant factor in the
increased risk of investment-banks. Banks’ leverage and systemic risk increased significantly
after the SEC 2004 policy change. However, more conclusive research needs to be conducted in
order to conclusively establish as link between SEC 2004 policy change and increased levels of
leverage. Due to the limitation of the methods used a conclusive answer cannot be extrapolated
from the observed data, therefore, this event merits further examination.
According to Minsky, the government plays an important role in ensuring the financial
stability of the financial markets and bubbles will continue to form unless better regulation is
adopted. Therefore, it is important to learn from our past mistakes in order to prevent future ones.

39
6 REFLECTION
The major research paper was an overall positive experience. My focus was on the
regulatory framework of the United States. I am fortunate enough to have lived through one of
the most important financial anomalies in history, and as a student of finance, I believe it is
important to understand the factors that caused the financial crisis of 2008. I learned that the
economy is far too complex to conclusively blame one factor over another. Rather, the financial
crisis was a culmination of failures from market participants, regulators and leaders. Everyone in
the system had something to gain from turning a blind eye to the blatant disregard for moderation.
At first, the task of distilling the massive amount of information into a comprehensible and
logical project seemed daunting and overwhelming. The first few weeks were mostly spent
reading journals and articles in order to gain a based knowledge of the important factors.
However, as the weeks went by and the more I read, I began to formulate a plan on how I would
approach the format of the paper. The first and most crucial part for me were the first few weeks
when I was writing the literature review, as this gave me a clear direction in which way to steer
my paper.
The second part was the data analysis. I found this part to be the most fun as I could apply
my own approach. I found that the best way to tackle this was when I was doing something
unrelated. Whenever, I would concentrate on other activities and come back to the paper with a
fresh perspective. Once I had an idea I would begin collecting the data and applying the
appropriate approach. I do not have an econometrics background; however, some of the elements
of the research forced me to learn, at the very least, basic econometric theories. This was one the
most time consuming parts of the project since I had to first learn and understand the theory
before I could apply it to the paper. However, this was also one of the most rewarding parts of the
project since I learned new skills and knew knowledge in the process.
I also learned about new economist, which I had no exposure to prior to the MRP. It shifted
my view of economics as a pure science to one that is part science, part art. One cannot simply
take the observation at face value, an intimate knowledge of human psychology is needed in order
to make sense of the observe data. Many of the best theories in economics have imbedded some
element of human psychology. It is important to question the status quo is it does not make sense.

40
The ability to critically assess has advanced human knowledge. It is exciting when theories
do not work and there is a need for a new and better model. I came across this while I was
conducting my research for my MRP. Purchasing Power Parity is a theory, which is still used
today; however, this theory has been proven not to hold when analyzed with advanced
econometric tools. Why is still being used? Because it is the best theory we have right now.
However, there is room to improve this concept, or provide an explanation as to why it does not
hold. This element of mystery has sparked my interest in pursuing a PhD in econometrics.
Overall, the MRP was a positive and rewarding experience, which brought together
everything I had learned during my academic background, as well as my professional experience.
I was also fortunate enough to have been mentored by a very knowledgeable supervisor. Part of
my success is due to the guidance of my supervisor. He ensured that I kept my research on track
and provided valuable feedback at crucial times. The most challenging part was juggling the
workload of my summer semester and the MRP. I spent many sleepless nights researching,
writing and editing. However, it was very rewarding when it all finally came together!

41
7 BIBLIOGRAPHY A written testimony of Mark Zandi. (2010). The causes and current state of the financial crisis.
Financial Crisis Inquiry Commission. Anonymous. (1999). Congressional record: Proceeding and debates of the 106th congress (1st
Edition ed., Vol. 145). Anonymous2. (2012, January 14). The Lo down. Retrieved July 14, 2013, from The Economist:
http://www.economist.com/node/21542781 Anonymous3. (2006, 08 26). A history of home values. Retrieved July 14, 2013, from The New
York TImes: http://www.nytimes.com/imagepages/2006/08/26/weekinreview/27leon_graph2.html
Anonymous4. (2011, August 11). Don't you miss the Greenspan put? Retrieved July 15, 2013,
from The Economist: http://www.economist.com/blogs/freeexchange/2011/08/markets-and-fed
Barth, J. R., Brumbaugh Jr., R. D., & Wilcox, J. A. (2000, April). The repeal of the Glass-
Steagall Act and the advent of broad banking. OCC Economics. Blinder, A. S. (2009, January 24). Six errors on the path to the financial crisis. The New York
Times, B7. Cox, L. J. (1999). The Impact of the Citicorp-Travelers Group merger on financial modernization
and the repeal of Glass-Steagall. Harvard Law School Library. Crawford, C. (2011). The repeal of the Glass-Steagall act and the current financial crisis (Vol.
9). Manhattan, NY: Journal of Business & Economic Research. Crotty, J. (2009). Structural causes of the global financial crisis: a critical assessment of the ‘new
financial architecture’. Cambridge Journal of Economics. Dorgan, B., Harkin, T., & Reid, H. (2000). Responses to questions concerning Long-Term
Capital Management and related events. Washington, D.C.: United States General Accountability Office.
Edwards, F. (1999). Hedge funds and the collapse of Long-Term Capital Management (Vol. 13).
The Journal of Economic Perspectives. FCIC. (2011). The financial crisis inquiry report. Friedman, M., & Friedman, R. D. (1979). Free to choose. A Harvest Book. Friedman, M., & Schwartz, A. J. (1963). A monetary history of the United States, 1867-1960.
U.S.A.
42
Gilbert, R. A. (1986). Requiem for regulation q: What it did and why it passed away. Federal Reserve Bank of St. Louis Review 68.
Greenspan, A. (2004). Risk and uncertainty in monetary policy. The Federal Reserve Board,
American Economic Association, San Diego, CA. Heffernan, J. M., Smith, R. J., & Wahl, L. M. (2005). Perspectives on the basic reproductive
ratio. London, Ontario, Canada: Journal of the Royal Society Interface. Jackson, W. D. (1987). Glass-Steagall act: Commerical vs investment banking. Congressional
Research Service, Economic Division. Keynes, J. M. (1936). The general theory of employment, interest and money. New York, New
York, U.S.A.: Harcourt, Brace and Company. Kindleberger, C. P., & Aliber, R. Z. (2000). Manias, panics and crashes: A history of financial
crises. (4. Edition, Ed.) Wiley. Kwak, J. (2012, January 20). What did the SEC really do in 2004. Retrieved July 14, 2013, from
The Baseline Scenario: http://baselinescenario.com/2012/01/30/what-did-the-sec-really-do-in-2004/
Labaton, S. (1999). Congress passes wide-ranging bill easing bank laws. The New York Times. Lahart, J. (2007, 08 18). In time of tumult, obscure economist gains currency. Retrieved July 14,
2013, from The Wall Street Journal: http://online.wsj.com/public/article/SB118736585456901047.html#articleTabs=article
Minsky, H. (1992). The financial instability hypothesis (Vol. 74). (E. E. Philip Arestis and
Malcolm Sawyer, Ed.) New York: The Jerome Levy Economics Institute of Bard College.
Montler, J. (2008). Financial market bubbles: From euphoria to credit collapse revulsion.
Retrieved July 25, 2013, from The Market Oracle: http://www.marketoracle.co.uk/Article5108.html
Mother Jones. (2010, 02). How banks got too big to fail. Retrieved July 14, 2013, from Mother
Jones: http://www.motherjones.com/politics/2010/01/bank-merger-history Net Capital Requirements for Brokers or Dealers. (2004). Title 17. C.F.R. Pilloff, S. J. (2004). Bank merger activity in the United States, 1994-2003 (Staff Study 176 ed.).
Board of Governors of the Federal Reserve System. Plumb, C., & Wilchins, D. (2008, September 14). Lehman CEO Fuld's hubris contributed to
meltdown. Retrieved July 14, 2013, from Reuters: US Edition: http://www.reuters.com/article/2008/09/14/us-lehman-backstory-idUSN1341059120080914

43
Rosser, J. B., Rosser, M. V., & Gallegati, M. (2012, June). A Minsky-Kindleberger perspective on the financial crisis. 46(2). Journal of economics.
Smith, A. (1776). An inquiry into the nature and causes of the wealth of nations. Stiglitz, J. E. (2009, January). Capitalist fools. Vanity Fair. Stiglitz, J. E., & Weiss, A. (1981). Credit rationing in markets with imperfect information (Vol.
71). American Economic Association. The Federal Reserve Bank of New York. (1933). The Banking Act of 1933. The Federal Reserve. (2013). Flow of funds report. The Ferderal Reserve Bank of New York. (2008, 12 22). Historical changes of the target federal
funds and discount rates. New York. Wooldrige, J. M. (2008). Introductiory econometrics, a modern approach (4th Edition ed.).
Cengage Learning.