An analysis of Solid waste generation and waste … · especially with regard to heavier...
14
International Journal of Agricultural Policy and Research Vol.2 (2), pp. 076-089, February 2014 Available online at http://www.journalissues.org/ijapr/ © 2014 Journal Issues ISSN 2350-1561 Original Research Paper An analysis of the household solid waste generation patterns and prevailing management practices in Eldoret town, Kenya Accepted 25 January, 2014 * Okalebo, S.E., Opata, G.P., and Mwasi, B.N. Division of Environmental Monitoring, Planning and Management, University of Eldoret, Kenya. *Corresponding Author Email: [email protected] Tel.: +254721261997 Rapid urbanization and consequent collapse of solid waste management of cities is a global phenomenon and Kenya is no exception. This paper reports on patterns of household solid waste generation in two distinct residential zones that make up the Eldoret town, Kenya – the medium density residential (Kapsoya) and high density residential (Munyaka). It gives details on composition of household wastes and the components that are recyclable. It attempts to address the different types of existing waste management practices, the actors and waste generation volumes per family. Data was collected through questionnaires from 192 households and descriptive analysis of central tendency was used. In comparing the various household waste generation of waste (estimated by weight), it showed that with social status increase the per capita waste generation increases, especially with regard to heavier biodegradable organic waste with accounts for three quarters of total waste. Differences in livelihood patterns between the residential estates and resident’s possibilities for livestock raising influence the scale and composition of household waste. Finally the research highlights the importance of incorporation of the 4Rs and participation of all stakeholders with the development of an integrated waste recycling depot in the residential estates. Key words: Waste management, biodegradable, urbanization, management practise INTRODUCTION Waste generation, both domestic and industrial, continues to increase world-wide in tandem with growth in consumption. In developed countries, per capita waste generation increased nearly three-fold over the last two decades, reaching a level five to six times higher than that in developing countries (UNEP 2005). With increases in populations and living standards, waste generation in developing countries is also increasing rapidly, and may double in volume in the current decade. If current trends continue, the world may see a five-fold increase in waste generation by the year 2025. Based on available literature it has been confirmed that urban governments in many African countries are facing serious problems with the management of solid waste. Solutions developed for the developed countries are often not appropriate to contexts in the developing countries (World Bank, 1999; ITDG-EA, 2004; UNEP, 2005). Solid Waste Management (SWM) in most developing countries is characterized by inefficient collection methods, insufficient coverage of the collection system and improper disposal of municipal solid wastes. Funding for waste management is always inadequate, and real costs are never fully recovered. Most towns in Kenya including Eldoret do not collect the totality of wastes generated, and of the wastes collected, only a fraction receives proper disposal (Figure 1). The present waste management system for Eldoret like other Kenyan urban centres is showing signs of collapse. Studies conducted by UNCHS (UNCHS, 2001), Kibwage (Kibwage,
Transcript of An analysis of Solid waste generation and waste … · especially with regard to heavier...

International Journal of Agricultural Policy and Research Vol.2 (2), pp. 076-089, February 2014 Available online at http://www.journalissues.org/ijapr/ © 2014 Journal Issues ISSN 2350-1561
Original Research Paper
An analysis of the household solid waste generation patterns and prevailing management practices in Eldoret
town, Kenya
Accepted 25 January, 2014
*Okalebo, S.E., Opata, G.P., and Mwasi, B.N.
Division of Environmental Monitoring, Planning and
Management, University of Eldoret, Kenya.
*Corresponding Author
Email: [email protected] Tel.: +254721261997
Rapid urbanization and consequent collapse of solid waste management of cities is a global phenomenon and Kenya is no exception. This paper reports on patterns of household solid waste generation in two distinct residential zones that make up the Eldoret town, Kenya – the medium density residential (Kapsoya) and high density residential (Munyaka). It gives details on composition of household wastes and the components that are recyclable. It attempts to address the different types of existing waste management practices, the actors and waste generation volumes per family. Data was collected through questionnaires from 192 households and descriptive analysis of central tendency was used. In comparing the various household waste generation of waste (estimated by weight), it showed that with social status increase the per capita waste generation increases, especially with regard to heavier biodegradable organic waste with accounts for three quarters of total waste. Differences in livelihood patterns between the residential estates and resident’s possibilities for livestock raising influence the scale and composition of household waste. Finally the research highlights the importance of incorporation of the 4Rs and participation of all stakeholders with the development of an integrated waste recycling depot in the residential estates. Key words: Waste management, biodegradable, urbanization, management practise
INTRODUCTION Waste generation, both domestic and industrial, continues to increase world-wide in tandem with growth in consumption. In developed countries, per capita waste generation increased nearly three-fold over the last two decades, reaching a level five to six times higher than that in developing countries (UNEP 2005). With increases in populations and living standards, waste generation in developing countries is also increasing rapidly, and may double in volume in the current decade. If current trends continue, the world may see a five-fold increase in waste generation by the year 2025. Based on available literature it has been confirmed that urban governments in many African countries are facing serious problems with the management of solid waste. Solutions developed for the
developed countries are often not appropriate to contexts in the developing countries (World Bank, 1999; ITDG-EA, 2004; UNEP, 2005). Solid Waste Management (SWM) in most developing countries is characterized by inefficient collection methods, insufficient coverage of the collection system and improper disposal of municipal solid wastes. Funding for waste management is always inadequate, and real costs are never fully recovered.
Most towns in Kenya including Eldoret do not collect the totality of wastes generated, and of the wastes collected, only a fraction receives proper disposal (Figure 1). The present waste management system for Eldoret like other Kenyan urban centres is showing signs of collapse. Studies conducted by UNCHS (UNCHS, 2001), Kibwage (Kibwage,

Int. J. Agric. Pol. Res. 077
Waste Collection statistics for July 2004 - June 2005
0
1000
2000
3000
4000
5000
6000
7000
8000
Jul-
04
Aug-
04
Sep-
04
Oct-
04
Nov-
04
Dec-
04
Jan-
05
Feb-
05
Mar-
05
Apr-
05
May-
05
Months
To
nn
es
of
wa
ste
Tonnes Collected
Estimated Refuse
Figure 1: Waste collection statistics for July 2004 - June 2005 for EMC. Source: EMC
Figure 1: Waste collection statistics for July 2004 - June 2005 for EMC. Source: EMC
2002), ITDG-EA (ITDG-EA, 2004), Kiplagat (Kiplagat, 1999) and Syagga (Syagga, 1993b) identified the various factors that inhibit local authorities like EMC, in waste management operations. The factors found relevant and applicable to Eldoret according to the survey are as follows. First within the EMC, problems of low pay, poor morale, inadequate staff and resources are evident. This has affected infrastructure service provision complicated further by entrenched political (and financial) interests. Secondly in the EMC expertise and capabilities in key areas of urban management are lacking. Among the waste management staff are civil servants who lack the decision-making authority, experience, and accountability.
Thirdly since the public confidence in EMC is weak, the private sector and community have showed little interest in participating in action to the municipality’s issues. The policy and implementation instruments available to EMC are limited towards the adoption of multilevel governance. Fourthly large sectors of the town’s economy is in the ‘informal sector’, making EMC’s traditional planning and regulatory instruments unable to influence development or act upon environmental problems hence inadequate coverage. Fifth, the scale and diversity of the problems confronting the EMC is daunting that crisis-management has become the normal mode of action. The complex human population dynamics in Eldoret characterized by population explosion has further aggravated the problems.
There has been lack of focused community participation, which could play a big role in understanding the socio-cultural aspects affecting the generation, collection, disposal and recycling of solid waste in Eldoret. The bylaws and regulations are currently outdated and too weak in
penalties to deter offenders. Finally the EMC uses of improper technology, imported from the developed countries. Many at times are the vehicles broken down and lack spare parts, hence making maintenance expensive.
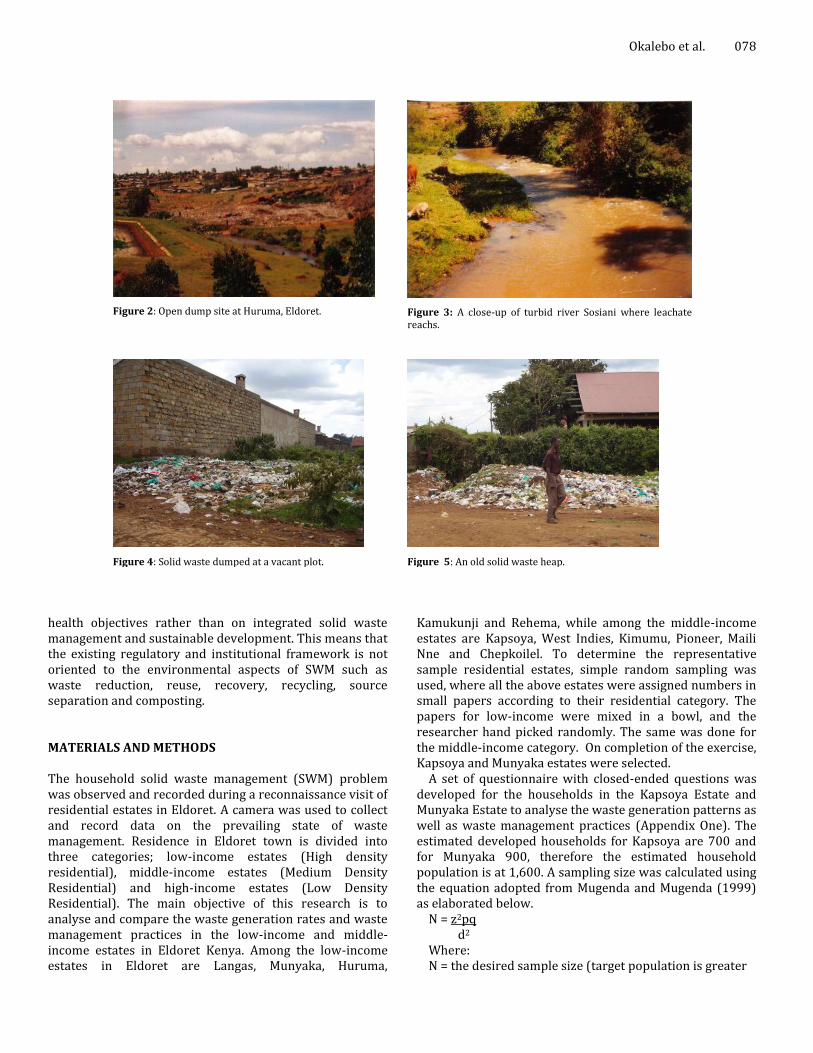
The insufficient collection and inappropriate disposal of solid wastes represent a source of water, land and air pollution, and pose risks to human health and the environment. A high proportion of the waste collected is disposed in undesignated waste disposal sites, including roadsides, drains and other public utility areas (Figures 2, 3, 4 and 5). Studies on solid waste generally consider the city as a single entity and fail to take into account either variation in waste generation from one residential zone to another or changes over the years (Baud 2002, UNEP, 1999a). In areas that lack refuse collection –usually low-income communities– residents tend to either dump their garbage in open pits at the nearest vacant plot, public space, road, river, or simply burn it in their backyards.
A large proportion of the population therefore does not have regular garbage collection services from the EMC (Syagga 1993b) This has created room for non-municipal or non-public actors in the form of partnerships to engage themselves in various activities related to SWM, including the collection, transportation and disposal, as well as recovery, re-use and recycling of waste materials (World Bank, 1999) Most of these partnerships, however, are not officially recognised. Their activities are unregulated and the socio-economic, environmental and public health impacts of these activities are not clearly outlined. This is because in Eldoret, the municipality's legislative and regulatory systems as well as the instruments for service delivery are focused on traditional or conventional public
Okalebo et al. 078
Figure 2: Open dump site at Huruma, Eldoret.
Figure 3: A close-up of turbid river Sosiani where leachate reachs.
Figure 4: Solid waste dumped at a vacant plot.
Figure 5: An old solid waste heap.
health objectives rather than on integrated solid waste management and sustainable development. This means that the existing regulatory and institutional framework is not oriented to the environmental aspects of SWM such as waste reduction, reuse, recovery, recycling, source separation and composting. MATERIALS AND METHODS The household solid waste management (SWM) problem was observed and recorded during a reconnaissance visit of residential estates in Eldoret. A camera was used to collect and record data on the prevailing state of waste management. Residence in Eldoret town is divided into three categories; low-income estates (High density residential), middle-income estates (Medium Density Residential) and high-income estates (Low Density Residential). The main objective of this research is to analyse and compare the waste generation rates and waste management practices in the low-income and middle-income estates in Eldoret Kenya. Among the low-income estates in Eldoret are Langas, Munyaka, Huruma,
Kamukunji and Rehema, while among the middle-income estates are Kapsoya, West Indies, Kimumu, Pioneer, Maili Nne and Chepkoilel. To determine the representative sample residential estates, simple random sampling was used, where all the above estates were assigned numbers in small papers according to their residential category. The papers for low-income were mixed in a bowl, and the researcher hand picked randomly. The same was done for the middle-income category. On completion of the exercise, Kapsoya and Munyaka estates were selected.
A set of questionnaire with closed-ended questions was developed for the households in the Kapsoya Estate and Munyaka Estate to analyse the waste generation patterns as well as waste management practices (Appendix One). The estimated developed households for Kapsoya are 700 and for Munyaka 900, therefore the estimated household population is at 1,600. A sampling size was calculated using the equation adopted from Mugenda and Mugenda (1999) as elaborated below.
N = z2pq d2 Where: N = the desired sample size (target population is greater

Int. J. Agric. Pol. Res. 079
Figure 6: Waste dumped in open pits outside compounds and the roads.
Figure 7: Livestock grazing in areas littered with plastic wastes.
than 10,000) z = the standard normal deviate at the required
confidence level p = the proportion in the target population estimated to
have characteristics being measured. q = 1 – p d = the level of statistical significance set.
Hence the proportion of the target population has certain characteristic of .50, the z-static is 1.96 and the desired accuracy at 0.5 level, the sample size is:
N = (1.96)2 (.50) (.50) (0.05)2 = 384 The calculations gave a sample size of 348. However due
to limitations of funds only 192 questionnaires were administered. Questionnaires were administered by 8 research assistants who were students from Eldoret Polytechnic. Each research assistant surveyed a maximum of 25 households an average of 5 households per day. The survey was conducted early March. The questionnaires were distributed to respondents using systematic sampling. That is by randomly selecting the house at the end of a street; which was interviewed and followed the next, three houses away. In the event the third house was empty, the interviewer chose the immediate house next to it either on the left or right. In terms of geographical size, Kapsoya estate is larger, whereas in Munyaka the residents cluster together, hence a sample of 100 respondents for Kapsoya and 92 respondents for Munyaka was sought. The data collected was analysed using descriptive frequencies of central tendency, in SPSS software, to provide the qualitative data useful in development of a spatial design brief for recycling depots. Munyaka estate Munyaka is a mixed density settlement of over 800 residential plots whose population of over 5,000 people.
Wastes are disposed of outside the compounds and along the roads (Figure 6). It is common to see pigs, cows and poultry that are kept in Munyaka, feeding at the pits (Figure 7). Kapsoya estate This is a medium-income sites and services scheme in Eldoret. It is located at the northeastern part of the municipality bordering Munyaka settlement. The Kapsoya scheme has a total of 1,200 serviced plots that were allocated to applicants through a ballot system. Residents at the periphery of the estate prefer to dump their waste at the end of the streets. Very few residents keep livestock and poultry such that there were few isolated cases of animal excreta dumped on the roads (Figure 8). An 11 tonne bulk container has been located at Kapsoya centre but is always overflowing with uncollected garbage (Figure 9). Undeveloped plots have also been targeted for dumping of waste RESULTS Questionnaires were administered to 100 respondents for Kapsoya and 92 respondents for Munyaka. From the Figure 10 below there were more female respondents in Munyaka Estate than Kapsoya Estate. There were also more male respondents in Kapsoya Estate than Munyaka Estate. Despite this difference, there was no bias in selection of the respondents for questionnaires were administered during the day when most waste management activities are performed. This revealed that future SWM players who conduct in the day activities will work largely with women as waste generators.
In Figure 11 below, a majority of the household sizes in Kapsoya are between 4 to 9 persons and produce waste quantities per house that range from 0.5 kg to over 2 kg. The higher the number of persons in a family, the higher

Figure 8: Animal refuse has been dumped on the access road.
Figure 9: Overflowing waste in 11 tonne waste container vermin invaded.
Figure 8: Animal refuse has been dumped on the access road.
Figure 8: Animal refuse has been dumped on the access road.
Figure 9: Overflowing waste in 11 tonne waste container vermin invaded.
Figure 9: Overflowing waste in 11 tonne waste container vermin invaded.
the quantities of waste produced. The figure 2 reveals that a majority of the household sizes in Munyaka are between 4 to 12 persons, with households producing from 0.5 kg to 2 kg. A number of 6 to 8 households are found in a single plot, therefore the amount of waste from a plot ranges from 3 kg to 16 kg per day. The correlation between a individual’s income and the amount of solid wastes generated indicates that wealthier individuals consume much more than lower income.
Residents in Munyaka, expressed a higher interest towards recycling waste compared to Kapsoya, (Figure 12). In both cases paper in the form of newspapers and carton boxes, beverage containers, and plastics scored high as the most recycled waste components. Charcoal, metal, organic and food refuse were recycled a lot more in Munyaka than Kapsoya. Similar trends of recycling tyres, batteries, ceramics and glass were in both estates.
Figure 13 below shows that a greater proportion of the residents in Kapsoya had dustbins in their homes than Munyaka. The municipal council irregularly collects waste in Kapsoya and none at all in Munyaka. The practice of throwing waste to the open dump sites on the roads in higher in Munyaka than Kapsoya. The residents of Munyaka combine to burning their rubbish with open pit dumping.
Okalebo et al. 080
Figure 10: Sampling size of respondents and gender distribution
Whereas Kapsoya residents scarcely burn the rubbish they throw on vacant plots. There is little presence of private collectors in Kapsoya and none at all in Munyaka. From the results, despite the stipulations in the bylaws of EMC, there is a strong waste cultural practice of NIMBY(Not in my backyard). The research also showed that not all homes have house bins in contravention of the EMC bylaws (the municipality’s ordinance).
Figure 14 above shows that the key waste collection and disposal actors were the EMC and residents themselves, the action by other players is insignificant. Munyaka Estate is not served by EMC despite the fact that it falls within the municipality’s boundaries. A majority of Kapsoya residents get served by the EMC once in a month or biweekly. Due to the infrequent service Kapsoya residents have taken it up to themselves to handle their waste. There is little or no presence of a private enterprise engaged in waste disposal in the estates. Many respondents were of the view that EMC is facing a dilemma of high costs of operation making their service provision irregular. Apart from the conventional ‘collect and dump’ waste management system, the research, explored the other waste management practices in the estates.
As shown in Figure 15, the residents in both estates make a concerted effort in purchasing reusable products (practice of reduce). Both estate residents also practice reuse of their waste. Kapsoya residents opt for less packaging of their goods during purchases, than Munyaka.

Int. J. Agric. Pol. Res. 081
Figure 11: Household sizes and quantities of waste produced
in Kapsoya and Munyaka.
Figure 12: Composition of recyclable items.

Okalebo et al. 082
Figure 13: Current waste management practices in study areas.
Figure 14: The waste collection and disposal actors and the frequency of their disposal.

Int. J. Agric. Pol. Res. 083
Figure 15: Other waste management practices.
Munyaka residents practice burying of waste, more than Kapsoya residents. The practice of composting in both estates is minimal however Munyaka residents do it more than Kapsoya residents. From the questionnaires, households have developed many forms for reusing the products at home. Others have found opportunities of selling, taking to the farm, donating to schools or giving out their waste products to recyclers who make further use of the products. In general the residents participate in the 4Rs on some way. This however has been restricted to homesteads, for neither the local government no other organizations have established a community-wide program for 4Rs.
From the results reducing waste at source was not strong in the form of purchasing reusable items and avoiding excess packaging. This can be improved by conducting consumer education to help change consumers’ purchasing habits. The consumer education may be conducted by use of pamphlets, school programs, media and demonstrations. The research sought to investigate the challenges towards a widespread adoption and implementation of the 4Rs as evidenced in Figure 16 most respondents were indeed interested in recycling although they do not know how to begin. This creates a need for widespread education on the 4Rs. The respondents particularly in Munyaka revealed they have no place to store waste materials.
Some respondents thought that 4Rs is an inconvenience.
This indicates that future implementations of the 4Rs should not expect a hundred percent participation (capture rate) from residents. More respondents in Kapsoya felt hampered by lack of opportunities than in Munyaka. More residents in Munyaka rear house animals than Kapsoya. This has an implication on the composition of the organic waste. Some respondents in Munyaka fed the house leftovers to their dogs, ducks and pigs, thereby reducing amount of waste. In respect of the above, special areas have to be designated for the animal waste.
The respondents were asked which agency they thought would be most competent in running the proposed 4Rs, and response varied from estate to estate (Figure 17). Munyaka residents chose the EMC by an overwhelming proportion, followed by local CBOs, neighbourhood associations, NGOs and private enterprise respectively. Kapsoya residents preferred neighbourhood associations followed by private enterprises, EMC, local CBOs and NGOs respectively. The respondents were asked to determine the most suitable method of collection of wastes. Munyaka residents preferred the execution of both ‘drop-off’ and streetside collection, on an almost equal basis. Kapsoya residents preferred streetside collection to ‘drop-off’ collection. Some of the proponents of the streetside collection were of the view that apart from collection, the managing body would also be responsible for street cleaning. The higher the frequency of collections from the homes the more material

Okalebo et al. 084
Figure 16: Challenges towards the adoption and implementation of 4Rs.
Figure 17: Preferred method of waste collection and responsible management body

Int. J. Agric. Pol. Res. 085
Figure 18: Willingness of residents to support the proposed 4Rs program.
shall be received. Due to the mixed results it is proposed that an all-encompassing body of the mentioned stakeholders, capturing all their capacities and resources should run the 4Rs program. There is need to develop a strong grassroots based support from the community. From the survey there appeared to be no existing neighbourhood associations and community based organisations (CBOs).
The willingness of residents to support the proposed 4Rs program was test based on the amount of user fees they were willing to pay. From the results in Figure 18 most respondents from Kapsoya were willing to pay, with a majority pledging between Kshs 51-100, that can be regarded as strong support. A few residents very strongly supported the initiative by pledging between Kshs 100 – 150.
There were a few who didn’t support. In Munyaka over 40% of the respondents were unwilling to support. Most of the 60% who supported initiative were willing to pay between Kshs 10 -50. In Munyaka there appears to be a cultural practice of free waste management services which is understandable for they are in the low-income cadre. It was felt that it the high income and middle income user-payments in the proposed ISWM cross-subsidise those of the low income. On a general note the community support for the initiative is strong.
During the administration of the questionnaire respondents were introduced to the concept of recycling depots, and what other activities should be incorporated to ensure its successful adoption in the residential estates. The
Kapsoya residents (Figure 19) preferred the complementary activities in this order; tree nursery, composting activity, study centre, biogas generation, shop/cybercafe, community toilet block, rearing of cows and pig sty. Whereas the Munyaka residents preferred the complementary activities in this order; Biogas generation, study centre, community toilet block, composting activity, tree nursery, shop/cyber café and pig sty.
Respondents suggested that reuse enterprises such as jua kali (informal sector) can be encouraged since they collect, repair and reuse a variety of products. They were of the view that exchange days should be encouraged, where residents may exchange some of their products for tree seedlings/flowers, used appliances, furniture, bicycles, toys or other items. They raised concern that preventive measures should curb odours and pests in the recycling depots. DISCUSSION From the results it emerges that a centralized neighbourhood form of composting rather than home backyard composting, is preferred. From the preceding results, the residents in Kapsoya and Munyaka were willing to adopt commercial recycling depots with extra functions such as shops, study centre, cyber café, community toilet blocks, tree nursery, composting and/or piggery. However the key functions in the recycling depot would be reception,

Okalebo et al. 086
Figure 19: Activities to complement the recycling depot.
storage, treatment or disposal of waste. Various architectural design alternatives will be designed to fit into the local infrastructure incorporate the use of local appropriate technologies. ACKNOWLEDGMENTS Particular gratitude goes to my supervisors, Dr. G.P. Opata and Dr. B.N. Mwasi of the University of Eldoret. Many thanks go to the School of Environmental Studies, University of Eldoret, the entire academic staff and support staff. I wish to thank my sponsors Prof J.R. Okalebo and Mrs M.T Okalebo who provide invaluable support, during the research. REFERENCES Baud I, Post J (2002) Between market and partnerships:
Urban Solid Waste Management and contributions to sustainable development? Amsterdam, Netherlands: University of Amsterdam, GBER 3(1):46-65,
Intermediate Technology Development Group (ITDG-EA) (2004), Regional Waste Management – Experiences, challenges and opportunities of Waste Management in
East African Urban Centres. Nairobi, Kenya: ITDG-EA Workshop – Report,
Kibwage JK, Momanyi G (2002). Recycling Waste into Fuel Briquettes, The Role of Community Composting Groups in Nairobi, Nairobi, Kenya: Format.
Kiplagat WK (1999). Towards sustainable solid waste management alternatives for Eldoret municipality, Eldoret, Kenya: School of Environmental Studies, Moi University, Mphil thesis,
Mugenda and Mugenda, (1999). Research Methods: Quantitative and Qualitative approaches. Nairobi Kenya: ACTS,
Syagga P (1992a) Problems of Solid Waste Management in Urban Residential Areas in Kenya. Nairobi, Kenya: The Proceedings of African Research Network for Urban Management (ARNUM)
Syagga P (1993b) Background Paper on Waste Management in Central and Eastern African Region. Nairobi, Kenya: University of Nairobi, Department of Land Development. Unpublished research paper, 1993.
UNEP (1999a), International Source Book on Environmentally Sound Technologies for Municipal Solid Waste Management: IECT Technical Publication Series 6, Nairobi, Kenya. http://www.unep.or.jp/
UNEP (2005b), Solid Waste Management, Nairobi, Kenya United Nations Commission on Human Settlement (UNCHS)

Int. J. Agric. Pol. Res. 087 – Habitat (2001). Tools to support, participatory urban decision making. Nairobi, Kenya: UNCHS,
Wastenet (2004) Regional Waste Management: Experiences, challenges and opportunities of waste management in East African urban centres. Nairobi,
Kenya: ITDG-EA Workshop report. Nairobi, February 2004
Workshop: World Bank, (1999). What a Waste: Solid Waste
Management in Asia. Urban Development Sector Unit, East Asia and Pacific Region, World Bank, Washington, D.C

Okalebo et al. 088 Appendix one Dear Respondent, We are carrying out a study on household waste management in Eldoret, Kenya, as part of the requirements for the award of the Masters degree of Moi University. The information you will give will be treated as confidential and nobody will be quoted during the report writing or otherwise. Please, we seek your cooperation. Kindly fill in the questions below and return the questionnaire. 1 Gender of the Respondent Male ________ Female__________ 2 Estate of residence __________________ 3 How many people stay in your home _________ 4 How much of refuse do you produce per day? 0-0.5 Kg ___ 0.5 – 1 Kg ____ 1Kg – 2Kg ____ Over 2kg _____ 5 Do you dispose refuse in a House Dustbin? YES □ NO □ 6 Do you dispose refuse in a Bulk Dustbin for a number of
houses? YES □ NO □
7 Is refuse collected by town council staff? YES □ NO □ 8 Does a private organisation COLLECT the refuse from
your house? YES □ NO □
9 Do you throw your refuse to a nearby open plot? YES □ NO □ 10 Do you burn your waste? YES □ NO □ 11 Who transports your waste? Myself □
Municipal □ Other □
12 How often does the Municipal council come to clear waste from your estate?
Every day □ Thrice a week □ Weekly □ 2 Weeks □ Once in a month □ Not at all □
13 Do you compost your food leftovers into manure? YES □ NO □ 14 Do YOU REUSE some of the materials or products that
you buy? YES □ NO □
15 When buying items from the shop do you request for less packaging material?
YES □ NO □
16 Do you buy items that can be used several times for example jerrycans?
YES □ NO □
17 Do you dig a pit and bury your waste? YES □ NO □ 18 What other method do you use to reduce the amount of waste in your home? _____________________________________________________________________________________________________________________________. Do you find other uses for the following items (recycle) at home?
19 Beverage containers – tea, coffee, cocoa YES □ NO □ 20 Newspapers YES □ NO □ 21 Glass YES □ NO □ 22 Carton boxes YES □ NO □ 23 Metal YES □ NO □ 24 Plastic YES □ NO □ 25 Ceramics YES □ NO □ 26 Tyres YES □ NO □ 27 Organic refuse, food YES □ NO □ 28 Charcoal YES □ NO □ 29
Batteries
YES □ NO □

Int. J. Agric. Pol. Res. 089
30 Where do you take each of above recycled MATERIALS? _________________________________________________________ 31 Does lack of opportunities prevent you from recycling? YES □ NO □ 32 Does lack of a place to store the items prevent you from
recycling? YES □ NO □
33 Do you have an interest in recycling? YES □ NO □ 34 Do you find recycling an inconvenience? YES □ NO □ 35 Do you find recycling hard because you do not know how
to begin? YES □ NO □
36 Do you have any animals at home? YES □ NO □ 37 What method of collecting waste do you prefer if offered in your estate? Drop-off waste at a convenient location in the street □ Streetside pickup system from the house □ 38 Who would you suggest should run the any recycling PROGRAM IN your estate? Municipal Council □ Neighbourhood association □ Community based organisation □ Non-Governmental Organisation □ Private Enterprise □ 39 Give the NAME OF any neighbourhood association, or community-based organisation within your estate? ___________________________________________________________________________________________________________________________________________________________ 40 How much would you be willing to pay per month to support any new waste reduction and recycling programs if introduced toyour estate? NOTHING □ Kshs 10 – 50 □ Kshs 50 – 100 □ Kshs 100 – 150 □ 41 Do you think your estate residents can jointly support a recycling depot program? YES □ NO □ What other activity do you think can be found in the recycling depot (a recycling depot is a special place set aside for recycling alongside the collection, sorting and transfer of waste in your estate), in your estate? 42 Tree Nursery YES □ NO □ 43 Cyber café YES □ NO □ 44 Duka YES □ NO □ 45 Biogas generation YES □ NO □ 46 Study centre YES □ NO □ 47 Keeping Pigs YES □ NO □ 48 Community Toilet Block YES □ NO □ 49 Composting YES □ NO □ 50 Keeping cows YES □ NO □ Thank you very much for answering or filling the questionnaire. I might call again for more assistance if I require more information.
Cite this article as: Okalebo SE, Opata GP, Mwasi BN (2014). An analysis of the household solid waste generation patterns and prevailing management practices in Eldoret town, Kenya. Int. J. Agric. Pol. Res. 2(2):pp. 076-089.