An Analysis of Post-Acquisition Target CEOs’ Employment ...
75
An Analysis of Post-Acquisition Target CEOs’ Employment and Its Influences to Future Performance of Acquirer Firms Zhe Li A Thesis In The John Molson School of Business Presented in Partial Fulfillment of the Requirements for the Degree of Master of Science in Administration (Finance Option) at Concordia University Montreal, Quebec, Canada April 2012 © Zhe Li, 2012
Transcript of An Analysis of Post-Acquisition Target CEOs’ Employment ...
An Analysis of Post-Acquisition Target CEOs’ Employment and Its Influences to
Future Performance of Acquirer Firms
Zhe Li
A Thesis
In
The John Molson School of Business
Presented in Partial Fulfillment of the Requirements
for the Degree of Master of Science in Administration (Finance Option) at
Concordia University
Montreal, Quebec, Canada
April 2012
© Zhe Li, 2012

CONCORDIA UNIVERSITY
School of Graduate Studies
This is to certify that the thesis prepared
By: Zhe Li
Entitled: An Analysis of Post-Acquisition Target CEOs’ Employment and
Its Influences to Future Performance of Acquirer Firms
and submitted in partial fulfillment of the requirements for the degree of
Master of Science in Administration (Finance Option)
complies with the regulations of the University and meets the accepted standards with respect to
originality and quality.
Signed by the final examining committee:
Chair
Dr. Zeynep Arsel
Examiner
Dr. Rahul Ravi
Examiner
Dr. Yaxuan Qi
Supervisor
Dr. Sandra Betton
Supervisor
Dr. Saif Ullah
Approved by
Chair of Department or Graduate Program Director
Dr. Harjeet S. Bhabra
Dean of Faculty
Dr. Harjeet S. Bhabra
Date
April 5, 2012
iii
ABSTRACT
An Analysis of Post-Acquisition Target CEOs’ Employment and
Its Influences to Future Performance of Acquirer Firms
Zhe Li
We shed new light on two questions. The first question is why some target
CEOs are hired by the acquirer firms while others would depart after the acquisitions,
more exactly, what characteristics of the target firms or target CEOs themselves
would make them stay in or depart from the acquirer firms. The second question is
about the influence of the hired target CEOs in the post-acquisition performance of
the acquirer firms.
To answer the first question, we use a logistic regression to test the variables
that might influence the target CEOs‘ employment in the acquirer firms. We find that
target CEOs are more likely to be hired by acquirer firms in the following cases: (1)
the target firm has better pre-acquisition performance (2) the target CEO has stronger
control over the target firm (3) the target CEO has more work experience (4) the
method of payment is stock.
For the second question, we estimate a multivariate OLS regression with two
dummy variables reflecting how long target CEOs work in the acquirer firm after the
acquisitions, together with other pre-acquisition target/acquirer firm performance
variables. Two measures of acquirer firms‘ performance are also used in the model: a
market-based measure (buy & hold market-adjusted return) and an accounting-based
measure (industry adjusted return on asset). Our findings are as following: (1)
Pre-acquisition target and acquirer firms‘ performance (especially the target firms‘
performance) have more significant and positive influence on the second-year
post-acquisition performance of the acquirer firms. (2) The hired target CEOs will
negatively influence the first-year post-acquisition performance of the acquirer firms.
(3) The target CEOs hired by acquirer firms for at least two years will significantly
improve the second-year post-acquisition performance of the acquirer firms and this
positive effect might continue to the third year.

i v
ACKNOWLEDGEMENTS
I would like to express my deep appreciation to the following individuals:
-My supervisors Dr. Sandra Betton and Dr. Saif Ullah, who supervised and
guided me from the very beginning to the end of my thesis. Without their help and
encouragement, I would never be able to finish this thesis. I have learned a lot under
their supervision and this experience would help me greatly for my future career.
-My committee members, Dr. Rahul Ravi and Dr. Yaxuan Qi, for their valuable
suggestions that helped me to improve this thesis.
-My dear parents, Xingzhao and Renhuan, for their constant support, love, and
encouragement in my life.
v
TABLE OF CONTENTS
List of tables.................................................................................................................. vi
List of figures ............................................................................................................... vii
Introduction .................................................................................................................. 1
Literature Review........................................................................................................... 3
Hypotheses ..................................................................................................................... 7
Data .............................................................................................................................. 15
Methodology ................................................................................................................ 18
Empirical Results ......................................................................................................... 22
Conclusion……………………………………………………………………………39
Appendix……………………………………………………………………………..42
References……………………………………………………………………………65

vi
LIST OF TABLES
Table 1………………………………………………………………………………..42
Table 2………………………………………………………………………………..43
Table 3………………………………………………………………………………..44
Table 4………………………………………………………………………………..45
Table 5………………………………………………………………………………..46
Table 6………………………………………………………………………………..48
Table 7………………………………………………………………………………..49
Table 8……………………………………………………………………………......51
Table 9………………………………………………………………………………..53
Table 10……………………………………………………………………………....55
Table 11……………………………………………………………………………....57

vii
LIST OF FIGURES
Figure 1. ....................................................................................................................... 59
Figure 2 ........................................................................................................................ 59

1
Introduction
Mergers, acquisitions and the subsequent corporate restructuring are always
frequent topics of interest in the previous studies. It is well established that mergers
and acquisitions are important and popular ways of achieving corporate growth.
Although the finance literature still argues about whether mergers and acquisitions
enhance the wealth of acquirer firms, there is a general agreement that the
shareholders of target firms earn an above-market premium after a merger and
acquisition announcement (Jensen and Ruback, 1983, Roll, 1987, etc). An important
long-term effect of mergers and acquisitions is the subsequent restructuring of the
acquirer firm‘s management team. According to Ravenscraft(1987), adjusting the
management team structure is a major motivation for merger and acquisition activity.
Evidence clearly shows that some target executives, especially chief executive
officers, continue to work in the acquirer firms, while others depart in the
post-acquisition period. Given the talent and experience of a target firm CEO, his/ her
decision to stay with or depart from the acquirer firm might affect the post-acquisition
performance of the acquirer firm. The purpose of this thesis is to understand why
some target chief executive officers continue to work in the acquirer firms, while
others do not and how this post-acquisition employment phenomenon influences the
future performance of the acquirer firm.
We collect data for target firms and acquirer firms of 500 largest deals,
including target chief executive officers‘ post-acquisition employment data, target

2
firms and acquirer firms‘ financial situation data, and target chief executive officer ‘s
personal information etc. Table 1 and 2 present some interesting characteristics of our
data.
In table 1, we see that the CEOs who were hired by acquirer firms for at least
two years tended to come from the target firms with the highest Tobin‘s q were more
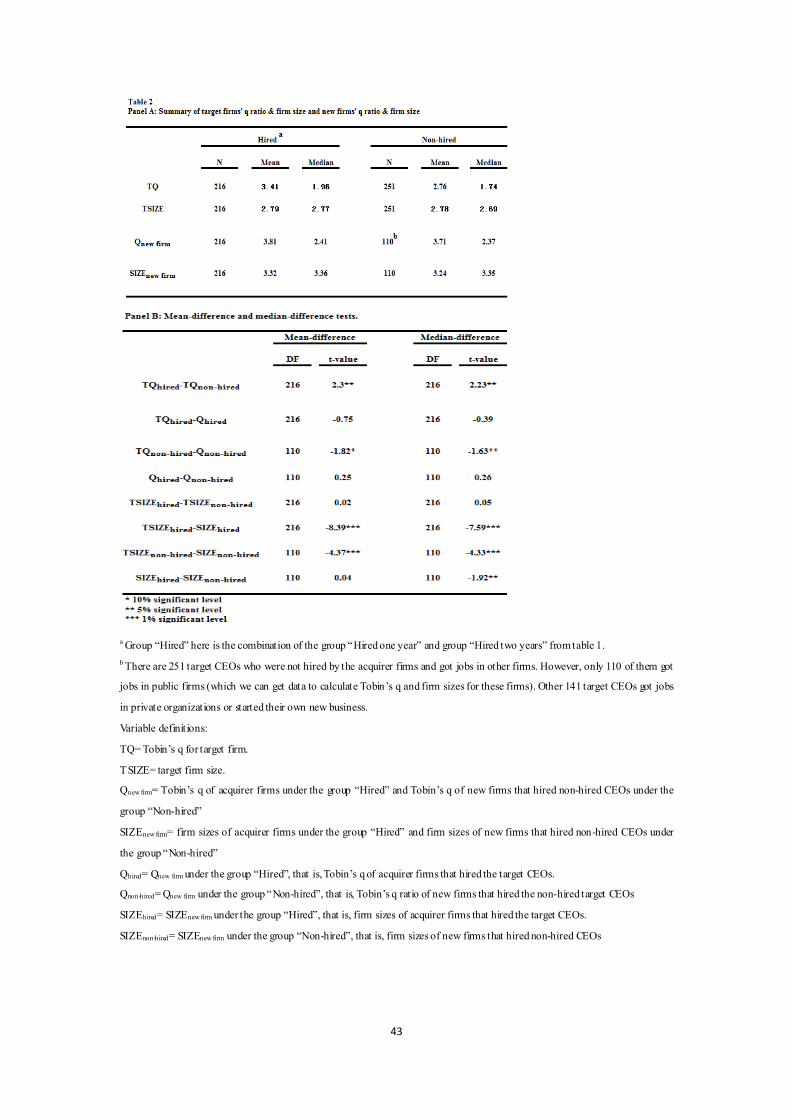
likely to be paid in stock but to receive a lower premium. In table 2, we see that the
Tobin‘s q of the target firms whose CEOs were hired by the acquirer firms are
significantly higher than that of the target firms whose CEOs were not hired by
acquirer firms and that the Tobin‘s q of the new firms who hired the non-hired target
CEOs is also significantly higher than that of the target firms whose CEOs were not
hired by acquirer firms. It is also clear that the size of the hiring acquirer firms tends
to be significantly larger than that of the target firms and the size of the new firms
who hired target CEOs are significantly larger than those of their former employers.
The characteristics summarized in tables 1 and 2 indicate that there are different
characteristics between the hired target firms (CEOs) and non-hired target firms
(CEOs). Later in the paper, we will extend our tests to more thoroughly investigate
the target CEOs‘ employment and possible influences on the future performance of
the acquirer firms. The object of this paper is to shed light on two main questions. The
first question is why some target chief executive officers stay in the acquirer firms
while others depart after the acquisitions, in other words, what characteristics of the
target firms or target CEOs themselves influences their future employment. The
second question is to examine the influence of the hired target CEOs on the

3
post-acquisition performance of the acquirer firms.
The rest of the paper is organized as following: the first section is the literature
review. The second section presents our hypotheses and the third section shows the
data and methodology. The fourth section discusses the empirical results. The final
section offers a conclusion.
Literature Review
Previous studies have examined the relationship between mergers &
acquisitions and target management turnover. They generally focus on two primary
questions:
(1) Do the mergers and acquisitions cause the target firms‘ executives to depart at
higher rates than normal after the acquisitions?
(2) Why does this higher than normal target executives departure happen?
The idea that mergers and acquisitions can cause dramatic changes in the target
management team has received extensive support in the previous literatures. Walsh
(1988) examined the relationship between M&A negotiations and the subsequent
target companies‘ top management turnover based on complete management team
data of 50 acquisitions. Results indicate that targets‘ top management turnover rates
are much higher than the normal after the acquisitions. It is clear that the more-senior
executives are likely to turn over sooner than the less-senior executives. However,
after controlling for the type of acquisitions (i.e. related or unrelated), the differences

4
are not significant. Walsh (1989) re-examined the topic based on 113 acquisitions,
finding that the target‘s top management is most likely to experience abnormally high
turnover four years after an M&A agreement reached between an unrelated target and
acquirer. Krug & Aguilera (2004) explored a new area of the target‘s top management
turnover: rather than investigating the incumbent top managers, they examined the
executives hired after the acquisitions and find that the newly hired executives also
depart more quickly than their counterparts who joined non-M&A companies. These
results imply that acquisitions may create long-term instability in the merged firms‘
top executive team.
When it comes to the reasons why mergers and acquisitions cause the target
firms‘ executives to depart at higher rates than normal, researchers have reached
different conclusions. Some argue that the ultimate reason that mergers and
acquisitions happen is because the incompetent management teams in the target firms
lead to bad pre-acquisition performance. The acquisition is therefore a process by
which more competent executives displace less competent ones. This argument
implies that management change is one of the most important factors contributing the
success of acquisitions. For example, Coughlan & Schmidt (1985), Weisbach (1988)
and Warner et al. (1988) all demonstrate that there is an inverse relationship between a
company‘s stock price performance and its subsequent top management turnover after
acquisitions, that is, the companies that suffer from bad performance in the
pre-acquisition period are more likely to experience top management turnover in the
post-acquisition period. More interestingly, Hambrick & Cannella (1993) also found

5
that the pre-acquisition performance of the acquirer firm could additionally predict the
target executives‘ post-acquisition turnover, in other words, target executives are more
likely to depart if the pre-acquisition performance gap between targets and acquirers
is large. Asquith (1983), Hasbrouck (1985) and Bartley & Boardman (1986) suggest
that target managers reveal their incompetence through a series of decisions that
negatively influence their companies‘ stock performance. According to the theory of
the market for corporate control, negative market evaluation of a company‘s current
and expected performance will accumulate until managerial incompetence is revealed,
the company is acquired, and the incompetent managers are dismissed.
However, some authors have different opinions and argue that while mergers
and acquisitions would cause target top management turnover at higher rates than
normal, it is not necessarily because of target executives‘ incompetence or bad
pre-acquisition performance. For example, Walsh & Ellwood (1991) investigate the
relationship between a company‘s top management turnover after acquisition and its
performance history based on a sample of target companies, their parents and a
control group of companies not involved in merger and acquisition activity. They
found that the top management turnover of the target firm is higher than normal in the
two years following the acquisition. However, they d id not find any relationship
between target top management turnover after acquisitions and their previous
performance. In addition, Walsh & Ellwood (1991) also find that the first-year top
management turnover in the targets is associated with the relatively poor parent
company performance, while the second-year top management turnover rates are
6
associated with relatively good parent company performance. Agrawal & Jaffe (2003)
also cast doubt on the previous belief that takeovers are primarily motivated by the
desire to improve poor performance of target firms. They re-examine this inefficient
management hypothesis and find little evidence that target firms performed poorly
before acquisitions. Pfeffer (1981) argues that the partial reason some target
executives depart is because something has gone wrong with the deal and the
executives are not satisfied. Castanias & Helfat (1991) suggest that some top
executives from target firms may have unique and firm-specific talents and skills that
provide them with un-replaceable advantages in the new firms. Ghosh & Ruland
(1998) investigated the relationship between the target executives‘ intention to stay in
the new firm after the acquisition and method of payment for corporate acquisitions.
They find that when the method of payment is stock rather than cash, managers of
target firms are more likely to retain their jobs in the new firm. Krug & Nigh (1998)
investigate the top management turnover issue in the international context by
examining U.S. manufacturing firms acquired by foreign multinationals. Their results
indicate that post-acquisition top management turnover is positively related to the
level of international integration in the target industry and the cultural distance
between the U.S. target and the home country of the acquirer. Krug & Nigh (2001)
also find that executive‘s personal benefits (compensation, opportunities for
promotion, etc) in the new firms also influences their decision to stay or depart.
The chief executive officer, as a key executive in the top management team, has
a crucial role in the issue of management turnover and the success of an acquisition.

7
Allen et al (1979), Salancik & Preffer (1980), Kelly (1980), James & Soref (1981)
Weisbach (1995) all find that CEO succession is a one of the most important and
frequently used strategies to turn around poor performance. Kesner & Dalton (1994)
find that poor performance prior to CEO succession leads to greater turnover
afterward. Kennedy & Limmack (1996) explore the relationship between stock
returns and CEO turnover of target companies and find a significant increase in CEO
turnover for the two years after the takeover. Additionally, a target company which
changed their CEO in the two years subsequent to an acquisition usually experienced
a lower return in the pre-acquisition period than other target firms. However, when the
deal type is controlled (hostile or friendly), no significant relationship between target
return and CEO turnover could be found. Hartzell & Yermack (2004) examine the
benefits received by target chief executives in completed mergers and acquisitions and
find that target CEOs who receive cash payments are less likely to become an
executive of the acquiring company.
Hypotheses
Target CEO’s post-acquisition employment test
For our first research question, we will estimate a target CEO employment
model and test the variables that are expected to influence the probability of target
CEOs‘ employment in the acquirer firms. We have the following five hypotheses for
8
the employment test.
Target firm’s pre-acquisition performance
Theory suggests that target executives are more likely to turn over after the
acquisition if the target firm has a worse pre-acquisition performance. For instance,
the concept of market for corporate control indicates that more competent executive
team tends replace less competent team. This has also been confirmed by the literature
(Manne, 1965; Jensen and Meckling, 1976; Jensen, 1988; etc.). In our employment
model, we have variable QR and SIZER to measure the pre-acquisition performance
of the target firms. Tobin‘s q (Q) is a measure of a firm‘s performance and growth
potential, and target firms with higher Tobin‘s q might be more attractive to the
acquirer firms. Additionally, higher target Tobin‘s q is also a sign of better target CEO
management skills. Q ratio (QR) is a ratio of target Tobin‘s q to the acquirer Tobin‘s q.
We expect that the larger the q ratio (the larger the target q compared to the acquirer
q), the more likely that the target CEO would be hired by the acquirer firm. Hiring
these target CEOs might be beneficial to the future performance of the acquirer firms.
Firm size (SIZE), value of the total asset of a firm, is also a reflection of historical
firm performance. Larger firm size may reflect better management and greater
complexity in operation of a firm. Size ratio (SIZER) is a ratio of target firm size to
the acquirer firm size. We expect that the larger the size ratio, the more attractive the
target CEO is to the acquirer firm due to increased integration challenges. As a result,
9
offering this target CEO a management position in the acquirer firm might not only
smooth the target integration, but also benefit the future performance of the acquirer
firm. As mentioned above, we expect that the better the pre-acquisition performance
(higher QR and SIZER) of the target firms, the more likely that the target CEO will be
hired by the acquirer firm after the acquisition.
Hypothesis 1: The pre-acquisition performance of the target firms will be positively
related to target CEO’s post-acquisition employment in acquirer firms.
Target CEO’s control over the target firm
From the perspective of the acquirer firm, hiring a target CEO who has greater
control over the target firm might make the integration process much easier. We
measure the target CEO‘s control over the target firm from three aspects, namely
compensation (CEOD), position (BOSS) and stock ownership (INSOWN).
CEO-dominance (CEOD) reflects the gap between the CEO‘s assessment of his own
worth to the firm and his assessment of the other executives‘ worth. According to
Chemmanur et al. (2007), a strong-willed and dominating CEO may severely
diminish possible contributions from subordinate executives, but may also improve
the cohesion of the executive team. As a result, offering a position for the dominating
target CEO in the acquirer firm might attract the target CEO to act more for the
interest of the acquirer firm and consequently smooth the target integration. CEO&

10
Chairman (BOSS) is to control for CEO/Chairman of the board duality. Although
Yermack (1997) and Rechner & Dalton (1991) show that firms which separate the
roles of CEO and chairman of the board outperform those with combined roles of
CEO and chairman, in our case, we expect that acquirer firms would prefer to hire the
target CEOs who are also chairman of the board because to hire an individual who is
the leader of both the target executive team and the target board will make the
post-deal integration more effective. CEO usually has more stock ownership than
other executive officers and M&A negotiation, in a way, is a negotiation between the
large stockholders of the two firms. In this case, we expect that target CEOs with
larger stock ownership (INSOWN) are more likely to be hired by acquirer firms,
because offering the target CEO, who is also a large target stock holder, a job in the
acquirer firm might make the deal negotiation much easier. As discussed above, we
expect that the stronger the target CEO‘s control (higher CEOD, BOSS, and
INSOWN) over the target firm, the more likely that he will be hired by the acquirer
firm after the acquisition.
Hypothesis 2: The target CEO’s control over the target firm will be positively related
to target CEO’s post-acquisition employment in the acquirer firm.
Target CEO’s work experience
When hiring an employee, the employer usually prefers one with more work

11
experience, especially experience from the same industry, because this hand s-on
experience would enable the candidates to step into their new role and working
environment quickly and benefit the firms‘ future performance. We measure the target
CEO‘s work experience from three perspectives: the number of years the target CEO
worked in the target firms (TENURE); whether the target firm and acquirer firm are
from the same industry (SIC); and the target CEO‘s age (AGE). A target CEO with a
longer tenure in the target firm will be more familiar with the management and
operations of the target firm. The Standard Industrial Classification (SIC) is used to
measure whether a target firm is from the same industry as the acquirer firm. When a
firm recruits new executive officers, they usually prefer candidates with work
experience in the same industry, because this related management experience may
benefit the firms‘ future performance. Target CEO with older age usually has more
work experiences, which may also be beneficial to the acquirer firm‘s future
performance. As indicated above, we expect that target CEOs with more relevant
work experience (higher TENURE, SIC, and AGE) will be more likely to be hired by
acquirer firms after the acquisition.
Hypothesis 3: The target CEO’s pre-acquisition work experience will be positively
related to target CEO’s post-acquisition employment in acquirer firms.
Target CEO’s loyalty to target shareholders
12
A target CEO who is more loyal to the target shareholders may act more in the
interest of the target shareholders when negotiating with acquirer firms, for instance,
bargaining for a higher premium for target shareholders, and consequently these loyal
target CEOs might be dismissed from the acquirer firm after the acquisition. This can
be seen from the non-hired group in table 1, which shows that the non-hired group of
target CEO is associated with a higher premium. In addition to the variable
PREMIUM*, we also use the variable TENURE to measure the target CEO‘s loyalty
to target shareholders, because the target CEOs might be more loyal to the target
shareholders if they work in target firms for more years. As mentioned above, we
expect that a target CEO will be less likely to be hired by the acquirer firm after the
acquisition if the target CEO is more loyal (higher PREMIUM* and TENURE) and
acts more in the interests of the target shareholders.
Hypothesis 4: The target CEO’s loyalty to target shareholders will be negatively
related to target CEO’s post-acquisition employment in acquirer firms.
Method of payment
According to Ghosh & Ruland (1998) and Hartzell & Yermack (2004), target
CEOs who receive stock payments are more likely to become executives of the
acquirer companies. Generally speaking, there are three methods of payment (100%
stock, 100% cash, and mixed payments) that the acquirer firms would use. We control
13
for the effects of payments on the target CEOs future employment in the acquirer
firms by variable PAYMENT, namely mostly stock payment. Following the findings
of Ghosh & Ruland (1998) and Hartzell & Yermack (2004), we also expect that target
CEOs who receive mostly- stock payment (higher PAYMENT) would be more likely
to become executives of the acquirer company.
Hypothesis 5: The target CEO who receives more stock payment will be positively
related to target CEO’s post-acquisition employment in acquirer firms.
Post-acquisition acquirer firms’ performance test
Among the 216 hired target CEOs, 61 were hired for one year or less, and the
remaining were hired for at least two years. For the second question, we will estimate
the acquirer firm performance model and examine the influence of the hired target
CEOs to the post-acquisition (three years) performance of the acquirer firms. We have
the following two hypotheses for performance test.
First year post-acquisition performance of the acquirer firms
For the 216 hired target CEOs (both hired one year and hired two years),
considering that they will need time to step into the new roles and working
environment of the new firms before they demonstrate their excellent capabilities, we

14
expect that the hired target CEOs (both EMPLOYMENT1 and EMPLOYMENT2) will
not be able to influences the acquirer firms‘ performance in the first year.
Hypothesis 1: For both hired one year target CEOs and hired two years target CEOs,
their employment will not be significantly related to the first year post-acquisition
performance of the acquirer firms.
Second year post-acquisition performance of the acquirer firms
From table 1, we can see that the hired two years group has the highest average
Tobin‘s q, indicating that those target firms perform better than other firms and,
therefore, these target CEOs might have outstanding capabilities. As a result, we
expect that they (EMPLOYMENT2) will start to show their outstanding capabilities
and improve the second year post-acquisition performance of the acquirer firms.
Hypothesis 2: For the hired two years target CEOs, their employment will be
positively related to the second year post-acquisition performance of the acquirer
firms.
As discussed above, the five hypotheses for employment test and two hypotheses for
performance test and the expected signs for independent variables are summarized in table 3.

15
Data
The data used in this study comes from several different sources. The list of
completed mergers and acquisitions between 1995 and 2005 is from the Securities
Data Corporation‘s database (SDC). We only keep the completed and friendly deals
with public target firms (U.S. only) and acquirer firms excluding financial firms and
utility firms (all firms with SIC between 6000 and 6999, 4900 and 4949, respectively)
from our sample. This results in 1500 mergers and acquisitions. Within these 1500
mergers and acquisitions, we only choose the 487 with the largest target enterprise
values (from $381 million to $181622 million) as our final sample1. Table 4 presents a
summary of the different industries of target firms and acquirer firms in our sample.
In SDC database, we also collect data for the method of payment that target firms‘
shareholders received (PAYMENT), percentage of target shares owned by acquirer at
announcement, offer price premium as percentage of 4-week trading price
(PREMIUM).
We collect the target CEOs2‘ continued employment data from U.S. Securities
and Exchange Commission database 3 (SEC) and the Bloomberg Business-week
database4. We compare the list of executives of target firms one year before the deal
1 This largest target enterprise value criterion could be a bias of our sample.
2 Originally, we want to examine the post -acquisition employment of the several top executives (including CEO) of these 500 target firms. These top executives come from the following positions: chief executive officer, chief financial officer, chief operating officer, and chief technology officer, which we believe are the most important positions of a firm. However, after
collecting the data, we find that compared to the number of chief executive officers (221) who were hired by the post-acquisition acquirer firms, the numbers of executives from other three positions are very small (10 from chief financial officer, 18 from chief operating officer, and 2 from chief technology officer). As a result, it would be very hard to capture a reliable influence of these executives to the post -acquisition performances of the acquirer firms due to their limited numbers of
continued employments. In this case, we decide to only focus on the role of chief executive officer. 3 Website: www.sec.gov.
4 Website: www.businessweek.com.

16
effective date and the list of executives of acquirer firms one year after the deal
effective date provided in the company‘s proxy statement (DEF 14A) or annual report
(10-K), and if a target CEO appears, we record it as one case of a target CEO‘s
continued employment in the acquirer firm (EMPLOYMENT). We also check the
CEO‘s employment history information from the Bloomberg Business-week database,
if available. The reason we check both SEC and Bloomberg Business-week database
is that sometimes a target CEO is hired in the acquirer firm for less than one year, and
SEC database does not record this information, but Bloomberg Business-week
database does. Therefore, by checking both sources we can ensure that our
employment data is as complete as possible.
We find that 221 target CEOs were hired by acquirer firms and the remaining
279 target CEOs were not hired by acquirer firms in the post-acquisition period.
However, among these 221 hired CEOs, five of the acquirer firms owned more than
50% percent of the target firms‘ stock before the deal announcement. Moreover, we
find that these target firms were the acquirer firms ‘ partially-owned subsidiaries and
these target CEOs had already worked in the acquirer firms before the deal
announcements. In this case, we believe that these five targets and acquirers are not
the cases we need, so we remove them from our sample. The same thing happened to
eight target CEOs of the remaining 279 target CEOs who were not hired by acquirer
firms. Among the remaining 216 hired target CEOs, we separate them into two
subgroups: CEOs who left the acquirer firms within one year and CEOs who worked
for the acquirer firms for at least two years. The reason for this is because we believe
17
that target CEOs who were hired by acquirer firms for one year or less are not likely
to affect the future performance of the acquirer firms significantly. In addition, we
believe that there may be some unique reasons for them to be hired by the acquirer
firms for only a brief period.
We also collect data for CEO age (AGE), target CEOs‘ education background
(EDU), target CEOs‘ salary and bonus for CEO-dominance(CEOD), CEO &
chairman of the board (BOSS), number of years target CEOs worked in target firms
(TENURE), target CEOs‘ beneficial ownership (INSOWN) from U.S. Securities and
Exchange Commission database and Bloomberg Business-week database, if available.
Besides the data collected above, balance sheet data, income statement data, and cash
flow data, for calculating pre-acquisition performance variables return on asset (ROE),
sales growth (GROWTH), firm liquidity (LIQUIDITY), firm leverage (LEVERAGE),
firm size (SIZE), and Tobin‘s q (Q) are also collected from Compustat Database.
Variable names prefixed by ―T‖ and ―A‖ refer to target and acquirer data, respectively.
The monthly stock returns and market returns data for calculating post-acquisition
acquirer firms‘ buy & hold market-adjusted returns are collected from Center for
Research in Security Prices database (CRSP). Data for the executive positions of the
hired CEOs in the acquirer firms and executive positions of the non-hired CEOs in the
new firms are also collected from Factvia database and Bloomberg Business-week
database, if available. Table 5 presents summary statistics of all independent variables
included in the tests later. Explanations for all the variables are presented in the
appendix.

18
Methodology
Target CEO’s post-acquisition employment test
Within our sample of 487 CEOs from target firms, 216 CEOs were hired by the
acquirer firms and 251 CEOs were hired in other firms, while the remaining 20 CEOs
retired after the acquisitions. We want to examine the factors that may influence the
acquirer firms‘ decision to hire or dismiss the target CEOs.
There are 11 variables5 that we believe would influence the target CEOs‘
post-acquisition employment. We will use a logistic model to test the effects of these
variables on the target CEOs‘ continued employment in the acquirer firms. The model
is as following:
0 1 2 3 4 5 6 7 8 9 10 11
1
1 exp[ ( )]EMPLOYMENT
CEOD BOSS TENURE INSOWN PAYMENT QR SIZE EDU SIC AGE PREMIUM
However, in our model above, the PREMIUM could relate to CEOD, TENURE,
INSOWN, QR, and PAYMENT; while PAYMENT could also relate to CEOD,
TENURE, INSOWN, QR, and PREMIUM. As a result, we want to eliminate the
effects of PREMIUM and PAYMENT on EMPLOYMENT that are already been
explained by the five variables above from the model. To do this, we first test the
model PREMIUM and model PAYMENT as following to get the predicted values
5. In addition to the 10 variables (CEOD,BOSS, TENURE, INSOWN, PAYMENT, QR, SIZE, SIC, AGE, PREMIUM) included in the hypotheses, variable EDU is also added into the employment model to control for the effect that target CEO‘s MBA degree on his post-acquisition employment in the acquirer firm.
19
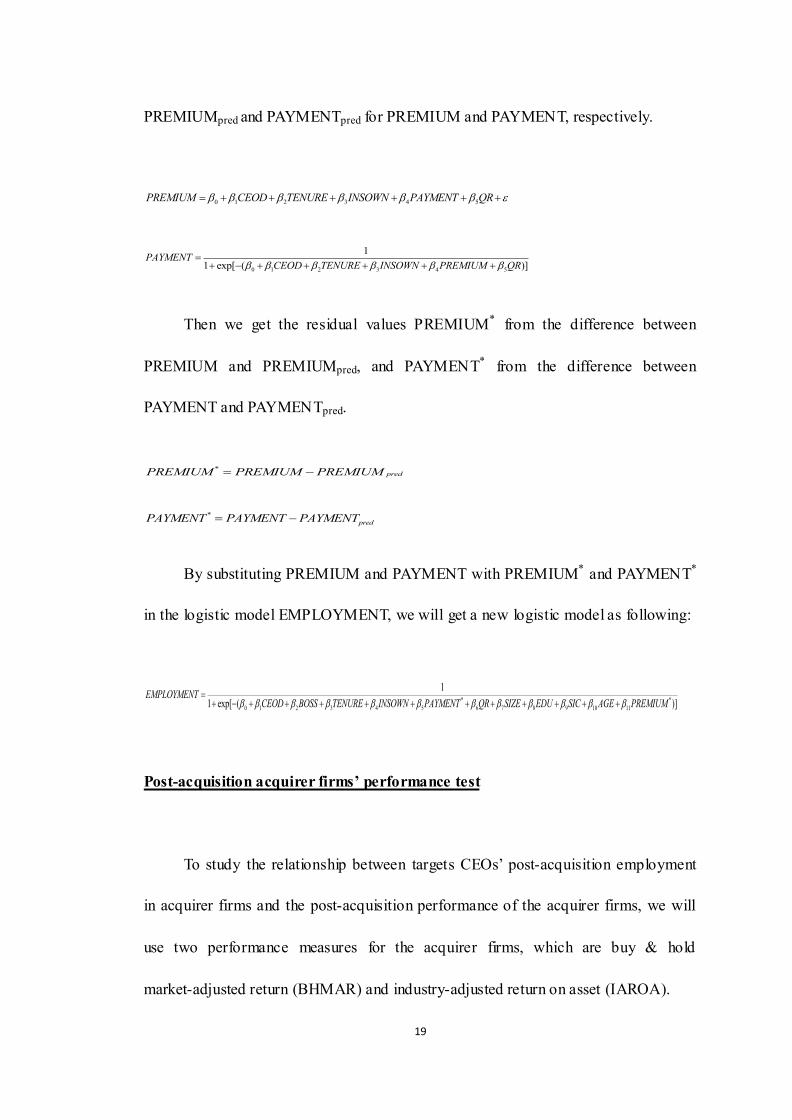
PREMIUMpred and PAYMENTpred for PREMIUM and PAYMENT, respectively.
0 1 2 3 4 5PREMIUM CEOD TENURE INSOWN PAYMENT QR
Then we get the residual values PREMIUM* from the difference between
PREMIUM and PREMIUMpred, and PAYMENT* from the difference between
PAYMENT and PAYMENTpred.
By substituting PREMIUM and PAYMENT with PREMIUM* and PAYMENT*
in the logistic model EMPLOYMENT, we will get a new logistic model as following:
* *
0 1 2 3 4 5 6 7 8 9 10 11
1
1 exp[ ( )]EMPLOYMENT
CEOD BOSS TENURE INSOWN PAYMENT QR SIZE EDU SIC AGE PREMIUM
Post-acquisition acquirer firms’ performance test
To study the relationship between targets CEOs‘ post-acquisition employment
in acquirer firms and the post-acquisition performance of the acquirer firms, we will
use two performance measures for the acquirer firms, which are buy & hold
market-adjusted return (BHMAR) and industry-adjusted return on asset (IAROA).
*predPREMIUM PREMIUM PREMIUM
*
predPAYMENT PAYMENT PAYMENT
0 1 2 3 4 5
1
1 exp[ ( )]PAYMENT
CEOD TENURE INSOWN PREMIUM QR

20
Following Loughran and Ritter (1996), we calculate the buy and hold
market-adjusted return of acquirer firms for three consecutive years after the
acquisitions. Buy and hold market-adjusted returns are calculated as following:
For the first year:
12 12
, ,1 1(1 ) (1 )iT t i t m
t tBHMAR r r
For the second year:
24 24
, ,13 13
(1 ) (1 )iT t i t mt t
BHMAR r r
For the third year:
36 36
, ,25 25
(1 ) (1 )iT t i t mt t
BHMAR r r
where
itBHMAR =buy and hold market-adjusted return for acquirer firm i in event year T (T=1,
2, 3).
,t ir =stock return for acquirer firm i in event month t.
,t mr =market return in event month t.
Return on asset is defined as the ratio of net income to total asset of a firm. We
calculate the industry-adjusted return on asset of a acquirer firm by return on asset of
that firm less the average return on asset of all the firms from the same industry (the
21
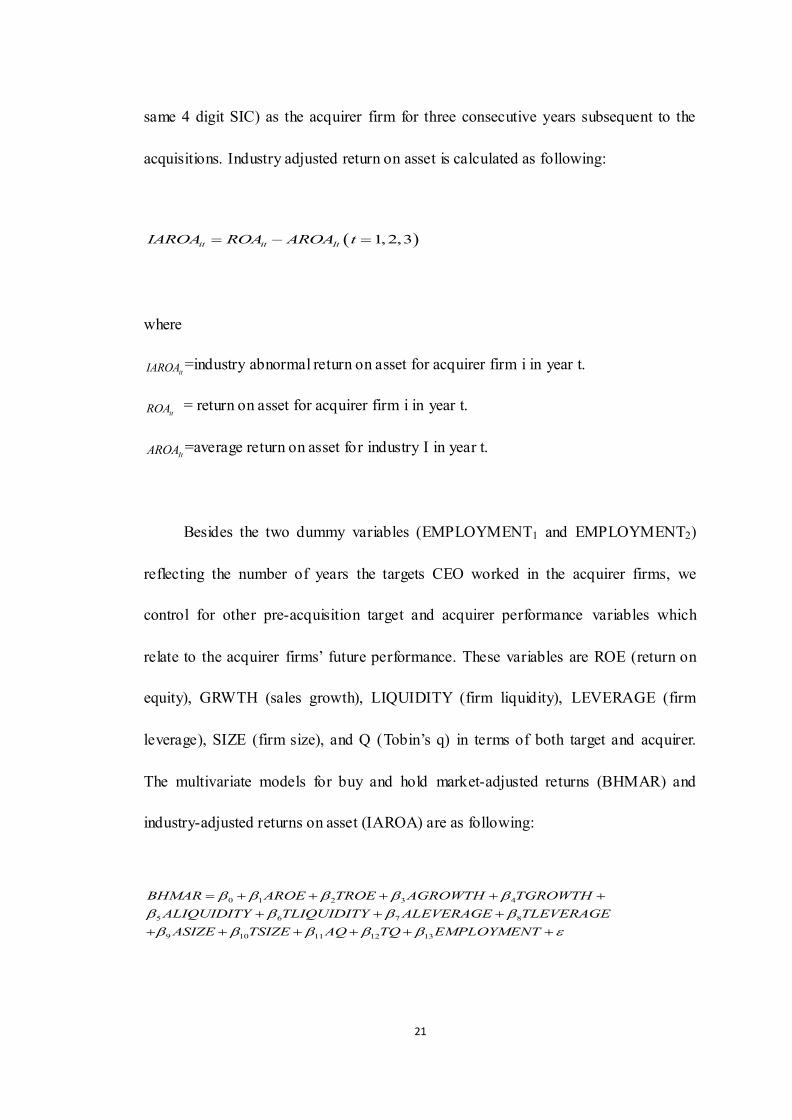
same 4 digit SIC) as the acquirer firm for three consecutive years subsequent to the
acquisitions. Industry adjusted return on asset is calculated as following:
1,2,3it it ItIAROA ROA AROA t
where
itIAROA =industry abnormal return on asset for acquirer firm i in year t.
itROA = return on asset for acquirer firm i in year t.
ItAROA =average return on asset for industry I in year t.
Besides the two dummy variables (EMPLOYMENT1 and EMPLOYMENT2)
reflecting the number of years the targets CEO worked in the acquirer firms, we
control for other pre-acquisition target and acquirer performance variables which
relate to the acquirer firms‘ future performance. These variables are ROE (return on
equity), GRWTH (sales growth), LIQUIDITY (firm liquidity), LEVERAGE (firm
leverage), SIZE (firm size), and Q (Tobin‘s q) in terms of both target and acquirer.
The multivariate models for buy and hold market-adjusted returns (BHMAR) and
industry-adjusted returns on asset (IAROA) are as following:
0 1 2 3 4
5 6 7 8
9 10 11 12 13
BHMAR AROE TROE AGROWTH TGROWTH
ALIQUIDITY TLIQUIDITY ALEVERAGE TLEVERAGE
ASIZE TSIZE AQ TQ EMPLOYMENT
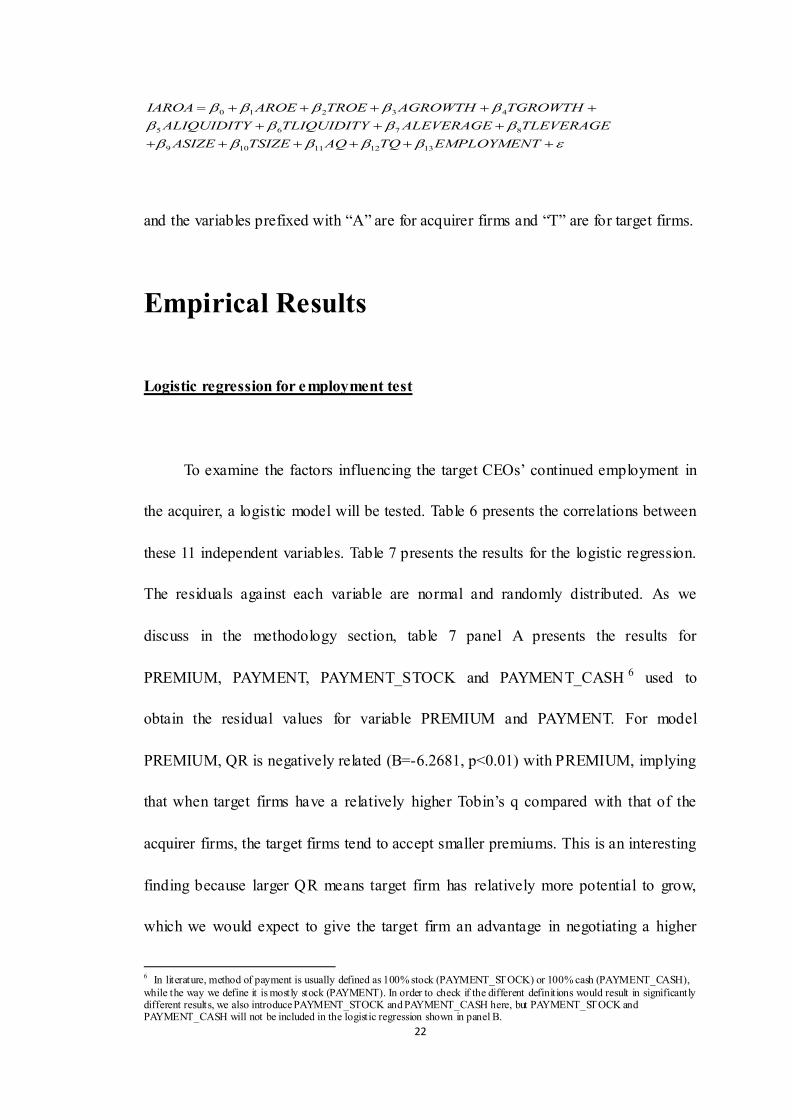
22
0 1 2 3 4
5 6 7 8
9 10 11 12 13
IAROA AROE TROE AGROWTH TGROWTH
ALIQUIDITY TLIQUIDITY ALEVERAGE TLEVERAGE
ASIZE TSIZE AQ TQ EMPLOYMENT
and the variables prefixed with ―A‖ are for acquirer firms and ―T‖ are for target firms.
Empirical Results
Logistic regression for employment test
To examine the factors influencing the target CEOs‘ continued employment in
the acquirer, a logistic model will be tested. Table 6 presents the correlations between
these 11 independent variables. Table 7 presents the results for the logistic regression.
The residuals against each variable are normal and randomly distributed. As we
discuss in the methodology section, table 7 panel A presents the results for
PREMIUM, PAYMENT, PAYMENT_STOCK and PAYMENT_CASH 6 used to
obtain the residual values for variable PREMIUM and PAYMENT. For model
PREMIUM, QR is negatively related (B=-6.2681, p<0.01) with PREMIUM, implying
that when target firms have a relatively higher Tobin‘s q compared with that of the
acquirer firms, the target firms tend to accept smaller premiums. This is an interesting
finding because larger QR means target firm has relatively more potential to grow,
which we would expect to give the target firm an advantage in negotiating a higher
6 In literature, method of payment is usually defined as 100% stock (PAYMENT_STOCK) or 100% cash (PAYMENT_CASH),
while the way we define it is mostly stock (PAYMENT). In order to check if the different definitions would result in significantly different results, we also introduce PAYMENT_STOCK and PAYMENT_CASH here, but PAYMENT_STOCK and PAYMENT_CASH will not be included in the logistic regression shown in panel B.
23
premium from acquirer firms. However, the result here suggests that target firms did
not take this advantage. If we go back to table 1, we can see that non-hired group
whose mean and median target Tobin‘s q (2.76 and 1.74) are much smaller than those
of the hired two years group (3.51 and 2.21) and hired one year group (3.32 and 1.96),
while the mean and median premium of the non-hired group (47.44% and 40.88%)
are the largest compared with those of the other three groups. This implies that CEOs
of the non-hired group did a very good job in negotiating with the acquirer firms
because they sell their worse-performing firms (lower Tobin‘s q) for higher prices
(larger premium). The relation between premium and target Tobin‘s q in table 1 is
consistent with the relation between premium and target Tobin‘s q found in
PREMIUM model of table 7 panel A. For model PAYMENT and
PAYMENT_STOCK, CEOD is positively related (B=0.6156, p<0.01 and B=0.8337,
p<0.1), implying that dominating target CEOs are more likely to receive stock
payment instead of other payments. In addition, QR is positively related to payment
(B=0.1629, p<0.1) and PAYMENT_STOCK (B=0.0229, p>0.1), although not
significant for the PAYMENT_STOCK, implying that the higher the target Tobin‘s q,
the more likely that the target firms would receive stock payment and this finding is
consistent with the finding in table 1, which also shows a positive relationship
between PAYMENT/PAYMENT_STOCK and TQ.
The result in model PAYMENT_CASH implies that target firms who receive
cash payment are associated with lower Tobin‘s q. From the PREMIUM and
PAYMENT tests in panel A, we obtain the residual values PREMIUM*and
24
PAYMENT* for variable PREMIUM and PAYMENT, respectively. After we obtain
the residual values for variables PREMIUM and PAYMENT, we substitute
PREMIUM and PAYMENT with PREMIUM*and PAYMENT* in the logistic model
EMPLOYMENT to remove the effects on EMPLOYMENT that have already been
explained by the variable CEOD, TENURE, INSOWN, QR, PAYMENT
(PREMIUM).
Table 7 panel B presents the results of the multivariate employment test. From
the results, as we hypothesize, QR is positively and significantly related to
EMPLOYMENT, implying that acquirer firms tend to hire the CEOs from the target
firms with higher Tobin‘s q relative to acquirer firms. A target firm with higher
Tobin‘s q means more potential to grow and reflects better pre-acquisition
performance as well as CEO management skills, making the target firm and target
CEO more attractive to the acquirer firm. This could also be seen from table 2 panel A,
where the Non-hired group has a target Tobin‘s q (mean: 2.76, median: 1.74) that is
much smaller than those of the Hired group (mean: 3.41, median: 1.96). There is also
a positive and significant relation (B=2.0392, p<0.001) between SIZER and
EMPLOYMENT, implying that the larger the target firm is relative to the acquirer, the
more likely that the target CEO would be hired by the acquirer firm. Larger target
firm size could also reflect better pre-acquisition target performance and CEO
management skills, which would be more attractive to the acquirer firm. The positive
relations between EMPLOYMENT and QR, EMPLOYMENT and SIZER are
consistent with our hypothesis 1, indicating that the pre-acquisition performance of

25
the target firms is positively related to target CEO‘s post-acquisition employment in
acquirer firms.
Variable BOSS is positively related (B=0.5045, p<0.05) with EMPLOYMENT,
which means that target CEOs who are also chairman of the board are more likely to
be hired by acquirer firms. It makes sense because offering a position to the target
CEO and Chairman, who is the leader of both firm management and the board might
make the negotiation of the deal proceed more smoothly. Although Yermack (1997)
and Rechner & Dalton (1991) have shown that firms which separate the roles of CEO
and chairman of the board outperform those with combined roles of CEO and
chairman, in our case, acquirer firms prefer to hire target CEOs who are also chairman
of the target board. CEOD (B=0.1312, p=0.12) and INSOWN (B=1.5209, p=0.89) are
also positively related to EMPLOYMENT, although not significant, indicating that
more dominant target CEOs and target CEOs with larger beneficial ownership are
more likely to be hired by acquirer firms. As discussed in our hypothesis 2, larger
BOSS, CEOD, and INSOWN values indicate stronger target CEO control over the
target firm and the findings in our employment test for BOSS, CEOD, INSOWN are
consistent with our hypothesis 2, that is, the target CEO‘s control over the target firm
is positively related to target CEO‘s post-acquisition employment in acquirer firms.
TENURE is positively related (B=0.0217, p<0.1) with EMPLOYMENT, that is to say,
the longer that target CEOs worked in the target firms, the more likely they would
subsequently be hired by the acquirer firms. Longer time of services in the target
firms would make target CEOs more familiar with the management and operation of

26
the firm, and hiring these experienced CEOs in the post-acquisition acquirer firms
(firms that combined with target firms) might benefit the future performance of the
merged firms. Variable AGE is positively and significantly related (B=0.0355, p<0.05)
to EMPLOYMENT, indicating that the older the target CEO, the more likely that this
CEO would be hired by the acquirer firm. Older target CEOs usually have more work
experience in the target firms or other firms, which gives them an advantage
compared to younger CEOs. However, another possible reason that might explain
why older CEOs are more likely to be hired is that older CEOs might be less
ambitious than the younger ones, in other words, maybe they would rather stay in the
acquirer firm with a less important position (for example, advisor or consultant) than a
more important position which might threaten the acquirer CEO‘s position. SIC is
also positively, but not significantly, related (B=0.2553, p>0.1) to EMPLOYMENT,
indicating that target CEOs with more work experience in the same industries as the
acquirer firms are more likely to be hired by acquirer firms. As we mentioned in
hypothesis 3, larger TENURE, AGE, and SIC values indicate more work experience
of the target CEOs, and the findings here for TENURE, AGE, and SIC are consistent
with our hypothesis 3, which hypothesizes that the target CEO‘s pre-acquisition work
experience will be positively related to target CEO‘s post-acquisition employment in
acquirer firms.
PREMIUM* is positively related (B=0.0028, p>0.1) to EMPLOYMENT,
implying that target CEO who obtained an unexpectedly high premium for their target
shareholders might be hired by acquirer firms, but the result is not significant. This
27
could be interpreted from two perspectives. First, some target CEOs obtained a higher
premium because the target firms perform relatively well before acquisition, in other
words, they deserve a higher premium. This could be seen from the hired two years
group in table 1, whose TQ and PREMIUM are both higher. As a result, the acquirer
firms would still like to hire these well-performed target CEOs, even they have to
offer a higher premium. Second, some target CEOs obtained a higher premium for
worse performing target firms, in this case, the acquirer firms might dismiss these
target CEOs from the future positions. This can also be seen from the non-hired group
in table 1, whose TQ values are lower, but obtain a higher premium. In our hypothesis
4, we expect that both PREMIUM* and TENURE will be negatively related to
EMPLOYMENT. However, in addition to PREMIUM*, we find TENURE also
positively relates to EMPLOYMENT, although only at 10% significant level. Longer
tenure could mean more work experience, but might also indicate more loyalty to the
target shareholders, and this might be why some target CEOs with longer tenure were
not hired by acquirer firms. As discussed above, our test results for PREMIUM* and
TENURE could not fully support our hypothesis 4, which hypothesize that target
CEO‘s loyalty to target shareholders will be negatively related to target CEO‘s
post-acquisition employment in acquirer firms.
Lastly, PAYMENT* (B=0.6098, p<0.01) positively and significantly relates to
EMPLOYMENT, indicating that target CEOs who receive stock payment are more
likely to be hired by the acquirer firms. This finding is consistent with what we
showed in table 1 for PAYMENT, the values of the Hired one year group and Hired

28
two years group are much higher than those of the Non-hired group and Retired group,
implying that acquirer firms are more likely to hire target CEOs who receive stock
payment. Our finding is also consistent with the findings of Ghosh & Ruland (1998)
and Hartzell & Yermack (2004). As a result, the finding for PAYMENT supports our
hypothesis 5, that is, the target CEO who receives more stock payment will be
positively related to target CEO‘s post-acquisition employment in acquirer firms.
In addition to the tests of the five hypotheses above, we also include variable
EDU into our employment model to control the effects of target CEO‘s MBA degree
on his future employment in the acquirer firm. However, variable EDU has a negative
coefficient (B=-0.1018, p=0.14), that is, negatively relates to EMPLOYMENT. This
might not imply that MBA degree has opposite effects on the target CEOs‘
employment in acquirer firms, but it shows that whether target CEO has an MBA
degree or not is not the acquirer firm‘s top concern.
Influences of the target CEO’s employment to the acquirer firm’s performance
To study the relationship between targets CEOs‘ continued employment in
acquirer firms and the post-acquisition performance of the merged firms, a
multivariate model that contains six variables (ROE, GROWTH, LIQUIDITY,
LEVERAGE, SIZE and Q) measuring pre-acquisition performance of the target firms
and acquirer firms and two variables (EMPLOYMENT1 and EMPLOYMENT2)
measuring target CEO‘s employment in acquirer firms will be tested. Table 8 presents

29
correlations between the independent variables. Table 9 shows the test results for buy
and hold market-adjusted return (BHMAR) and industry-adjusted return on asset
(IAROA) for three years after the acquisitions. The residuals against each variable are
normal and randomly distributed.
For the ROE, first-year AROE is positively and significantly related to both
BHMAR (B=0.2523, p<0.1) and IAROA (B=0.3621, p<0.01), and first-year TROE is
also positively related to both BHMAR (B=0.0633, p>0.1) and IAROA (B=0.0523,
p>0.1), but not significantly. The second-year AROE is positively and significantly
related to both BHMAR (B=0.3431, p<0.05) and IAROA (B=0.2411, p<0.05), and the
same for second-year TROE, which is positively related to BHMAR (B=0.1533,
p<0.1) and IAROA (B=0.0027, p>0.1), although not significant for the second-year
IAROA. When it comes to the third year, AROE is negatively related to both
BHMAR (B=-0.2242, p>0.1) and IAROA (B=-0.1274, p>0.1), although neither is
significant. TROE is positively related to BHMAR (B=0.0971, p>0.1) and negatively
related to IAROA (B=-0.1144, p>0.1). In summary, for both pre-acquisition target and
acquirer firm return on equity (TROE and AROE), they have positive influence on the
first and second year post-acquisition performance of the acquirer firm and the
influence is more significant in the second year. When it comes to the third year,
pre-acquisition AROE and TROE have more negative influences, but none is
significant.
As for GROWTH, the first-year AGROWTH is significantly and negatively
related to BHMAR (B=-0.0942, p<0.1) and IAROA (B=-0.0642, p<0.05), while the

30
first-year TGROWTH is positively related to BHMAR (B=0.0221, p>0.1) and
IAROA (B=0.0114, p>0.1), although not significantly. The second-year AGROWTH
is significantly and negatively related to both BHMAR (B=-0.122, p<0.1) and IAROA
(B=-0.0874, p<0.05), while TGROWTH positively relates to BHMAR (B=0.0821,
p<0.1) and IAROA (B=0.0357, p>0.1). When it comes to the third year, AGROWTH
becomes positively related to both BHMAR (B=0.1164, p<0.05) and IAROA
(B=0.0523, p>0.1), while TGROWTH becomes negatively related to BHMAR
(B=-0.0422, p>0.1) and IAROA (B=-0.0414, p>0.1). In summary, for pre-acquisition
sales growth (GROWTH), sales growth of the acquirer firms (AGROWTH) has
significantly and consistently negative effects on the first and second year
post-acquisition acquirer firm performance, indicating that the lower the acquirer
firm‘s pre-acquisition sales growth rate, the better the post-acquisition acquirer firm
performs in the first and second year. Sales growth of target firms (TGROWTH) has
consistently positive effects on the first and second year post-acquisition acquirer firm
performance, implying that the higher the target firm‘s pre-acquisition sales growth
rate, the better the post-acquisition acquirer firm performs in the first and second year.
However, when it comes to the third year, the effects for both AGROWTH and
TGROWTH reverse.
When it comes to LIQUIDITY, for the first year, ALIQUIDITY is positively
related to BHMAR (B=0.1422, p>0.1) and negatively related (B=-0.0524, p>0.1) with
IAROA, but either of them is significant, TLIQUIDITY negatively relates to BHMAR
(B=-0.2923, p<0.1) at 10% significant level, but positively relates to IAROA

31
(B=0.0557, p>0.1). For the second year, ALIQUIDITY is positively related to
BHMAR (B=0.1433, p>0.1) and IAROA (B=0.0714, p>0.1), while TLIQUIDITY is
also positively related to both BHMAR (B=0.2841, p<0.1) and IAROA (B=0.0174,
p>0.1). When it comes to the third year, ALIQUIDITY becomes negatively related to
BHMAR (B=-0.331, p<0.1) and positively related to IAROA (B=0.3152, p>0.1),
while TLIQUIDITY becomes positively related to BHMAR (B=0.1142, p>0.1) and
negatively related to IAROA (B=-0.3345, p>0.1). In summary, there is no consistent
effect on the first-year and third-year post-acquisition acquirer firm performance for
both ALIQUIDITY and TLIQUIDITY. Only in the second year, there is a posit ive
effect on the post-acquisition acquirer firm performance for both ALIQUIDITY and
TLIQUIDITY, indicating that the higher the pre-acquisition acquirer and target firm
liquidity, the better the post-acquisition acquirer firm performs in the second year.
As for LEVERAGE, ALEVERAGE is consistently and negatively related to
BHMAR (B=-0.1132, p>0.1; B=-0.2152, p<0.1; B=-0.1844, p>0.1; respectively) and
IAROA (B=-0.2654, p<0.01; B=-0.1427, p>0.1; B=-0.5751, p<0.1; respectively) for
three consecutive years. The same for TLEVERAGE, it is also consistently and
negatively related to BHMAR (B=-0.2331, p<0.05; B=-0.1531, p>0.1; respectively)
and IAROA (B=-0.1247, p<0.05; B=-0.0379, p>0.1; respectively) for the first two
years, while in the third year, it is positively related to BHMAR (B=-0.0981, p>0.1),
but not significant and negatively related to IAROA (B=-0.3745, p<0.1). In summary,
the relations between LEVERAGE and BHMAR, LEVERAGE and IAROA are
consistent in the first two years, that is, the lower the pre-acquisition target and

32
acquirer firm‘s leverage, the better the post-acquisition acquirer firm performs in the
first year and second year. In the third year, the relation between TLEVERAGE and
BHMAR reverses.
ASIZE positively relates to BHMAR (B=0.0741, p<0.05; B=0.0021, p>0.1;
respectively) and IAROA (B=0.0257, p>0.1; B=0.0112, p>0.1; respectively) for the
first-year and second-year post-acquisition period, while in the third year, ASIZE is
negatively related to BHMAR (B=-0.0694, p>0.1) and IAROA (B=-0.0017, p>0.1).
As for TSIZE, it positively relates to BHMAR (B=0.0444, p>0.1; B=0.0072, p>0.1;
B=0.1855, p<0.01; respectively) for the three consecutive years and also positive
relates to IAROA (B=0.0042, p>0.1) for the second year. However, TSIZE is
negatively related to IROA (B=-0.0357 p>0.1; B=-0.1441, p>0.1; respectively) for the
first year and third year. In summary, for both ASIZE and TSIZE, there is a consistent
and positive relation with the second-year BHMAR and IAROA, indicating that the
larger the pre-acquisition acquirer and target firm size, the better the post-acquisition
acquirer firm performs in the second year. However, for TSIZE, there is no consistent
relation for the first year and third year.
As for the Q, in the first year, both AQ (B=-0.0054, p>0.1) and TQ (B=-0.0081,
p>0.1) are negatively related to BHMAR, while both AQ (B=0.0034, p>0.1) and TQ
(B=0.0001, p>0.1) are positively related to IAROA. In the second year, AQ is
negatively related to both BHMAR (B=-0.0223, p<0.1) and IAROA (B=-0.0064,
p>0.1), while TQ is significantly and positively related to both BHMAR (B=0.0221,
p<0.1) and IAROA (B=0.0138, p<0.1). When it comes to the third year, AQ
33
negatively relates to BHMAR (B=-0.0031, p>0.1), but positively relates to IAROA
(B=0.0288, p<0.1), while TQ is consistent with the second year and positively related
to both BHMAR (B=0.0187, p<0.1) and IAROA (B=0.0315, p<0.1). In summary,
only in the second year, there is a consistent relation for AQ and TQ, that is, the lower
the pre-acquisition acquirer firm‘s Tobin‘s q and the higher the pre-acquisition target
firm‘s Tobin‘s q, the better the post-acquisition acquirer firm performs. However, for
the first year and the third year, there is no consistent relation for them.
For the target CEOs who were hired by acquirer firms (EMPLOYMENT1 and
EMPLOYMENT2), in the first year, both EMPLOYMENT1 and EMPLOYMENT2
are negatively related to BHMAR (B=-0.0301, p>0.1; B=-0.1129, p<0.05;
respectively) and IAROA (B=-0.0227, p>0.1; B=-0.0186, p>0.1; respectively),
indicating that the hired target CEOs (both those hired one year and two years), did
not improve the first-year post-acquisition performance of the acquirer firms, and this
finding also supports our hypothesis 1 of the performance test. In the second year,
EMPLOYMENT1 is negatively related to BHMAR (B=-0.0928, p<0.1) and IAROA
(B=-0.0777, p>0.1), while EMPLOYMENT2 is positively and significantly related to
BHMAR (B=0.1727, p<0.05) and IAROA (B=0.1696, p<0.1). This indicates that
hired two years target CEOs significantly improve the second year post-acquisition
performance of the acquirer firm and this is also consistent with our hypothesis 2 of
performance test. In the third year, EMPLOYMENT1 is positively related to BHMAR
(B=0.0339, p>0.1), but negatively related to IAROA (B=-0.0971, p>0.1), and
EMPLOYMENT2 still positively relates to BHMAR (B=0.1241, p>0.1) and IAROA

34
(B=0.0073, p>0.1), implying that the positive effects of the hired two years target
CEOs on the second year post-acquisition performance of the acquirer firms might
continue to the third year.
More interestingly, we find that signs of the coefficients of each variable are
consistent for the second year when comparing BHMAR with IAROA, while the
signs for the first year and third year are quite different and inconsistent comparing
BHMAR with IAORA. This finding suggests that the pre-acquisition target and
acquirer performance have a more consistent influence on the second-year
post-acquisition performance of the merged firm.
In addition to the multivariate tests presented in table 9, we also conduct the test
with target variables and acquirer variables separately to see if the results change
significantly. Table 10 summarizes the multivariate tests for BHMAR and IAROA by
target variables and acquirer variables separately. The residuals against each variable
are normal and randomly distributed.
In table 10, for the tests with acquirer variables under BHMAR and IAROA, in
the first year, AQ is negatively related (B=0.01, p>0.1) to BHMAR, while positively
and significantly related (B=0.0054, p<0.1) to IAROA. The coefficient signs for other
variables do not change for both BHMAR and IAROA. In the second year, the results
are consistent and there is no change in the coefficient signs for all the acquirer
variables. However, when it comes to the third year, the coefficient sign of
ALEVERAGE, which is positive under BHMAR (B=0.0725, p>0.1), becomes
negative under IAROA (B=-0.7076, p<0.01). Additionally, variable AQ, which is
35
negatively related to BHMAR (B=-0.005, p>0.1), becomes positively related to
IAROA (B=0.0386, p<0.01). Once again, changes in the coefficient signs of the
acquirer variables are observed in the first year and third year when comparing
BHMAR with IAROA, while the coefficient signs for the second year are the most
consistent. For the tests with target variables under BHMAR and IAROA, in the first
year, the variables TLIQUIDITY and TQ are negatively related to BHMAR
(B=-0.3391, p<0.05; B=-0.0094, p>0.1; respectively), while positively related to
IROA (B=0.0158, p>0.1; B=-0.0016, p>0.1; respectively). Moreover, variables TROE
and TSIZE, who are positively related to BHMAR (B=0.0543, p>0.1; B=0.0814,
p>0.1; respectively), become negatively related to IAROA (B=-0.0381, p>0.1;
B=-0.0263, p>0.1; respectively). In the second year, the same as the tests with
acquirer variables, there is no changes in the variables‘ coefficient signs. When it
comes to the third year, once again, changes in the coefficient signs of the variables
are observed. The variables TROE, TLIQUIDITY, TLEVERAGE, and TSIZE which
are positively related to BHMAR, all become negatively related to IAROA. In
summary, as for the target variables, changes in the coefficient signs in the first year
and third year are observed when comparing BHMAR with IAROA, and as with the
test of acquirer variables, the coefficient signs for the target variables are consistent in
the second year for both BHMAR and IAROA.
Comparing the results in table 9 with table 10, we find that in both tables, the
36
coefficient signs of each variable are quite consistent for the second year, while the
coefficient signs of the variables for the first year and third year are quite different and
inconsistent when comparing BHMAR with IAORA. This finding implies that the
pre-acquisition target and acquirer firms‘ performance have more consistent influence
on the second-year post-acquisition performance of the merged firm. Additionally, in
the second year, comparing with the acquirer variables, the target variables under both
BHMAR and IAROA in table 10 are more significant than the target variables under
BHMAR and IAROA in table 9, which suggests that the pre-acquisition performance
of the target firms has a more significant influence on the second-year
post-acquisition performances of the merged firm. Moreover, in both tables 7 and 8,
some important characteristics of EMPLOYMENT1 and EMPLOYMENT2 can be
observed. We find that EMPLOYMENT1 and EMPLOYMENT2 have negative
influences on the first-year post-acquisition performance of the merged firm (for both
BHMAR and IAROA), implying that target CEOs hired by acquirer firms could not
improve the performance of the acquirer firms in the first year. This may because that
one year is too short for the positive effects of the hired target CEOs to show up.
When it comes to the second year, there is a significant and positive influence on the
BHMAR and IAROA caused by EMPLOYMENT2, indicating that the hired-two
years target CEOs‘ talents and experiences significantly improve the acquirer firms‘
performance in the second year. This positive effect on the merged firms‘ performance
might continue to the third year.
37
To investigate the effects of the hired target CEOs on the post-acquisition
performance of the acquirer firms, we separate our sample into three subgroups: hired
one year, hired two years, and non-hired group. Under each group, we calculate the
average performance (both BHMAR and IAROA) of each group for four years,
namely, the year that the acquisition takes place (0 year) and three consecutive years
after the effective year (1st year, 2nd year, and 3rd year). Table 11 summarizes the
average returns in each year under each subgroup in terms of BHMAR and IAROA.
Following the average returns showed in table 11, figure 1 shows the plot of average
returns for BHMAR while figure 2 shows the plot of average returns for IAROA.
Some interesting consistencies between figure 1 and figure2 can be observed. In
figure 1, the average BHMAR for the hired one year group goes down from year 0
to year 1, and continues to decline to 2nd year before it rises up in 3rd year. The same
as hired one year group, the average BHMAR for the non-hired group declines from
year 0 to year 2 before rising in 3rd year. However, the average BHMAR for the hired
two years group only goes down for one year (from 0 year to 1st year) and rises from
1st year to 2nd year and keeps going up in 3rd year. Moreover, figure 2 shows the same
trends for these three subgroups. The average IAROA for the hired one year group
goes down from 0 year to 1st year, and then keeps going down to 2nd year before it
goes up in 3rd year. The same as hired one year group, the average IAROA for the
non-hired group goes down from 0 year to 1st year, and then goes down in the 2nd year
before goes up in 3rd year. The same as hired two years group of average BHMAR,
the average IAROA for the hired two years group only goes down for one year (from
38
0 year to 1st year) and goes up from 1st year to 2nd year and keeps going up in 3rd year.
In summary, the consistencies between figure 1 and figure 2 shows that
compared to the hired one year group (target CEOs hired by acquirer firms for one
year or less) and non-hired group (target CEOs not hired by acquirer firms), the hired
two years group (target CEOs hired by acquirer firms for at least two years) improve
the second-year post-acquisition performances of the acquirer firms. This finding is
consistent with the results in table 9 and table 10, which also indicate that
EMPLOYMENT2 has a positive and significant influence on the second-year
BHMAR and IAROA. Also, when it comes to the third year, the hired two years
group has the highest average BHMAR (0.05) and IAROA (0.32), followed by the
non-hired group with an average BHMAR (-0.01) and IAROA (0.26), while the
hired-one year group has the lowest average BHMAR (-0.03) and IAROA (0.24),
indicating that the acquirer firms who hired target CEOs for at least two years have
the best average post-acquisition performance until at least the third year.

39
Conclusion
The object of this paper is to shed light on two main questions: why some target
CEOs are hired by the acquirer firm while others depart after the acquisitions? And
what is the influence of the target CEOs on the post-acquisition performance of the
merged firm?
To answer the first question, we use a logistic model to test the variables that
would influence the target CEOs‘ employment in the acquirer firms. We have the
following five hypotheses: (1) the pre-acquisition performance of the target firms will
be positively related to target CEO‘s post-acquisition employment in acquirer firms;
(2) the target CEO‘s control over the target firm will be positively related to target
CEO‘s post-acquisition employment in the acquirer firm; (3) the target CEO‘s
pre-acquisition work experience will be positively related to target CEO‘s
post-acquisition employment in the acquirer firm; (4) the target CEO‘s loyalty to
target shareholders will be negatively related to target CEO‘s post-acquisition
employment in the acquirer firm; (5) a stock payment will be positively related to the
target CEO‘s post-acquisition employment in the acquirer firm. Our tests support the
hypotheses (1) (2) (3) (5), while the hypothesis (4) can not be fully supported. Our
conclusions for the first question are that the target CEO is more likely to be hired by
the acquirer firm if (1) the target firm has a better pre-acquisition performance (2) the
target CEO has a stronger control over that target firm (3) the target CEO has more
work experiences (4) the target CEO receives more stock payment.
40
To answer the second question, we estimate a multivariate model of
post-acquisition performance as a function of two target CEO employment dummy
variables, EMPLOYMENT1 (target CEOs hired by acquirer firms for maximum one
year) and EMPLOYMENT2 (target CEOs hired by acquirer firms for at least two
years), and control for pre-acquisition target/acquirer performance. Two measures of
acquirer firms‘ performance are used in the model, namely a market-based criterion
(buy & hold market-adjusted return) and an accounting-based criterion (industry
adjusted return on asset). The main conclusions are as following. (1) Pre-acquisition
target and acquirer firms‘ performance (especially the target firms‘ performance) have
a more significant and positive influence on the second-year post-acquisition
performance of the merged firms. (2) The hired target CEOs negatively influence the
first-year post-acquisition performance of the acquirer firms. (3) The target CEOs
hired by acquirer firms for at least two years significantly improve the second-year
post-acquisition performance of the merged firms and this positive effect might
continue to the third year.
The findings of this paper suggest a number of interesting questions for future
research. As we see in table 7 panel A, CEOD is positively related to PAYMENT and
PAYMENT_STOCK, while negatively related to PAYMENT_CASH, indicating that a
dominating target CEO prefers stock payment to cash payment. However, in panel B,
we find that target CEOs who prefer stock payment are more likely to be hired, while
the dominating target CEO (who also prefer stock payment ) are not. So it is
interesting to find out why those dominating target CEOs did not get hired by acquirer

41
firms. Is this because they prefer stock payment not for getting hired by acquirer firms,
but for other purposes, like tax saving? Another interesting area is the target CEOs of
the hired groups. We separate them into two subgroups, namely hired one year group
and hired two years group. For the hired one year target CEOs, it is interesting to find
more on why they got hired for only such a short time, is it really because to hire them
just for the purpose of smoothing the acquisition or are there other reasons? For the
hired two years target CEOs, we find that they improve the second-year and third-year
post-acquisition performances of the merged firms, but it is not clear how they could
improve the acquirer firms‘ performances. Future research could start from the CEO
qualities (for example, previous work experiences) of these hired two years CEOs,
and find their special talents that would help improve the acquirer firms‘ performance.
Besides, as mentioned in data part, we only choose 500 deals with the largest target
enterprise values as our sample, and this could be a bias of our paper, future research
should avoid this bias and balance the large value deals with small value deals.

42
Appendix
List of tables
a There should be 160 target CEOs in the ―Hired two years‖ group (hired by acquirer firms for at least two years after the
acquisitions). However, we find that five of the acquirer firms owned more than 50% percent of the target firms‘ stock before the
deal announcement, and these target CEOs had already worked in the acquirer firms before the deal announcements. As these
cases do not reflect a potential reorganization of the acquirer management team, we eliminate them from the sample.
b There should be 259 target CEOs in the ‖Non-hired‖ group (not hired by acquirer firms after the acquisitions). Due to the same
reason as the five targets and acquirers removed from the ―Hired two years‖ group, we remove 8 targets and acquirers here from
our sample.
Variable definitions:
PAYMENT= dummy variable that measures the percentage of different payment methods (stock payment, cash payment, other
payments) the acquirer firm used to target firm, which equals to one if the percentage of stock payment is the largest, and zero
otherwise.
PAYMENT_STOCK= another dummy variable that measures the payment method, which equals to one if the payment is 100%
stock, and zero otherwise.
PAYMENT_CASH= another dummy variable that measures the payment method, which equals to one if the payment is 100%
cash, and zero otherwise.
PREMIUM= offer price premium as percentage of 4-week trading price.
TQ= Tobin‘s q for target firm.
NEW POSITIONS= target CEOs‘ job positions in the acquirer firms (for the groups ―Hired one year‖ and ―Hired two years‖) and
in the new firms (for subgroup ―Non-hired‖). New positions are divided into two categories: top executives (important positions
like CEO, chairman of the board, president, and chief operating officers, etc.) and others (less important positions like advisor
and consultant, etc.)
43
a Group ―Hired‖ here is the combination of the group ―Hired one year‖ and group ―Hired two years‖ from table 1.
b There are 251 target CEOs who were not hired by the acquirer firms and got jobs in other firms. However, only 110 of them got
jobs in public firms (which we can get data to calculate Tobin‘s q and firm sizes for these firms). Other 141 target CEOs got jobs
in private organizations or started their own new business.
Variable definitions:
TQ= Tobin‘s q for target firm.
TSIZE= target firm size.
Qnew firm= Tobin‘s q of acquirer firms under the group ―Hired‖ and Tobin‘s q of new firms that hired non-hired CEOs under the
group ―Non-hired‖
SIZEnew firm= firm sizes of acquirer firms under the group ―Hired‖ and firm sizes of new firms that hired non-hired CEOs under
the group ―Non-hired‖
Qhired= Qnew firm under the group ―Hired‖, that is, Tobin‘s q of acquirer firms that hired the target CEOs.
Qnon-hired= Qnew firm under the group ―Non-hired‖, that is, Tobin‘s q ratio of new firms that hired the non-hired target CEOs
SIZEhired= SIZEnew firm under the group ―Hired‖, that is, firm sizes of acquirer firms that hired the target CEOs.
SIZEnon-hired= SIZEnew firm under the group ―Non-hired‖, that is, firm sizes of new firms that hired non-hired CEOs

44
Variable definitions:
QR= the ratio of target Tobin‘s q to the acquirer Tobin‘s q.
SIZER= the ratio of target firm's book value of asset to the acquirer firm's book value of asset.
CEOD= the ratio of target firm's CEO salary and bonus in the year preceding mergers and acquisitions to the average salary and
bonus of other executives.
BOSS= dummy variable equals to one if a target firm‘s CEO is also a Chairman of its board in the year preceding mergers and
acquisitions, and zero otherwise.
INSOWN= percentage of common shares of the target firm that the target chief executives officers owned preceding mergers and
acquisitions.
TENURE= number of years the target chief executive officers worked in the target firm preceding mergers and acquisitions.
SIC= dummy variable which equals to one if the target firm and acquirer firm are from the same industry (the same 4 digit SIC
code), and zero otherwise.
AGE= age of target chief executive officers preceding mergers and acquisitions.
PREMIUM= offer price premium as percentage of the price 4 weeks before the deal announcement.
PAYMENT= dummy variable that measures the different payment methods and equals to one if the percentage of stock payment
is the largest, and zero otherwise
EMPLOYMENT1= dummy variable which equals to one if a target CEO continually employed in the acquirer firm after the
acquisition for only one year or less, and zero otherwise.
EMPLOYMENT2= dummy variable which equals to one if a target CEO continually employed in the acquirer firm after the
acquisition for at least two years, and zero otherwise.
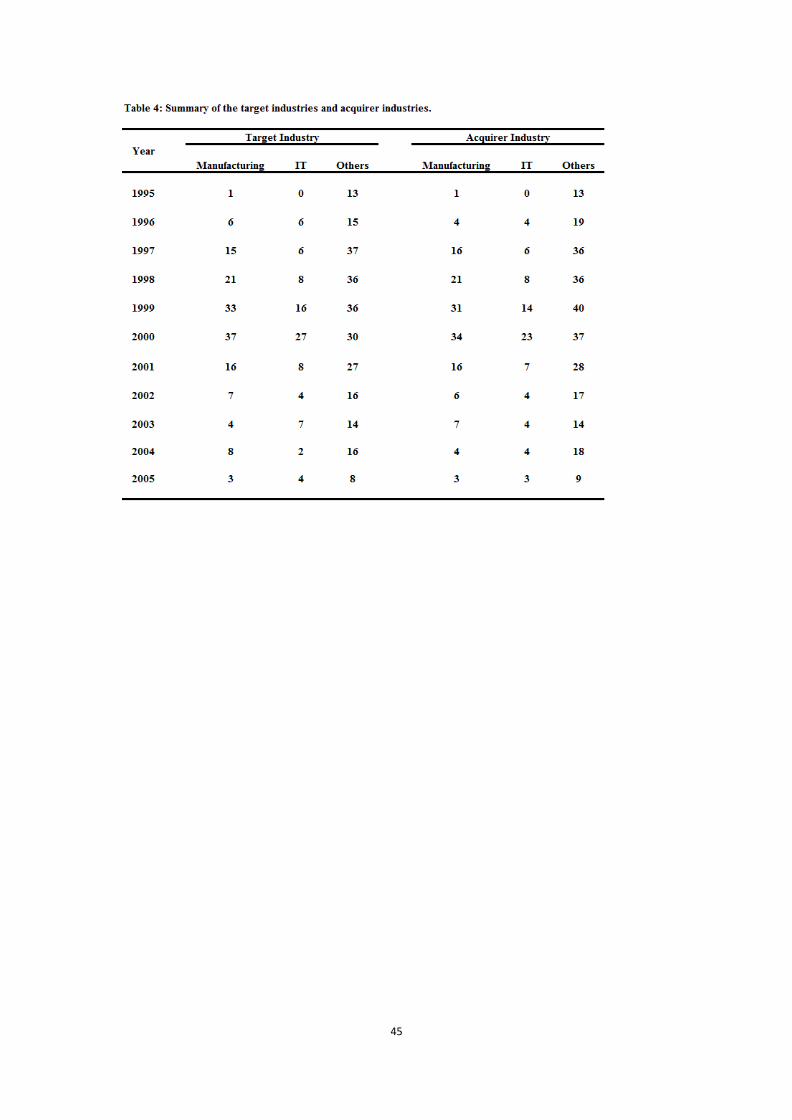
45

46
Variable definitions:
CEOD= CEO dominance, the ratio of target firm‘ s CEO salary and bonus in the year preceding mergers and acquisitions to the
average salary and bonus of other executives
BOSS= dummy variable equals to one if a target firm‘s CEO is also a Chairman of its board in the year preceding mergers and
acquisitions, and zero otherwise.
TENURE= the number of years the target CEOs worked in the target firms before the effective of the deal.
INSOWN= the percentage of common shares of the target firm that the target CEO owned one year before the effective of the
deal.
PAYMENT= dummy variable equals to one if the percentage of stock payment is the largest, and zero otherwise.
QR= a ratio of target Tobin‘s q to the acquirer Tobin‘s q
SIZER= a ratio of target firm size to the acquirer firm size.
EDU= dummy variable which is equal to one if a CEO has an MBA degree, and zero otherwise.
SIC= dummy variable equals to one if the target firm and acquirer firm are from the same industry (the same 4 digit SIC code),
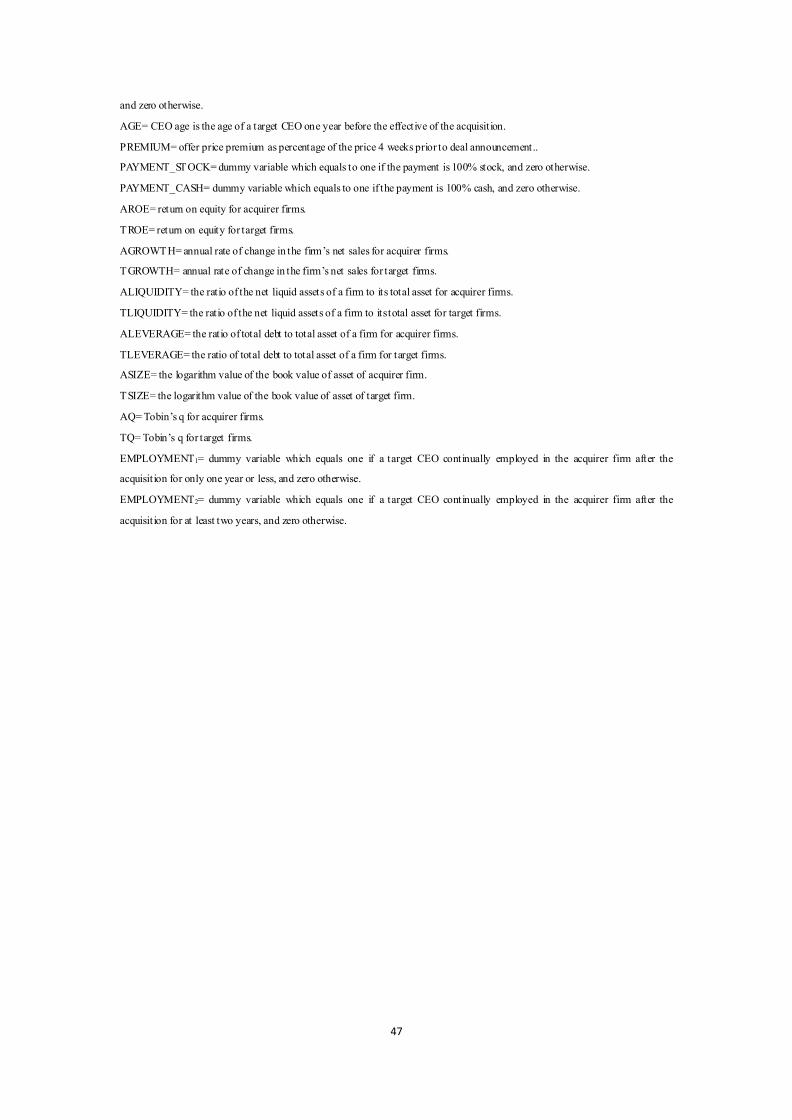
47
and zero otherwise.
AGE= CEO age is the age of a target CEO one year before the effective of the acquisition.
PREMIUM= offer price premium as percentage of the price 4 weeks prior to deal announcement..
PAYMENT_STOCK= dummy variable which equals to one if the payment is 100% stock, and zero otherwise.
PAYMENT_CASH= dummy variable which equals to one if the payment is 100% cash, and zero otherwise.
AROE= return on equity for acquirer firms.
TROE= return on equity for target firms.
AGROWTH= annual rate of change in the firm‘s net sales for acquirer firms.
TGROWTH= annual rate of change in the firm‘s net sales for target firms.
ALIQUIDITY= the ratio of the net liquid assets of a firm to its total asset for acquirer firms.
TLIQUIDITY= the ratio of the net liquid assets of a firm to its total asset for target firms.
ALEVERAGE= the ratio of total debt to total asset of a firm for acquirer firms.
TLEVERAGE= the ratio of total debt to total asset of a firm for target firms.
ASIZE= the logarithm value of the book value of asset of acquirer firm.
TSIZE= the logarithm value of the book value of asset of target firm.
AQ= Tobin‘s q for acquirer firms.
TQ= Tobin‘s q for target firms.
EMPLOYMENT1= dummy variable which equals one if a target CEO continually employed in the acquirer firm after the
acquisition for only one year or less, and zero otherwise.
EMPLOYMENT2= dummy variable which equals one if a target CEO continually employed in the acquirer firm after the
acquisition for at least two years, and zero otherwise.

48
Variable definitions:
CEOD= CEO dominance, the ratio of target firm‘ s CEO salary and bonus in the year preceding mergers and acquisitions to the
average salary and bonus of other executives
BOSS= dummy variable equals one if a target firm‘s CEO is also Chairman of its board in the year preceding mergers and
acquisitions, and zero otherwise.
TENURE= the number of years the target CEO worked in the target firm before the effective date of the deal.
INSOWN= the percentage of common shares of the target firm that the target CEO owned one year before the effective date of
the deal.
PAYMENT= dummy variable equals to one if the percentage of stock payment is the largest, and zero otherwise.
QR= a ratio of target Tobin‘s q to the acquirer Tobin‘s q
SIZER= a ratio of target firm size to the acquirer firm size.
EDU= dummy variable which is equal to one if the target CEO has an MBA degree, and zero otherwise.
SIC= dummy variable equals to one if the target firm and acquirer firm are from the same industry (the same 4 digit SIC code),
and zero otherwise.
AGE= CEO age is the age of a target CEO one year before the effective of the acquisition.
PREMIUM= offer price premium as percentage of the price 4 weeks prior to deal announcement.
PAYMENT_STOCK= dummy variable which equals one if the payment is 100% stock, and zero otherwise.
PAYMENT_CASH= dummy variable which equals one if the payment is 100% cash, and zero otherwise.
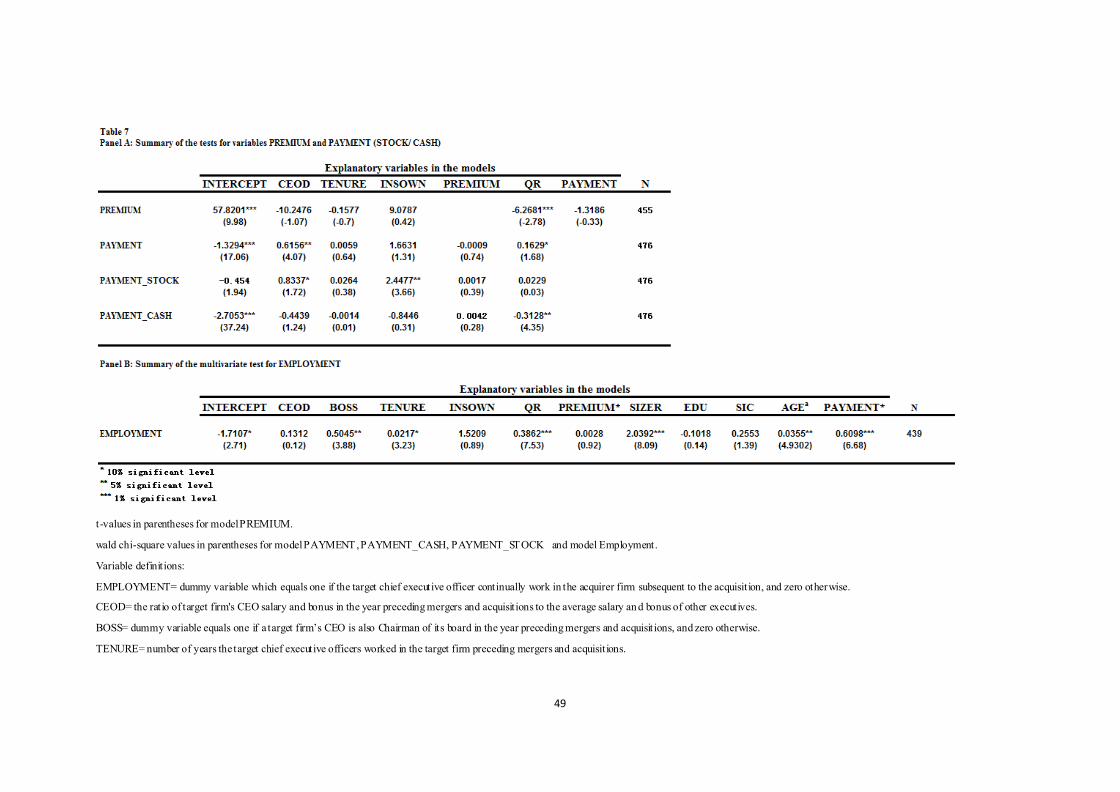
49
t-values in parentheses for model PREMIUM.
wald chi-square values in parentheses for model PAYMENT , PAYMENT_CASH, PAYMENT_STOCK and model Employment.
Variable definitions:
EMPLOYMENT= dummy variable which equals one if the target chief executive officer continually work in the acquirer firm subsequent to the acquisition, and zero otherwise.
CEOD= the ratio of target firm's CEO salary and bonus in the year preceding mergers and acquisitions to the average salary and bonus of other executives.
BOSS= dummy variable equals one if a target firm‘s CEO is also Chairman of its board in the year preceding mergers and acquisitions, and zero otherwise.
TENURE= number of years the target chief executive officers worked in the target firm preceding mergers and acquisitions.
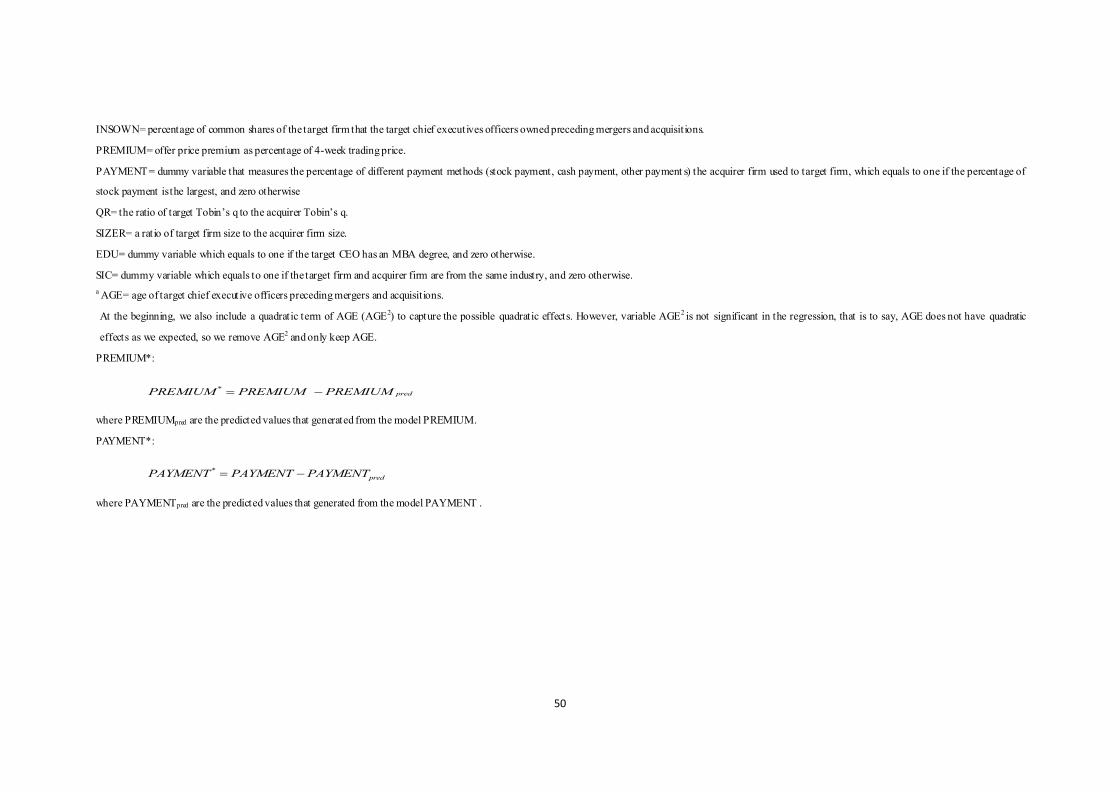
50
INSOWN= percentage of common shares of the target firm that the target chief executives officers owned preceding mergers and acquisitions.
PREMIUM= offer price premium as percentage of 4-week trading price.
PAYMENT= dummy variable that measures the percentage of different payment methods (stock payment, cash payment, other payment s) the acquirer firm used to target firm, which equals to one if the percentage of
stock payment is the largest, and zero otherwise
QR= the ratio of target Tobin‘s q to the acquirer Tobin‘s q.
SIZER= a ratio of target firm size to the acquirer firm size.
EDU= dummy variable which equals to one if the target CEO has an MBA degree, and zero otherwise.
SIC= dummy variable which equals to one if the target firm and acquirer firm are from the same industry, and zero otherwise.
a AGE= age of target chief executive officers preceding mergers and acquisitions.
At the beginning, we also include a quadratic term of AGE (AGE2) to capture the possible quadratic effects. However, variable AGE
2 is not significant in the regression, that is to say, AGE
does not have quadratic
effects as we expected, so we remove AGE2
and only keep AGE.
PREMIUM*:
where PREMIUMpred are the predicted values that generated from the model PREMIUM.
PAYMENT*:
where PAYMENTpred are the predicted values that generated from the model PAYMENT .
*predPREMIUM PREMIUM PREMIUM
*
predPAYMENT PAYMENT PAYMENT
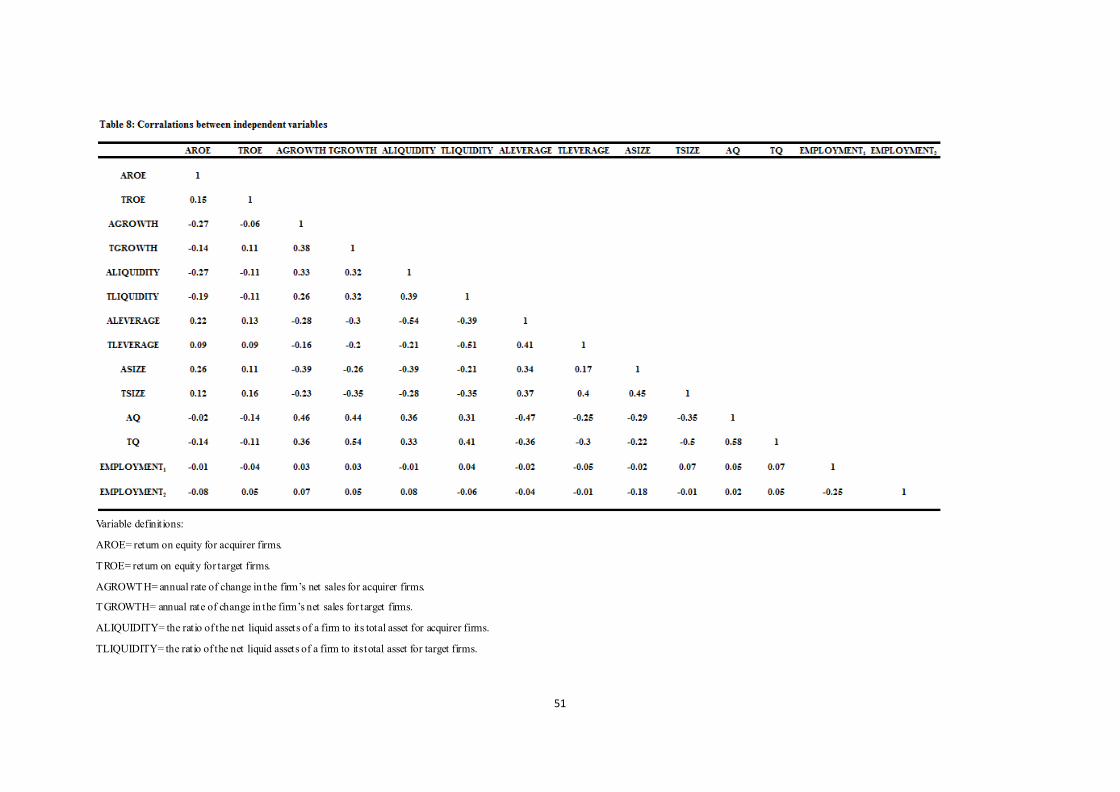
51
Variable definitions:
AROE= return on equity for acquirer firms.
TROE= return on equity for target firms.
AGROWTH= annual rate of change in the firm‘s net sales for acquirer firms.
TGROWTH= annual rate of change in the firm‘s net sales for target firms.
ALIQUIDITY= the ratio of the net liquid assets of a firm to its total asset for acquirer firms.
TLIQUIDITY= the ratio of the net liquid assets of a firm to its total asset for target firms.
52
ALEVERAGE= the ratio of total debt to total asset of a firm for acquirer firms.
TLEVERAGE= the ratio of total debt to total asset of a firm for target firms.
ASIZE= the logarithm value of the book value of asset of acquirer firm.
TSIZE= the logarithm value of the book value of asset of target firm.
AQ= Tobin‘s q for acquirer firms.
TQ= Tobin‘s q for target firms.
EMPLOYMENT1= dummy variable which equals one if a target CEO continually employed in the acquirer firm after the acquisition for only one year or less, and zero otherwise.
EMPLOYMENT2= dummy variable which equals one if a target CEO continually employed in the acquirer firm after the acquisition for at least two years, and zero otherwise.
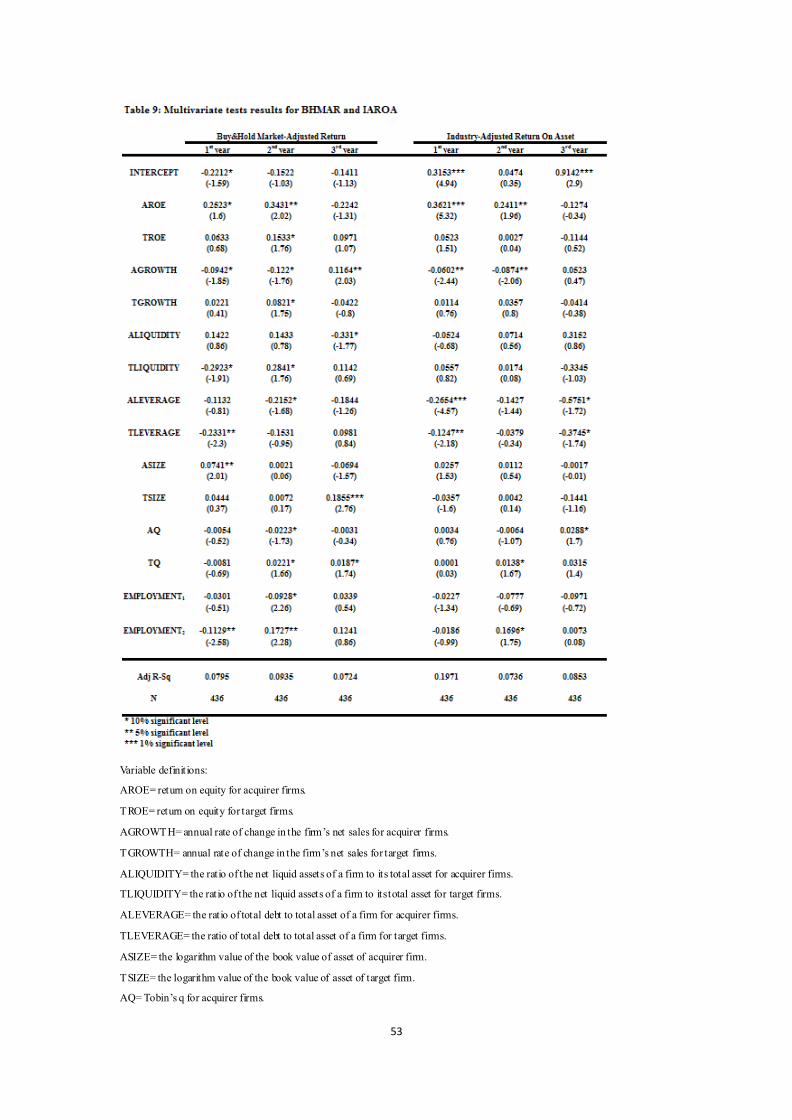
53
Variable definitions:
AROE= return on equity for acquirer firms.
TROE= return on equity for target firms.
AGROWTH= annual rate of change in the firm‘s net sales for acquirer firms.
TGROWTH= annual rate of change in the firm‘s net sales for target firms.
ALIQUIDITY= the ratio of the net liquid assets of a firm to its total asset for acquirer firms.
TLIQUIDITY= the ratio of the net liquid assets of a firm to its total asset for target firms.
ALEVERAGE= the ratio of total debt to total asset of a firm for acquirer firms.
TLEVERAGE= the ratio of total debt to total asset of a firm for target firms.
ASIZE= the logarithm value of the book value of asset of acquirer firm.
TSIZE= the logarithm value of the book value of asset of target firm.
AQ= Tobin‘s q for acquirer firms.

54
TQ= Tobin‘s q for target firms.
EMPLOYMENT1= dummy variable which equals to one if a target CEO continually employed in the acquirer firm after the
acquisition for only one year or less, and zero otherwise.
EMPLOYMENT2= dummy variable which equals to one if a target CEO continually employed in the acquirer firm after the
acquisition for at least two years, and zero otherwise.
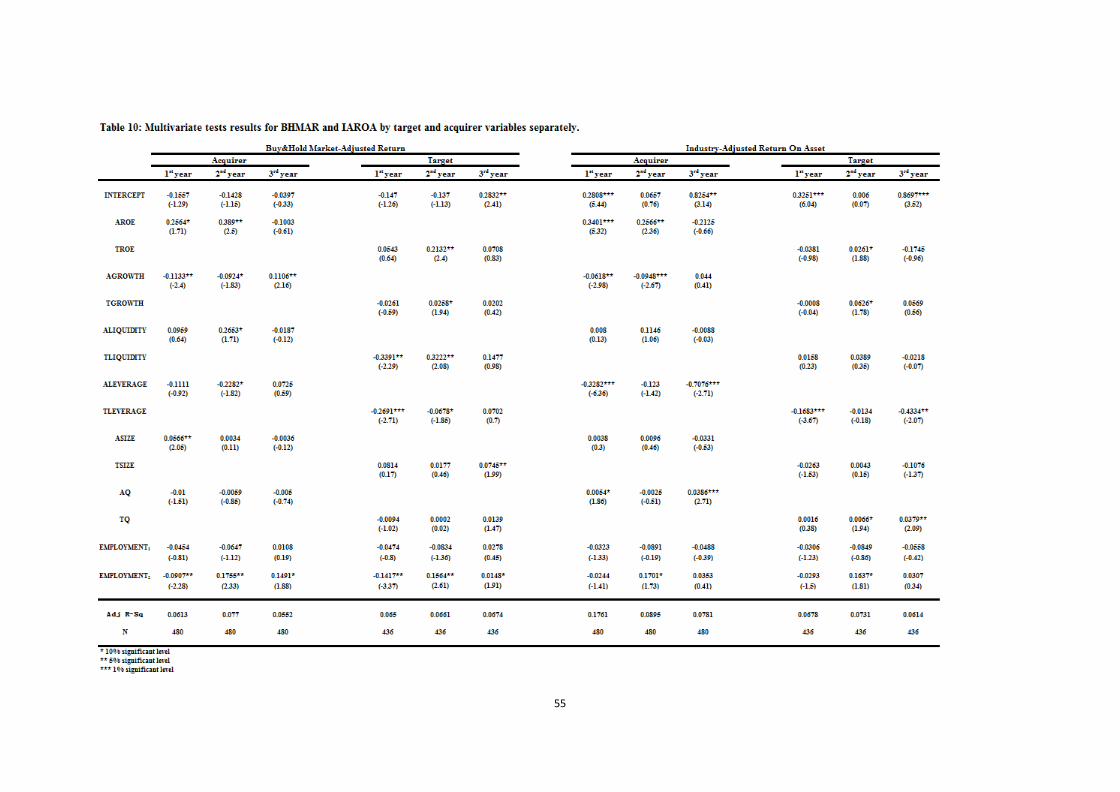
55

56
Variable definitions:
AROE= return on equity for acquirer firms.
TROE= return on equity for target firms.
AGROWTH= annual rate of change in the firm‘s net sales for acquirer firms.
TGROWTH= annual rate of change in the firm‘s net sales for target firms.
ALIQUIDITY= the ratio of the net liquid assets of a firm to its total asset for acquirer firms.
TLIQUIDITY= the ratio of the net liquid assets of a firm to its total asset for target firms.
ALEVERAGE= the ratio of total debt to total asset of a firm for acquirer firms.
TLEVERAGE= the ratio of total debt to total asset of a firm for target firms.
ASIZE= the logarithm value of the book value of asset of acquirer firm.
TSIZE= the logarithm value of the book value of asset of target firm.
AQ= Tobin‘s q for acquirer firms.
TQ= Tobin‘s q for target firms.
EMPLOYMENT1= dummy variable which equals one if a target CEO continually employed in the acquirer firm after the acquisition for only one year or less, and zero otherwise.
EMPLOYMENT2= dummy variable which equals one if a target CEO continually employed in the acquirer firm after the acquisition for at least two years, and zero otherwise.

57
Variable definitions:
BHMARmean= average of the BHMAR.
NBHMAR= number of observations used for calculating BHMARmean.
IAROAmean= average of the IAROA.
NIAROA= number of observations used for calculating IAROAmean.
a 0 year= it is the year in which the acquisition is effective.
0 year BHMAR is calculated as following:
1 1
, ,12 12
(1 ) (1 )iT t i t mt t
BHMAR r r
where
itBHMAR =buy & hold market-adjusted return for acquirer firm i in event year T (T=0)

58
,t ir =stock return for acquirer firm i in event month t .
,t mr =market return in event month t .
0 year IAROA is calculated as following:
0it it ItIAROA ROA AROA t
where
itIAROA =industry abnormal return on asset for acquirer firm i in year 0.
itROA = return on asset for acquirer firm i in year 0.
ItAROA =average return on asset for industry I in year 0.
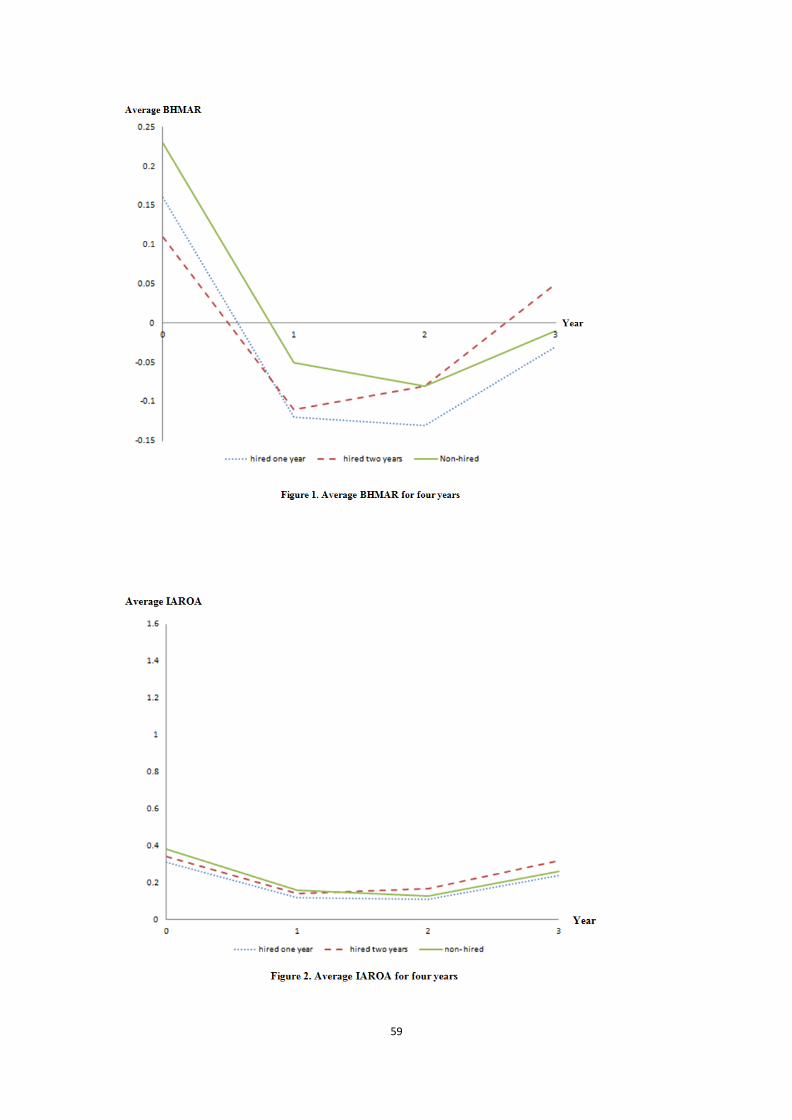
59

60
Employment model variables descriptions
CEO Employment (EMPLOYMENT): This dummy variable measures the continued
employment of the target CEOs in the acquirer firms. It equals one if a target CEO is
employed in the merged firm after the acquisition, and zero otherwise.
CEO-dominance (CEOD): The measure of CEO-dominance is the ratio of target firm‘
s CEO salary and bonus in the year preceding the merger to the average salary and
bonus of other executives listed in the executive compensation section of the
Definitive Proxy Statement (DEF 14A). CEOD is calculated one year before the deal
for target CEOs.
CEO& Chairman (BOSS): The boss variable controls for CEO/Chairman of the board
duality. This dummy variable equals one if a target firm‘s CEO is also a Chairman of
its board in the year preceding the merger, and zero otherwise.
Tenure (TENURE): Tenure is defined as the number of years the target CEOs worked
in the target firms before the effective date of the deal.
Insider Beneficial Ownership (INSOWN): Insider ownership is defined as the
percentage of common shares of the target firm that the target CEO owned one year
before the effective date of the deal.
61
Tobin‘s q (Q): According to Chevalier (2004), Tobin‘s q is measured by the market
value of assets divided by the book value of assets. The market value of asset equals
the market value of common equity plus the book value of assets less the book value
of common equity. The market value of common equity is computed as the closing
price per share times the number of shares outstanding of a firm. The data is from
COMPUSTAT and the ratio is computed one year before the effective of the deal for
both targets (TQ) and acquirers (AQ), respectively.
Q ratio (QR): Q ratio is a ratio of target Tobin‘s q to the acquirer Tobin‘s q. This
variable measures the relative difference of the target q and acquirer q.
Firm size (SIZE): Size is defined as the logarithm value of the book value of asset of a
firm. The size variable is measured as of one year before the effective of the deal for
both targets (TSIZE) and acquirers (ASIZE), respectively.
Size ratio (SIZER): Size ratio is a ratio of target firm size to the acquirer firm size.
This variable measures the relative difference of the target firm and acquirer firm size.
Education (EDU): Dummy variable education is a measure of target CEO‘s education
background, and equals one if a CEO has an MBA degree, and zero otherwise.
Standard Industrial Classification (SIC): Dummy variable SIC measures the
62
difference between the target firm industry and acquirer firm industry. It equals to one
if the target firm and acquirer firm are from the same industry (the same 4 digit SIC
code), and zero otherwise.
CEO Age (AGE): CEO age is the age of a target CEO one year before the effective
date of the acquisition.
Offer price premium as percentage of the stock price 4 weeks before the deal
announcement (PREMIUM): We use this variable to measure the benefit that the
target CEOs obtain for their shareholders when negotiating with the acquirer firms.
Payment Method (PAYMENT): Dummy variable PAYMENT measures the percentage
of different payment methods (stock payment, cash payment, and other payments)
that the acquirer firms used to target firms. It equals one if the percentage of stock
payment is the largest, and zero otherwise.
Stock Payment (PAYMENT_STOCK): Dummy variable PAYMENT_STOCK equals
one if the payment is 100% stock, and zero otherwise.
Cash Payment (PAYMENT_CASH): Dummy variable PAYMENT_CASH equals one
if the payment is 100% cash, and zero otherwise.

63
Performance model variable descriptions
Return on equity (ROE): Return on equity is defined as the ratio of net income to the
shareholder‘s equity of a firm. ROE is a measure of a firm‘s profitability and it
demonstrates the level of profit a company generates with the mo ney invested by its
shareholders. We use variable ROE as a measure of management efficiency. The data
is from COMPUSTAT and the ratio is computed one year before the effective date of
the deal for both target firms (TROE) and acquirer firms (AROE), respect ively.
Growth (GROWTH): Growth of a firm is defined as the annual rate of change in the
firm‘s net sales. The net sale data is from COMPUSTAT and is computed one year
before the effective date of the deal for both targets (TGROWTH) and acquirers
(AGROWTH), respectively. (For example, consider an acquisition effected in the year
2000. The sales data of the year 1999 and 1998 are used to compute the rate of sales
change for the year 1999). The unit of measurement of the sales growth variable is
percent per year.
Liquidity (LIQUIDITY): Liquidity is defined as the ratio of the net liquid assets of a
firm to its total asset. The net liquid assets are computed as the cash plus the
marketable securities less the current liabilities. The data is from COMPUSTAT and
the ratio is computed one year before the effective date of the deal for both targets
(TLIQUIDITY) and acquirers (ALIQUIDITY), respectively.
64
Leverage (LEVERAGE): Leverage is defined as the ratio of total debt to total assets
of a firm. The total debt is computed as the total assets less the share holder‘s equity
of a firm. The data is from COMPUSTAT and the ratio is computed one year before
the effective date of the deal for both targets (TLEVERAGE) and acquirers
(ALEVERAGE), respectively.
CEO Employment1 (EMPLOYMENT1): This dummy variable measures the
continued employment of the target CEO in the merged firm. It equals one if a target
CEO is employed in the acquirer firm after the acquisition for only one year or less,
and zero otherwise.
CEO Employment2 (EMPLOYMENT2): This dummy variable measures the
continued employment of the target CEO in the merged firm. It equals one if a target
CEO is employed in the acquirer firm after the acquisition for at least two years, and
zero otherwise.

65
REFERENCES
Allen, M . P., Panian, S. K . and Lotz, R. E. (1979). 'Managerial succession and organizational
performance: A recalcitrant problem revisited'. Administrative Science Quarterly, 24, pp. 167-80.
Agrawal, A. and J. F. Jaffe. (2003). 'Do takeover targets underperform? Evidence from operating and
stock returns '. Journal of Financial and Quantitative Analysis, 38, pp. 721-746.
Asquith, P. (1983). 'Merger bids, uncertainty, and stockholder returns', Journal of Financial Economics,
11, pp. 51-83.
Bart ley, J. and C. Boardman. (1986). 'The rep lacement-cost adjusted valuation ratio as a discriminator
among takeover target firms', Journal of Economics and Business, 38, pp. 41-55.
Barney, J. B. (1988). 'Returns to bidding firms in mergers and acquisitions: Reconsidering the
relatedness hypothesis'. Strategic Management Journal, 9, pp. 71-78.
Buchholz, A.K. and B.A. Ribbens. (1994). 'Ro le of ch ief executive officers in takeover resistance:
Effects of CEO incentives and individual characteristics '. Academy of Management Journal, 37, pp.
554-579.
Castanias, R. P. and C. C. Helfat (1991). 'Managerial resources and rents'. Journal of Management, 17,
pp. 155-171.
Chemmanur, T. J., Paeglis, I., Simonyan, K (2007). ‗Management Quality, anti-takeover provisions,
and performance in IPOs‘. To appear in Journal of Law and Economics.
Coughlan, A. T., and R. M. Schmidt.(1985). 'Executive compensation, managerial turnover, and firm
performance: An empirical investigation', Journal of Accounting and Economics, 7, pp. 43-66.
Donald, D.B. (2001). 'Executive retention and acquisition outcomes: A test of opposing viewa on the
influence of organizat ional tenure'. Journal of Management, Vol. 27, pp. 603-322.
Fama, E. F. (1980). 'Agency problems and the theory of the firm'. Journal of Political Economy, 88, pp.
288-307.
Fama, E. F. and M. C. Jensen (1983). 'The separation of ownership and control', Journal of Law and
Economics, 26, pp. 301-325
Ghosh, A. and Ruland, W (1998). 'Managerial Ownership, the method of payment for acquisitions, and
executive job retention'. Journal of Finance, Vol.53, 2, pp.785-798.

66
Grusky, O. (1969). 'Managerial succession and organizational effect iveness'. In Amitai Etzioni (ed.), A
Sociological Reader in Complex Organizations, (2nd ed). Holt Rinehart & Winston, New York, pp.
398-410.
Hasbrouck, J.(1985) 'The characteristics of takeover targets and other measures', Journal of Banking
and Finance, 9, pp. 351-362.
Hambrick, D.C. and Cannella, A. A (1993). 'Relative standing: a framework for understanding
departures of acquired executives '. Academy of Management Journal, Vol, 36, 4, pp. 733-762.
Hartzell, J.C. and Ofek, E and Yermack, D (2004). 'What‘s in it for me? CEOs whose firms are
acquired '. Review o f Financial Studies, Vol. 17, 1, pp. 37-61.
Helmich, D. L. and W. B. Brown (1972). 'Successor type and organizational change in the corporate
enterprise'. Administrative Science Quarterly, 17, pp. 371-381.
James, D . R. and Soref, M. (1981). 'Profit constraints on managerial autonomy: Managerial theory and
the unmaking of the corporate president'. American Sociological Review, 46, pp.1-18.
Jemison, D. B. and S. B. Sitkin (1986). 'Corporate acquisitions: A process perspective'. Academy of
Management Review, 11, pp. 5—50.
Jensen, M. C. and W H. Meckling (1976). 'Theory of the firm: Managerial behavior, agency costs, and
ownership structure'. Journal of Financial Economics, 3, pp. 305-360.
Jensen, M. C. (1988). 'The takeover controversy: Analysis and evidence'. In J. C. Coffee, Jr., L.
Lowenstein and S. Rose-Ackerman (eds.). Knights, Raiders, and Targets. Oxford University Press,
New York, pp. 314-354.
Kennedy V.A. and Limmack R.J. (1996). 'Takeover activ ity, CEO turnover, and the market for
corporate control'. Journal of Business Finance & Accounting, Vol 23, 2, pp. 267-285.
Kelly, J. N. (1980). 'Managerial transition for newly appointed CEOs'. Sloan Management Review, Fall,
pp. 37-45.
Kesner I.F. and Dalton D.R. (1994). 'Top management turnover and CEO succession: an investigation
of the effects of turnover on performance'. Journal of Management Studies, Vol 31, 5, pp. 701-713.
Kitching, J. (1967). 'Why do mergers miscarry?'. Harvard Business Review, 45(6), pp. 84-101.
Krug, J. A. (2003). 'Executive Turnover in Acquired Firms: An Analysis of Resource-Based Theory
and the Upper Echelons Perspective'. Journal of Management and Governance, 7, pp.117–143.
Krug, J. A. and Nigh, D. (1998). 'Top management departures in cross -border acquisitions: Governance

67
issues in an international context'. Advances in Mergers and Acquisitions, 4, pp. 121-149.
Krug, J. A. and Nigh, D. (2001). 'Executive perceptions in foreign and domestic acquisitions: an
analysis of foreign ownership and its effect on executive fate'. Journal of World Business, Vol. 36, 1,
pp. 85-105.
Krug, J. A. and Aguilera, R. V. (2004). 'Top management team turnover in mergers & acquisitions '.
Journal of International Management, 4, pp. 267-287.
Loughran, T. and Ritter, J.(1996), 'Long-term market overreaction: the effect of low-priced stocks' ,
Journal of Finance, Vol. 51, 5, pp. 1959–1970.
Manne, H. G. (1965). 'Mergers and the market for corporate control'. Journal of Political Economy, 73,
pp. 110-120.
Marosi, A. and Massoud, N.(2008), '―You Can Enter but You Cannot Leave…‖: U.S. Securities
Markets and Foreign Firms' , Journal of Finance, Vol. 63, 5, pp. 2477–2506.
Palepu, K.J. (1986). ‗Pred icting takeover targets: A methodological and empirical analysis‘. Journal of
Accounting and Economics, Vol. 8, 1, pp. 3-35.
Pfeffer, J. and A. Davis-Blake (1986). 'Admin istrative succession and organizational performance:
How administrator experience mediates the succession effect'. Academy o f Management Journal, 29,
pp. 72-83.
Porter, M. E. (1987). 'From competit ive advantage to corporate strategy'. Harvard Business Review,
65(3), pp. 43-57.
Rumelt, R. P. (1974). ‗Strategy, Structure, and Economic Performance‘. Harvard University Graduate
School of Business, Boston, MA.
Salancik, G. R. and Pfeffer, J. (1980). 'Effects of ownership and performance and executive tenure in U.
S. corporations'. Academy of Management Joumal, 23, pp. 653-664.
Smith, J., K. Carson, and R. Alexander (1984). 'Leadership: It can make a d ifference'. Academy of
Management Journal, 27, pp. 765-776.
Virany, B., M. L. Tushman and E. Romanelli,(1992). 'Executive succession and organization outcomes
in turbulent environments: An organizational learn ing approach'. Organization Science, 3, pp. 72-91.
Walsh, J. P. and J. W. Ellwood (1991). 'Mergers, acquisitions, and the pruning of managerial
deadwood'. Strategic Management Journal, 12, pp. 201-218.
Walsh, J. P. (1988). 'Top management turnover following mergers and acquisitions'. Strategic
68
Management Journal, 9, pp. 173-183.
Walsh, J. P. (1989). 'Doing a deal: Merger and acquisition negotiations and their impact upon target
company top management turnover'. Strategic Management Journal, 10, pp. 307-322.
Warner, J. B., R. L. Watts, and K. H. Wruck.(1988). 'Stock prices and top management changes',
Journal of Financial Economics, 20, pp. 461-492.
Weisbach, M. S.(1988). 'Outside directors and CEO turnover', Journal of Financial Economics, 20, pp.
431-460.
Weisbach, M. S.(1995). 'CEO turnover and the firm‘s investment decisions ', Journal of Financial
Economics, 37, pp. 159-188.